Embed Size (px)
Citation preview

Curriculum and Assessment Policy Statement (CAPS) – Mathematics: Senior Phase 1
CURRICULUM AND ASSESSMENT POLICY
STATEMENT
(CAPS)
MATHEMATICS: SENIOR PHASE
FINAL DRAFT

Curriculum and Assessment Policy Statement (CAPS) – Mathematics: Senior Phase 2
TABLE OF CONTENTS
Chapter 1 1.1. Background
1.2. Overview
1.3. General aims of the South African Curriculum
1.4. Time Allocation
Chapter 2 2.1. What is Mathematics?
2.2. Specific Aims
2.3. Overview of topics
2.3.1. What content knowledge will be learnt by a Senior Phase Mathematics
learner?
2.3.2. Weighting of content area and topics
2.3.3. Overview of content topics to show progression
Chapter 3 Introduction Grade 7 Term 1 Grade 7 Term 2 Grade 7 Term 3 Grade 7 Term 4 Grade 8 Term 1 Grade 8 Term 2 Grade 8 Term 3 Grade 8 Term 4 Grade 9 Term 1 Grade 9 Term 2 Grade 9 Term 3
Grade 9 Term 4
Chapter 4 4.1 Forms and Guidelines of Assessment 4.2 Annual Assessment Plan 4.3 Mathematics Skills 4.4 Cognitive Levels
Curriculum and Assessment Policy Statement (CAPS) – Mathematics: Senior Phase 3
1.1. Background
The National Curriculum Statement Grades R – 12 (NCS) stipulates policy on curriculum and assessment in the schooling sector. To improve its implementation, the National Curriculum Statement was amended, with the amendments coming into effect in January 2011. A single comprehensive Curriculum and Assessment Policy document was developed for each subject to replace the old Subject Statements, Learning Programme Guidelines and Subject Assessment Guidelines in Grades R - 12. The amended National Curriculum Statement Grades R - 12: Curriculum and Assessment Policy (January 2011) replaces the National Curriculum Statement Grades R - 9 (2002) and the National Curriculum Statement Grades 10 - 12 (2004).
1.2. Overview
1.2.1. The National Curriculum Statement Grades R – 12 (January 2011) represents a
policy statement for learning and teaching in South African schools and comprises
the following:
(a) Curriculum and Assessment Policy documents for each approved school
subject as listed in the policy document National Senior Certificate: A
qualification at Level 4 on the National Qualifications Framework (NQF); and
(b) The policy document National Senior Certificate: A qualification at Level 4 on
the National Qualifications Framework (NQF).
1.2.2. The National Curriculum Statement Grades R – 12 (January 2011) should be read
in conjunction with the following documents:
(a) An addendum to the policy document, the National Senior Certificate: A
qualification at Level 4 on the National Qualifications Framework (NQF),
Chapter 1:
CURRICULUM AND ASSESSMENT POLICY STATEMENT (CAPS)
MATHEMATICS - SENIOR PHASE
(BACKGROUND)

Curriculum and Assessment Policy Statement (CAPS) – Mathematics: Senior Phase 4
regarding the National Protocol for Assessment Grade R – 12, published in the
Government Gazette, No. 29467 of 11 December 2006; and
(b) An addendum to the policy document, the National Senior Certificate: A
qualification at Level 4 on the National Qualifications Framework (NQF),
regarding learners with special needs, published in the Government Gazette,
No.29466 of 11 December 2006.
1.2.3. The Subject Statements, Learning Programme Guidelines and Subject Assessment
Guidelines for Grades R - 9 and Grades 10 - 12 are repealed and replaced by the
Curriculum and Assessment Policy documents for Grades R – 12 (January 2011).
1.2.4. The sections on the Curriculum and Assessment Policy as contemplated in
Chapters 2, 3 and 4 of this document constitute the norms and standards of the
National Curriculum Statement Grades R – 12 and therefore, in terms of section 6A
of the South African Schools Act, 1996 (Act No. 84 of 1996,) form the basis for the
Minister of Basic Education to determine minimum outcomes and standards, as well
as the processes and procedures for the assessment of learner achievement to be
applicable to public and independent schools.
1.3. General aims of the South African Curriculum
1.3.1. The National Curriculum Statement Grades R - 12 gives expression to what is
regarded to be knowledge, skills and values worth learning. It will ensure that
learners acquire and apply knowledge and skills in ways that are meaningful to their
own lives. In this regard, the curriculum promotes the idea of grounding knowledge
in local contexts, while being sensitive to global imperatives.
1.3.2. The National Curriculum Statement Grades R - 12 serves the purposes of:
(a) equipping learners, irrespective of their socio-economic background, race,
gender, physical ability or intellectual ability, with the knowledge, skills and
values necessary for self-fulfilment, and meaningful participation in society as
citizens of a free country;
(b) providing access to higher education;
(c) facilitating the transition of learners from education institutions to the workplace;
and
(d) providing employers with a sufficient profile of a learner’s competences.
1.3.3. The National Curriculum Statement Grades R - 12 is based on the following
principles:
(a) Social transformation; ensuring that the educational imbalances of the past
are redressed, and that equal educational opportunities are provided for all
sections of our population;

Curriculum and Assessment Policy Statement (CAPS) – Mathematics: Senior Phase 5
(b) Active and critical learning; encouraging an active and critical approach to
learning, rather than rote and uncritical learning of given truths;
(c) High knowledge and high skills; the minimum standards of knowledge and
skills to be achieved at each grade are specified and sets high, achievable
standards in all subjects;
(d) Progression; content and context of each grade shows progression from
simple to complex;
(e) Human rights, inclusivity, environmental and social justice; infusing the
principles and practices of social and environmental justice and human rights as
defined in the Constitution of the Republic of South Africa. The National
Curriculum Statement Grades 10 – 12 (General) is sensitive to issues of
diversity such as poverty, inequality, race, gender, language, age, disability and
other factors;
(f) Valuing indigenous knowledge systems; acknowledging the rich history and
heritage of this country as important contributors to nurturing the values
contained in the Constitution; and
(g) Credibility, quality and efficiency; providing an education that is comparable
in quality, breadth and depth to those of other countries.
1.3.4. The National Curriculum Statement Grades R - 12 aims to produce learners that are
able to:
(a) identify and solve problems and make decisions using critical and creative
thinking;
(b) work effectively as individuals and with others as members of a team;
(c) organize and manage themselves and their activities responsibly and
effectively;
(d) collect, analyze, organize and critically evaluate information;
(e) communicate effectively using visual, symbolic and/or language skills in various
modes;
(f) use science and technology effectively and critically showing responsibility
towards the environment and the health of others; and
(g) demonstrate an understanding of the world as a set of related systems by
recognizing that problem solving contexts do not exist in isolation.
1.3.5. Inclusivity should become a central part of the organization, planning and teaching
at each school. This can only happen if all teachers have a sound understanding of
how to recognize and address barriers to learning, and how to plan for diversity.

Curriculum and Assessment Policy Statement (CAPS) – Mathematics: Senior Phase 6
1.4. Time Allocation
1.4.1. Foundation Phase
(a) The instructional time for subjects in the Foundation Phase is as indicated
in the table below:
Subject Time allocation per week (hours)
i. Home Language 6
ii. First Additional Language 4 (5)
iii. Mathematics 7
iv. Life Skills
Beginning Knowledge
Arts and Craft
Physical Education
Health Education
6 1 (2) 2 2 1
(b) Instructional time for Grades R, 1 and 2 is 23 hours. For Grade 3, First
Additional Language is allocated 5 hours and Beginning Knowledge is
allocated 2 hours as indicated by the hours in brackets in the table above.
1.4.2. Intermediate Phase
(a) The table below shows the subjects and instructional times in the
Intermediate Phase.
Subject Time allocation per week (hours)
i. Home Language 6
ii. First Additional Language 5
iii. Mathematics 6
iv. Science and Technology 3.5
v. Social Sciences 3
vi. Life Skills
Creative Arts
Physical Education
Religion Studies
4 1.5 1.5 1

Curriculum and Assessment Policy Statement (CAPS) – Mathematics: Senior Phase 7
1.4.3. Senior Phase
The instructional time in the Senior Phase is as follows:
Subject Time allocation per week (hours)
i. Home Language 5
ii. First Additional Language 4
iii. Mathematics 4.5
iv. Natural Sciences 3
v. Social Sciences 3
vi. Technology 2
vii. Economic Management
Sciences
2
viii. Life Orientation 2
ix. Arts and Culture 2
1.4.4. Grades 10-12
The instructional time in Grades 10-12 is as follows:
Subject Time allocation per week (hours)
i. Home Language
ii. First Additional Language
iii. Mathematics
iv. Life Orientation
v. Three Electives
4.5 4.5 4.5 2 12 (3x4h)
The allocated time per week may be utilized only for the minimum required NCS subjects as specified above, and may not be used for any additional subjects added to the list of minimum subjects. Should a learner wish to offer additional subjects, additional time must be allocated for the offering of these subjects.

Curriculum and Assessment Policy Statement (CAPS) – Mathematics: Senior Phase 8
2.1. What is Mathematics?
Mathematics is a language that makes use of symbols and notations for describing numerical, geometric and graphical relationships. It is a human activity that involves observing, representing and investigating patterns and qualitative relationships in physical and social phenomena and between mathematical objects themselves. It helps to develop mental processes that enhance logical and critical thinking, accuracy and problem solving that will contribute in decision-making.
2.2. Specific Aims
The teaching and learning of Mathematics aims to develop the following in the learner:
a critical awareness of how mathematical relationships are used in social, environmental,
cultural and economic relations;
confidence and competence to deal with any mathematical situation without being hindered
by a fear of Mathematics;
an appreciation for the beauty and elegance of Mathematics;
a spirit of curiosity and a love for Mathematics;
recognition that Mathematics is a creative part of human activity;
deep conceptual understandings in order to make sense of Mathematics; and
acquisition of specific knowledge and skills necessary for:
o the application of Mathematics to physical, social and mathematical problems,
o the study of related subject matter (e.g. other subjects), and
o further study in Mathematics.
2.3. Overview of content topics
2.3.1. What content knowledge will be learnt by a Senior Phase Mathematics learner?
Mathematics in the Senior Phase covers five main content areas. Each content area contributes towards the acquisition of the skills specific skills. The table below shows the general content areas of each topic as well as the specific content for grade 7 to 9. The skills which Senior Phase learners are required to demonstrate are also included in the next table below.
Chapter 2:
CURRICULUM
Chapter 2:
CURRICULUM AND ASSESSMENT POLICY STATEMENT
(CAPS)
MATHEMATICS - SENIOR PHASE
(OVERVIEW)

Curriculum and Assessment Policy Statement (CAPS) – Mathematics: Senior Phase 9
MATHEMATICS CONTENT KNOWLEDGE
Content Area General content focus Senior Phase specific content focus
1. Numbers, Operations and Relationships
Development of number sense that includes:
the meaning of different kinds of numbers;
relationship between different kinds of numbers;
the relative size of different numbers;
representation of numbers in various ways; and
the effect of operating with numbers.
Representation of numbers in a variety of ways and moving flexibly between representations;
Solving a variety of problems, using an increased range of numbers and the ability to perform multiple operations correctly and fluently;
Recognition of irrational numbers such as pi 𝜋 and the square roots of non-perfect squares; and
Use of rational approximations of pi (𝜋), square roots and cube roots.
2. Patterns, Functions and Algebra
Algebra is the language for investigating and communicating most of Mathematics and can be extended to the study of functions and other relationships between variables. A central part of this content area is for the learner to achieve efficient manipulative skills in the use of algebra. It also focuses on the:
description of patterns and relationships through the use of symbolic expressions, graphs and tables; and
identification and analysis of regularities and change in patterns, and relationships that enable learners to make predictions and solve problems.
Investigation of numerical and geometric patterns to establish the relationships between variables; and
Expressing rules governing patterns in algebraic language or symbols.
Analysis of situations in a variety of contexts in order to make sense of them; and
Representation and description of situations in algebraic language, formulae, expressions and graphs.
3. Space and Shape (Geometry)
The study of Space and Shape improves understanding and appreciation of the pattern, precision, achievement and beauty in natural and cultural forms. It focuses on the properties, relationships, orientations, positions and transformations of two-dimensional shapes and three-dimensional objects.
Two-dimensional (2-D) shapes and three-dimensional (3-D) objects are referred to as geometric figures and solids.
In the Senior Phase the learner draws and constructs a wide range of geometric figures and solids using appropriate geometric instruments.
The learner should develop an appreciation for the use of constructions to investigate the properties of geometric figures and solids.
Classification and description of geometric figures and solids should be extended to include similarity and congruence.
4. Measurement
Measurement focuses on the selection and use of appropriate units, instruments and formulae to quantify characteristics of events, shapes, objects and the environment. It relates directly to the learner’s scientific, technological and economic worlds, enabling the learner to:
make sensible estimates; and
be alert to the reasonableness of measurements and results.
In this phase the learner should:
expand knowledge of measurement through investigative activities; and
derive rules for calculating measurements relating to geometric figures and solids.
5. Data handling
Through the study of data handling, the learner develops the skills to collect, organise, display, analyse and interpret this information. The study of chance enables the learner to develop skills and techniques for making informed choices, and coping with randomness and uncertainty.
Posing of questions for investigation.
Gathering, summarising and representing data in order to interpret and make predictions about situations.
Probability of outcomes, includes both single and compound events and their relative frequency in simple experiments.

Curriculum and Assessment Policy Statement (CAPS) – Mathematics: Senior Phase 10
2.3.2. Weighting of content areas
The weighting of mathematics content areas serves two primary purposes: firstly the weighting gives guidance on the amount of time needed to adequately address the content within each content area; secondly the weighting gives guidance on the spread of content in the examination (especially end of the year summative assessment).
WEIGHTING OF CONTENT AREAS
Content Area Grade 7 Grade 8 Grade 9
Number, Operations and Relations
25% 20% 15%
Patterns, Functions and Algebra
25% 30% 30%
Space and Shape (Geometry) 25% 25% 30%
Measurement 10% 10% 10%
Data handling (Statistics) 15% 15% 15%
100% 100% 100%
2.3.3. Overview of content areas and topics to show progression
The primary purpose of the overview of content topics is to show progression in terms of content and skills from grade R to 12. The transition between the phases was considered to minimise the content gaps and ensure smooth content flow (where necessary). In trying to ensure seamlessness in Mathematics content, few changes became unavoidable. This is mainly the case in the grades that start a new phase (excluding grade R) and those that are the exit points in the phase. The following critical aspects should be noted to avoid possible confusion in the contents of the overview: Certain content topics and skills are similar in two or three successive grades. This does NOT always mean that similar content should be taught in the affected grades. In instances where content is similar in two or more successive grades in the Content Overview, progression of content is indicated in the content outline (Chapter 3). The overview (Chapter 2) should therefore be read in conjunction with the content outline (Chapter 3).
Curriculum and Assessment Policy Statement (CAPS) – Mathematics: Senior Phase 11
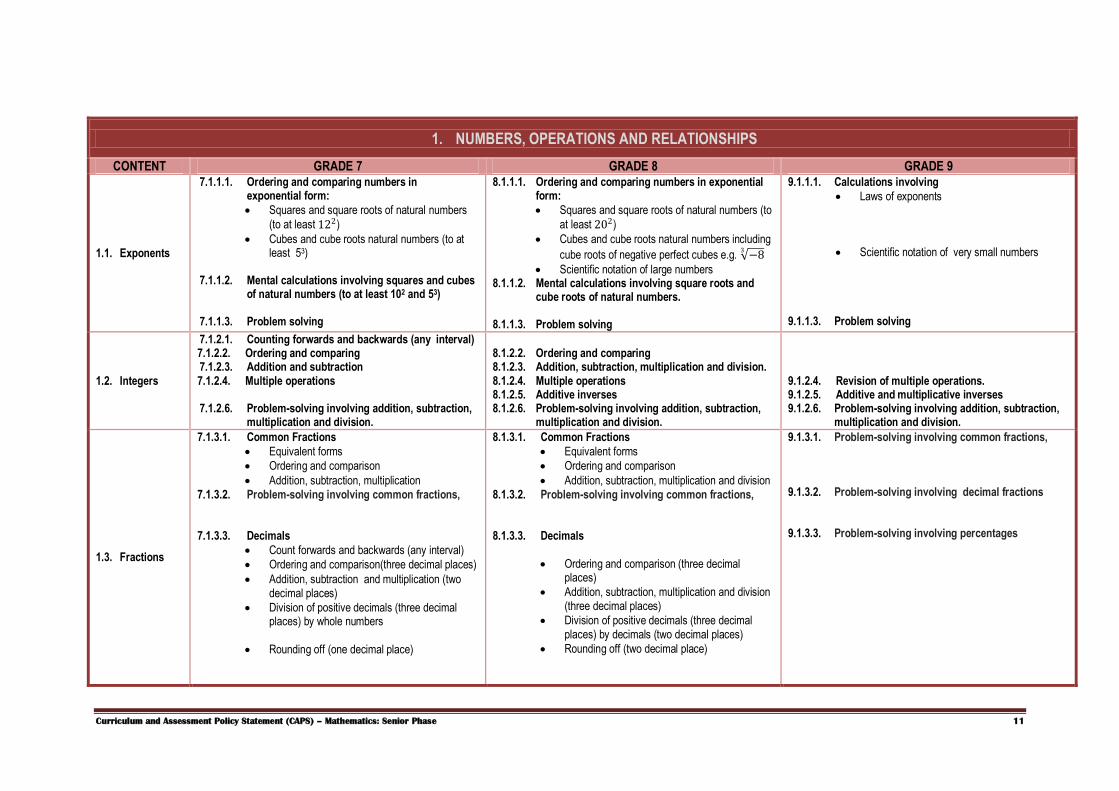
1. NUMBERS, OPERATIONS AND RELATIONSHIPS
CONTENT GRADE 7 GRADE 8 GRADE 9
1.1. Exponents
7.1.1.1. Ordering and comparing numbers in exponential form:
Squares and square roots of natural numbers
(to at least 122)
Cubes and cube roots natural numbers (to at least 53)
7.1.1.2. Mental calculations involving squares and cubes
of natural numbers (to at least 102 and 53)
7.1.1.3. Problem solving
8.1.1.1. Ordering and comparing numbers in exponential form:
Squares and square roots of natural numbers (to
at least 202)
Cubes and cube roots natural numbers including
cube roots of negative perfect cubes e.g. −83
Scientific notation of large numbers 8.1.1.2. Mental calculations involving square roots and
cube roots of natural numbers.
8.1.1.3. Problem solving
9.1.1.1. Calculations involving
Laws of exponents
Scientific notation of very small numbers 9.1.1.3. Problem solving
1.2. Integers
7.1.2.1. Counting forwards and backwards (any interval) 7.1.2.2. Ordering and comparing 7.1.2.3. Addition and subtraction 7.1.2.4. Multiple operations
7.1.2.6. Problem-solving involving addition, subtraction,
multiplication and division.
8.1.2.2. Ordering and comparing 8.1.2.3. Addition, subtraction, multiplication and division. 8.1.2.4. Multiple operations 8.1.2.5. Additive inverses 8.1.2.6. Problem-solving involving addition, subtraction,
multiplication and division.
9.1.2.4. Revision of multiple operations. 9.1.2.5. Additive and multiplicative inverses 9.1.2.6. Problem-solving involving addition, subtraction,
multiplication and division.
1.3. Fractions
7.1.3.1. Common Fractions
Equivalent forms
Ordering and comparison
Addition, subtraction, multiplication 7.1.3.2. Problem-solving involving common fractions,
7.1.3.3. Decimals
Count forwards and backwards (any interval)
Ordering and comparison(three decimal places)
Addition, subtraction and multiplication (two decimal places)
Division of positive decimals (three decimal places) by whole numbers
Rounding off (one decimal place)
8.1.3.1. Common Fractions
Equivalent forms
Ordering and comparison
Addition, subtraction, multiplication and division 8.1.3.2. Problem-solving involving common fractions,
8.1.3.3. Decimals
Ordering and comparison (three decimal places)
Addition, subtraction, multiplication and division (three decimal places)
Division of positive decimals (three decimal places) by decimals (two decimal places)
Rounding off (two decimal place)
9.1.3.1. Problem-solving involving common fractions,
9.1.3.2. Problem-solving involving decimal fractions 9.1.3.3. Problem-solving involving percentages
Curriculum and Assessment Policy Statement (CAPS) – Mathematics: Senior Phase 12
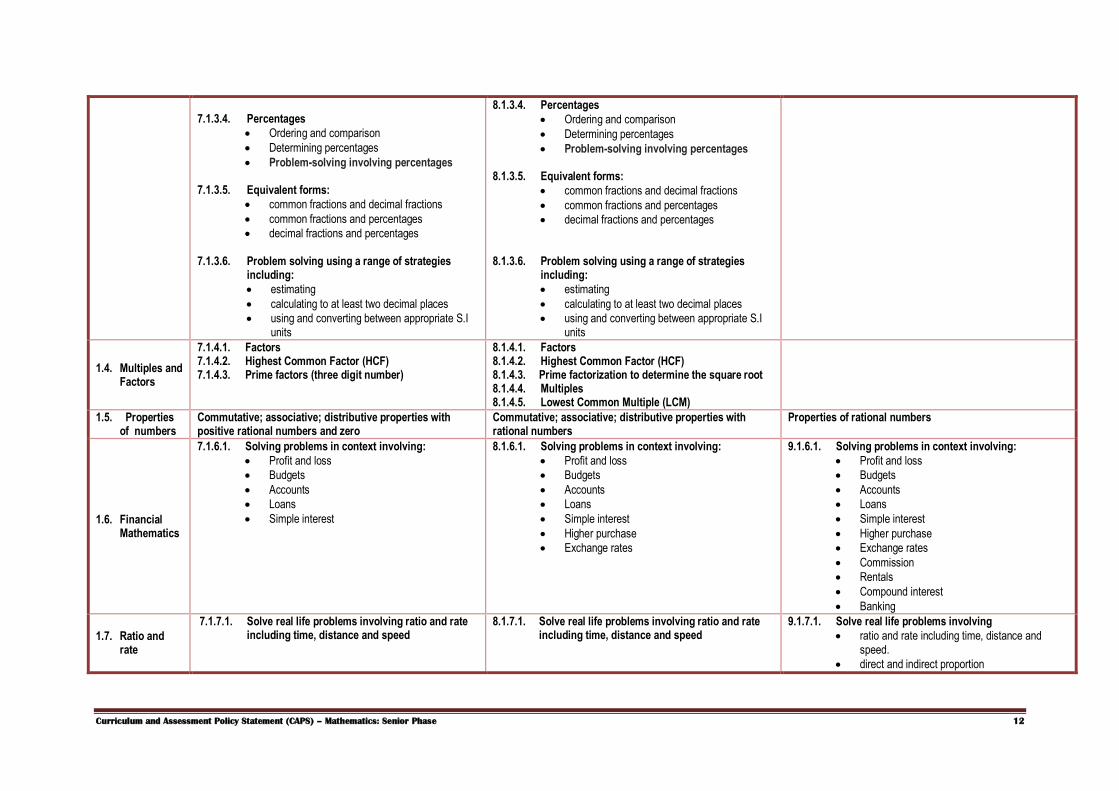
7.1.3.4. Percentages
Ordering and comparison
Determining percentages
Problem-solving involving percentages 7.1.3.5. Equivalent forms:
common fractions and decimal fractions
common fractions and percentages
decimal fractions and percentages 7.1.3.6. Problem solving using a range of strategies
including:
estimating
calculating to at least two decimal places
using and converting between appropriate S.I units
8.1.3.4. Percentages
Ordering and comparison
Determining percentages
Problem-solving involving percentages 8.1.3.5. Equivalent forms:
common fractions and decimal fractions
common fractions and percentages
decimal fractions and percentages 8.1.3.6. Problem solving using a range of strategies
including:
estimating
calculating to at least two decimal places
using and converting between appropriate S.I units
1.4. Multiples and Factors
7.1.4.1. Factors 7.1.4.2. Highest Common Factor (HCF) 7.1.4.3. Prime factors (three digit number)
8.1.4.1. Factors 8.1.4.2. Highest Common Factor (HCF) 8.1.4.3. Prime factorization to determine the square root 8.1.4.4. Multiples 8.1.4.5. Lowest Common Multiple (LCM)
1.5. Properties of numbers
Commutative; associative; distributive properties with positive rational numbers and zero
Commutative; associative; distributive properties with rational numbers
Properties of rational numbers
1.6. Financial Mathematics
7.1.6.1. Solving problems in context involving:
Profit and loss
Budgets
Accounts
Loans
Simple interest
8.1.6.1. Solving problems in context involving:
Profit and loss
Budgets
Accounts
Loans
Simple interest
Higher purchase
Exchange rates
9.1.6.1. Solving problems in context involving:
Profit and loss
Budgets
Accounts
Loans
Simple interest
Higher purchase
Exchange rates
Commission
Rentals
Compound interest
Banking
1.7. Ratio and rate
7.1.7.1. Solve real life problems involving ratio and rate including time, distance and speed
8.1.7.1. Solve real life problems involving ratio and rate including time, distance and speed
9.1.7.1. Solve real life problems involving
ratio and rate including time, distance and speed.
direct and indirect proportion

Curriculum and Assessment Policy Statement (CAPS) – Mathematics: Senior Phase 13
2. PATTERNS, FUNCTIONS AND ALGEBRA
CONTENT GRADE 7 GRADE 8 GRADE 9
2.1. Numeric & Geometric patterns
7.2.1.1. Investigating and extending numeric and geometric patterns looking for relationships or rules including patterns:
represented in physical or diagrammatic form
not limited to sequences involving constant difference or ratio
found in natural and cultural contexts
of learner’s own creation
represented in tables
7.2.1.2. Explaining and justifying observed relationships or rules in learner’s own words
8.2.1.1. Investigation and extension of numeric and geometric patterns looking for relationships or rules including patterns:
represented in physical or diagrammatic form
not limited to sequences involving constant difference or ratio
found in natural and cultural contexts
of learner’s own creation
represented in tables
represented algebraically 8.2.1.2. Explaining and justifying observed relationships
or rules in learner’s own words or in algebra
9.2.1.1. Investigation and extension of numeric and geometric patterns looking for relationships or rules including patterns:
represented in physical or diagrammatic form
not limited to sequences involving constant difference or ratio
found in natural and cultural contexts
of learner’s own creation
represented in tables
represented algebraically 9.2.1.2. Explaining and justifying rules generated
2.2. Input and Output values
7.2.2.1. Determining input and/or output values using:
Verbal description
Flow diagrams
Tables
8.2.2.1. Determining input and/or output values using:
Verbal description
Flow diagrams
Tables
Formulae
Equations
9.2.2.1. Determining input and/or output values using:
Verbal description
Flow diagrams
Tables
Formulae
Equations
2.3. Algebraic Expressions
7.2.3.1. Determining, analyzing and interpreting the equivalence of different descriptions of the same relationship or rule presented:
verbally
in flow diagrams
in tables
by a number sentence
8.2.3.1. Determining, analyzing and interpreting the equivalence of different descriptions of the same relationship or rule presented:
verbally
in flow diagrams
in tables
equations 8.2.3.2. Using commutative, associative and distributive
laws to:
classify terms as like and unlike terms
multiply monomial by a monomial, binomial, by a monomial, trinomial by a monomial
divide monomial by a monomial, binomial, by a monomial, trinomial by a monomial
simplify algebraic expressions given in bracket notation, involving one or two sets of brackets and two kinds of operations.
9.2.3.1. Determining, analyzing and interpreting the equivalence of different descriptions of the same relationship or rule presented:
verbally
in flow diagrams
in tables
equations
by graphs on a Cartesian Plane 9.2.3.2. Determining the product of two binomials using
distributive law and manipulative skills develop in grade 8.

Curriculum and Assessment Policy Statement (CAPS) – Mathematics: Senior Phase 14
9.2.3.3. Simplifying algebraic expressions by:
using laws of exponents
using factorization
9.2.3.4. Factorization:
common factor
difference of two squares
trinomials of the form: 𝑥2 + 𝑏𝑥 + 𝑐 and 𝑎𝑥2 + 𝑏𝑥 + 𝑐 if 𝑎 is a common factor.
2.4. Algebraic quations
7.2.4.1. Solving number sentences by inspection
7.2.4.2. Determining, analyzing and interpreting the equivalence of different descriptions of the same relationship or rule presented by equations
8.2.4.1. Solving equations by:
inspection
algebraic processes (additive and multiplicative inverses)
8.2.4.2. Determining, analyzing and interpreting the equivalence of different descriptions of the same relationship or rule presented by equations
9.2.4.1. Solving equations by:
inspection
algebraic processes (additive and multiplicative inverses; factorization)
9.2.4.2. Determining, analyzing and interpreting the equivalence of different descriptions of the same relationship or rule presented by equations
9.2.4.3. Solving equations by:
using laws of exponents
using factorization
2.5. Graphs
7.2.5.1. Describing a situation by interpreting a graph of a situation
7.2.5.2. Drawing a graph from a description of a situation 7.2.5.3. Use ordered number pairs to draw graphs
8.2.5.1. Describing a situation by interpreting a graph of a situation with special focus on the following trends and features:
Linear or non-linear
Increasing or decreasing
Maximum or minimum
Discreet or continuous 8.2.5.2. Drawing of a graph from description of a situation
with special focus on trends and features listed above.
8.2.5.3. Use ordered number pairs to draw graphs on the Cartesian plane in the 1st quadrant
9.2.5.3. Draw graphs on the Cartesian plane from given
equations. 9.2.5.4. Determine equations from given graphs
Curriculum and Assessment Policy Statement (CAPS) – Mathematics: Senior Phase 15
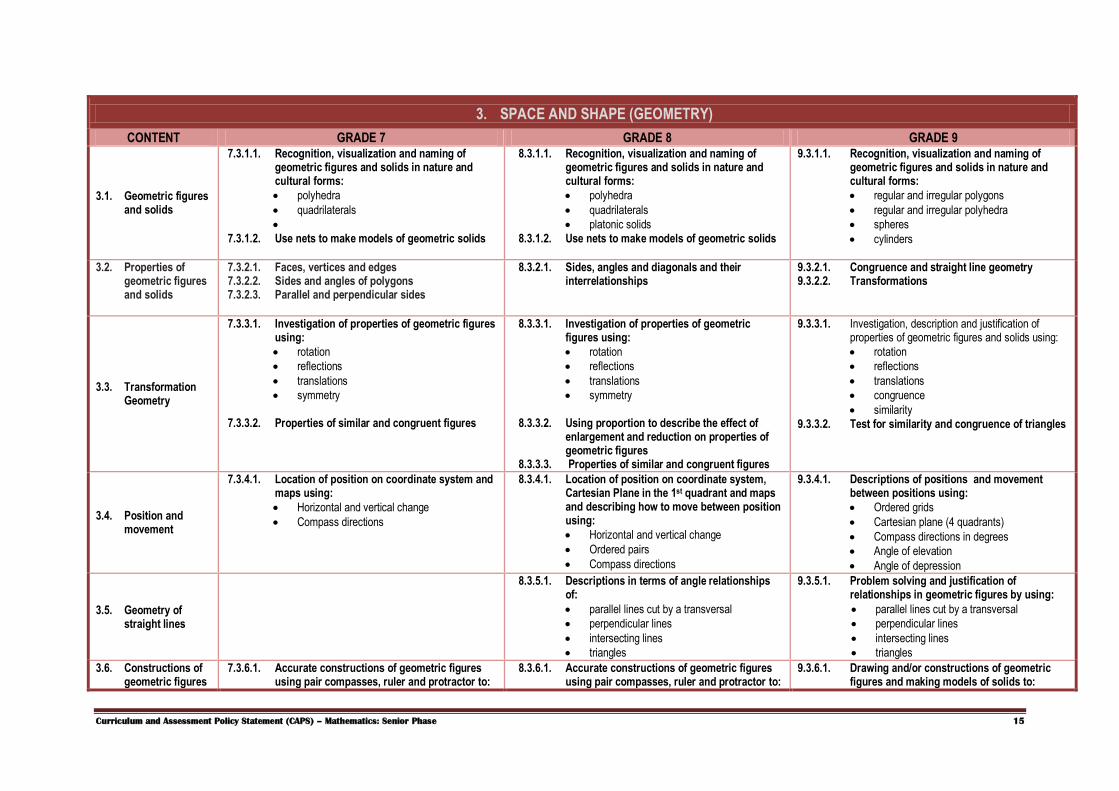
3. SPACE AND SHAPE (GEOMETRY)
CONTENT GRADE 7 GRADE 8 GRADE 9
3.1. Geometric figures and solids
7.3.1.1. Recognition, visualization and naming of geometric figures and solids in nature and cultural forms:
polyhedra
quadrilaterals
7.3.1.2. Use nets to make models of geometric solids
8.3.1.1. Recognition, visualization and naming of geometric figures and solids in nature and cultural forms:
polyhedra
quadrilaterals
platonic solids 8.3.1.2. Use nets to make models of geometric solids
9.3.1.1. Recognition, visualization and naming of geometric figures and solids in nature and cultural forms:
regular and irregular polygons
regular and irregular polyhedra
spheres
cylinders
3.2. Properties of geometric figures and solids
7.3.2.1. Faces, vertices and edges 7.3.2.2. Sides and angles of polygons 7.3.2.3. Parallel and perpendicular sides
8.3.2.1. Sides, angles and diagonals and their interrelationships
9.3.2.1. Congruence and straight line geometry 9.3.2.2. Transformations
3.3. Transformation Geometry
7.3.3.1. Investigation of properties of geometric figures using:
rotation
reflections
translations
symmetry
7.3.3.2. Properties of similar and congruent figures
8.3.3.1. Investigation of properties of geometric figures using:
rotation
reflections
translations
symmetry
8.3.3.2. Using proportion to describe the effect of enlargement and reduction on properties of geometric figures
8.3.3.3. Properties of similar and congruent figures
9.3.3.1. Investigation, description and justification of properties of geometric figures and solids using:
rotation
reflections
translations
congruence
similarity 9.3.3.2. Test for similarity and congruence of triangles
3.4. Position and movement
7.3.4.1. Location of position on coordinate system and maps using:
Horizontal and vertical change
Compass directions
8.3.4.1. Location of position on coordinate system, Cartesian Plane in the 1st quadrant and maps and describing how to move between position using:
Horizontal and vertical change
Ordered pairs
Compass directions
9.3.4.1. Descriptions of positions and movement between positions using:
Ordered grids
Cartesian plane (4 quadrants)
Compass directions in degrees
Angle of elevation
Angle of depression
3.5. Geometry of straight lines
8.3.5.1. Descriptions in terms of angle relationships of:
parallel lines cut by a transversal
perpendicular lines
intersecting lines
triangles
9.3.5.1. Problem solving and justification of relationships in geometric figures by using:
parallel lines cut by a transversal
perpendicular lines
intersecting lines
triangles
3.6. Constructions of geometric figures
7.3.6.1. Accurate constructions of geometric figures using pair compasses, ruler and protractor to:
8.3.6.1. Accurate constructions of geometric figures using pair compasses, ruler and protractor to:
9.3.6.1. Drawing and/or constructions of geometric figures and making models of solids to:

Curriculum and Assessment Policy Statement (CAPS) – Mathematics: Senior Phase 16
investigate properties
design nets
use designed nets to make models
investigate properties
design nets
use designed nets to make models
investigate properties
compare properties
model situations in the environment
9.3.6.2. Position and movement between positions using:
ordered grids
compass directions in degrees
angles of elevation and depression
4. MEASUREMENT
CONTENT GRADE 7 GRADE 8 GRADE 9
4.1. Perimeter, surface area and volume
7.4.1.1. Describing interrelationship between surface area and volume of geometric figures.
7.4.1.2. Conversions between SI units of measurement. 7.4.1.3. Calculations of volume and capacity of cubes,
rectangular and triangular – based prisms
7.4.1.4. Problem solving involving:’
perimeter and area of polygons
volume and capacity of cubes, rectangular and triangular – based prisms
8.4.1.1. Conversions between:
𝑚𝑚2 ↔ 𝑐𝑚2 ↔ 𝑚2 ↔ 𝑘𝑚2
𝑚𝑚3 ↔ 𝑐𝑚3 ↔ 𝑚3
𝑚𝑙(𝑐𝑚3) ↔ 𝑙 ↔ 𝑘𝑙 8.4.1.2. Calculations of volume and surface area of
triangular and rectangular – based prisms and cylinders.
8.4.1.3. Problem solving involving:’
perimeter and area of polygons and circles
volume and surface area of triangular and rectangular – based prisms and cylinders.
9.4.1.1. Calculations by determining the effect on area and volume of multiplying one or more dimensions of 2-D and 3-D figures by a factor k.
4.2. The Theorem of Pythagoras
8.4.2.1. Investigating the relationship between the sides of a right – angled triangle to develop the Theorem of Pythagoras.
8.4.2.2. Using the Theorem of Pythagoras to calculate a missing length in a right – angled triangle leaving irrational answers in surd form.
9.4.2.1. Using the Theorem of Pythagoras to calculate a missing length in known geometric figures and solids.
4.3. Classification of angles
7.4.3.1. Classification of angles:
Acute
Right
Obtuse
Straight
Reflex
revolution

Curriculum and Assessment Policy Statement (CAPS) – Mathematics: Senior Phase 17
5. DATA HANDLING
CONTENT GRADE 7 GRADE 8 GRADE 9
5.1. Collect data
7.5.1.1. Posing questions relating to human rights, social, economic, environmental and political issues in own environment.
7.5.1.2. Selecting appropriate sources for the collection of data (including peers, family, newspapers, books, magazines).
7.5.1.3. Using simple questionnaires (with a variety of
possible responses) and designs and uses questionnaires (with yes/no type responses) in order to collect data (alone and/or as a member of a group or team) to answer questions.
8.5.1.1. Posing questions relating to human rights, social, economic, environmental and political issues in own environment.
8.5.1.2. Selects appropriate sources for the collection of data (including peers, family, newspapers, books, magazines, the Internet).
8.5.1.3. Designing and using questionnaires with a
variety of possible responses in order to collect data (alone and/or as a member of a group or team) to answer questions.
9.5.1.1. Posing questions relating to human rights, social, economic, environmental and political issues in South Africa.
9.5.1.2. Selecting, justifying and using appropriate methods for collecting data (alone and/or as a member of a group or team), which include questionnaires and interviews, experiments, and sources such as books, magazines and the Internet in order to answer questions and thereby draw conclusions and make predictions about the environment.
4.4. Measurement of angles
7.4.5.1. Drawing angles accurate to one degree using protractor for estimation, comparison and measurement.
8.4.5.1. Drawing angles accurate to one degree using protractor for estimation, comparison and measurement
4.5. History of the development of 𝝅
7.4.6.1. Describing and illustration of the historical development of Pi ( ) as an irrational number
in the development of numbers for measurement.
8.4.6.1. Develop the relationship between:
the radius, diameter and circumference of a circle.
radius and area of a circle.

Curriculum and Assessment Policy Statement (CAPS) – Mathematics: Senior Phase 18
5.2. Organize, record and summarize data
7.5.2.1. Distinguishing between samples and populations, and suggesting appropriate samples for investigation (including random samples).
7.5.2.2. Organising (including grouping where appropriate) and records data using
tallies
tables
stem-and-leaf displays. 7.5.2.3. Summarising and distinguishing between
ungrouped numerical data by determining:
mean
median
mode 7.5.2.4. Identification of the largest and smallest scores
in a data set and determining the difference between them in order to determine the spread of the data (range).
8.5.2.1. Performing simple experiments using random number generators, coins, spinners, dice and cards in order to collect data.
8.5.2.2. Organising (including grouping where appropriate) and records data using
tallies
tables
stem-and-leaf displays.
8.5.2.3. Summarising and distinguishing between ungrouped numerical data by determining:
mean
median
mode 8.5.2.4. Determining measures of dispersion,
including range and extremes.
9.5.2.1. Organising numerical data in different ways in order to summarise by determining:
measures of central tendency;
measures of dispersion.
5.3. Display data
7.5.3.1. Drawing a variety of graphs by hand/technology to display and interpret data (grouped and ungrouped) including:
bar graphs and double bar graphs;
histograms with given intervals;
pie charts;
line and broken-line graphs.
8.5.3.1. Drawing a variety of graphs by hand/technology to display and interpret data including:
bar graphs and double bar graphs;
histograms with given and own intervals;
pie charts;
line and broken-line graphs;
scatter plots.
9.5.3.1. Drawing a variety of graphs by hand/technology to display and interpret data including:
bar graphs and double bar graphs;
histograms with given and own intervals;
pie charts;
line and broken-line graphs;
scatter plots.
5.4. Interpret data
7.5.4.1. Critically reading and interpreting data presented in a variety of ways to draw conclusions and make predictions sensitive to the role of:
context (e.g. rural or urban, national or provincial);
categories within the data (e.g. age, gender, race);
scales used in graphs as a source of error and bias;
choice of summary statistics (mean, median or mode);
any other human rights and inclusivity issues.
8.5.4.1. Critically reading and interpreting data presented in a variety of ways in order to draw conclusions and make predictions sensitive to the role of:
context (e.g. rural or urban, national or provincial);
categories within the data (e.g. age, gender, race);
data manipulation (e.g. grouping, scale, choice of summary statistics) for different
purposes;
the role of outliers on data distribution;
any other human rights and inclusivity issues.
8.5.4.1. Critically reading and interpreting data with awareness of sources of error and manipulation to draw conclusions and make predictions about:
social, environmental and political issues (e.g. crime, national expenditure,
conservation, HIV/AIDS);
characteristics of target groups (e.g. age, gender, race, socio-economic groups);
attitudes or opinions of people on issues (e.g. smoking, tourism, sport);
any other human rights and inclusivity issues.
5.5. Probability 7.5.5.1. Performing simple experiments where the 8.5.5.1. Considering a simple situation (with equally 9.5.5.1. Considering situations with equally probable

Curriculum and Assessment Policy Statement (CAPS) – Mathematics: Senior Phase 19
possible outcomes are equally likely and:
lists the possible outcomes based on the conditions of the activity;
determines the frequency of actual outcomes for a series of trials;
determines the relative frequency using the definition of relative frequency
likely outcomes) that can be described using probability and:
lists all the possible outcomes;
determines the probability of each possible outcome using the definition of probability
finds the relative frequency of actual outcomes for a series of trials;
compares relative frequency with probability and explains possible differences;
predicts with reasons the relative frequency of the possible outcomes for a series of trials based on probability.
outcomes, and:
determines probabilities for compound events using two-way tables and tree diagrams;
determines the probabilities for outcomes of events and predicts their relative
frequency in simple experiments;
discusses the differences between the probability of outcomes and their relative frequency.

Curriculum and Assessment Policy Statement (CAPS) – Mathematics: Senior Phase 20
Introduction
Chapter 3 (Content Outline) is aligned to the Chapter 2 (overview) and provides the teacher with
sequenced content topics to be taught in each term.
The examples given in the column “Clarification or Notes” in Chapter 3 are intended to guide the
teacher on the content to be covered. Therefore, these notes do not cover the whole content.
The order of content areas in not rigid but care must be taken not to teach content areas that
involve measurement before the basic operations such as addition, subtraction, multiplication and
division have been mastered at the required level.
Calculators should only be used where indicated from grade 7 upwards.
Chapter 2:
CURRICULUM
Chapter 3:
CURRICULUM AND ASSESSMENT POLICY STATEMENT
(CAPS)
MATHEMATICS - SENIOR PHASE
(CONTENT OUTLINE)

Curriculum and Assessment Policy Statement (CAPS) – Mathematics: Senior Phase 21
TERM 1 – Grade 7
CONTENT AREA CONTENT CLARIFICATION or NOTES DURATION
(in weeks)
Numbers and number
operations
1.5. Properties of Rational
Numbers
Properties of numbers
The commutative property of addition: 𝑎 + 𝑏 = 𝑏 + 𝑎
The commutative property of multiplication: 𝑎 × 𝑏 = 𝑏 × 𝑎
Examples:
a) 33 + 99 = 99 + 33 = 132
b) 55 x 17 = 17 x 55 = 935
The associative (grouping) property of addition: (𝑎 + 𝑏) + 𝑐 = 𝑎 + (𝑏 + 𝑐)
The associative (grouping) property of multiplication: (𝑎 × 𝑏) × 𝑐 = 𝑎 × (𝑏 × 𝑐)
Examples:
a) 51 + (19 + 46) = (51 + 19) + 46 = 116
b) 3 x (4 x 6) = (3 x 4) x 6 = 72
The distributive property of multiplication over addition: 𝑎 𝑏 + 𝑐 = 𝑎 × 𝑏 + 𝑎 × 𝑐
Example: 4(12 + 9) = 4 × 12 + 4 × 9 = 48 + 36 = 84
and conversely : 9 × 64 + 9 × 36 = 9 × (64 + 36) = 9 × 100 = 900
The distributive property of multiplication over subtraction: 𝑎 𝑏 − 𝑐 = 𝑎 × 𝑏 − 𝑎 × 𝑐
Example: 4 (12 – 9) = 4 × 12 – 4 × 9 = 48 – 36 = 12
Note: Learners should be able to use the properties but not necessarily know the names of the properties.
1 week
The properties of 0 and 1
Zero is the identity or neutral element of addition: Any number t + 0 = t
Example: 76 + 0 = 76
One is the identity or neutral element of multiplication: Any number t × 1 = t
Example: 376 × 1 = 376
However, any number t ÷ 0 is undefined
Example: 376 ÷ 0 is undefined.
1.4. Multiples and Factors
Multiples of natural numbers
Revise natural numbers, whole numbers, odd and even numbers, prime numbers and composite numbers.
Note the correct notation:
The multiples of 6 are 6 , 12 , 18 , 24 , ...
or M6 = {6 ; 12 ; 18 ; 24 ; ...}
1 week

Curriculum and Assessment Policy Statement (CAPS) – Mathematics: Senior Phase 22
LCM LCM of 6 and 18 is 18
LCM of 6 and 7 is 42
Factors, prime factors and HCF of
3-digit natural numbers
Revise the rules for dividing by 2 , 3 , 4 , 5 and 10
Determine the factors and prime factors of numbers
Note the correct notation:
The factors of 6 are 1, 2, 3 and 6
or F6 = {1 ; 2 ; 3 ; 6 Examples:
a) Determine the factors of 24 are 1, 2, 3, 4, 6, 12 and 24 by inspection.
b) The prime factors of 24 are 2 and 3 c) The factors of 140 are 1, 2, 5, 7, 10, 14, 28, 35, 70 and 140
because : if 2 and 7 are factors, 14 is a factor i. if 5 and 7 are factors, 35 is a factor ii. if 2 and 14 are factors, 28 is a factor etc.
Determine the HCF of 3-digit numbers. Example: Determine the HCF of 120; 300 and 900 120 = 5 x 3 x 23
300 = 52 x 3 x 22 900 = 52 x 32 x 23
HCF = 5 x 3 x 22 = 60
1.1. Exponents Squares and cubes of whole
numbers
Determine squares of whole numbers to at least 122 and cubes of whole numbers to at least 53
Emphasize that: a) 122 = 12 x 12 and not 12 x 2 b) 13 means 1 x 1 x 1 and not 1 x 3
1 week
Square roots and cube roots of whole numbers
Square roots and cube roots are the converse operations of squaring and cubing. Examples:
a) 4 = 2 because 22 = 4
b) 273
= 3 because 33 = 27
Emphasize that:
a) 16 + 9 = 25 = 5 and not 16 + 9 = 4 + 3 = 7. b) the square of 9 = 81 whereas the square root of 9 = 3.
1 week
Exponential forms of whole numbers
10 x 10 x 10 x 10 x 10 x 10 x 10 is written 107 in exponential form. 107 is read “10 to the power of 7” where 10 is called the base of the power and 7 is called the exponent or index.
1 week

Curriculum and Assessment Policy Statement (CAPS) – Mathematics: Senior Phase 23
Emphasize that any number (except zero) raised to the power of zero is equal to 1, in other words 𝑎0= 1. Examples : a) 90 = 1 and 00 is undefined.
b) 4 x 10⁵ + 3 x 10⁴ + 2 x 10³ + 7 x 100 = 432 007
c) 22 + 23 + 24 = 4 + 8 + 16 = 28 d) (7 − 4)4 = 34 = 81
Calculations using a non-scientific calculator including the brackets
and memory keys.
Revise rounding off numbers to the nearest 5, 10, 100 or 1 000.
Estimate the possible answer before doing a calculation on a calculator. Examples: a) 573 + 883 ≈ 1 500 b) 9,3 × 7 ≈ 63
c) Use a calculator to calculate 37 318
536 + 258
1 week
Space and Shape (Geometry)
3.6. Construction of Geometric figures
Accurately construct geometric figures for investigation of their
properties
Revise measuring angle sizes using a protractor.
Teach learners how to use a set square and a pair of compasses correctly.
Accurately construct line segments, parallel and perpendicular lines, triangles and circles.
Classify triangles according to the properties of their sides and angles.
Construct and investigate the properties of the sides, angles and diagonals of quadrilaterals.
Classify quadrilaterals.
Focus on the similarities and differences between all quadrilaterals including trapeziums and kites.
1 week
3.3. Transformation Geometry
Similar figures and congruent figures
Recognise and describe properties of congruent and similar shapes and the differences between them.
Emphasize that: a) Two or more figures are congruent if they are equal in all respects. b) Two or more figures are similar if they have the same shape but differ in size.
1 week
3.4 Position and Movement
Compass directions
Locate positions on grids and maps using compass directions. Examples: a) Without using a protractor draw a sketch to illustrate the position of point T which is 20o West of South from point P. b) David walks for 4 km in a direction of 50o East of North from his house to John’s house. He then walks to a shop in
the direction 40o West of North. By construction determine how far David is from his house
1 week
1 Task and 2 Tests 1 week

Curriculum and Assessment Policy Statement (CAPS) – Mathematics: Senior Phase 24
TERM 2 – Grade 7
CONTENT AREA CONTENT CLARIFICATION or NOTES DURATION
(in weeks)
Number and number operations
1.3 Fractions Common fractions
Addition and subtraction of common fractions with unrelated
denominators
Revise proper fractions, improper fractions and mixed numbers.
Revise writing fractions in equivalent form
Example: 1
2=
2
4=
5
10=
12
24 etc.
Revise writing fractions in the simplest form. Emphasize that: common fractions with the same denominators can be added or subtracted. Examples:
a) 12
5+
3
5= 2
b) 21
2+ 3
1
5=
5
2+
16
5=
25
10+
32
10=
57
10= 5
7
10
c) 41
4− 2
1
8=
17
4−
17
8=
34
8−
17
8=
17
8= 2
1
8 1 week
Ordering of common fractions
Revise ordering of common fractions and inserting common fractions on a number line Example:
a) 1
3<
2
5<
2
3<
3
4
b) Insert the missing fractions on the number line. Write the missing fractions in simplest form. | | | | | | | | |
0 1
12
1
6
1
3
1
2
Multiplication of common fractions
Do multiplication of common fractions developmentally – not just short-cut cancelling methods. Examples: Simplify
a) 1
4 × 8 = 2
b) 34
× 8 = 3 × 2 = 6
c) 13
4 x 8 =
7
4 x 8 = 7 x 2 = 14
d) 1 1 14 3 12 (illustrate using a diagram)
e) 3
4 x
2
5 (divide 2 and 4 by 2) =
3
2 x
1
5 =
3
10
f) 6
7 x 4
2
3 =
6
7 x
14
3 = 4 because
6
3 = 3 and
14
7 = 2
g) (1
2 +
1
3) x
3
10 =
5
6 x
3
10 =
1
2 x
1
2 =
1
4
1 week

Curriculum and Assessment Policy Statement (CAPS) – Mathematics: Senior Phase 25
h) 1
2 +
1
3 x
3
10 =
1
2 +
1
10 =
5
10 +
1
10 =
6
10 =
3
5
i) 2
3 of
6
7 + 1 =
2
3 x
6
7 + 1 =
4
7 + 1 = 1
4
7
Numbers and number operations
Problem-solving involving common
fraction
Solve problems involving common fractions in context: Examples:
a) Calculate what fraction 51
2 hours is of one day.
b) James spent 2
5of his pocket money. He saved
1
3 of the remainder. What fraction of the original amount was left?
NB: 3
7 of 𝑅42 = 3 × 𝑅6 = 𝑅18
Note: It is incorrect to write that 3
7 = 𝑅18
1 week
Decimal fractions
Revise the place values of the digits in decimal fractions.
Insert decimal fractions on number lines.
Count forwards and backwards in decimal intervals.
Do conversions between common fractions and decimal fractions.
Compare and order decimal fractions to at least three decimal places.
Example: 0,7 < 0,707 < 0,7
Round off numbers to at least 1 decimal place Example:
a) 56,28 ≈ 56,3 correct to 1 decimal places b) 248, 72 ≈ 248,7 correct to 1 decimal places a) 814,35 ≈ 814,4 correct to 1 decimal places
or 814,35 ≈ 814,4 correct to the nearest tenth
1,5 weeks
Addition, subtraction and multiplication of positive decimals
to at least 2 decimal places
Add and subtract and multiplication of positive decimals to at least 2 decimal places. Examples: Calculate a) 2,37 + 4,53 – 3,88 b) 5,276 × 30 c) 0,3 x 0,2 x 100
Decimal fractions
Division of positive decimals with at least 3 decimals places by whole
numbers
Divide positive decimals with at least 3 decimals places by whole numbers Examples: a) Calculate 99,132 ÷ 12 b) Calculate 7,356 ÷ 30 c) If 330,72 ÷ 53 = 6,24 write down the value of:

Curriculum and Assessment Policy Statement (CAPS) – Mathematics: Senior Phase 26
i. 330,72 ÷ 6,24 I. 330,72 ÷ 5,3
II. 6,24 x 5,3
Solve real life problems involving decimals
Measurement 4.2 Perimeter, surface area and volume
Calculation of the
perimeter of polygons
area of squares, rectangles and triangles, using appropriate formulae
Calculate the perimeter of polygons, area of squares, rectangles and triangles, using appropriate formulae Examples: Calculate the: a) Perimeter of a rectangle which is 24 cm long and 18 cm wide. b) Perimeter of a regular octagon if the length of each side is 17 cm. c) Area of ∆ABC if BC = 12 cm and its height AT = 9 cm. d) Perimeter of a square if its area is 225 cm2. Note: The height of a triangle is a line segment drawn from any vertex perpendicular to the opposite side. Example: AD is the height onto base BC of ∆ABC.
Use and convert between appropriate SI units Note: If 1 cm = 10 mm then 1 cm2 = 100 mm2 and if 1 m = 100 cm then 1 m2 = 10 000 cm2
Solve real like problems involving perimeter and area. Examples: a) Calculate the area of the shaded part in the adjacent diagram if ABCD is
a rectangle, AB = 18,6 cm, DC = 2TC and BC = 8 cm. b) The area of the floor of the dining room is 18,4 cm2. How many
square tiles with side 20 cm are needed to tile the floor? c) The length of the side of a square is doubled. Will the area of the
enlarged square be double or four times that of the original square?
1,5 weeks
Volume and capacity of cubes, rectangular prisms and triangular
prisms
Emphasize that:the amount of space inside a prism is called its capacity; and the amount of space occupied by a prism is called its volume.
Calulate the volume of right prisms. The volume of a right prism = the area of the base × the height. Hence: a) The volume of a cube = 𝑙3, the volume of a rectangular prism = 𝑙 × 𝑏 × ℎ;
2 weeks
A B
C D T
A
D B C
A
D B C

Curriculum and Assessment Policy Statement (CAPS) – Mathematics: Senior Phase 27
b) The volume of a triangular prism =𝑏×ℎ
2× height of the right prism
Emphasize that: a) If 1 cm = 10 mm then 1 cm3 = 1 000 mm3; and b) If 1 m = 100 cm then 1m3 = 1 000 000 or 106 cm3. c) An object with a volume of 1cm3 will displace exactly 1 ml of water; and d) An object with a volume of 1m3 will displace exactly 1 kl of water.
Surface area of cubes and rectangular prisms
Problems involving volume, capacity and surface area
Investigate the nets of cubes and rectangular prisms in order to deduce formulae for calculating their surface areas.
Solve problems in everyday-life involving volume, capacity and surface area.
1 Task, 1 Test and 1 Mid-year/ Half-yearly Examination
2 weeks
TERM 3 – Grade 7
CONTENT AREA CONTENT CLARIFICATION or NOTES DURATION
(in weeks)
Patterns, Functions and Algebra
2.1 Numeric and Geometric patterns
Numeric and Geometric patterns and patterns found in natural and cultural forms and patterns of the
learners’ own creation
Investigate and extend numeric and geometric patterns in order to find relationship.
Identify a constant difference or ratio if there is one.
Describe, explain and justify the relationship in own words or by a rule.
Examples: a) The next 2 numbers in the sequence 3 ; 6 ; 9 ; ... are 12 and 15.
The rule is: multiply each number by 3, in other words 3 x n for n a natural number.
b) Dot array patterns (growing patterns):
c) Growing patterns
2 weeks
The sequence is 1 ; 4 ; 9 ; ... (square numbers) or 1; 1 + 3;; 1 + 3 + 5; ...
The sequence is 1; 3; 5; 7; ... (odd numbers) The rule is add 2; or 1; 1 + 2; 2 + 3; 3 + 4; ... or 2 x n – 1 for n a natural number.

Curriculum and Assessment Policy Statement (CAPS) – Mathematics: Senior Phase 28
2.2 Input and output values
Determine input and/or output values using
Verbal descriptions
Flow diagrams
Tables Examples: a) Use the given rule to calculate the values of t for each value of p. b) Describe the relationship between the numbers in the top row and bottom row in the table. Then write down the value of m and n.
x 1 2 3 4 12 n
y 5 6 7 8 m 34
2 weeks
2.3 Algebraic expressions
Number sentences
Solve or complete number sentences by inspection, checking the solution by inspection. Examples: a) 2 × 𝑥 – 8 = 4 means that 𝑥 = 6 b) (t – 7) ÷ 4 = 12 means that t – 7 = 48 and t = 55
1 week
Number and number operations
1.7 Ratio and Rate
Solve problems that involve ratio and rate. Examples:
a) Write each of the given ratios in the simplest form:
(i) 25c : R4,25 (ii) 1 22 3
:
b) If 3 books cost R27, calculate the cost of (i) 9 (ii) 5 of the same books.
c) Share R60 between A and B in the ratio 7 : 8. d) Which is the fastest? 540 km travelled in 5 hours or 672 km travelled in 6 hours. e) A motorist travelled at an average speed of 98 km per hour for 2 hours and then at an average speed of 106 km per
hour for the next 3 hours. How far did he travel altogether in 5 hours? Calculate his average speed for the whole journey.
1 week
Patterns, Functions
and Algebra
2.5 Graphs
Draw graphs using ordered numbered pairs in order to illustrate relationships between numbers or quantities.
Draw graphs representing relationships in real-life context e.g. time/distance relationships.
Describe a situation by interpreting a graph of the situation.
Use scales on plans or maps to determine actual lengths or distances.
1 week
Rule: t = p × 3 + 1
0
3
5
7 9
p t

Curriculum and Assessment Policy Statement (CAPS) – Mathematics: Senior Phase 29
Number and number operations
1.3 Fractions
Percentages
Revise and extend the interrelationship between common fractions, decimal fractions (including recurring decimals) and percentages. Examples
a) 25% = 1
4 = 0,25 , 40% =
2
5= 0,4 and 33
1
3% =
1
3 = 0,3
Do calculations with percentages. Examples:
a) Calculate 60% of R105
Amount = 35
× R105 = R63
b) What percentage is 40c of R3,20?
Percentage = 40 1320 2
100% 12 %
c) Calculate the percentage increase if R60 is increased to R80.
Amount increased = R20. Therefore percentage increase = 20 160 3
100% 33 %
1 week
1.6 Financial Mathematics Solve financial problems in context including profit and loss, discount, VAT, SI, loans, hire purchase and exchange rates.
2 Tests and 1 Task 2 weeks
TERM 4 – Grade 7
CONTENT AREA CONTENT CLARIFICATION or NOTES DURATION
(in weeks)
Numbers and number operations
1.2 Integers
Count forwards and backwards in integers for any interval.
Recognise and compare integers.
Order integers e.g. – 6 < – 5 < 0
Use number lines to add integers.
Subtract, multiply and divide integers.
Solve problems that involve multiple operations with integers. Examples:
Calculate: a) 7 – 4 = – 11 b) 5 x (– 3) = – 15 c) 7 – 12 – 7 = – 12 d) 9 – (– 5) = 9 + 5 = 14 e) 8 ÷ (-2) – 5 × 3 – 3 = - 4 – 15 – 3 = – 22 and not – 4 – 0 = – 4 f) (7 + 6) ÷ (3 – 3) = 13 ÷ 0 which is undefined
1 week
Curriculum and Assessment Policy Statement (CAPS) – Mathematics: Senior Phase 30
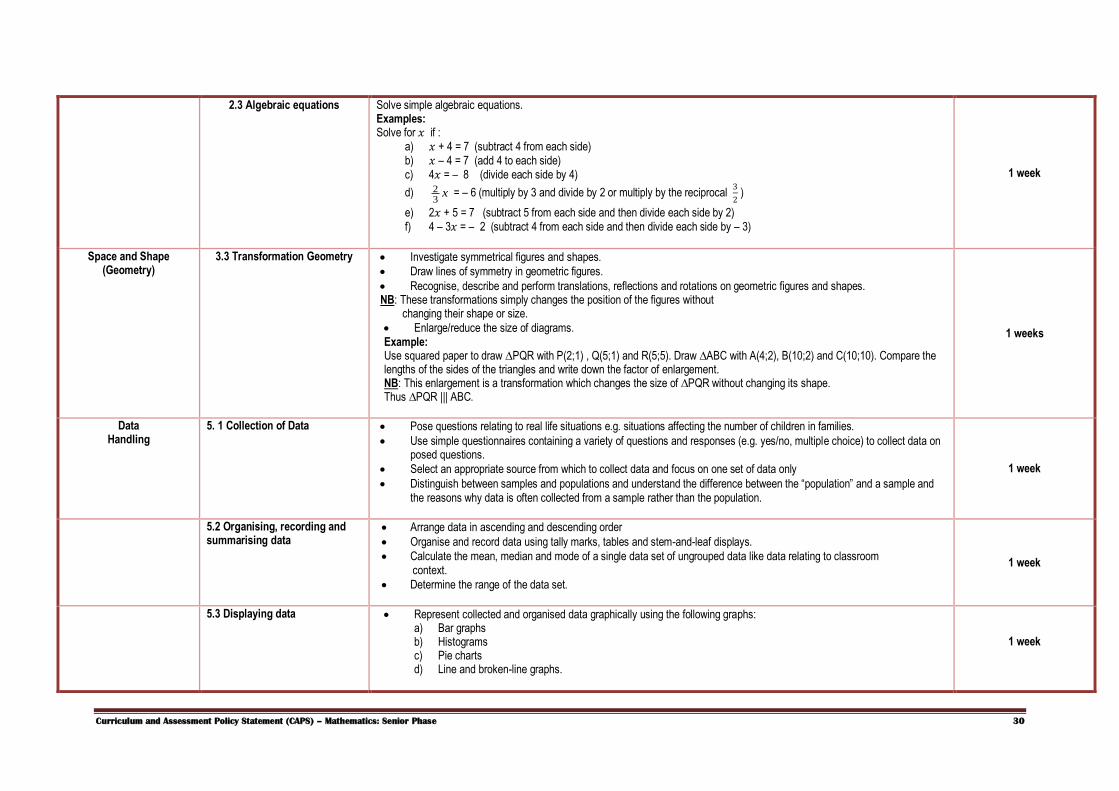
2.3 Algebraic equations Solve simple algebraic equations. Examples: Solve for 𝑥 if :
a) 𝑥 + 4 = 7 (subtract 4 from each side) b) 𝑥 – 4 = 7 (add 4 to each side) c) 4𝑥 = – 8 (divide each side by 4)
d) 23
x = – 6 (multiply by 3 and divide by 2 or multiply by the reciprocal 3
2 )
e) 2𝑥 + 5 = 7 (subtract 5 from each side and then divide each side by 2) f) 4 – 3𝑥 = – 2 (subtract 4 from each side and then divide each side by – 3)
1 week
Space and Shape (Geometry)
3.3 Transformation Geometry Investigate symmetrical figures and shapes.
Draw lines of symmetry in geometric figures.
Recognise, describe and perform translations, reflections and rotations on geometric figures and shapes. NB: These transformations simply changes the position of the figures without changing their shape or size.
Enlarge/reduce the size of diagrams. Example: Use squared paper to draw ∆PQR with P(2;1) , Q(5;1) and R(5;5). Draw ∆ABC with A(4;2), B(10;2) and C(10;10). Compare the lengths of the sides of the triangles and write down the factor of enlargement. NB: This enlargement is a transformation which changes the size of ∆PQR without changing its shape. Thus ∆PQR ||| ABC.
1 weeks
Data Handling
5. 1 Collection of Data
Pose questions relating to real life situations e.g. situations affecting the number of children in families.
Use simple questionnaires containing a variety of questions and responses (e.g. yes/no, multiple choice) to collect data on posed questions.
Select an appropriate source from which to collect data and focus on one set of data only
Distinguish between samples and populations and understand the difference between the “population” and a sample and the reasons why data is often collected from a sample rather than the population.
1 week
5.2 Organising, recording and summarising data
Arrange data in ascending and descending order
Organise and record data using tally marks, tables and stem-and-leaf displays.
Calculate the mean, median and mode of a single data set of ungrouped data like data relating to classroom context.
Determine the range of the data set.
1 week
5.3 Displaying data Represent collected and organised data graphically using the following graphs: a) Bar graphs b) Histograms c) Pie charts d) Line and broken-line graphs.
1 week

Curriculum and Assessment Policy Statement (CAPS) – Mathematics: Senior Phase 31
5.4 Read and interpret graphs Critically read and interpret tables, graphs and measures (mean, median, mode, range) in order to answer questions.
Identify points or values on a graph from values given on the vertical and horizontal axis.
5.5 Probability Perform simple experiments where the possible outcomes are equally likely, and: a) List the possible outcomes based on conditions of the activity b) Determine the frequency of actual outcomes for a series of trials c) Determine the relative frequency using the definition of relative frequency.
1 week
Revision, 1 Test and a Final Examination
3 weeks
TERM 1 – Grade 8
CONTENT AREA CONTENT CLARIFICATION or NOTES DURATION
(in weeks)
NUMBERS, OPERATIONS
AND RELATIONSHIPS
1.5 Properties of numbers
Rational,
Irrational
and
Real numbers
Recognise, classify represent and compare natural numbers, whole numbers, and integers.
Identify and classify rational, irrational and real numbers.
Emphasize that real numbers may be rational or irrational
Examples:
a) 9 = 3 is a real, rational, integer, whole and natural number.
b) 8 is a real, irrational number because 8 is not a square number.
c) −9 is a non-real number.
Examples :
a) Which of the numbers 0. 4 ; 66
; −83
; 13
4 are rational numbers?
b) Are all rational numbers integers?
Revise the properties of 0 and 1 including why any number divided by 0 is undefined.
1 week
1.4 Multiples and factors
Factorisation of natural numbers
Factorise natural numbers by inspection or using the ladder method.
Write natural numbers in exponential form.
Examples:
a) 4 = 2 × 2 = 22
b) 81 = 3 × 3 × 3 × 3 = 34
1 week

Curriculum and Assessment Policy Statement (CAPS) – Mathematics: Senior Phase 32
Calculate the Highest Common Factor (HCF) of two-and three-digit natural numbers by inspection or factorisation
Examples:
a) The HCF of 7 and 11 is 1
b) The HCF of 22 × 3 × 5 and 2 × 3 × 7 is 2 × 3 = 6
Calculate the Lowest Common Multiple (LCM) of two-and three-digit natural numbers by inspection or factorisation
Examples:
a) The LCM of 7 and 11 is 7 × 11 = 77
b) The LCM of 2 × 2 × 3 × 5 and 2 × 3 × 7 is 2 × 2 × 3 × 5 × 7 = 420
1.1 Exponents
Square numbers and the square roots of whole numbers
Square whole numbers from 0 to 20.
Emphasize that:
a) 132 = 169 and not 13 × 2
b) 72 = 7 and NOT 72 = 7
c) 72 = 7 than 72 = 49 = 7
d) 16 + 9 = 25 = 5 and not 16 + 9 = 4 + 3 = 7
e) If 4 = 2 then 8 = 4 × 2 = 2 2
1 week
Cubic numbers and the cube root of natural numbers Scientific notation for very large numbers
Emphasize that: a) 13 = 1 and not 3
b) 273
= 3 and not 27 ÷ 3
c) 113
= 11
d) If 83
= 2 then 163
= 8 × 23
= 2 23
Write very large numbers in scientific notation. Examples:
a) 76 430 202 = 7,6430202 × 10⁷
b) 52 billion = 52 × 1012 = 5,2 × 10¹³
1.2 Integers Revise calculations that involve adding, subtracting, multiplying and dividing integers.

Curriculum and Assessment Policy Statement (CAPS) – Mathematics: Senior Phase 33
Operations with integers
Use correct terminology and avoid “a minus and a plus gives a plus”. Rather say “negative 5 plus negative 4 equals negative 9”, whereas “negative 5 times negative 4 equals positive 20”.
Do calculations that involve the squares, cubes, square roots and cube roots of integers Examples:
a) −62 = 36
b) −63 = 216
c) − 9 = −3
d) −83
= −2
1,5 weeks
Do calculations that involve multiple operations
Emphasise the order of operations Examples: a) 2 × 3 − 3 = 6 − 3 = 3 and not 2 × 0 = 0
b) 6 ÷ −2 + 4 × −3 − 1 = −3 − 12 − 1 = −16
Investigate sequences that involve integers Examples: a) Write down the next 2 terms in the sequence −1; 4; −7;… and determine the 10th and the 20th term.
b) Write down the next 2 terms in the sequence −2; 4; −8;… and determine the 8th and 25th term.
1.3 Fractions
Operations with rational numbers
Divide whole numbers and common fractions by common fractions.
Emphasize that to divide by any number means to multiply by its reciprocal Examples:
a) 8 ÷2
3= 8 ×
3
2= 12
b) 7
10÷
1
2=
c) 61
8÷ 1
3
4=
Divide decimal fractions by decimal fractions Example: 6,4
0,04=
640
4= 160 .
Calculate the squares, cubes, square roots and cube roots of rational numbers
1,5 weeks

Curriculum and Assessment Policy Statement (CAPS) – Mathematics: Senior Phase 34
Examples:
a) (0,7)2 = 0,49
b) 0,04 = 0,2
c) (0,1)3 = 0,001 d) −0,0843 = −0,2
Do calculations that involve multiple operations and rounding off rational numbers
Solve problems that involve rational numbers in context.

Curriculum and Assessment Policy Statement (CAPS) – Mathematics: Senior Phase 35
PATTERNS, FUNCTIONS
AND ALGEBRA
2.3 Algebraic expressions
Emphasise terminology: variable, constant, coefficient, power, base of the power, exponent, like and unlike terms, algebraic expression and algebraic equation.
Add, subtract, multiply and divide terms with coefficients that are: a) whole numbers,
b) integers,
c) rational numbers
Emphasize:
a) 𝑥 + 𝑥 = 2𝑥 and not 𝑥2 b) 𝑥2 + 𝑥2 = 2𝑥2 and not 2𝑥4
c) 23 . 2 4 = 27 and not 47 d) (−2𝑥2) 3 = −8𝑥6 and not −6𝑥5
Examples: Determine the numerical value of algebraic expressions by substitution. a) If 𝑥 = 2 then 3𝑥2 = −3(2)2 = −3 × 4 = −12 and not (−6)2
b) If 𝑥 = −2 then −𝑥2 − 𝑥 = −4 + 2 = −2 and not 4 + 2 = 6
Simplify algebraic expressions that involve brackets using the distributive property of multiplication over addition or subtraction Example:
2 5 + 𝑥 − 𝑥2 − 𝑥 3𝑥 + 1 = 10 + 2𝑥 − 2𝑥2 − 3𝑥2 − 𝑥 = −5𝑥2 + 𝑥 + 10
Divide a multi-term algebraic expression by a monomial Examples: 𝑥4−6𝑥2−1
𝑥2 = 𝑥2 − 6 −1
𝑥2 and not 𝑥4 − 6 − 1 by cancelling 𝑥2
Calculate the squares, cubes, square roots and cube roots of single algebraic terms or like algebraic terms Examples:
a) 36𝑥36 = 6𝑥18 and not 6𝑥6
b) 25𝑥2 − 9𝑥2 = 16𝑥2 = 4𝑥 and not 5𝑥 − 3𝑥 = 2𝑥
Do calculations that involve multiple operations Examples: 6𝑥3 − −𝑥2 2𝑥
−𝑥2=
6𝑥3 + 2𝑥3
−𝑥2=
8𝑥3
−𝑥2= −8𝑥
2 weeks
2 Tests and 1 Task 1 week

Curriculum and Assessment Policy Statement (CAPS) – Mathematics: Senior Phase 36
TERM 2 – Grade 8
CONTENT AREA CONTENT CLARIFICATION or NOTES DURATION
(in weeks)
PATTERNS, FUNCTIONS
AND ALGEBRA
2.4 Algebraic equations
Solve linear equations with 1 variable and test the solution by substitution.
Emphasise the importance of additive and multiplicative inverses.
Balance equations by performing the same operation on the LHS and RHS of the equation. Examples: a) 𝑥 + 6 = −9 means 𝑥 + 6 − 6 = −9 − 6 and 𝑥 = −15 and not take 6 across and change its sign.
b)
c) 2𝑥 = 8 means −2𝑥
−2=
8
−2 and 𝑥 = −4 and not take −2 across and change its sign.
Model and solve simple problems that involve numbers, ages, averages, perimeter, area, money, speed/time/distance Examples: The area of a rectangle = length x breadth. If a) the area of a rectangle is 4𝑥2 − 6𝑥 cm2 and the breadth is 2𝑥 cm, calculate the length.
b) Thandi is 6 years older than Sophie. In 3 years time Thandi will be twice as old a Sophie. How old is Thandi now?
2,5 weeks
SPACE AND SHAPE
(GEOMETRY)
3.5 Geometry of straight lines
Investigate pairs of angles formed by: a) perpendicular lines (adjacent supplementary angles)
b) intersecting lines (adjacent supplementary angles and vertically opposite angle)
c) a transversal intersecting parallel lines (corresponding, alternate, and co-linear angles)
Solve problems that involve the relationships between the pairs of angles referred to above. Emphasize: a) The language of Geometry. b) Setting out of answers and displaying reasoning. c) That a reason must be given for each written statement.
1,5 weeks
3.6 Constructions of Geometric figures
Use a pencil, ruler, protractor and a pair of compasses to accurately: a) Bisect line segments and angles. b) Draw perpendicular lines at a given point or from a given point.
Construct angles of 45o , 60o , 30o and their multiples without using a protractor . Examples: By construction investigate the properties of: a) the sides, interior and exterior angles of triangles. b) concurrent line segments in triangles.
1 week
Curriculum and Assessment Policy Statement (CAPS) – Mathematics: Senior Phase 37
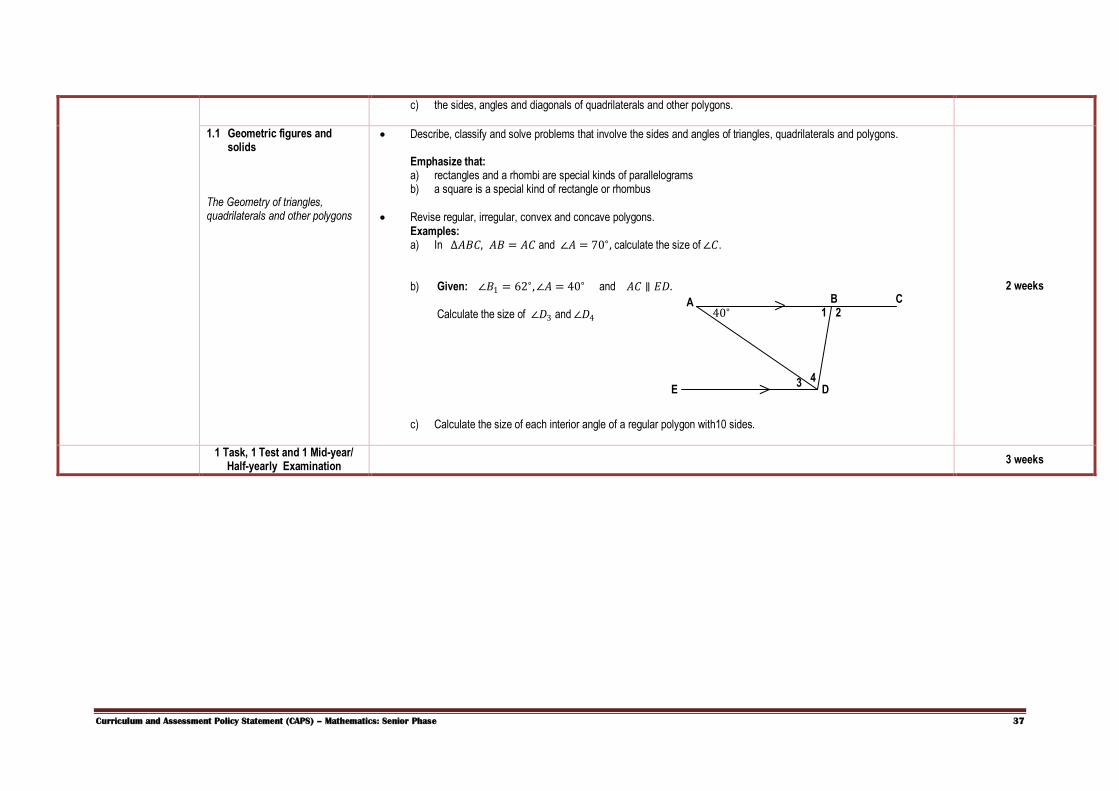
c) the sides, angles and diagonals of quadrilaterals and other polygons.
1.1 Geometric figures and solids
The Geometry of triangles, quadrilaterals and other polygons
Describe, classify and solve problems that involve the sides and angles of triangles, quadrilaterals and polygons. Emphasize that: a) rectangles and a rhombi are special kinds of parallelograms b) a square is a special kind of rectangle or rhombus
Revise regular, irregular, convex and concave polygons. Examples: a) In ∆𝐴𝐵𝐶, 𝐴𝐵 = 𝐴𝐶 and ∠𝐴 = 70∘, calculate the size of ∠𝐶.
b) Given: ∠𝐵1 = 62∘,∠𝐴 = 40∘ and 𝐴𝐶 ∥ 𝐸𝐷. Calculate the size of ∠𝐷3 and ∠𝐷4
c) Calculate the size of each interior angle of a regular polygon with10 sides.
2 weeks
1 Task, 1 Test and 1 Mid-year/ Half-yearly Examination
3 weeks
>
>
A B C
D E
1 2
3 43
40∘
Curriculum and Assessment Policy Statement (CAPS) – Mathematics: Senior Phase 38
TERM 3 – Grade 8
CONTENT AREA CONTENT CLARIFICATION or NOTES DURATION
(in weeks)
MEASUREMENT
4.3 The Theorem of Pythagoras
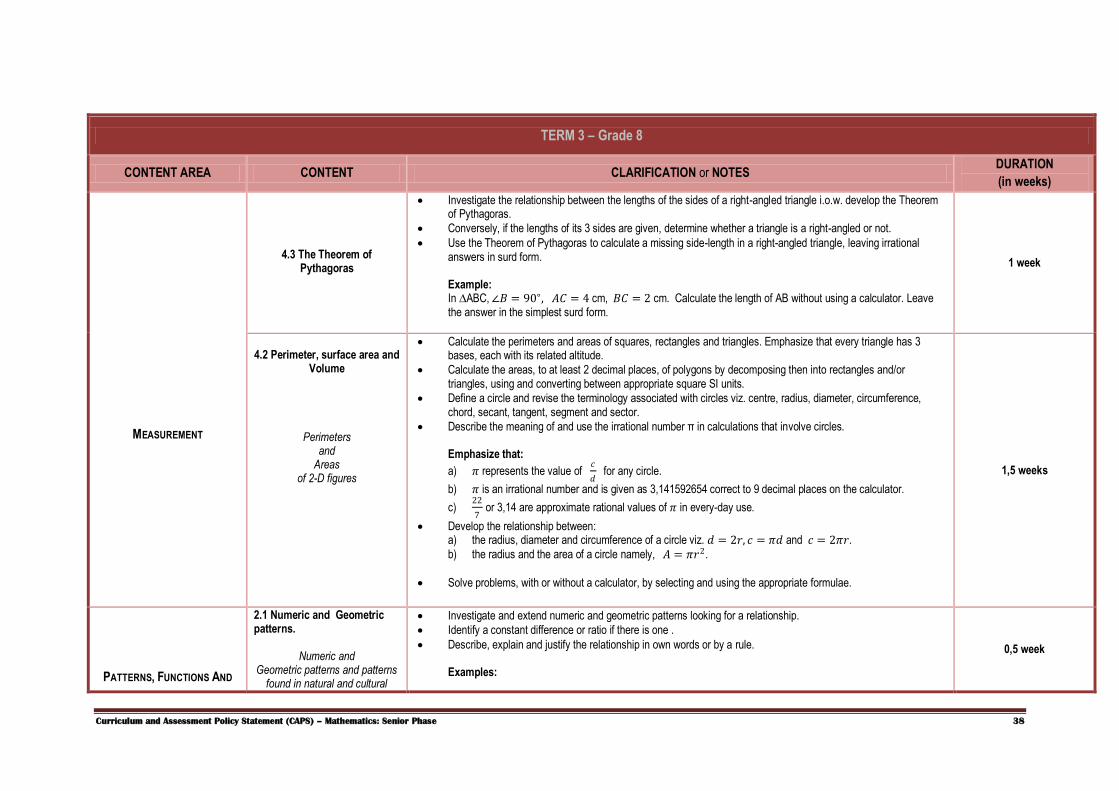
Investigate the relationship between the lengths of the sides of a right-angled triangle i.o.w. develop the Theorem of Pythagoras.
Conversely, if the lengths of its 3 sides are given, determine whether a triangle is a right-angled or not.
Use the Theorem of Pythagoras to calculate a missing side-length in a right-angled triangle, leaving irrational answers in surd form. Example: In ∆ABC, ∠𝐵 = 90∘, 𝐴𝐶 = 4 cm, 𝐵𝐶 = 2 cm. Calculate the length of AB without using a calculator. Leave the answer in the simplest surd form.
1 week
4.2 Perimeter, surface area and
Volume
Perimeters and
Areas of 2-D figures
Calculate the perimeters and areas of squares, rectangles and triangles. Emphasize that every triangle has 3 bases, each with its related altitude.
Calculate the areas, to at least 2 decimal places, of polygons by decomposing then into rectangles and/or triangles, using and converting between appropriate square SI units.
Define a circle and revise the terminology associated with circles viz. centre, radius, diameter, circumference, chord, secant, tangent, segment and sector.
Describe the meaning of and use the irrational number π in calculations that involve circles. Emphasize that:
a) 𝜋 represents the value of 𝑐
𝑑 for any circle.
b) 𝜋 is an irrational number and is given as 3,141592654 correct to 9 decimal places on the calculator.
c) 22
7 or 3,14 are approximate rational values of 𝜋 in every-day use.
Develop the relationship between: a) the radius, diameter and circumference of a circle viz. 𝑑 = 2𝑟, 𝑐 = 𝜋𝑑 and 𝑐 = 2𝜋𝑟.
b) the radius and the area of a circle namely, 𝐴 = 𝜋𝑟2.
Solve problems, with or without a calculator, by selecting and using the appropriate formulae.
1,5 weeks
PATTERNS, FUNCTIONS AND
2.1 Numeric and Geometric patterns.
Numeric and
Geometric patterns and patterns found in natural and cultural
Investigate and extend numeric and geometric patterns looking for a relationship.
Identify a constant difference or ratio if there is one .
Describe, explain and justify the relationship in own words or by a rule. Examples:
0,5 week

Curriculum and Assessment Policy Statement (CAPS) – Mathematics: Senior Phase 39
ALGEBRA forms and patterns of the learner’s own design.
a) The next 2 numbers in the sequence 1 ; 3 ; 5 ; 7; ... are 9 and 11. There is a constant difference of 2, but the numbers are not multiples of 2.
b) The next 2 numbers in the sequence 1 ; 4 ; 9 ; ... are 16 and 25. The numbers are square numbers.
2.5 Graphs
Investigate the properties of graphs illustrating real-life relationships e.g. time-distance graphs.
Draw graphs given co-ordinates of points. Emphasize that: a) The co-ordinates of a point indicates the unique position of that point relative to the Y-axis and to the X-axis. b) If P (6;3) it means that point P lies 6 units to the right of the Y-axis and 3 units above the X-axis.
Describe or interpret graphs with special focus on trends and features such as: a) Linear or non-linear functions b) Increasing or decreasing functions c) Discrete or continuous variables d) Maximum/minimum independent variables.
1 week
SPACE AND SHAPE (GEOMETRY)
3.3 Transformation Geometry
Investigate symmetrical figures and shapes.
Draw lines of symmetry in geometric figures.
Recognise, describe and perform translations, reflections and rotations on geometric figures and shapes. Emphasize that these transformations simply change the position of the figures without changing their shape or size. Examples: a) On squared paper plot point 𝐴(4; 3) and 𝐴′ , its image, after reflection in:
i. the 𝑦-axis ii. the 𝑥-axis.
b) Write down the co-ordinates of 𝑇 ′ if 𝑇(−2; 3) is translated 4 units downwards.
c) Complete: Under the translation 𝑥;𝑦 → 𝑥 + 3;𝑦 : 𝑃 −4; 7 → 𝑃′(… . ;… . )
1 week
NUMBERS, OPERATIONS AND
RELATIONSHIPS
4.1 Ratio and Rate Simplify ratios Example: 45 cm : 1,8m = 45 cm = 45cm : 1800cm = 1:40
Increase or decrease quantities in a given ratio or percentage Examples:
a) Increase 160kg in the ratio 7:4 means the increased mass = 160 ×7
4 kg = 280kg
b) Decrease R400 by 20% means the decreased amount = R400 × 0,8 = R320
1,5 week

Curriculum and Assessment Policy Statement (CAPS) – Mathematics: Senior Phase 40
Share amounts or quantities in a given ratio Examples: Share R187 between A and B in the ratio 9:8.
Then A’s share = 9
17×R187 = R99 and
B’s share = 8
17× R187 = R88
Solve problems involving ratios in real life situations. Emphasize that: a) the cost of 4kg = R10 and not 4kg = R10
b) 1
3 of the distance = 45km and not
1
3 = 45km
c) 10% of the capacity = 63𝑙 and not 10% = 63𝑙
Use words like “for”, “for every”, “per unit”, “per hundred” etc. as an aid in identifying equal and unequal rates.
Transformation geometry
Scale drawing
Use scale on plans or maps to determine actual lengths or distances.
Use proportion to describe the effect of enlargement or reduction on the properties of geometric figures. Examples: The perimeter of square ABCD = 48cm. a) Write down the perimeter of the square if the length of each side is doubled. b) Will the area of the enlarged square be twice or four times that of the original square?
0,5 week
1.6 Financial Mathematics
Calculate: a) Profit and Loss, discount, budgets. b) Simple interest and hire purchase. c) Exchange rates
Examples: a) Calculate the cost price of a shirt if it is sold for R116 at a loss of 20%. b) Calculate the selling price of a table marked R1699,00 if a discount of 5% is given for cash. c) The simple interest on R1 800 invested at 8,5% p.a. for n years is R459. Determine the value of 𝑛. d) Calculate how many:
i. USA dollar ($) , and ii. Pound (£)
can be exchanged for R8 000 if the exchange rate is R7,20 to the USA dollar and R12,10 to the pound.
2 weeks
2 Tests and 1 Task 1 week

Curriculum and Assessment Policy Statement (CAPS) – Mathematics: Senior Phase 41
TERM 4 – Grade 8
CONTENT AREA CONTENT CLARIFICATION or NOTES DURATION
(in weeks)
SPACE AND SHAPE
(GEOMETRY)
3.2 Properties of geometric figures and solids
Polyhedra
Revise the relationship between the number of faces, edges and vertices of 3-D figures.
Use the nets of cubes, prisms, cylinders and pyramids and use them to make models of these 3-D figures.
Investigate the 5 Platonic solids viz. the tetrahedron, hexahedron (cube) octahedron, dodecahedron and icosahedron with reference to number of vertices, edges, faces and shape of faces.
1 week
MEASUREMENT
4.2 Perimeter, surface area and volume
Volume and
Surface area
Revise the conversions of appropriate SI linear, square and cubic units of measurement.
Calculate the volume of rectangular prisms, triangular prisms and cylinders.
Calculate the surface areas of rectangular prisms, triangular prisms and cylinders.
Solve problems that involve the volume, capacity and surface area, correct to at least 2 decimal places, in context. Examples: a) Calculate the volume of a cylinder, without using a calculator if its diameter is 28 cm, its height is 30 cm and
𝜋 =22
7.
b) Calculate the surface area of a cylinder, correct to 2 decimal places if its height is 65 cm and the circumference of its base is 47,6 cm.
c) Calculate the volume and surface area of the adjacent prism if AB = 8 cm, BC = 6 cm and CF = 16 cm.
1 week
Data Handling
5. 1 Collection of Data
Pose questions relating to real life situations e.g. situations affecting the learners in the school like type and quantity of litter in the school grounds.
Use simple questionnaires containing a variety of questions and responses (e.g. yes/no, multiple choice, open ended) to collect data on posed questions.
Revise the distinction between samples and populations.
Select an appropriate source from which to collect data and focus on one set of data only.
1 week
E
C A
D F
B

Curriculum and Assessment Policy Statement (CAPS) – Mathematics: Senior Phase 42
5.2 Organising, recording and summarising data
Arrange ungrouped data in ascending and descending order.
Determine the range of the data and understand why it is important to know the spread of the data.
Group data into intervals. Example: Group data on all the heights of the learners in the Grade 8 class into different height s intervals: 0,6 m to 1 m; 1,1 to 1,5 m etc.
Organise and record data using tally marks, tables and stem-and-leaf displays.
Calculate the mean, median and mode of a single data set of ungrouped data like data relating to school and classroom context.
1 week
5.3 Displaying data Represent collected and organised data graphically using the following graphs: e) Bar graphs f) Histograms with given intervals g) Pie charts h) Line and broken-line graphs i) Scatter plots.
1 week
5.4 Read and interpret graphs Identify points or values on a graph from values given on the vertical and horizontal axis.
Critically read and interpret tables, graphs and measures (mean, median, mode, range) in order to answer questions.
Analyse graphs and explain the message being displayed or represented on a graph and /or describe trends in the graphs. Example: Analyse a graph showing the distribution of test scores for a class of learners and make deductions about the performance of that group of learners.
5.5 Probability Perform simple experiments where the possible outcomes are equally likely, and: d) List the possible outcomes based on conditions of the activity e) Determine the frequency of actual outcomes for a series of trials f) Determine the relative frequency using the definition of relative frequency.
1 week
Revision, 1 Test and a Final Examination
3 weeks

Curriculum and Assessment Policy Statement (CAPS) – Mathematics: Senior Phase 43
TERM 1 – Grade 9
CONTENT AREA CONTENT NOTES or CLARIFICATION DURATION (in weeks)
NUMBERS, OPERATIONS AND RELATIONSHIPS
Real Number System Consolidate and extend knowledge gained in previous grades involving natural numbers, whole numbers, integer, rational and irrational numbers.
The diagrammatic representation of sets of numbers in the real number system.
1.1 Exponents
The laws of exponents for 𝐦,𝐧 ∈ 𝐍 and 𝐚, 𝐭 ≠ 𝟎:
𝒂𝒎 × 𝒂𝒏 = 𝒂𝒎+𝒏 Examples:
𝑥3 × 𝑥4 = 𝑥7
23 × 24 = 27 = 128
𝒂𝒎 ÷ 𝒂𝒏 = 𝒂𝒎−𝒏 if m> 𝑛 Examples:
𝑥5 ÷ 𝑥3 = 𝑥2
35 ÷ 32 = 33 = 27
𝒂𝒎 ÷ 𝒂𝒏 =𝟏
𝒂𝒎−𝒏 if 𝑚 < 𝑛 Examples:
𝑥3 ÷ 𝑥5 = 𝑥−2 =1
𝑥 2
73 ÷ 75 = 7−2 =1
72=
1
49
𝒂𝒎 𝒏 = 𝒂𝒎𝒏 Example: (23)2 = 26 = 64
2 week
Whole
Numbers Natural Integers
Rational
REAL NUMBERS
(ℕ) (ℕ0) (ℤ)
(ℚ) Irrational
(ℚ′)

Curriculum and Assessment Policy Statement (CAPS) – Mathematics: Senior Phase 44
𝒂 × 𝒕 𝒏 = 𝒂𝒏𝒕𝒏 (3𝑥2)2 = 27𝑥61
𝒂𝟎 = 𝟏 Example: (37)0 = 1
(4𝑥 + 𝑦)0 = 1
𝒂−𝒏 =𝟏
𝒂𝒏 Example: 5−3 =
1
53
Examples:
a) 2−1 . 62 . 3−2
b) −2𝑥2 −2𝑥 −2
c) 2n .2n +1
4n
d) 9n−1 .12n
4n +1 .27n
Common errors Emphasise that:
a) 25 × 27 = 212𝐚𝐧𝐝 𝐧𝐨𝐭 25 × 27 = 412
b) 45 ÷ 22 = 22 5 ÷ 22 = 210 ÷ 22 = 28 and not 45 ÷ 22 = 23
c) 2𝑥−2 = 21
𝑥 2 and not 2𝑥−2 =
1
2𝑥 2
Simple exponential equations
Examples: Solve for 𝒙: a) 3𝑥 = 9
b) 2𝑥 =1
4
c) 2𝑥+1 = 64
d) 3𝑥 . 9𝑥−1 =1
27
e) 5𝑥+1 = 1
1 week
Scientific Notation for very

Curriculum and Assessment Policy Statement (CAPS) – Mathematics: Senior Phase 45
small numbers. Revise calculations involving very large numbers and write the answers in scientific notation.
Examples:
Calculate 2,6 × 105 × 9 × 107 without using a calculator and give the answer in scientific notation
Write very small numbers in scientific notation Example: 0,00053
Do calculations with or without using a calculator writing the answers in scientific notation. Examples: Calculate
a) 5,8 × 10⁻⁴ + 2,3 × 10⁻⁵ without using a calculator
b) 9,43 × 10⁻⁵ − 24,6 × 10⁻⁷ using a calculator
1 week
2.3 Algebraic Expressions Addition and subtraction of polynomials
Revise addition and subtraction of like terms
Learners should be able to: a) Recognise polynomials and differentiate between monomials, binomials, trinomials. b) Identify the degree of a polynomial and arrange polynomials in descending or ascending order. c) Add and subtract polynomials
1 week
Substitution Determine the numerical value of a polynomial by substitution
Example: If 𝑥 = −2 then
−𝑥2 + 3𝑥 + 4 = −(−2)2 + 3 −2 + 4 = −4 − 6 + 4 = −6
1 week
Multiply a polynomial by a monomial
Use the distributive property of multiplication over addition/subtraction to determine the product of a polynomial by a monomial. Example:
2𝑥 3𝑥2 − 4𝑥 + 5 = 6𝑥3 − 8𝑥 + 10𝑥
2 weeks
Multiply two binomials
Use the distributive property of multiplication over addition/subtraction to determine the product of two binomials.
Learners should be able to determine the product of two binomials by inspection. Examples:
1. 𝑥 + 2 𝑥 + 3 = 𝑥2 + 5𝑥 + 6 2. 𝑥 − 2 𝑥 − 3 = 𝑥2 − 5𝑥 + 6
3. 𝑥 + 2 𝑥 − 3 = 𝑥2 − 𝑥 − 6
4. 𝑥 − 2 𝑥 + 3 = 𝑥2 + 𝑥 − 6 5. 𝑥 ± 2 2 = 𝑥2 ± 4𝑥 + 4
Simplify expressions
1 week

Curriculum and Assessment Policy Statement (CAPS) – Mathematics: Senior Phase 46
containing products of binomials
Example:
2 𝑥 − 3 2 − 3 𝑥 + 1 2𝑥 − 5
Divide a polynomial by a monomial
Example: 6𝑥3−8𝑥2+2𝑥+10
2𝑥 = 3𝑥2 − 4𝑥 + 1 +
5
𝑥 1 week
Factorize algebraic expressions which contain common factors and expressions of the form
𝑎2 − 𝑏2 Simplify algebraic fractions using factorization
Note that:
Factorisation is the converse of multiplication
1 and -1 are common factors of every expression. Examples: a) 𝑎 − 4𝑏 = 1 𝑎 − 4𝑏 b) 4𝑏 − 𝑎 = −1 𝑎 − 4𝑏 c) 6𝑎4 − 4𝑎2 d) 2𝑥 𝑎 − 𝑏 − 3(𝑎 − 𝑏) e) 3𝑎 + 𝑏 𝑝 − 2𝑡 − 3𝑎 + 𝑏 (2𝑝 + 𝑡)
f) 𝑎 + 𝑏 2 − 5 𝑎 + 𝑏 g) 25𝑎2 − 1
h) 𝑎4 − 𝑏4 i) 9(𝑎 + 𝑏)2 − 1
j) 3𝑥2 − 27 k) 𝑎𝑥 − 𝑏𝑥 + 2𝑎 − 2𝑏
1 week
Emphasise that:
a) 2𝑥+6𝑦
𝑥+3𝑦=
2 𝑥+3𝑦
𝑥+3𝑦= 2 and NOT
2𝑥+6𝑦
𝑥+3𝑦=
2+2
1+1=
4
2= 2
b) 3𝑥−3𝑦
6𝑥−6𝑦=
3(𝑥−𝑦)
6(𝑥−𝑦)=
3
6=
1
2 and NOT
3𝑥−3𝑦
6𝑥−6𝑦=
1−1
2−2=
0
0= 0
1 week
Factorize trinomials of the form 𝑎𝑥2 + 𝑏𝑥 + 𝑐 where 𝑎 is:
positive 1
a common factor.
Examples: a) 𝑥2 + 5𝑥 + 6 = (𝑥 + 2)(𝑥 + 3)
b) 𝑥2 − 5𝑥 + 6 = (𝑥 − 2)(𝑥 − 3) c) 𝑥2 + 𝑥 − 6 = (𝑥 − 2)(𝑥 + 3)
d) 𝑥2 − 𝑥 − 6 = (𝑥 + 2)(𝑥 − 3)
e) 𝑥2 + 6𝑥 + 9 = 𝑥 + 3 𝑥 + 3 = 𝑥 + 3 2 f) 𝑥2 − 6𝑥 + 9 = 𝑥 − 3 𝑥 − 3 = 𝑥 − 3 2 g) 2𝑥2 + 10𝑥 + 12 = 2 𝑥2 + 5𝑥 + 6 = 2 𝑥 + 2 (𝑥 + 3)
2.4 Algebraic Equations Solving Algebraic
Solve: a) linear equations containing brackets
1 week

Curriculum and Assessment Policy Statement (CAPS) – Mathematics: Senior Phase 47
Equations b) linear equations which contain fractions c) linear equations which contain fractions which have variables in the denominator d) equations of the form: a product of factors = 0 Examples: Solve for 𝒙 a) 3 𝑥 − 2 = 𝑥 + 1
b) 𝑥
3+
2𝑥−1
4= 1
c) 7
𝑥−2=
3
𝑥 provided 𝑥 ≠ 0; 2
d) 𝑥 − 1 𝑥 + 3 = 0
e) 𝑥2 − 3𝑥 = 0
f) 𝑥2 − 25 = 0
2 Tests and 1 Task
TERM 2 – Grade 9
CONTENT AREA CONTENT NOTES or CLARIFICATION DURATION (in weeks)
SPACE AND SHAPE
3.5 Geometry of Straight lines Consolidate and extend Geometry knowledge involving the properties of:
Intersecting and parallel lines.
The sides and interior angles of triangles and quadrilaterals
The diagonals of kites, parallelograms, rectangles, rhombi and squares.
Geometry of straight lines: primarily refers to parallel lines cut by a transversal, perpendicular lines and intersecting lines in terms of angle relationships (namely, complementary, supplementary, vertically opposite, corresponding angles, alternate angles, co-interior angles,).
Emphasise: a) The language of Geometry b) Setting out answers c) Displaying logic/reasoning d) Reasons for each statement e) Exterior angles of triangles, and sum of interior angles of triangles f) Interior angles of polygons
1 week

Curriculum and Assessment Policy Statement (CAPS) – Mathematics: Senior Phase 48
3.2 Properties of geometric figures
Similarity: a) Establish through investigations that for polygons to be similar, corresponding angles must be equal and corresponding sides
must be proportional. b) Similar figures have the same shape but differ in size. Triangles are similar if corresponding angles are equal and corresponding
sides are proportional.
Congruence: a) Conditions for two triangles to be congruent:
o Three sides are equal (S;S;S)
o Two sides and the included angles are equal (S,A,S) or (S, ∠ ,S)
o Two corresponding angles and sides are equal (A,A, S) or (∠,∠,S)
o Right angle, hypotenuse and sides equal (R, H, S) or ( 𝟗𝟎°, H;,S )
b) Learners should calculate the measures of unknown sides and angles in pairs of similar triangles and congruent triangles.
2 weeks
3.3 Transformation Geometry
Consolidate and extend knowledge and skills about transformations.
Investigate whether the given transformation is a: translation, reflection, rotation or enlargement.
Transform points, line segments and simple geometric figures.
Examples:
Coordinates of a given
point Transformation
Coordinates of the image
General rule
𝐴(3;−4) Translate 2 units to the right 𝐴′(5;−4) 𝑥;𝑦 → (𝑥 + 2;𝑦)
𝐴(3;−4) Translate 2 units to the right 𝐴′(3;−7) 𝑥;𝑦 → (𝑥;𝑦 − 3)
𝐴(3;−4) Reflect in the y-axis 𝐴′(−3; 4) 𝑥;𝑦 → (−𝑥;𝑦)
𝐴(3;−4) Reflect in the x-axis 𝐴′(3; 4) 𝑥;𝑦 → (𝑥;−𝑦)
𝐴(3;−4) Reflect in the 𝑦 = 𝑥 line 𝐴′(4; 3) 𝑥;𝑦 → (𝑦; 𝑥)
𝑃(4; 0) Rotate 90°anti-clockwise about the origin
𝑃 ′(0; 4) 𝑥;𝑦 → (−𝑦; 𝑥)
𝑃(4; 0) Rotate 90°clockwise about the origin 𝑃 ′(0;−4) 𝑥;𝑦 → (𝑦; −𝑥)
𝑃(4; 0) Rotate 180°anti-clockwise about the origin
𝑃 ′(−4; 0) By investigation
𝑃(4; 0) Rotate 180°clockwise about the origin
𝑃 ′(−4; 0)
By investigation
Enlargement
2 weeks

Curriculum and Assessment Policy Statement (CAPS) – Mathematics: Senior Phase 49
Examples:
a) 𝐴(2; 1), 𝐵(4; 3) and 𝐶(5; 5) are coordinates of ∆𝐴𝐵𝐶. Write down the coordinates of 𝐴′, 𝐵′ and 𝐶 ′ the image of ∆𝐴𝐵𝐶 after enlargement by a scale factor of 2.
Answer:
𝐴′(4; 2), 𝐵′(8; 6) and 𝐶 ′(10; 10) The general rule: 𝑥;𝑦 → (2𝑥; 2𝑦) b) Investigate by construction, that: :
i. the image of 𝑇(3; 2) rotated 90° anti-clockwise about the origin is 𝑇 ′(−2; 3)
ii. the image of 𝑇(3; 2) rotated 90°clockwise about the origin is 𝑇 ′(3;−2) iii. Hence deduce the general rule.
MEASUREMENT
1.7 Ratio and Rate Teach ratio by revising fractions and showing that a fraction is a ratio.
Examples:
a) 1
2:
1
3:
1
4=
6
12:
4
12:
3
12= 6: 4: 3 and not 2: 3: 4
b) R60 increased in the ratio 7: 4 = R60 ×7
4= R105
Note: To say R60 increased in the ratio 4: 7 is incorrect.
c) 120kg decreased by 10% = 120 × 0,9kg = 108kg
Solve problems involving time, distance and speed
Examples: a) A car travelling at a constant speed travels 60𝑘𝑚 in 18 minutes. How far, travelling at the same constant speed, will the car
travel in 1 hour 12 minutes?
b) A car travelling at an average speed of 100km/h will cover a certain distance in 3hours 20 minutes. At what constant speed must
the car travel to cover the same distance in 2 hours 4o minutes?
1 week
NUMBERS, OPERATIONS AND RELATIONSHIPS
Direct and indirect proportion
Direct proportion
a) 𝑦 is directly proportional to 𝑥 if 𝑦
𝑥= a constant
b) 𝑥 and 𝑦 are directly propotional if, as the value of 𝑦 increases the value of 𝑥 increases and as the value of 𝑦 decreases the
value of 𝑥 decreases.
c) The direct proportional relationship is represented by a straight line graph.
Indirect proportion
a) 𝑦 is indirectly or inversely proportional to 𝑥 if 𝑥 × 𝑦 = a constant, 𝑐 in other words 𝑦 =𝑐
𝑥
b) 𝑥 and 𝑦 are in directly propotional if, as the value of 𝑦 increases the value of 𝑥 decreases and as the value of 𝑦 decreases the
1 week

Curriculum and Assessment Policy Statement (CAPS) – Mathematics: Senior Phase 50
value of 𝑥 increases.
c) Indirectly proportional relationship is represented by a non-linear curve.
PATTERNS, FUNCTIONS &
ALGEBRA
2.1 Numeric and geometric patterns
Investigate and extend numeric and geometric patterns and relationships by: a) Extending the pattern b) Generalising by using a verbal description to explain the pattern c) Representing the pattern by a rule or algebraic formula d) Justifying the rule that generates the pattern e) Represent the relationship between the variables on a flow diagram or a table
Examples:
Determine Tn and T20 by inspection in each of the following sequences: a) 3; 8; 13;...
b) 17; 14; 11;...
c) 2; 8; 18;...
d) 2; 4; 8;...
1 week
2.2 Input and Output values Determine input and/or output values using flow diagrams, tables, formulae and equations.
In the formula 𝐴 = 𝜋𝑟2, the value of 𝐴 is dependent on the value of 𝑟. Thus 𝐴 is a function of 𝑟.
In the formula 𝑦 = 3𝑥 + 2, the value of 𝑦 is dependent on the value of 𝑥. Thus 𝑦 is a function of 𝑥.
Revise:
a) Linear or non-linear function
b) Increasing or decreasing functions
c) Maximum or minimum independent variables
Example:
a) If 𝑦 = 2𝑥2 − 3 calculate the values of 𝑦 for 𝑥 = −2; −1; 2. b) Determine the relationship between 𝑝 and 𝑡 values. Hence, insert the missing values in the table below.
p 1 2 3 9
𝒕 7 10 13 40
1 week
Draw graphs on the Cartesian plane for given two – variable linear equations, using the table method.
Examples: Draw a sketch graph defined by:
a) 𝑥 = −4 b) 𝑦 = 2 c) 𝑦 = 2𝑥 − 3, for 𝑥 = −1; 0; 1; 2 d) 𝑦 = −3𝑥 + 2, if 𝑥 ∈ ℝ using the table method
1 week
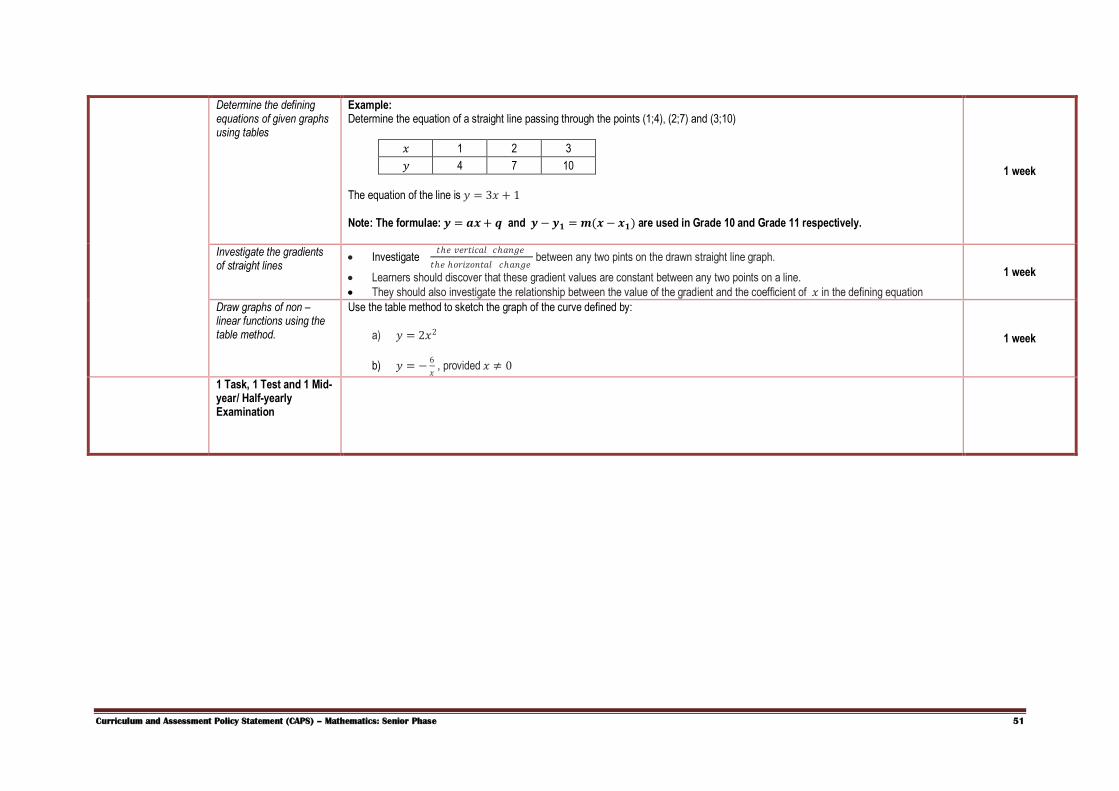
Curriculum and Assessment Policy Statement (CAPS) – Mathematics: Senior Phase 51
Determine the defining equations of given graphs using tables
Example: Determine the equation of a straight line passing through the points (1;4), (2;7) and (3;10)
𝑥 1 2 3
𝑦 4 7 10
The equation of the line is 𝑦 = 3𝑥 + 1 Note: The formulae: 𝒚 = 𝒂𝒙 + 𝒒 and 𝒚 − 𝒚𝟏 = 𝒎(𝒙 − 𝒙𝟏) are used in Grade 10 and Grade 11 respectively.
1 week
Investigate the gradients of straight lines
Investigate 𝑡ℎ𝑒 𝑣𝑒𝑟𝑡𝑖𝑐𝑎𝑙 𝑐ℎ𝑎𝑛𝑔𝑒
𝑡ℎ𝑒 ℎ𝑜𝑟𝑖𝑧𝑜𝑛𝑡𝑎𝑙 𝑐ℎ𝑎𝑛𝑔𝑒 between any two pints on the drawn straight line graph.
Learners should discover that these gradient values are constant between any two points on a line.
They should also investigate the relationship between the value of the gradient and the coefficient of 𝑥 in the defining equation
1 week
Draw graphs of non – linear functions using the table method.
Use the table method to sketch the graph of the curve defined by:
a) 𝑦 = 2𝑥2
b) 𝑦 = −6
𝑥 , provided 𝑥 ≠ 0
1 week
1 Task, 1 Test and 1 Mid-year/ Half-yearly Examination

Curriculum and Assessment Policy Statement (CAPS) – Mathematics: Senior Phase 52
TERM 3 – Grade 9
CONTENT AREA CONTENT NOTES or CLARIFICATION DURATION (in weeks)
NUMBERS,
OPERATIONS AND
RELATIONSHIPS
1.6 Financial
Mathematics
Percentage and Finance
Consolidate and extend knowledge involving percentages and financial matters, namely:
a) profit and loss, b) budgets, c) accounts, d) loans, e) hire purchase, f) exchange rates, g) commission, h) rentals, i) banking j) simple
3 weeks
Simple interest: Examples:
a) Calculate the simple interest on R600 at 7% p.a for 3 years using the formula 𝑆𝐼 =𝑃.𝑛 .𝑟
100 or 𝑆𝐼 = 𝑃.𝑛. 𝑖 for 𝑖 =
𝑟
100
b) R800 invested at 𝑟 % per annum simple interest for a period of 3 years yields R168 interest. Calculate the value of 𝑟 c) How long will it take for R3 000 invested at 6% per annum to grow to R4 260?
Compound interest (without using a formula) by repeated calculation for up to three years.
Example: Temoso borrowed R500 from the bank for 3 years at 8% p.a compound interest. Without using a formula, calculate how much Temoso owes the bank at the end of the three years.
Derive and use the compound interest formula: 𝐴 = 𝑃 1 +𝑟
100 𝑛
Example:
Use the formula 𝐴 = 𝑃 1 +𝑟
100 𝑛
to calculate the compound interest on a loan of R3 450 at 6,5% per annum for 5 years.
Investigate that:
Interest calculated at 12% per annum for 4 years is equivalent to interest at: a) 6% per half year for 8 halves,
b) or 3% per quarter for 16 quarters
c) or 1% per month for 48 months.

Curriculum and Assessment Policy Statement (CAPS) – Mathematics: Senior Phase 53
SPACE AND SHAPE
3.1 Properties of Geometric figures and solids
Consolidate and extend knowledge about regular and irregular polyhedra, cylinders and spheres.
Revise properties of the faces, vertices and edges of the 5 platonic solids, namely tetrahedron, hexahedron (cube), octahedron, dodecahedron, icosahedrons
1 week
3.4 Position and Movement Use the following representational systems to describe and locate position and movement between positions :
ordered grids
compass directions in
degrees
angles of elevation
and depression
Plot points in any quadrant on the Cartesian plane
Use compass directions as a representational system to describe position and movement between positions
Describe the position of one point relative to another point in terms of compass direction in degrees e.g. S 45° E
Use angles of elevation to describe position and movement
Use a protractor to measure the angle formed between a point on a horizontal line and a point above it – angle of elevation
Use angles of depression to describe position and movement between positions
Use a protractor to measure the angle formed between a point on a horizontal line and a point below it – angle of depression Examples: a) ABCD is a rectangle. Which angle is the angle of depression of C from A?
b) The angle of elevation from a sailboat to the top of a lighthouse which is 60 metres high is39°. By construction, determine the approximate distance of a sailboat from the lighthouse.
1 week
4.2 Perimeter, surface area and volume
Revise perimeter and area of squares, rectangles, triangles and circles.
Determine the perimeter and areas of trapeziums, parallelograms, rhombi and kites
Revise the volume of cubes, rectangular prisms, triangular prisms and cylinders.
Investigate:
a) How doubling any or all the dimensions of any 2-D figure affects its perimeter and its area.
b) How doubling any or all the dimensions of right prisms and cylinders affects its volume.
1 week
MEASUREMENT 4.3 The Theorem of Pythagoras
Revise the Theorem of Pythagoras.
Use the Theorem of Pythagoras to solve problems involving lengths of unknown sides in known geometric figures and solids.
cliff
Boat
angle of depression
Sea
ground level
angle of elevation
line of light
bird
ground level
A B
C D
1
1
2
2

Curriculum and Assessment Policy Statement (CAPS) – Mathematics: Senior Phase 54
Example:
a) ABCD is a rectangle where BD = 15 cm and BC = 9 cm.
b) Determine the:
i. perimeter of ABCD
ii. area of ABCD.
2 Tests and 1 Task
TERM 4 – Grade 9
CONTENT AREA CONTENT NOTES or CLARIFICATION DURATION (in weeks)
DATA HANDLING
5. 1 Collection of Data
Pose questions relating to real life situations e.g. situations affecting the learners in the school and the environment.
Use simple questionnaires containing a variety of questions and responses (e.g. yes/no, multiple choice, open ended) to collect data on posed questions.
Revise the distinction between samples and populations.
Select appropriate sources from which to collect data and focus on two sets of data and their comparison. Example: Compare the heights of male and female learners in the classroom.
1 week
5.2 Organising, recording and summarising data
Arrange ungrouped data in ascending and descending order.
Arrange data according to more than one criteria. Example: Arrange the marks for the learners in a class in ascending order separately for male and female learners.
Identify outliers in a data set and the impact of outliers on a data set.
Compare calculate range values for two sets of data and describe how the spread of the values in the data sets are different.
Compare the mean, median and mode of two set of data relating to the environment.
Group two sets of data into intervals. Example: Group data on all the heights of the male and female learners in the Grade 9 class into different height intervals: 0,6 m to 1 m; 1,1 to 1,5 m etc.
Organise and record data using tally marks, tables and stem-and-leaf displays.
Calculate the mean, median and mode of a two sets of data relating to the environment.
2 week
5.3 Displaying data Represent collected and organised data graphically using the following graphs: a) Bar graphs and double bar graphs b) Histograms with given and own intervals
1 week
15 cm 9 cm
A B
C D

Curriculum and Assessment Policy Statement (CAPS) – Mathematics: Senior Phase 55
c) Pie charts d) Line and broken-line graphs e) Scatter plots.
5.4 Read and interpret graphs
Identify points or values on a graph from values given on the vertical and horizontal axis.
Critically read and interpret tables, graphs and measures (mean, median, mode, range and outliers) in order to answer questions.
Compare the measures and make deductions about the differences between two sets of ungrouped data. Example: Compare the average mark of the test results of two different classes and make a decision about which class performed better in the test
Analyse graphs and explain the message being displayed or represented on a graph and /or describe trends in the graphs. Example: Interpret a graph showing rainfall data for an area and make predictions about the possibility of rainfall in that area in a particular month of the year.
Investigate situations involving misleading representations of data.
Example: Change the scale on a graph and or the point at which a graph cuts the axes to create a particular impression.
2 weeks
5.5 Probability Revise performing simple experiments where the possible outcomes are equally likely.
Determine probabilities for compound events using two–way tables and tree diagrams.
Determine probabilities for outcome of and predicts their relative frequency.
Discuss the difference between the probability of outcomes and their relative frequency.
1 week
Revision, Test and Final Examination
3 weeks
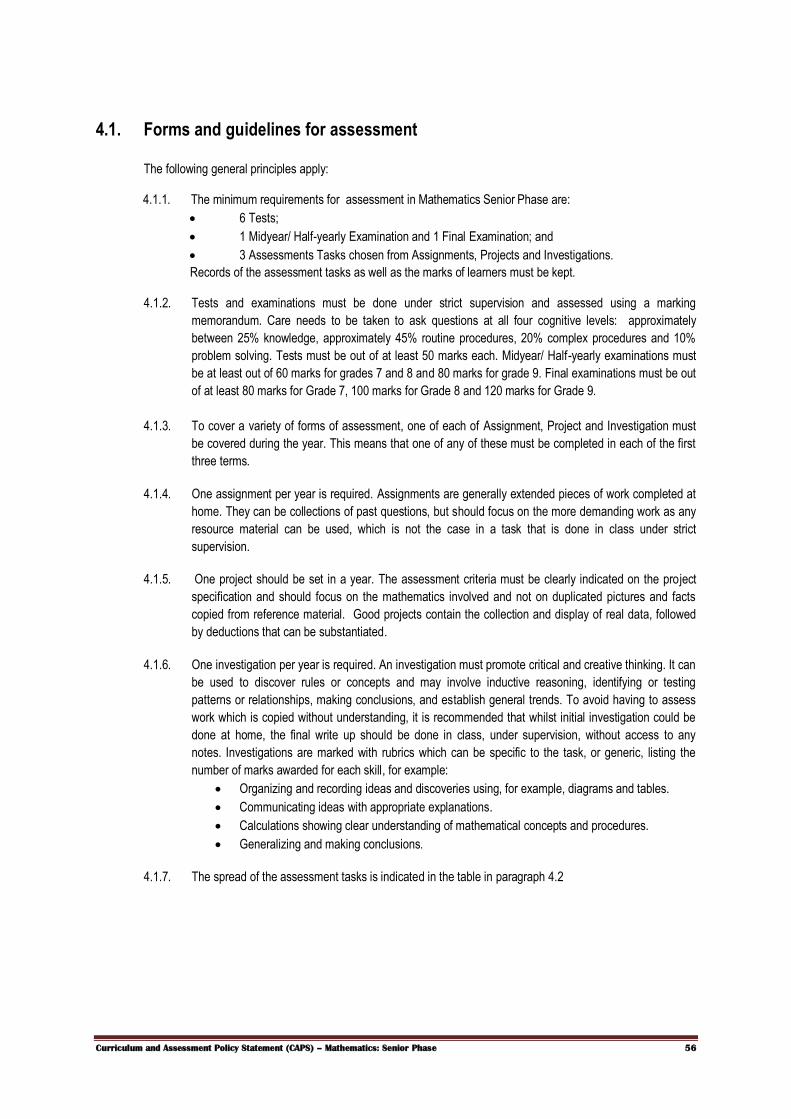
Curriculum and Assessment Policy Statement (CAPS) – Mathematics: Senior Phase 56
4.1. Forms and guidelines for assessment
The following general principles apply:
4.1.1. The minimum requirements for assessment in Mathematics Senior Phase are:
6 Tests;
1 Midyear/ Half-yearly Examination and 1 Final Examination; and
3 Assessments Tasks chosen from Assignments, Projects and Investigations.
Records of the assessment tasks as well as the marks of learners must be kept.
4.1.2. Tests and examinations must be done under strict supervision and assessed using a marking
memorandum. Care needs to be taken to ask questions at all four cognitive levels: approximately
between 25% knowledge, approximately 45% routine procedures, 20% complex procedures and 10%
problem solving. Tests must be out of at least 50 marks each. Midyear/ Half-yearly examinations must
be at least out of 60 marks for grades 7 and 8 and 80 marks for grade 9. Final examinations must be out
of at least 80 marks for Grade 7, 100 marks for Grade 8 and 120 marks for Grade 9.
4.1.3. To cover a variety of forms of assessment, one of each of Assignment, Project and Investigation must
be covered during the year. This means that one of any of these must be completed in each of the first
three terms.
4.1.4. One assignment per year is required. Assignments are generally extended pieces of work completed at
home. They can be collections of past questions, but should focus on the more demanding work as any
resource material can be used, which is not the case in a task that is done in class under strict
supervision.
4.1.5. One project should be set in a year. The assessment criteria must be clearly indicated on the project
specification and should focus on the mathematics involved and not on duplicated pictures and facts
copied from reference material. Good projects contain the collection and display of real data, followed
by deductions that can be substantiated.
4.1.6. One investigation per year is required. An investigation must promote critical and creative thinking. It can
be used to discover rules or concepts and may involve inductive reasoning, identifying or testing
patterns or relationships, making conclusions, and establish general trends. To avoid having to assess
work which is copied without understanding, it is recommended that whilst initial investigation could be
done at home, the final write up should be done in class, under supervision, without access to any
notes. Investigations are marked with rubrics which can be specific to the task, or generic, listing the
number of marks awarded for each skill, for example:
Organizing and recording ideas and discoveries using, for example, diagrams and tables.
Communicating ideas with appropriate explanations.
Calculations showing clear understanding of mathematical concepts and procedures.
Generalizing and making conclusions.
4.1.7. The spread of the assessment tasks is indicated in the table in paragraph 4.2

Curriculum and Assessment Policy Statement (CAPS) – Mathematics: Senior Phase 57
4.2. Annual assessment plan
GRADE TERM 1 Weighting TERM 2 Weighting TERM 3 Weighting TERM 4 Weighting
7
Test 10% Test 10% Test 10% Test 10%
Test 10% Midyear/ half yearly
Examination 25% Test 10%
Final Examination 60% Assignment or Project
or Investigation 5%
Assignment or Project or Investigation
5% Assignment or Project
or Investigation 5%
8
Test 10 % Assignment or Project
or Investigation 5 %
Assignment or Project or Investigation
5 % Test 10%
Test 10% Midyear/ half-yearly
Exam 25% Test 10%
Final Examination 60% Assignment or Project
or Investigation 5% Test 10 % Test 10 %
9
Test 10% Test 10% Test 10% Test 10%
Test 10% Midyear/ half-yearly
Exam 25% Test 10%
Final Examination 60% Assignment or Project
or Investigation 5%
Assignment or Project or Investigation
5% Assignment or Project
or Investigation 5%
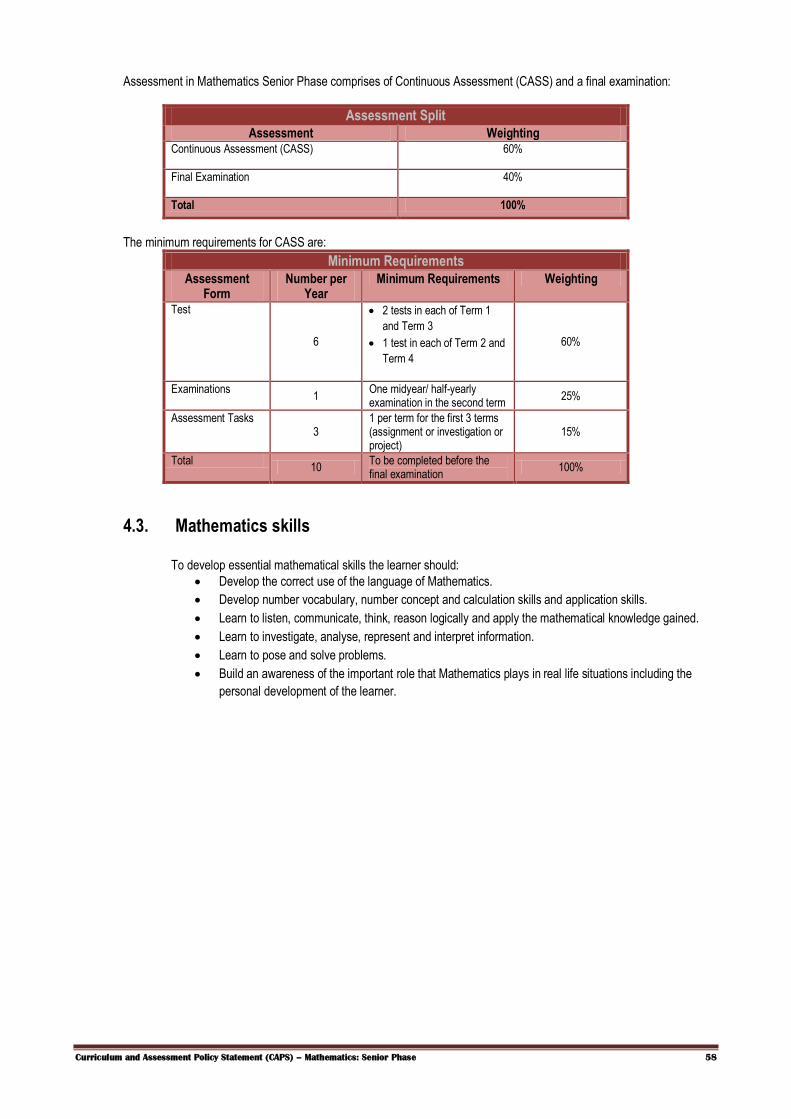
Curriculum and Assessment Policy Statement (CAPS) – Mathematics: Senior Phase 58
Assessment in Mathematics Senior Phase comprises of Continuous Assessment (CASS) and a final examination:
Assessment Split
Assessment Weighting Continuous Assessment (CASS) 60%
Final Examination 40%
Total 100%
The minimum requirements for CASS are:
Minimum Requirements
Assessment Form
Number per Year
Minimum Requirements Weighting
Test
6
2 tests in each of Term 1
and Term 3
1 test in each of Term 2 and
Term 4
60%
Examinations 1
One midyear/ half-yearly examination in the second term
25%
Assessment Tasks 3
1 per term for the first 3 terms (assignment or investigation or project)
15%
Total 10
To be completed before the final examination
100%
4.3. Mathematics skills
To develop essential mathematical skills the learner should:
Develop the correct use of the language of Mathematics.
Develop number vocabulary, number concept and calculation skills and application skills.
Learn to listen, communicate, think, reason logically and apply the mathematical knowledge gained.
Learn to investigate, analyse, represent and interpret information.
Learn to pose and solve problems.
Build an awareness of the important role that Mathematics plays in real life situations including the
personal development of the learner.

Curriculum and Assessment Policy Statement (CAPS) – Mathematics: Senior Phase 59
4.4. Cognitive levels
The four cognitive levels used to guide all assessment tasks is based on those suggested in the TIMSS study of 1999. Descriptors for each level and the approximate percentages of tasks, tests and examinations which should be at each level are given below:
DESCRIPTION AND EXAMPLES OF COGNITIVE LEVELS
Cognitive levels Description of skills to be demonstrated Examples Knowledge
25%
Estimation and appropriate rounding of numbers.
Straight recall.
Identification and direct use of correct formula.
Use of mathematical facts.
Appropriate use of mathematical vocabulary.
1. Estimate the answer and then calculate with a calculator: 62 816
325 + 279 [Grade 7]
2. Use the formula 𝐴 = 𝜋𝑟2 to calculate the area of a circle if the diameter is equal to 10 cm. [Grade 8]
3. Write down the y-intercept the function 𝑦 = 2𝑥 + 1 [Grade 9]
Routine procedures
45%
Perform well-known procedures.
Simple applications and calculations which might involve many steps.
Derivation from given information may be involved.
Identification and use (after changing the subject) of correct formula.
Generally similar to those encountered in class.
1. Determine the mean of 5 Grade 7 learners marks if they have respectively achieved 25; 40; 21; 85; 14 out
of 50. [Grade 7]
2. Solve for 𝑥 in 𝑥 − 6 = 9 [Grade 8]
3. R600 invested at r% per annum for a period of 3 years yields R150 interest. Calculate the value of r if
= 𝑃.𝑛 .𝑟
100 . [Grade 9]
Complex procedures
20%
Problems involve complex calculations and/or higher order reasoning.
Investigate elementary axioms to generalise them into proofs for straight line geometry, congruence and similarity.
There is often not an obvious route to the solution.
Problems need not be based on a real world context.
Could involve making significant connections between different representations.
Require conceptual understanding.
1. Mr Mnisi pays R75 for a book which he marks to give 20% profit. He then sells it for cash at 4% discount.
Calculate the selling price. [Grade 7]
2. A car travelling at a constant speed travels 60 km in 18 minutes. How far, travelling at the same constant
speed, will the car travel in 1 hour 12 minutes? [Grade 8]
3. Use investigation skills to prove that the angles on a straight line are supplementary. [Grade 9]
Problem solving
10%
Unseen, non-routine problems (which are not necessarily difficult).
Higher order understanding and processes are often involved.
Might require the ability to break the problem down into its constituent parts.
1. The sum of three consecutive numbers is 87. Find the numbers. [Grade 7]
2. Mary travels a distance of 𝑥 km in 6 hours if she travels at an average speed of 20 km/hour on her bicycle.
What should be her average speed if she wants to cover the same distance in 5 hours. [Grade 8]
3. The combined age of a father and son is 84 years old. In 6 year’s time the father will be twice as old as the
son was 3 years ago. How old are they now? [Grade 9]