Embed Size (px)
Citation preview
Current world fertilizer trends
and outlook to 2015
FOOD AND AGRICULTURE ORGANIZATION OF THE UNITED NATIONS
Rome, 2011
2
Contents
Preface 5
Executive summary 6
The world fertilizer outlook 7
Background 7
Demand 10
Demand for fertilizer nutrients 10
Nitrogen 11
Phosphate 12
Potash 13
Total demand for primary nutrients 14
Supply 15
Nitrogen 15
Phosphate 16
Potash 17
Supply/demand balance 18
Nitrogen 19
Phosphate 19
Potash 19
The regional fertilizer situation 19
Africa 19
America 20
Asia 21
Europe 22
Oceania 23
Annexes
1. Explanatory notes on supply, demand and balance 26
2. World and regional nitrogen fertilizer demand forecast 27
3. World and regional phosphate fertilizer demand forecast 28
4. World and regional potash fertilizer demand forecast 29
5. World and regional nitrogen supply, demand and balance 30
6. World and regional phosphate supply, demand and balance 33
7. World and regional potash supply, demand and balance 37
8. Regional classification of countries and territories 40
3
List of tables
1. World production of major crops 8
2. Output and fertilizer input price indices 10
3. World demand for fertilizer nutrients, 2011-2015 11
4. World and regional growth in fertilizer demand, 2011-2015 11
5. World total demand for primary nutrients, 2011-2015 14
6. World supply of ammonia, phosphoric acid and potash, 2011-2015 15
7. World potential balance of nitrogen, phosphate and potash, 2011-2015 18
8. Africa fertilizer forecast, 2011-2015 20
9. America fertilizer forecast, 2011-2015 20
10. Asia fertilizer forecast, 2011-2015 21
11. Europe fertilizer forecast, 2011-2015 22
12. Oceania fertilizer forecast, 2011-2015 23
13. Regional and sub-regional potential balance of nitrogen, phosphate
and potash, 2011-2015 24
4
List of figures
1. Annual food price indices 9
2. Global nutrients (N+P2O5+K2O) consumption 10
3. Regional and sub-regional share of world increase
in nitrogen fertilizer consumption, 2011-2015 12
4. Regional and sub-regional share of world increase
in phosphate fertilizer consumption, 2011-2015 13
5. Regional and sub-regional share of world increase
in potash fertilizer consumption, 2011-2015 14
6. Regional and sub-regional share of world increase
in ammonia supply, 2011-2015 16
7. Regional and sub-regional share of world increase
in phosphoric acid supply, 2011-2015 17
8. Regional and sub-regional share of world increase
in potash supply, 2011-2015 18
9. Regional nutrient balance in 2015 25
5
Preface
This report presents the world nitrogen, phosphate and potassium fertilizer medium-
term supply and demand projections for the period 2011-2015. The FAO/Fertilizer
Organizations Working Group met in FAO, Rome in June 2011 to review the
prospects for fertilizer demand and supply, and made the forecasts.
The Working Group comprised:
EFMA European Fertilizer Manufacturers Association (unable to attend)
FAI Fertiliser Association of India
IFA International Fertilizer Industry Association
IFDC International Center for Soil Fertility and Agricultural Development
IMPHOS World Phosphate Institute
K+S K+S KALI GmbH
TFI The Fertilizer Institute (unable to attend)
FAO Food and Agriculture Organization of the United Nations
Annex 1 presents explanatory notes on potential supply, demand and balance.
Annexes 2, 3, and 4 present world and regional (listed in Annex 8) fertilizer demand
forecasts for nitrogen, phosphate, and potash, respectively. Annexes 5, 6 and 7 present
world and regional potential supply, demand and balance for the three primary
nutrients. Name plate capacity, operating rates and demand for fertilizers vary from
year to year.
All references relating to fertilizers are in terms of three primary nutrients, viz.,
nitrogen (N), phosphate (P2O5) and potash (K2O). The fertilizer demand and supply
data refer to the calendar year.
FAO, in collaboration with experts from the Working Group dealing with fertilizer
production, consumption and trade, annually provides five-year forecasts of world and
regional fertilizer supply, demand and potential balance. The contributions made by
the members of the Working Group are gratefully acknowledged. Preparation of the
document by Mr. T. K. Chanda, Additional Director, The Fertiliser Association of
India is sincerely acknowledged. Editing of the document by Mr. Christian Nolte,
Senior Officer, FAO and collection of data and assistance in compilation by Ms.
Christina Vella Tomlin, FAO, Rome are gratefully acknowledged.
6
Executive summary
The world economy has been recovering from 2010 after the spike in commodity
prices followed by deep recession experienced in the preceeding two years. The
recovery is driven by improvement in financial conditions, buoyant activity in many
emerging and developing economies, and growing confidence in advanced
economies. World production of major crops is expected to increase in 2011 which
may ease the prevailing tight market situation. World food prices have been strongly
on the rise surpassing the earlier peak of 2008. Consumption of fertilizer nutrients
increased significantly in 2010 and is expected to grow in a stabilized way during the
following years of the forecast period. World demand for total fertilizer nutrients is
estimated to grow at 2.0 percent per annum from 2011 to 2015. The demand for
nitrogen, phosphate, and potash is forecast to grow annually by 1.7, 1.9, and 3.1
percent, respectively, during the period. Global total nutrient production rose
significantly in 2010 keeping pace with world consumption. Over the next five years,
the global capacity of fertilizer products, intermediates and raw materials would
further increase.
The world potential nitrogen balance as a percentage of global total demand is
expected to remain between 3 to 5 percent between 2011 and 2013 and is likely to
increase to 7 percent in 2014 and 10 percent in 2015. The potential phosphate balance
is likely to grow from 3 percent in 2011 to 6 per cent by 2015. The potential potash
balance as a percentage of global total demand is expected to rise from 24 percent in
2011 to a high level of 44 percent in 2015.
The Africa region is likely to remain a major exporter of phosphate, followed by
nitrogen but would continue to depend solely on import of potash. North America
would increasingly rely on nitrogen fertilizer import. Its phosphate export may come
down slowly and the potash balance of the sub-region is expected to increase. Latin
America is expected to increase its export of nitrogen. Its import of phosphate and
potash would continue to decline.The dependence of East Asia on nitrogen import is
expected to remain modest over the years and import of potash would grow
significantly during the period. The sub-region would, however, continue to be a net
exporter of phosphate during the period. But the potential balance of phosphate would
come down by 2015. West Asia is in surplus in all the three nutrients. It is a major
contributor to global nitrogen supply. The sub-region has a small surplus of phosphate
for exports which is expected to grow in the coming years. South Asia would continue
to remain deficit in all the three nutrients during the forecast period. The deficit in
nitrogen balance might reduce slightly by the end of the projected period if the plants
under construction / planned are commissioned as per schedule. The deficit balance of
phosphate and potash in the sub-region would continue to rise during the forecast
period. The major contribution in Europe in the nitrogen, phosphate, and potash
surplus is from East Europe & Central Asia. It has the largest potential balance of
nitrogen and potash in the world. West Europe would continue to remain surplus in
potash and deficit in nitrogen and phosphate. Central Europe would continue to be
deficit in phosphate and potash. The surplus balance of nitrogen in the sub-region will
marginally decline. The Oceania region would continue to be deficit in nitrogen and
slowly move toward close to balance in 2015. With regard to phosphate and potash,
the region would continue to remain deficit during the period.
7
The world fertilizer outlook
BACKGROUND
The global economic and financial situation impacts agriculture and demand for
fertilizer. The world fertilizer outlook, therefore, needs to be viewed from the
perspective of the world economic growth. The report begins with a background of
the world economic growth; followed by developments in agricultural production;
input (fertilizer) output prices; and thereafter presents the details of regional and
global supply, demand, and potential balance of fertilizers in the coming years on a
mid-term basis.
The world economy has been recovering from 2010 after the spike in commodity
prices followed by deep recession experienced in 2008-09. Economic recovery is
continuing as a result of improvement in financial conditions in varying degrees in
various countries, buoyant activity in many emerging and developing economies, and
growing confidence in advanced economies. According to the International Monetary
Fund (World Economic Outlook, April 2011), the global growth is projected to reach
4.4 percent and 4.5 per cent in 2011 and 2012, respectively, from 5 per cent achieved
in 2010. Advanced economies are expected to grow by 2.4 percent in 2011 and 2.6
per cent in 2012 from 3 per cent in 2010. Growth in emerging and developing
economies is projected to be 6.5 percent during 2011 and 2012 as against 7.3 per cent
in 2010. The global recovery is continuing with varying speed and direction with
large output gaps in advanced economies and closing gaps in emerging and
developing economies. In advanced economies, investment is recovering due to low
interest rates and improved financial conditions in some countries contributing to a
rebound in industry growth. In large part of Latin America, Asia and in low-income
countries in sub-Saharan Africa, the recovery has raised the output back to pre-crisis
peak level. Some of these economies have already moved into higher output
trajectory. Activity in these economies is being driven by favourable macroeconomic
policies, rising exports and commodity prices, and in many cases, more capital
inflows. However, the economic prospects in the Middle East are diverse and still
uncertain. The activities in economies of Commonwealth of Independent States (CIS)
are also rebounding. However, IMF forecasts that inflation pressure may broaden. In
advanced economies, headline inflation is projected to return below 2 percent in 2011,
settling at about 1½ percent during the course of 2012 as food and energy price hikes
continue and wages increase only gradually. In emerging and developing economies,
inflation pressure is broadening with the headline inflation at close to 7 percent in
2011 and expected to recede to below 5 percent in 2012.
Agricultural outlook
The FAO Food Outlook, June 2011 predicts an increase in world production of major
crops in 2011 which is expected to ease the prevailing tight market situation.
However, this is not expected to replenish stocks sufficiently. FAO’s first forecast for
world cereal production in 2011 points a record increase of 3.5 percent after a 1
percent decline in 2010. The main reasons for the projected increase are due to
expectations of recoveries in yield and larger plantings.
Global wheat output is expected to be 3.2 percent up to nearly 674 million tonnes, in
2011 from last year’s reduced crop, mostly reflecting improved yield prospects in the
8
Russian Federation. World production will not be sufficient to meet the expected
demand, in spite of demand not rising as fast as in the previous season.
The outlook for coarse grains for nearly all major producing countries is favourable
and world production is forecast to reach a new high of 1 165 million tonnes, up 3.9
percent from 2010. However, this expected output may be just sufficient to meet
anticipated utilization in 2011/12. Most of this increase is expected in the United
States and the Commonwealth of Independent States (CIS).
Global rice production is estimated to have risen by 1.8 percent to a new record in
2010. The early outlook for the 2011 crop is also positive, with the sector foreseen to
grow by 2.6 percent under expectations of more normal weather conditions and steady
support from governments. With global production outpacing consumption, world rice
stocks in 2011 are forecast to reach their highest level since 2002. Under current
prospects for a continued expansion of world output, world rice reserves may rise
further in 2012.
Table 1 presents the world production of major crops in recent years and forecast for
2011/12.
Table1
World production of major crops (million tonnes)
2008/09 2009/10 2010/11
(estimate)
2011/12
(forecast)
Wheat 684.8 684.7 652.6 673.6
Coarse grain 1 142.4 1 122.3 1 121.3 1 165.4
Rice 458.5 455.6 463.8 475.9
Total cereals 2 285.5 2 262.7 2 237.6 2 314.9
Sugar 151.0 156.6 165.7
Oil seeds 409.7 456.0 464.7
Source: Various issues of Food Outlook, FAO, Rome
Input and output prices
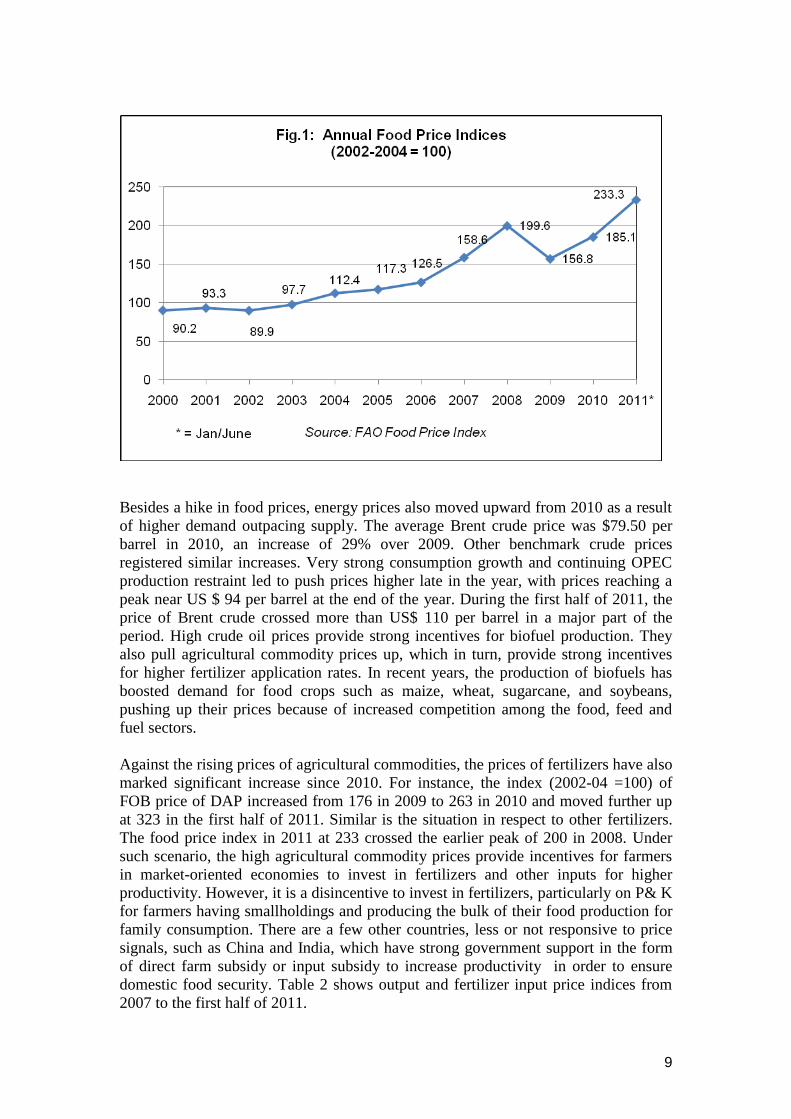
The Food Price Index of the Food and Agriculture Organization of the United Nations
(FAO) shows a strong upward movement, particularly since July 2010 as extreme
weather condtitions in major producing countries resulted in smaller than expected
harvests. Drought in Russia with the subsequent restrictions by the Government on
grain export, unfavourable weather in the USA and Europe, heavy rains and floods in
Pakistan and Australia led to reduced production of wheat and coarse cereals. Since
the beginning of 2011, the index remains above the 2008 peak values, led by firm
sugar, wheat, maize and vegetable oil prices. Rice prices, however, are significantly
below their 2008 peak. Fig.1 shows the movement in annual food price indices from
2000 to the first half of 2011.
9
Besides a hike in food prices, energy prices also moved upward from 2010 as a result
of higher demand outpacing supply. The average Brent crude price was $79.50 per
barrel in 2010, an increase of 29% over 2009. Other benchmark crude prices
registered similar increases. Very strong consumption growth and continuing OPEC
production restraint led to push prices higher late in the year, with prices reaching a
peak near US $ 94 per barrel at the end of the year. During the first half of 2011, the
price of Brent crude crossed more than US$ 110 per barrel in a major part of the
period. High crude oil prices provide strong incentives for biofuel production. They
also pull agricultural commodity prices up, which in turn, provide strong incentives
for higher fertilizer application rates. In recent years, the production of biofuels has
boosted demand for food crops such as maize, wheat, sugarcane, and soybeans,
pushing up their prices because of increased competition among the food, feed and
fuel sectors.
Against the rising prices of agricultural commodities, the prices of fertilizers have also
marked significant increase since 2010. For instance, the index (2002-04 =100) of
FOB price of DAP increased from 176 in 2009 to 263 in 2010 and moved further up
at 323 in the first half of 2011. Similar is the situation in respect to other fertilizers.
The food price index in 2011 at 233 crossed the earlier peak of 200 in 2008. Under
such scenario, the high agricultural commodity prices provide incentives for farmers
in market-oriented economies to invest in fertilizers and other inputs for higher
productivity. However, it is a disincentive to invest in fertilizers, particularly on P& K
for farmers having smallholdings and producing the bulk of their food production for
family consumption. There are a few other countries, less or not responsive to price
signals, such as China and India, which have strong government support in the form
of direct farm subsidy or input subsidy to increase productivity in order to ensure
domestic food security. Table 2 shows output and fertilizer input price indices from
2007 to the first half of 2011.
10
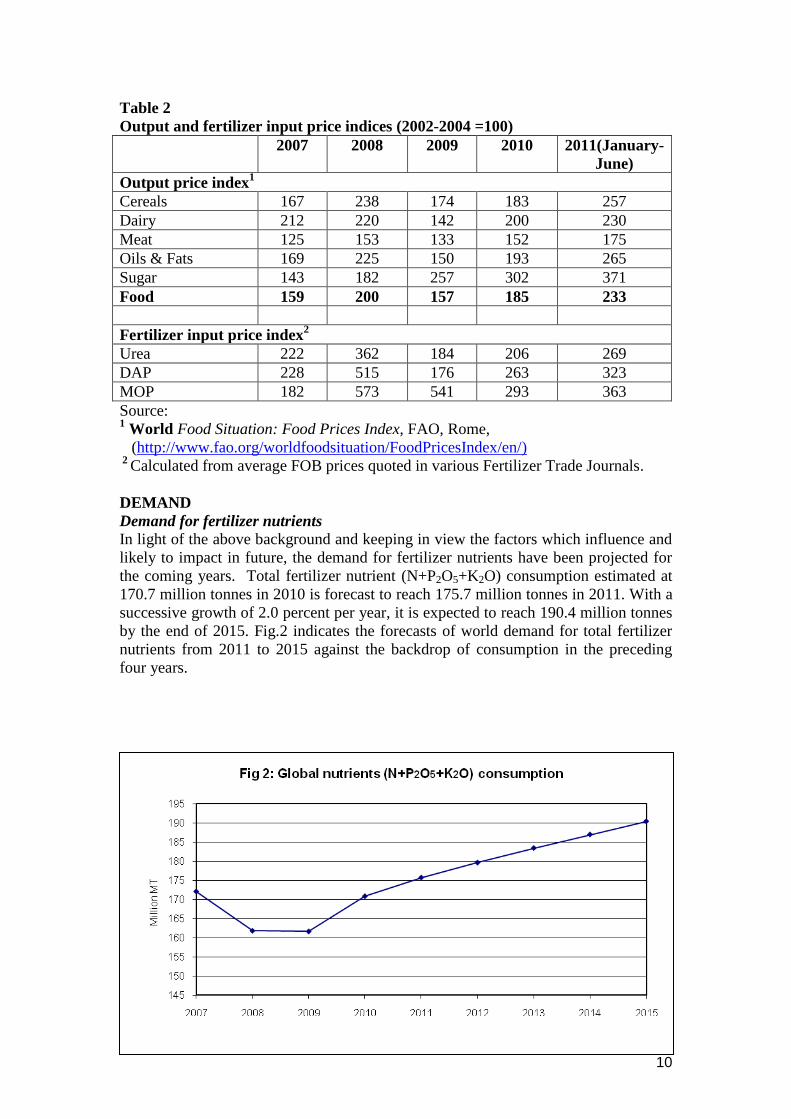
Table 2
Output and fertilizer input price indices (2002-2004 =100)
2007 2008 2009 2010 2011(January-
June)
Output price index1
Cereals 167 238 174 183 257
Dairy 212 220 142 200 230
Meat 125 153 133 152 175
Oils & Fats 169 225 150 193 265
Sugar 143 182 257 302 371
Food 159 200 157 185 233
Fertilizer input price index2
Urea 222 362 184 206 269
DAP 228 515 176 263 323
MOP 182 573 541 293 363
Source: 1 World Food Situation: Food Prices Index, FAO, Rome,
(http://www.fao.org/worldfoodsituation/FoodPricesIndex/en/) 2
Calculated from average FOB prices quoted in various Fertilizer Trade Journals.
DEMAND
Demand for fertilizer nutrients
In light of the above background and keeping in view the factors which influence and
likely to impact in future, the demand for fertilizer nutrients have been projected for
the coming years. Total fertilizer nutrient (N+P2O5+K2O) consumption estimated at
170.7 million tonnes in 2010 is forecast to reach 175.7 million tonnes in 2011. With a
successive growth of 2.0 percent per year, it is expected to reach 190.4 million tonnes
by the end of 2015. Fig.2 indicates the forecasts of world demand for total fertilizer
nutrients from 2011 to 2015 against the backdrop of consumption in the preceding
four years.
11
The forecasts of demand for three main plant nutrients covering regions and the world
for 2011 to 2015 are presented in Annexes 2, 3 and 4. The global demand for fertilizer
nutrients are summarized in Table 3.
Table 3
World demand for fertilizer nutrients, 2011-2015 (thousand tonnes)
Year 2011 2012 2013 2014 2015
Nitrogen (N) 105 348 107 374 109 299 111 109 112 909
Phosphate
(P2O5) 41 679 42 562 43 435 44 245 45 015
Potash (K2O) 28 679 29 682 30 683 31 594 32 453
Total (N+
P2O5+K2O) 175 706 179 618 183 417 186 948 190 377
In 2011, the world demand for nitrogen, phosphate and potash is forecast to grow by
2.2, 2.8 and 5.3 percent, respectively, over the previous year. The world and regional
annual growth rate in fertilizer demand between 2011 and 2015 is given in Table 4.
The world demand for nitrogen, phosphate and potash is forecast to grow annually by
1.7, 1.9 and 3.1 percent, respectively, between 2011 and 2015.
Table 4
World and regional growth in fertilizer demand, 2011 to 2015
Region Annual growth rate (Compound)
N P2O5 K2O Total
(N+P2O5+K2O)
World 1.7% 1.9% 3.1% 2.0%
Africa 1.9% 3.3% 4.3% 2.5%
America 1.6% 2.3% 2.3% 1.9%
- North America 0.8% 0.9% 1.2% 0.9%
- Latin America 3.1% 3.5% 3.3% 3.3%
Asia 1.9% 1.7% 4.0% 2.1%
- West Asia 2.9% 2.9% 6.7% 3.2%
- South Asia 2.6% 2.9% 2.7% 2.7%
- East Asia 1.4% 0.9% 4.4% 1.8%
Europe 1.3% 1.7% 2.1% 1.5%
- Central Europe 2.3% 4.5% 3.2% 2.8%
- West Europe -0.2% -0.7% 1.0% -0.1%
- East Europe & Central
Asia 3.5% 3.5% 3.2% 3.4%
Oceania 1.0% 2.8% 4.3% 2.1%
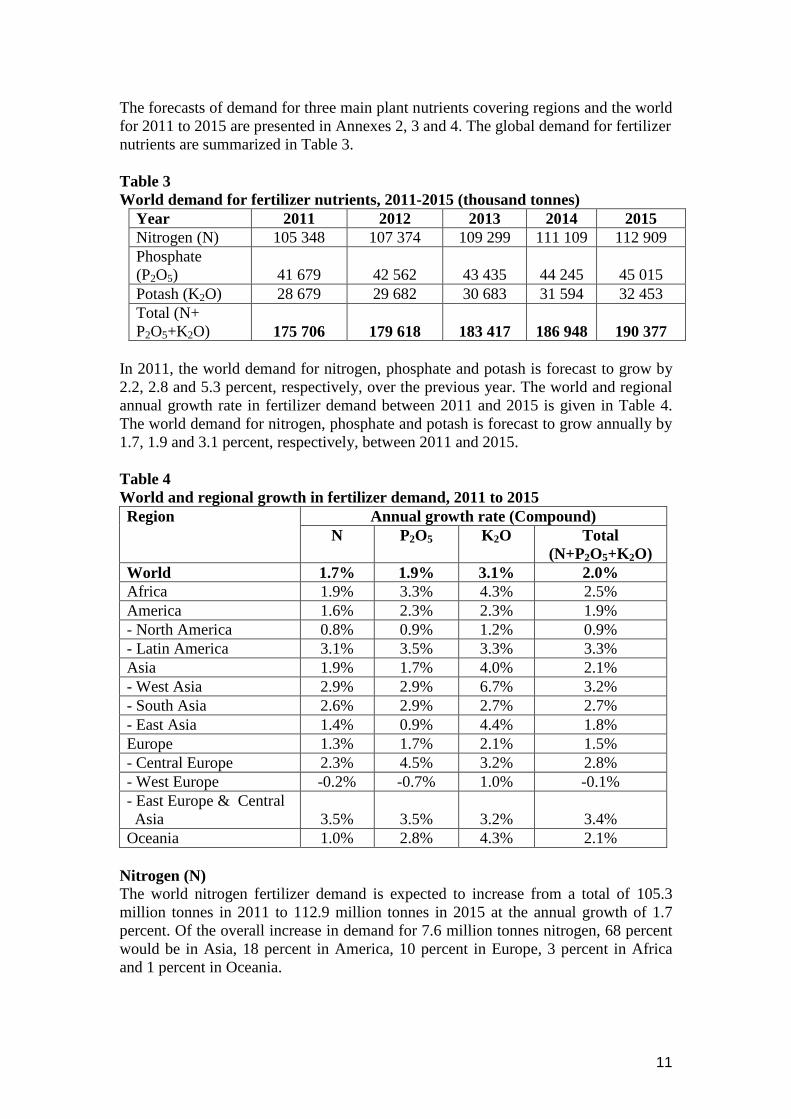
Nitrogen (N)
The world nitrogen fertilizer demand is expected to increase from a total of 105.3
million tonnes in 2011 to 112.9 million tonnes in 2015 at the annual growth of 1.7
percent. Of the overall increase in demand for 7.6 million tonnes nitrogen, 68 percent
would be in Asia, 18 percent in America, 10 percent in Europe, 3 percent in Africa
and 1 percent in Oceania.
12
Among the Asian countries, the bulk of the increase of world demand for nitrogen is
expected in India (25 percent) and China (24 percent), followed by Pakistan (5
percent), Vietnam and Indonesia (3 percent each). In America, the major share of
increase is expected in Brazil (6 percent) and USA (5 per cent). In Europe, the major
share of increase is expected in East Europe & Central Asia (8 per cent), mainly
contributed by Russia (4 per cent) and Ukraine (3 per cent). This is expected to be
followed by Central Europe (3 percent). In West Europe, there may be a nominal
decline in consumption during the period. The share of increase in Africa is expected
to be around 3 per cent, to be contributed mainly by Egypt, Morocco, Nigeria and
South Africa. Figure 3 shows the regional and sub-regional share of world increase in
nitrogen consumption between 2011 and 2015.
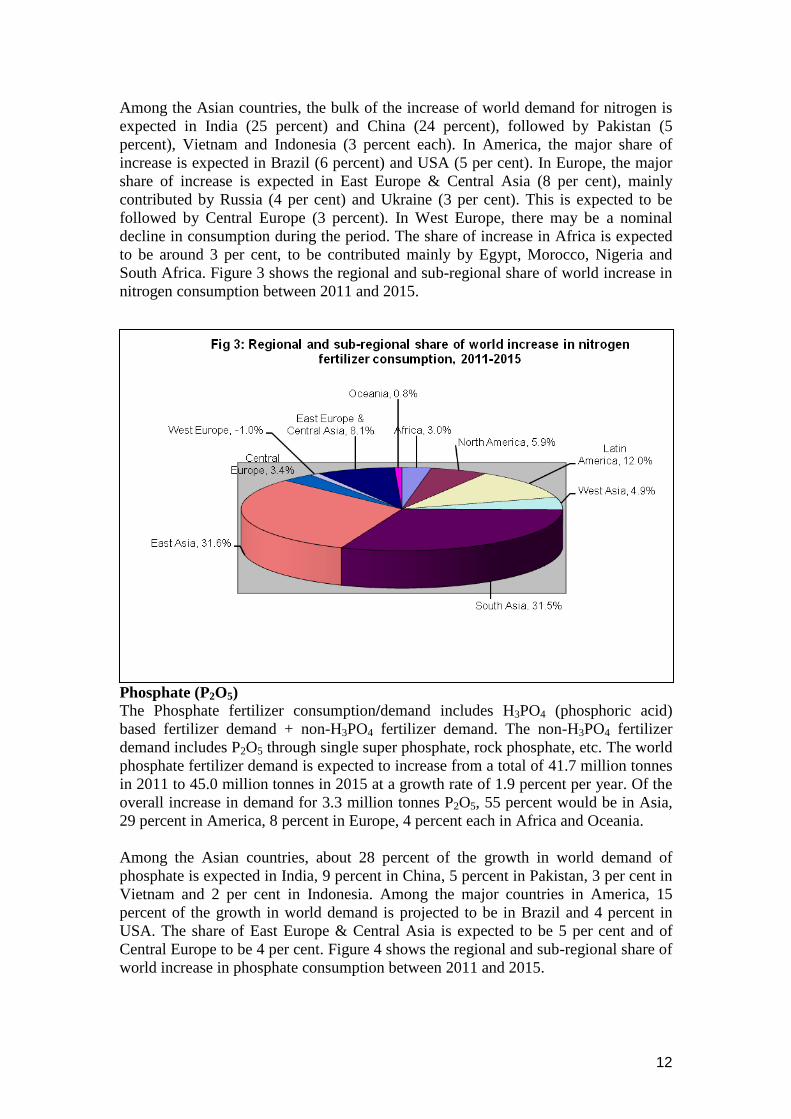
Phosphate (P2O5)
The Phosphate fertilizer consumption/demand includes H3PO4 (phosphoric acid)
based fertilizer demand + non-H3PO4 fertilizer demand. The non-H3PO4 fertilizer
demand includes P2O5 through single super phosphate, rock phosphate, etc. The world
phosphate fertilizer demand is expected to increase from a total of 41.7 million tonnes
in 2011 to 45.0 million tonnes in 2015 at a growth rate of 1.9 percent per year. Of the
overall increase in demand for 3.3 million tonnes P2O5, 55 percent would be in Asia,
29 percent in America, 8 percent in Europe, 4 percent each in Africa and Oceania.
Among the Asian countries, about 28 percent of the growth in world demand of
phosphate is expected in India, 9 percent in China, 5 percent in Pakistan, 3 per cent in
Vietnam and 2 per cent in Indonesia. Among the major countries in America, 15
percent of the growth in world demand is projected to be in Brazil and 4 percent in
USA. The share of East Europe & Central Asia is expected to be 5 per cent and of
Central Europe to be 4 per cent. Figure 4 shows the regional and sub-regional share of
world increase in phosphate consumption between 2011 and 2015.
13
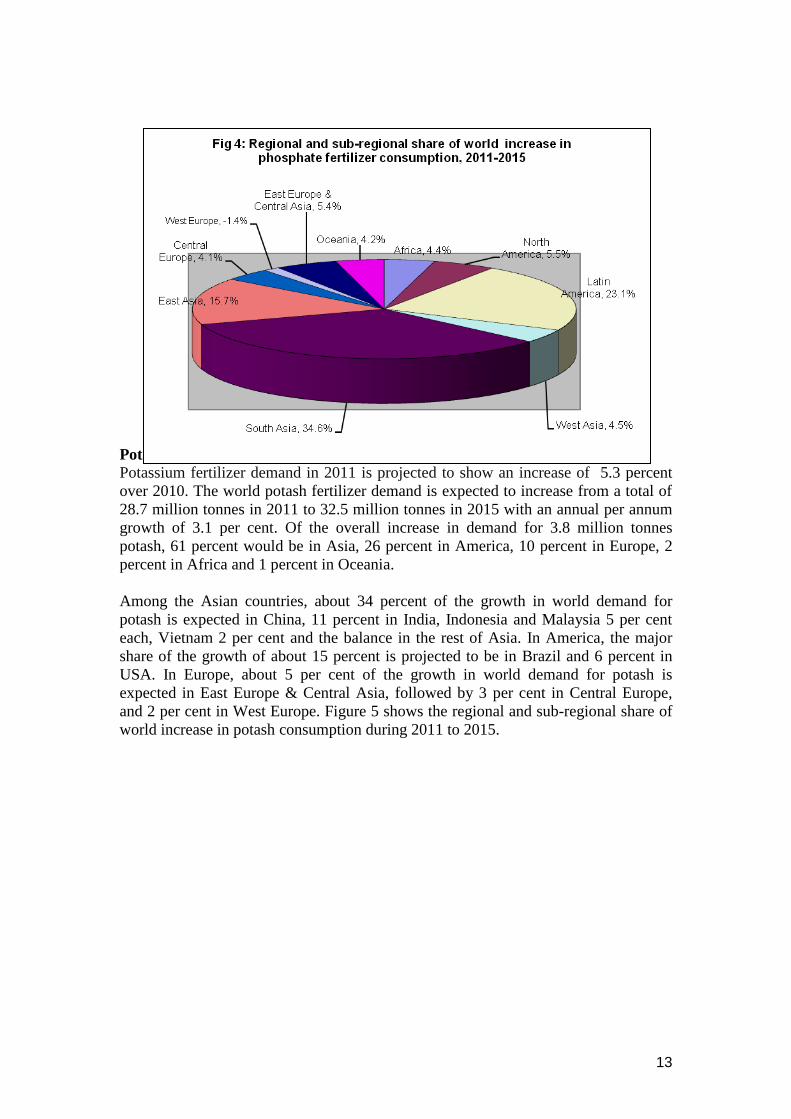
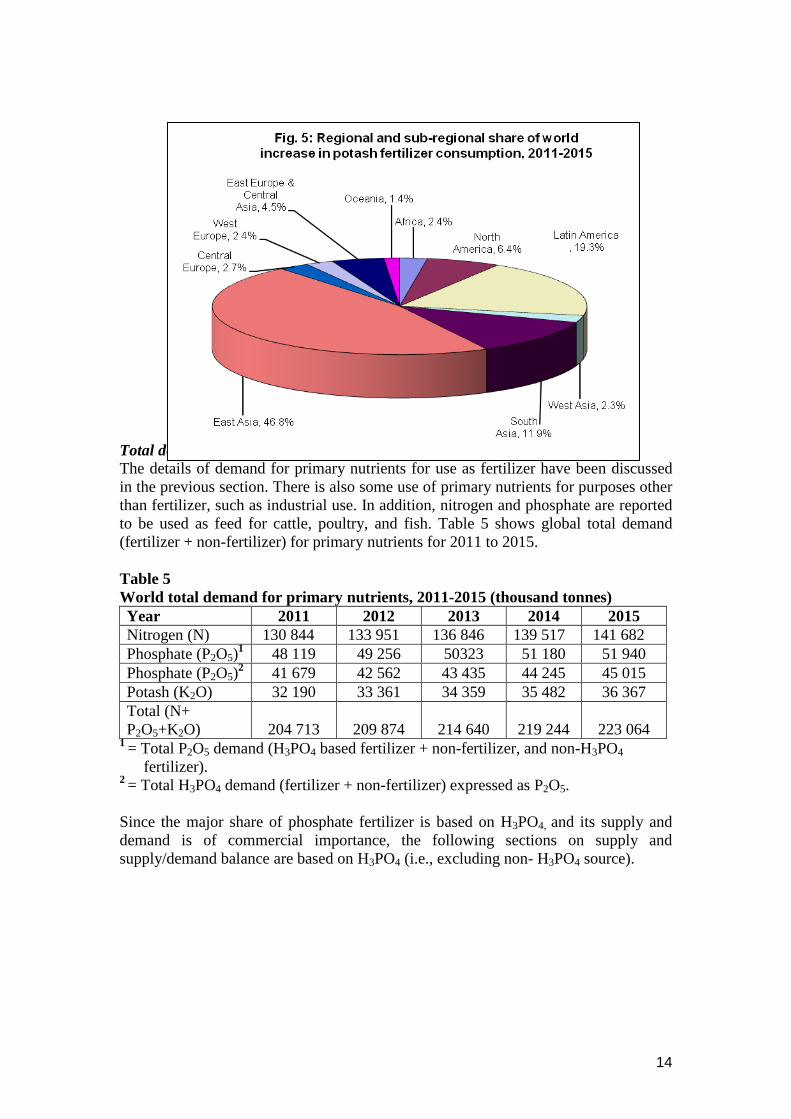
Potash (K2O)
Potassium fertilizer demand in 2011 is projected to show an increase of 5.3 percent
over 2010. The world potash fertilizer demand is expected to increase from a total of
28.7 million tonnes in 2011 to 32.5 million tonnes in 2015 with an annual per annum
growth of 3.1 per cent. Of the overall increase in demand for 3.8 million tonnes
potash, 61 percent would be in Asia, 26 percent in America, 10 percent in Europe, 2
percent in Africa and 1 percent in Oceania.
Among the Asian countries, about 34 percent of the growth in world demand for
potash is expected in China, 11 percent in India, Indonesia and Malaysia 5 per cent
each, Vietnam 2 per cent and the balance in the rest of Asia. In America, the major
share of the growth of about 15 percent is projected to be in Brazil and 6 percent in
USA. In Europe, about 5 per cent of the growth in world demand for potash is
expected in East Europe & Central Asia, followed by 3 per cent in Central Europe,
and 2 per cent in West Europe. Figure 5 shows the regional and sub-regional share of
world increase in potash consumption during 2011 to 2015.
14
Total demand for primary nutrients
The details of demand for primary nutrients for use as fertilizer have been discussed
in the previous section. There is also some use of primary nutrients for purposes other
than fertilizer, such as industrial use. In addition, nitrogen and phosphate are reported
to be used as feed for cattle, poultry, and fish. Table 5 shows global total demand
(fertilizer + non-fertilizer) for primary nutrients for 2011 to 2015.
Table 5
World total demand for primary nutrients, 2011-2015 (thousand tonnes)
Year 2011 2012 2013 2014 2015
Nitrogen (N) 130 844 133 951 136 846 139 517 141 682
Phosphate (P2O5)1
48 119 49 256 50323 51 180 51 940
Phosphate (P2O5)2 41 679 42 562 43 435 44 245 45 015
Potash (K2O) 32 190 33 361 34 359 35 482 36 367
Total (N+
P2O5+K2O) 204 713 209 874 214 640 219 244 223 064 1
= Total P2O5 demand (H3PO4 based fertilizer + non-fertilizer, and non-H3PO4
fertilizer). 2
= Total H3PO4 demand (fertilizer + non-fertilizer) expressed as P2O5.
Since the major share of phosphate fertilizer is based on H3PO4, and its supply and
demand is of commercial importance, the following sections on supply and
supply/demand balance are based on H3PO4 (i.e., excluding non- H3PO4 source).
15
SUPPLY
World fertilizer demand in 2010 was characterized by a stronger than anticipated
recovery in traditional markets and a sustained level of consumption in emerging
markets. Global total nutrient production rose by 10 per cent to 213.5 million tonne
nutrients, keeping pace with the rise in world consumption. Over the next five years,
global capacity and production of fertilizers would increase further. Table 6 shows the
world supply of ammonia, phosphoric acid and potash during 2011 to 2015. Regional
and sub-regional information is given in Annex 5, 6 and 7.
Table 6
World supply of ammonia, phosphoric acid and potash, 2011-2015 (thousand
tonnes)
Year 2011 2012 2013 2014 2015
Ammonia (as N) 134 546 140 197 143 751 149 910 156 346
Phosphoric acid
(as P2O5) 42 094 43 966 45 011 46 439 47 788
Potash (as K2O) 39 835 42 539 45 033 48 304 52 345
Nitrogen (N)
World ammonia capacity was 158.9 million tonnes (as N) in 2010. With the expected
addition in capacity of about 4.3 million tonnes, the total ammonia capacity is likely
to be 163.2 million tonnes (as N) in 2011. As a result of successive addition in
capacity each year, total ammonia capacity is expected to rise to 188.7 million tonnes
(as N) in 2015. The main additions to capacity would occur in East Asia, South Asia,
Africa, West Asia and Latin America. Of the total increase of 25.5 million tonnes
from 2011 to 2015, nearly 22 percent is expected to be added in East Asia and 19 per
cent in South Asia. About 21 percent of the increase in world ammonia capacity is
expected in Africa, 15 per cent in Latin America, 9 per cent in West Asia, 7 per cent
in East Europe and Central Asia, 4 percent in Oceania and 2 per cent in North
America. No increase in ammonia capacity is expected in West Europe. Central
Europe will more or less maintain its existing capacity.
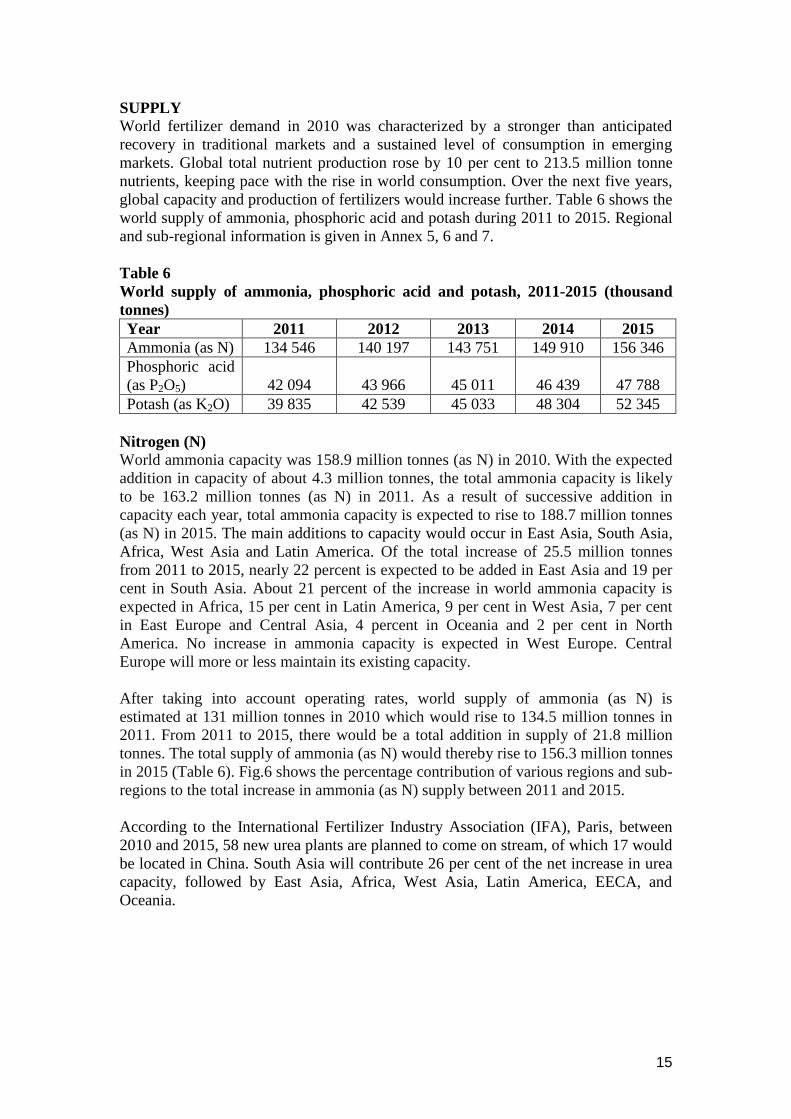
After taking into account operating rates, world supply of ammonia (as N) is
estimated at 131 million tonnes in 2010 which would rise to 134.5 million tonnes in
2011. From 2011 to 2015, there would be a total addition in supply of 21.8 million
tonnes. The total supply of ammonia (as N) would thereby rise to 156.3 million tonnes
in 2015 (Table 6). Fig.6 shows the percentage contribution of various regions and sub-
regions to the total increase in ammonia (as N) supply between 2011 and 2015.
According to the International Fertilizer Industry Association (IFA), Paris, between
2010 and 2015, 58 new urea plants are planned to come on stream, of which 17 would
be located in China. South Asia will contribute 26 per cent of the net increase in urea
capacity, followed by East Asia, Africa, West Asia, Latin America, EECA, and
Oceania.
16
Phosphate (P2O5) World phosphoric acid (as P2O5) capacity was about 48.5 million tonnes in 2010. A
modest increase of 2.9 million tonnes is expected in 2011 with the total rising to 51.4
million tonnes. By 2015, it is expected to rise to 57.6 million tonnes. Of the total 6.2
million tonnes addition in world capacity between 2011 and 2015, 46 percent addition
would take place in Asia, mainly in East Asia (China) and West Asia (Saudi Arabia
and Jordan). About 37 percent capacity would be added in Africa (Morocco and
Tunisia), 13 percent in Latin America, 8 per cent in East Europe & Central Asia and
1 per cent in Oceania. No addition in capacity is expected in Central and West
Europe. In North America, the capacity may rather decline by 4.5 per cent.
Expansions in China will account for one-third of this increase. According to IFA,
between 2010 and 2015, close to 34 new phosphoric acid units are planned for
completion, of which 15 would be located in China, 6 in Morocco and 3 in Saudi
Arabia. Only two stand-alone merchant units are expected to come on stream. Over
the next five years, close to 40 new units of MAP, DAP and TSP are planned to come
on stream in eleven countries.
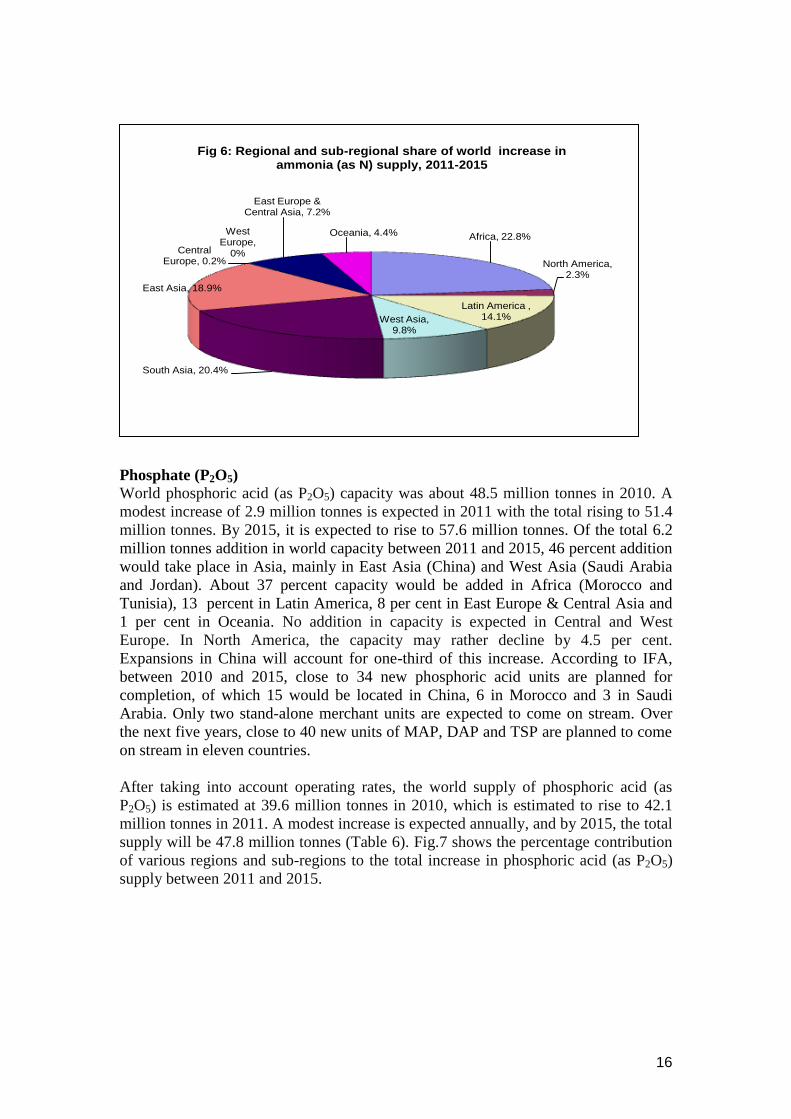
After taking into account operating rates, the world supply of phosphoric acid (as
P2O5) is estimated at 39.6 million tonnes in 2010, which is estimated to rise to 42.1
million tonnes in 2011. A modest increase is expected annually, and by 2015, the total
supply will be 47.8 million tonnes (Table 6). Fig.7 shows the percentage contribution
of various regions and sub-regions to the total increase in phosphoric acid (as P2O5)
supply between 2011 and 2015.
Africa, 22.8%
North America, 2.3%
Latin America , 14.1%West Asia,
9.8%
South Asia, 20.4%
East Asia, 18.9%
Central Europe, 0.2%
West Europe,
0%
East Europe & Central Asia, 7.2%
Oceania, 4.4%
Fig 6: Regional and sub-regional share of world increase in ammonia (as N) supply, 2011-2015
17
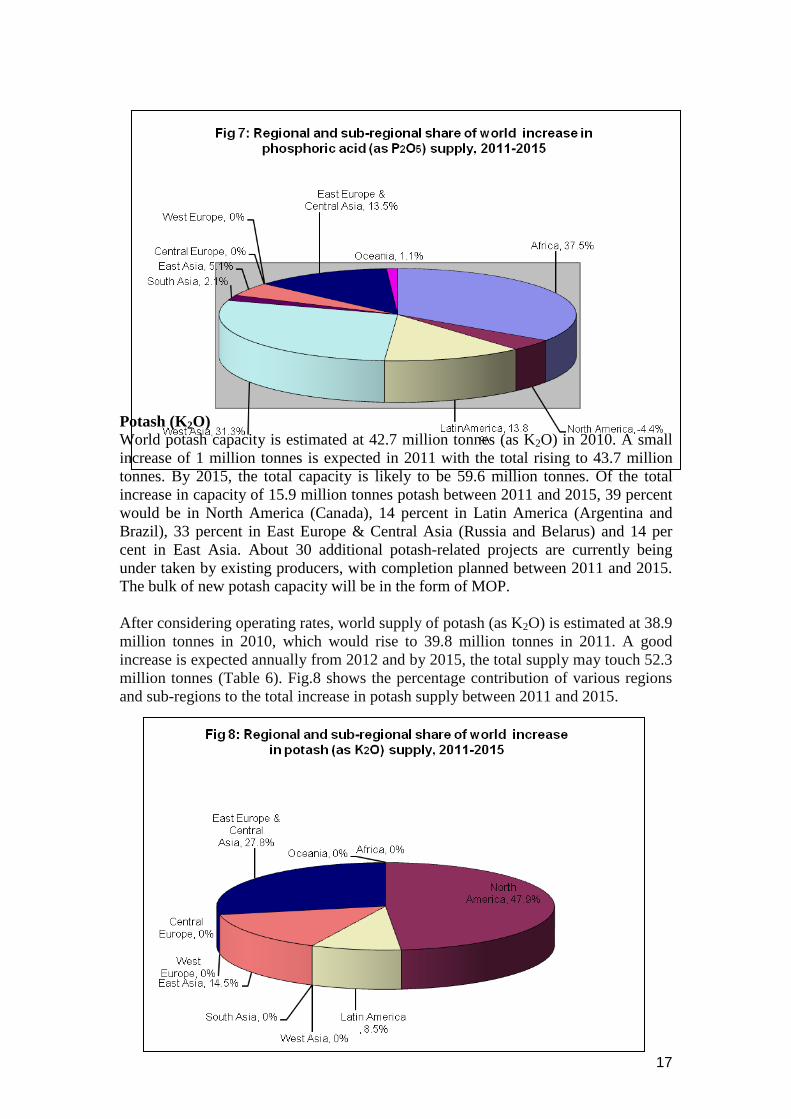
Potash (K2O)
World potash capacity is estimated at 42.7 million tonnes (as K2O) in 2010. A small
increase of 1 million tonnes is expected in 2011 with the total rising to 43.7 million
tonnes. By 2015, the total capacity is likely to be 59.6 million tonnes. Of the total
increase in capacity of 15.9 million tonnes potash between 2011 and 2015, 39 percent
would be in North America (Canada), 14 percent in Latin America (Argentina and
Brazil), 33 percent in East Europe & Central Asia (Russia and Belarus) and 14 per
cent in East Asia. About 30 additional potash-related projects are currently being
under taken by existing producers, with completion planned between 2011 and 2015.
The bulk of new potash capacity will be in the form of MOP.
After considering operating rates, world supply of potash (as K2O) is estimated at 38.9
million tonnes in 2010, which would rise to 39.8 million tonnes in 2011. A good
increase is expected annually from 2012 and by 2015, the total supply may touch 52.3
million tonnes (Table 6). Fig.8 shows the percentage contribution of various regions
and sub-regions to the total increase in potash supply between 2011 and 2015.
18
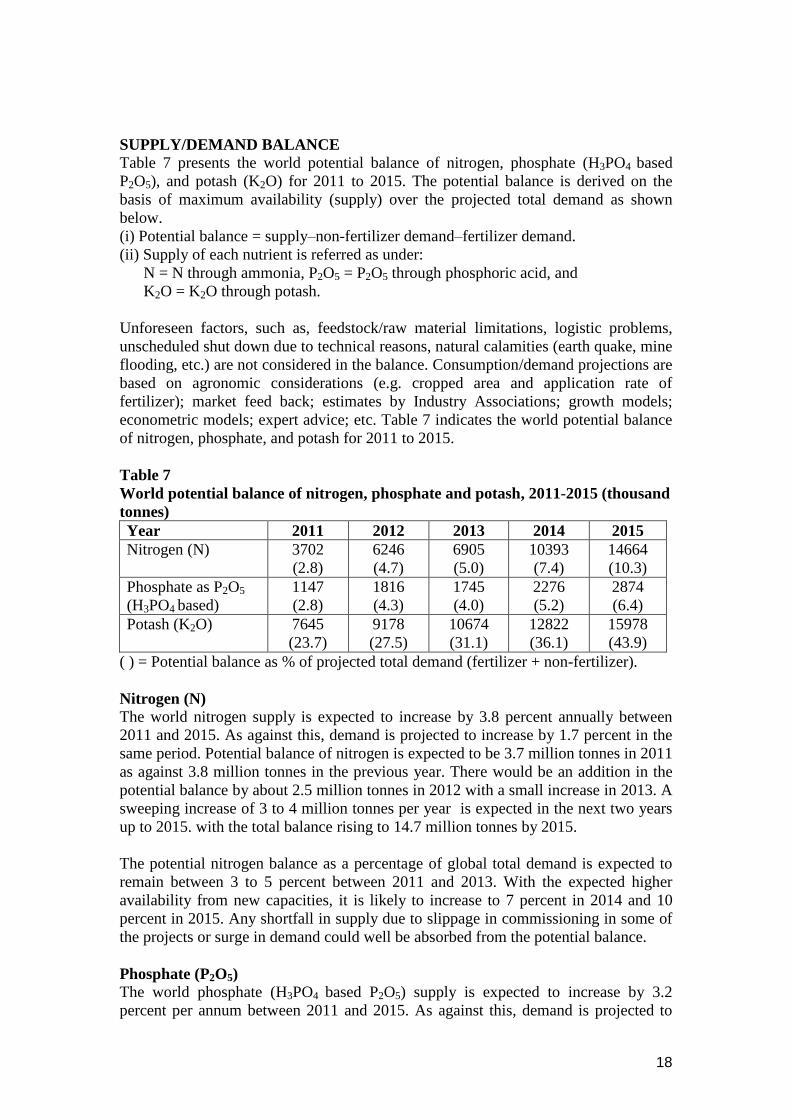
SUPPLY/DEMAND BALANCE Table 7 presents the world potential balance of nitrogen, phosphate (H3PO4 based
P2O5), and potash (K2O) for 2011 to 2015. The potential balance is derived on the
basis of maximum availability (supply) over the projected total demand as shown
below.
(i) Potential balance = supply–non-fertilizer demand–fertilizer demand.
(ii) Supply of each nutrient is referred as under:
N = N through ammonia, P2O5 = P2O5 through phosphoric acid, and
K2O = K2O through potash.
Unforeseen factors, such as, feedstock/raw material limitations, logistic problems,
unscheduled shut down due to technical reasons, natural calamities (earth quake, mine
flooding, etc.) are not considered in the balance. Consumption/demand projections are
based on agronomic considerations (e.g. cropped area and application rate of
fertilizer); market feed back; estimates by Industry Associations; growth models;
econometric models; expert advice; etc. Table 7 indicates the world potential balance
of nitrogen, phosphate, and potash for 2011 to 2015.
Table 7
World potential balance of nitrogen, phosphate and potash, 2011-2015 (thousand
tonnes)
Year 2011 2012 2013 2014 2015
Nitrogen (N) 3702
(2.8)
6246
(4.7)
6905
(5.0)
10393
(7.4)
14664
(10.3)
Phosphate as P2O5
(H3PO4 based)
1147
(2.8)
1816
(4.3)
1745
(4.0)
2276
(5.2)
2874
(6.4)
Potash (K2O) 7645
(23.7)
9178
(27.5)
10674
(31.1)
12822
(36.1)
15978
(43.9)
( ) = Potential balance as % of projected total demand (fertilizer + non-fertilizer).
Nitrogen (N)
The world nitrogen supply is expected to increase by 3.8 percent annually between
2011 and 2015. As against this, demand is projected to increase by 1.7 percent in the
same period. Potential balance of nitrogen is expected to be 3.7 million tonnes in 2011
as against 3.8 million tonnes in the previous year. There would be an addition in the
potential balance by about 2.5 million tonnes in 2012 with a small increase in 2013. A
sweeping increase of 3 to 4 million tonnes per year is expected in the next two years
up to 2015. with the total balance rising to 14.7 million tonnes by 2015.
The potential nitrogen balance as a percentage of global total demand is expected to
remain between 3 to 5 percent between 2011 and 2013. With the expected higher
availability from new capacities, it is likely to increase to 7 percent in 2014 and 10
percent in 2015. Any shortfall in supply due to slippage in commissioning in some of
the projects or surge in demand could well be absorbed from the potential balance.
Phosphate (P2O5)
The world phosphate (H3PO4 based P2O5) supply is expected to increase by 3.2
percent per annum between 2011 and 2015. As against this, demand is projected to
19
increase by 2.4 percent in the same period. The potential balance of phosphate is
expected to rise marginally from 1.1 million tonnes in 2011 to 2.9 million tonnes in
2015. The ratio of potential phosphate balance (H3PO4 based) as a percentage of
global phosphate demand (H3PO4 based P2O5) is likely to grow from 3 to 6 per cent
during the forecast period.
Potash (K2O)
World potash balance was 8.4 million tonnes in 2010 which reduced to 7.6 million
tonnes in 2011 in view of higher consumption in proportion to the increase in supply.
The demand for potash is projected to increase by 3.1 percent between 2011 and
2015. The world potash supply is expected to increase by 7.1 percent during the same
period. The potential balance is expected to rise significantly from 9.2 million tonnes
in 2012 to 16 million tonnes in 2015. The potential potash (K2O) balance as a
percentage of global total demand is expected to rise from 28 percent in 2012 to a
high level of 44 percent in 2015.
THE REGIONAL FERTILIZER SITUATION
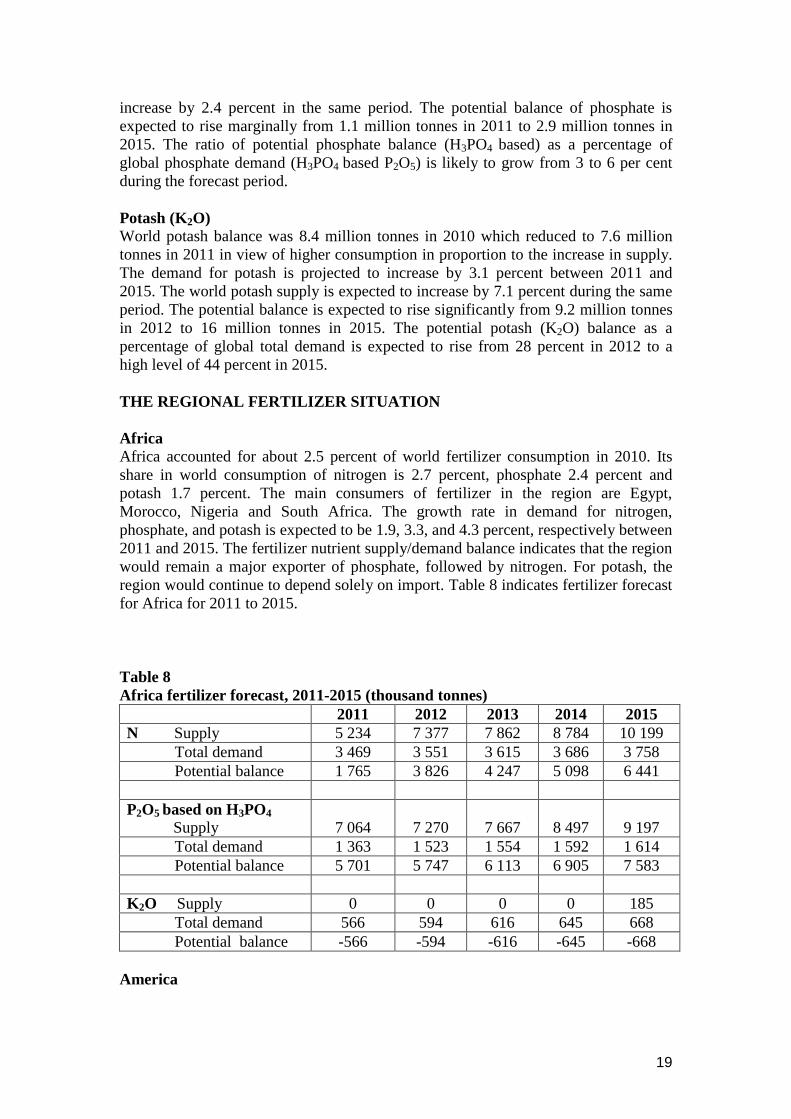
Africa Africa accounted for about 2.5 percent of world fertilizer consumption in 2010. Its
share in world consumption of nitrogen is 2.7 percent, phosphate 2.4 percent and
potash 1.7 percent. The main consumers of fertilizer in the region are Egypt,
Morocco, Nigeria and South Africa. The growth rate in demand for nitrogen,
phosphate, and potash is expected to be 1.9, 3.3, and 4.3 percent, respectively between
2011 and 2015. The fertilizer nutrient supply/demand balance indicates that the region
would remain a major exporter of phosphate, followed by nitrogen. For potash, the
region would continue to depend solely on import. Table 8 indicates fertilizer forecast
for Africa for 2011 to 2015.
Table 8
Africa fertilizer forecast, 2011-2015 (thousand tonnes)
2011 2012 2013 2014 2015
N Supply 5 234 7 377 7 862 8 784 10 199
Total demand 3 469 3 551 3 615 3 686 3 758
Potential balance 1 765 3 826 4 247 5 098 6 441
P2O5 based on H3PO4
Supply 7 064 7 270 7 667 8 497 9 197
Total demand 1 363 1 523 1 554 1 592 1 614
Potential balance 5 701 5 747 6 113 6 905 7 583
K2O Supply 0 0 0 0 185
Total demand 566 594 616 645 668
Potential balance -566 -594 -616 -645 -668
America
20
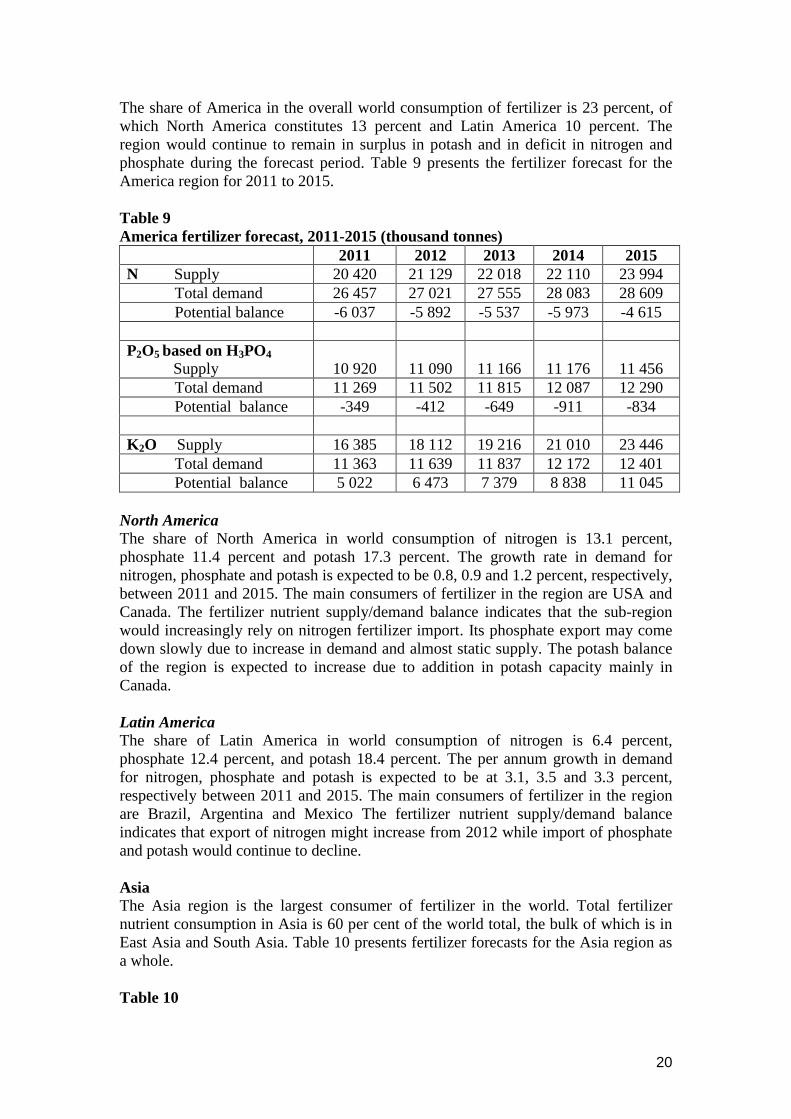
The share of America in the overall world consumption of fertilizer is 23 percent, of
which North America constitutes 13 percent and Latin America 10 percent. The
region would continue to remain in surplus in potash and in deficit in nitrogen and
phosphate during the forecast period. Table 9 presents the fertilizer forecast for the
America region for 2011 to 2015.
Table 9
America fertilizer forecast, 2011-2015 (thousand tonnes)
2011 2012 2013 2014 2015
N Supply 20 420 21 129 22 018 22 110 23 994
Total demand 26 457 27 021 27 555 28 083 28 609
Potential balance -6 037 -5 892 -5 537 -5 973 -4 615
P2O5 based on H3PO4
Supply 10 920 11 090 11 166 11 176 11 456
Total demand 11 269 11 502 11 815 12 087 12 290
Potential balance -349 -412 -649 -911 -834
K2O Supply 16 385 18 112 19 216 21 010 23 446
Total demand 11 363 11 639 11 837 12 172 12 401
Potential balance 5 022 6 473 7 379 8 838 11 045
North America
The share of North America in world consumption of nitrogen is 13.1 percent,
phosphate 11.4 percent and potash 17.3 percent. The growth rate in demand for
nitrogen, phosphate and potash is expected to be 0.8, 0.9 and 1.2 percent, respectively,
between 2011 and 2015. The main consumers of fertilizer in the region are USA and
Canada. The fertilizer nutrient supply/demand balance indicates that the sub-region
would increasingly rely on nitrogen fertilizer import. Its phosphate export may come
down slowly due to increase in demand and almost static supply. The potash balance
of the region is expected to increase due to addition in potash capacity mainly in
Canada.
Latin America
The share of Latin America in world consumption of nitrogen is 6.4 percent,
phosphate 12.4 percent, and potash 18.4 percent. The per annum growth in demand
for nitrogen, phosphate and potash is expected to be at 3.1, 3.5 and 3.3 percent,
respectively between 2011 and 2015. The main consumers of fertilizer in the region
are Brazil, Argentina and Mexico The fertilizer nutrient supply/demand balance
indicates that export of nitrogen might increase from 2012 while import of phosphate
and potash would continue to decline.
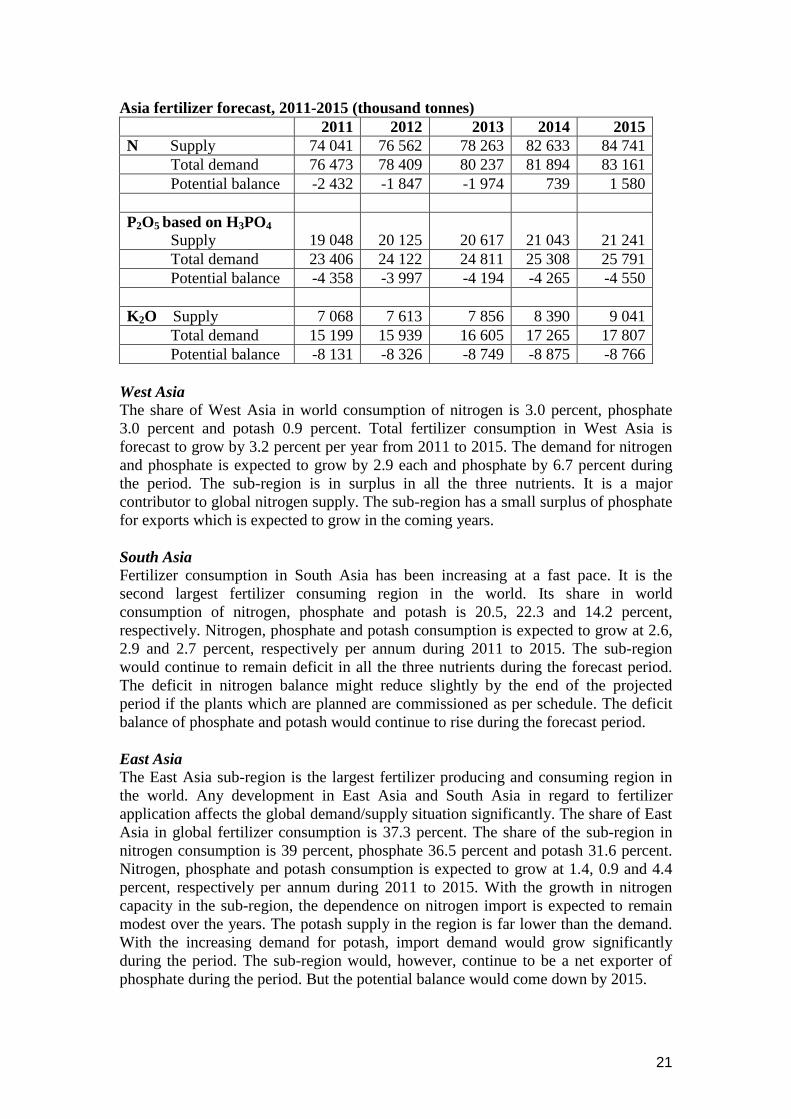
Asia
The Asia region is the largest consumer of fertilizer in the world. Total fertilizer
nutrient consumption in Asia is 60 per cent of the world total, the bulk of which is in
East Asia and South Asia. Table 10 presents fertilizer forecasts for the Asia region as
a whole.
Table 10
21
Asia fertilizer forecast, 2011-2015 (thousand tonnes)
2011 2012 2013 2014 2015
N Supply 74 041 76 562 78 263 82 633 84 741
Total demand 76 473 78 409 80 237 81 894 83 161
Potential balance -2 432 -1 847 -1 974 739 1 580
P2O5 based on H3PO4
Supply 19 048 20 125 20 617 21 043 21 241
Total demand 23 406 24 122 24 811 25 308 25 791
Potential balance -4 358 -3 997 -4 194 -4 265 -4 550
K2O Supply 7 068 7 613 7 856 8 390 9 041
Total demand 15 199 15 939 16 605 17 265 17 807
Potential balance -8 131 -8 326 -8 749 -8 875 -8 766
West Asia The share of West Asia in world consumption of nitrogen is 3.0 percent, phosphate
3.0 percent and potash 0.9 percent. Total fertilizer consumption in West Asia is
forecast to grow by 3.2 percent per year from 2011 to 2015. The demand for nitrogen
and phosphate is expected to grow by 2.9 each and phosphate by 6.7 percent during
the period. The sub-region is in surplus in all the three nutrients. It is a major
contributor to global nitrogen supply. The sub-region has a small surplus of phosphate
for exports which is expected to grow in the coming years.
South Asia Fertilizer consumption in South Asia has been increasing at a fast pace. It is the
second largest fertilizer consuming region in the world. Its share in world
consumption of nitrogen, phosphate and potash is 20.5, 22.3 and 14.2 percent,
respectively. Nitrogen, phosphate and potash consumption is expected to grow at 2.6,
2.9 and 2.7 percent, respectively per annum during 2011 to 2015. The sub-region
would continue to remain deficit in all the three nutrients during the forecast period.
The deficit in nitrogen balance might reduce slightly by the end of the projected
period if the plants which are planned are commissioned as per schedule. The deficit
balance of phosphate and potash would continue to rise during the forecast period.
East Asia
The East Asia sub-region is the largest fertilizer producing and consuming region in
the world. Any development in East Asia and South Asia in regard to fertilizer
application affects the global demand/supply situation significantly. The share of East
Asia in global fertilizer consumption is 37.3 percent. The share of the sub-region in
nitrogen consumption is 39 percent, phosphate 36.5 percent and potash 31.6 percent.
Nitrogen, phosphate and potash consumption is expected to grow at 1.4, 0.9 and 4.4
percent, respectively per annum during 2011 to 2015. With the growth in nitrogen
capacity in the sub-region, the dependence on nitrogen import is expected to remain
modest over the years. The potash supply in the region is far lower than the demand.
With the increasing demand for potash, import demand would grow significantly
during the period. The sub-region would, however, continue to be a net exporter of
phosphate during the period. But the potential balance would come down by 2015.
22
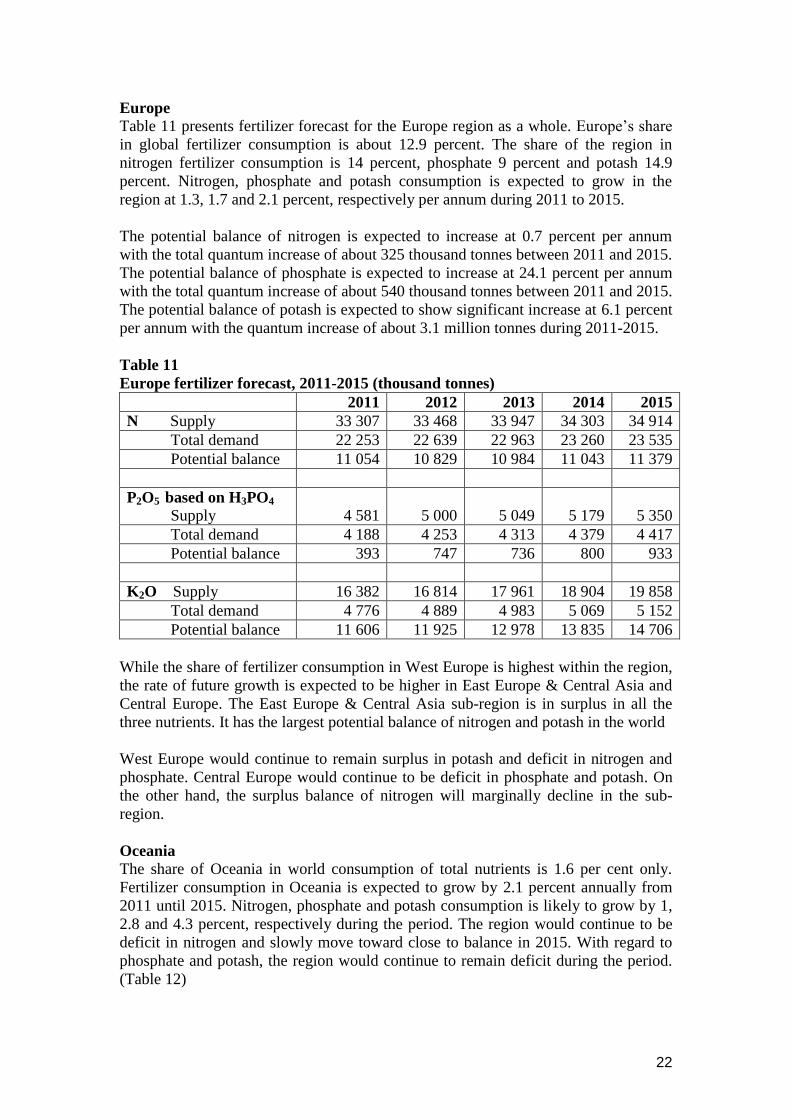
Europe
Table 11 presents fertilizer forecast for the Europe region as a whole. Europe’s share
in global fertilizer consumption is about 12.9 percent. The share of the region in
nitrogen fertilizer consumption is 14 percent, phosphate 9 percent and potash 14.9
percent. Nitrogen, phosphate and potash consumption is expected to grow in the
region at 1.3, 1.7 and 2.1 percent, respectively per annum during 2011 to 2015.
The potential balance of nitrogen is expected to increase at 0.7 percent per annum
with the total quantum increase of about 325 thousand tonnes between 2011 and 2015.
The potential balance of phosphate is expected to increase at 24.1 percent per annum
with the total quantum increase of about 540 thousand tonnes between 2011 and 2015.
The potential balance of potash is expected to show significant increase at 6.1 percent
per annum with the quantum increase of about 3.1 million tonnes during 2011-2015.
Table 11
Europe fertilizer forecast, 2011-2015 (thousand tonnes)
2011 2012 2013 2014 2015
N Supply 33 307 33 468 33 947 34 303 34 914
Total demand 22 253 22 639 22 963 23 260 23 535
Potential balance 11 054 10 829 10 984 11 043 11 379
P2O5 based on H3PO4
Supply 4 581 5 000 5 049 5 179 5 350
Total demand 4 188 4 253 4 313 4 379 4 417
Potential balance 393 747 736 800 933
K2O Supply 16 382 16 814 17 961 18 904 19 858
Total demand 4 776 4 889 4 983 5 069 5 152
Potential balance 11 606 11 925 12 978 13 835 14 706
While the share of fertilizer consumption in West Europe is highest within the region,
the rate of future growth is expected to be higher in East Europe & Central Asia and
Central Europe. The East Europe & Central Asia sub-region is in surplus in all the
three nutrients. It has the largest potential balance of nitrogen and potash in the world
West Europe would continue to remain surplus in potash and deficit in nitrogen and
phosphate. Central Europe would continue to be deficit in phosphate and potash. On
the other hand, the surplus balance of nitrogen will marginally decline in the sub-
region.
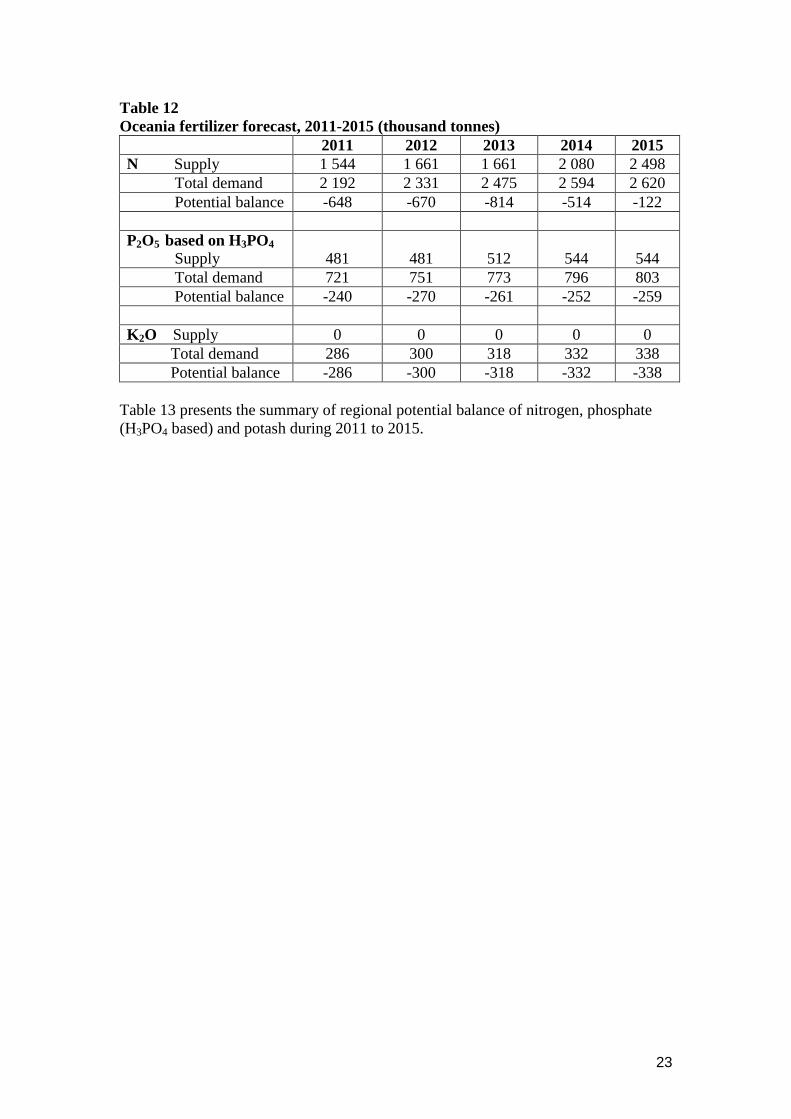
Oceania
The share of Oceania in world consumption of total nutrients is 1.6 per cent only.
Fertilizer consumption in Oceania is expected to grow by 2.1 percent annually from
2011 until 2015. Nitrogen, phosphate and potash consumption is likely to grow by 1,
2.8 and 4.3 percent, respectively during the period. The region would continue to be
deficit in nitrogen and slowly move toward close to balance in 2015. With regard to
phosphate and potash, the region would continue to remain deficit during the period.
(Table 12)
23
Table 12
Oceania fertilizer forecast, 2011-2015 (thousand tonnes)
2011 2012 2013 2014 2015
N Supply 1 544 1 661 1 661 2 080 2 498
Total demand 2 192 2 331 2 475 2 594 2 620
Potential balance -648 -670 -814 -514 -122
P2O5 based on H3PO4
Supply 481 481 512 544 544
Total demand 721 751 773 796 803
Potential balance -240 -270 -261 -252 -259
K2O Supply 0 0 0 0 0
Total demand 286 300 318 332 338
Potential balance -286 -300 -318 -332 -338
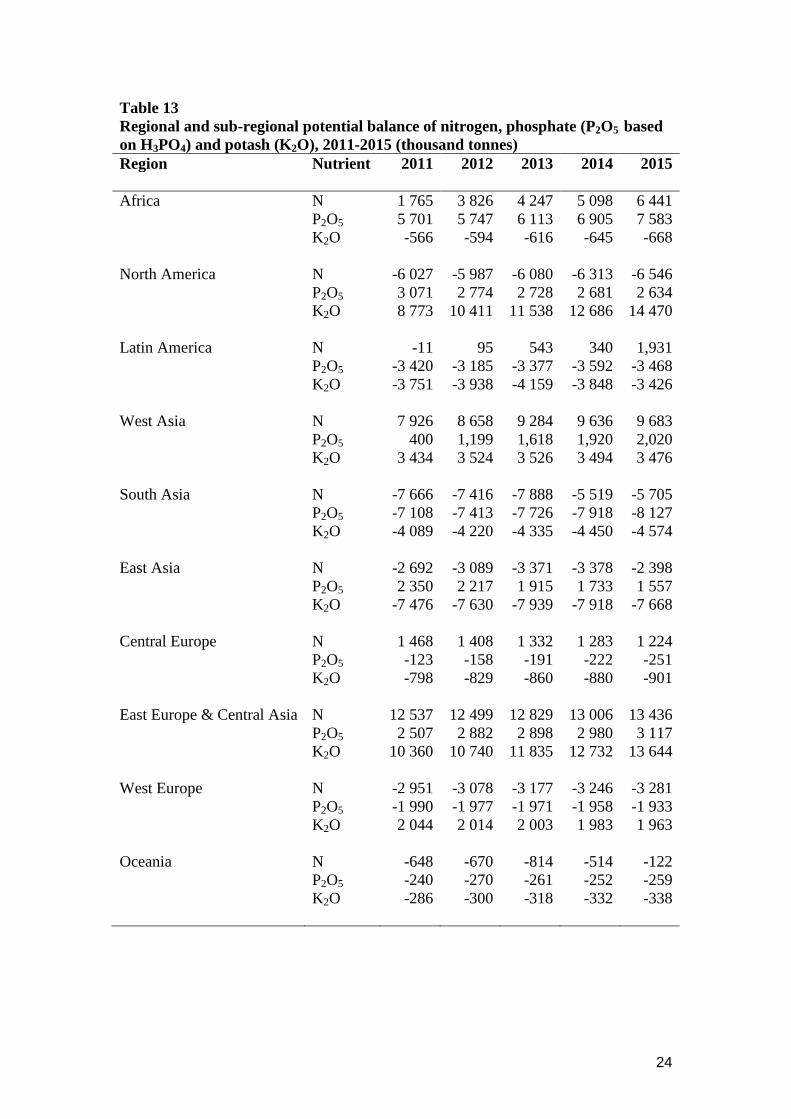
Table 13 presents the summary of regional potential balance of nitrogen, phosphate
(H3PO4 based) and potash during 2011 to 2015.
24
Table 13
Regional and sub-regional potential balance of nitrogen, phosphate (P2O5 based
on H3PO4) and potash (K2O), 2011-2015 (thousand tonnes)
Region Nutrient 2011 2012 2013 2014 2015
Africa N 1 765 3 826 4 247 5 098 6 441
P2O5 5 701 5 747 6 113 6 905 7 583
K2O -566 -594 -616 -645 -668
North America N -6 027 -5 987 -6 080 -6 313 -6 546
P2O5 3 071 2 774 2 728 2 681 2 634
K2O 8 773 10 411 11 538 12 686 14 470
Latin America N -11 95 543 340 1,931
P2O5 -3 420 -3 185 -3 377 -3 592 -3 468
K2O -3 751 -3 938 -4 159 -3 848 -3 426
West Asia N 7 926 8 658 9 284 9 636 9 683
P2O5 400 1,199 1,618 1,920 2,020
K2O 3 434 3 524 3 526 3 494 3 476
South Asia N -7 666 -7 416 -7 888 -5 519 -5 705
P2O5 -7 108 -7 413 -7 726 -7 918 -8 127
K2O -4 089 -4 220 -4 335 -4 450 -4 574
East Asia N -2 692 -3 089 -3 371 -3 378 -2 398
P2O5 2 350 2 217 1 915 1 733 1 557
K2O -7 476 -7 630 -7 939 -7 918 -7 668
Central Europe N 1 468 1 408 1 332 1 283 1 224
P2O5 -123 -158 -191 -222 -251
K2O -798 -829 -860 -880 -901
East Europe & Central Asia N 12 537 12 499 12 829 13 006 13 436
P2O5 2 507 2 882 2 898 2 980 3 117
K2O 10 360 10 740 11 835 12 732 13 644
West Europe N -2 951 -3 078 -3 177 -3 246 -3 281
P2O5 -1 990 -1 977 -1 971 -1 958 -1 933
K2O 2 044 2 014 2 003 1 983 1 963
Oceania N -648 -670 -814 -514 -122
P2O5 -240 -270 -261 -252 -259
K2O -286 -300 -318 -332 -338
25
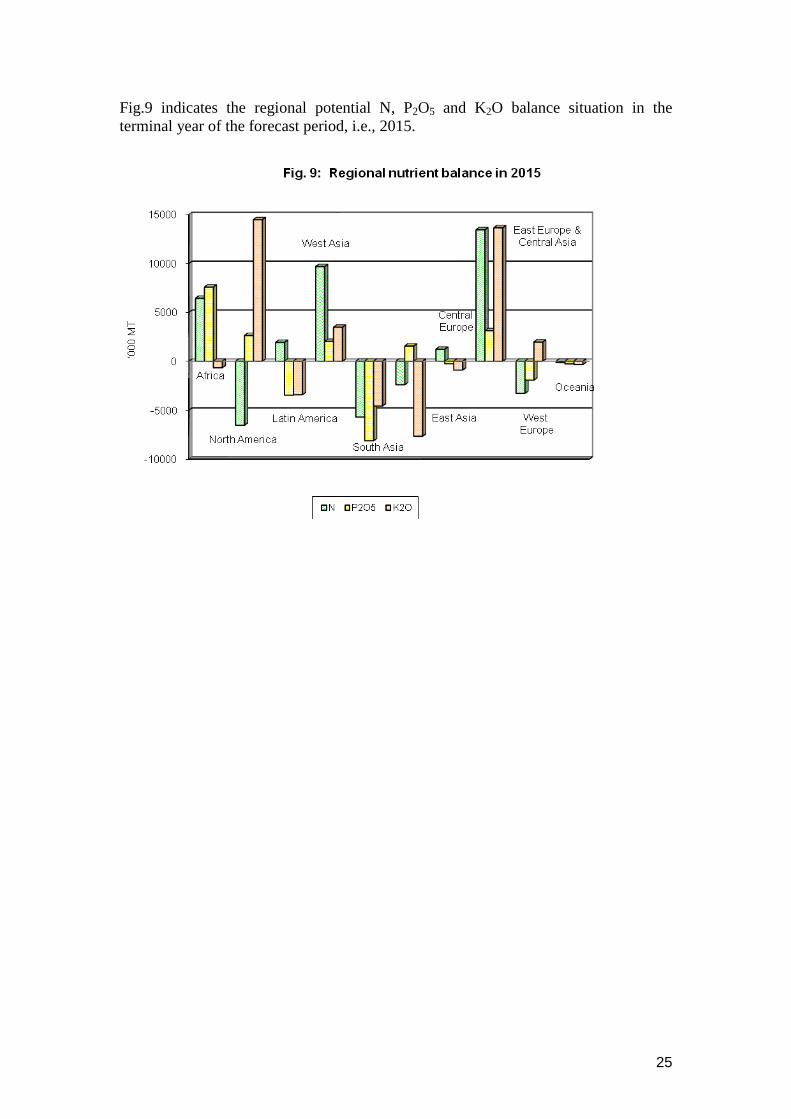
Fig.9 indicates the regional potential N, P2O5 and K2O balance situation in the
terminal year of the forecast period, i.e., 2015.
26
Annex 1
Explanatory notes on supply, demand and balance
In October 2006, the FAO/Fertilizer Organizations Working Group adopted a new
protocol for the preparation of nutrient supply/demand balances based on the work of
the IFA Production and International Trade Committee in 2005/06. The main
objectives of the revised protocol were to take into account the resilient surplus
between production and consumption and to update the parameters used for the
computation of supply and losses.
i) All fertilizer references are in terms of plant nutrients: nitrogen (N), phosphate
(P2O5) and potash. (K2O). Even if for convenience P and K are stated, they actually
refer to P2O5 and K2O, respectively.
ii) Fertilizer demand and supply data refer to the calendar year.
iii) Definitions of the terms used and their relative criteria are listed below:
Capacity: name-plate capacity.
Supply: effective capacity, representing the maximum achievable production. Supply
is computed from the “name-plate capacity” (theoretical capacity), multiplied by the
highest operating rate achieved in the previous 5 years. For new plants, a ramp up of
the operating rates was established for the first 3 years of operation, ranging from 85
to 100 percent.
Demand:
Fertilizer demand is the ability or the willingness of farmers to buy fertilizer at a given
point in time. It is calculated on the basis of the probable consumption in one calendar
year, taking into account the merge between two agricultural years.
Non-fertilizer demand: consumption for non-fertilizer use, referred to as industrial
use. Net non-fertilizer demand excludes the use of products that are recovered as by-
products from industrial processes and then used as fertilizers.
Total demand: Fertilizer demand + non-fertilizer demand.
Losses: The unavoidable losses during the life cycle of a product, from production to
final consumption. The extent of loss is estimated as a percentage (between 2 and 3
percent) of total fertilizer and non-fertilizer demand.
Unspecified usage: Unspecified usage account for the historical residual tonnage from
the production/consumption balances. The tonnage could be used either in fertilizer or
in non-fertilizer products and equate to 4 per cent of other uses.
Potential balance: is the difference between supply and total demand (fertilizer
demand + non-fertilizer demand). Regional balance is a medium-term indicator of
potential changes in fertilizer nutrient demand and supply in the region. Changes in
installed supply capacity, operating rates and demand vary annually.
27
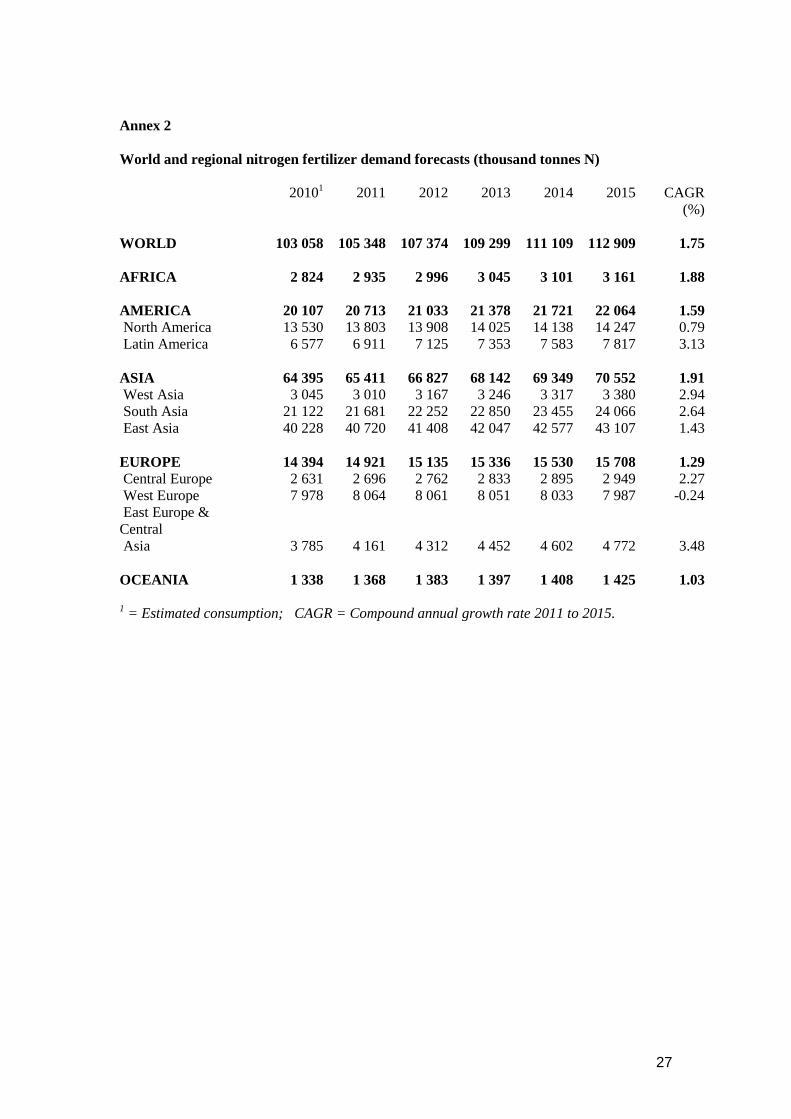
Annex 2
World and regional nitrogen fertilizer demand forecasts (thousand tonnes N)
20101 2011 2012 2013 2014 2015 CAGR
(%)
WORLD 103 058 105 348 107 374 109 299 111 109 112 909 1.75
AFRICA 2 824 2 935 2 996 3 045 3 101 3 161 1.88
AMERICA 20 107 20 713 21 033 21 378 21 721 22 064 1.59
North America 13 530 13 803 13 908 14 025 14 138 14 247 0.79
Latin America 6 577 6 911 7 125 7 353 7 583 7 817 3.13
ASIA 64 395 65 411 66 827 68 142 69 349 70 552 1.91
West Asia 3 045 3 010 3 167 3 246 3 317 3 380 2.94
South Asia 21 122 21 681 22 252 22 850 23 455 24 066 2.64
East Asia 40 228 40 720 41 408 42 047 42 577 43 107 1.43
EUROPE 14 394 14 921 15 135 15 336 15 530 15 708 1.29
Central Europe 2 631 2 696 2 762 2 833 2 895 2 949 2.27
West Europe 7 978 8 064 8 061 8 051 8 033 7 987 -0.24
East Europe &
Central
Asia 3 785 4 161 4 312 4 452 4 602 4 772 3.48
OCEANIA 1 338 1 368 1 383 1 397 1 408 1 425 1.03
1 = Estimated consumption; CAGR = Compound annual growth rate 2011 to 2015.
28
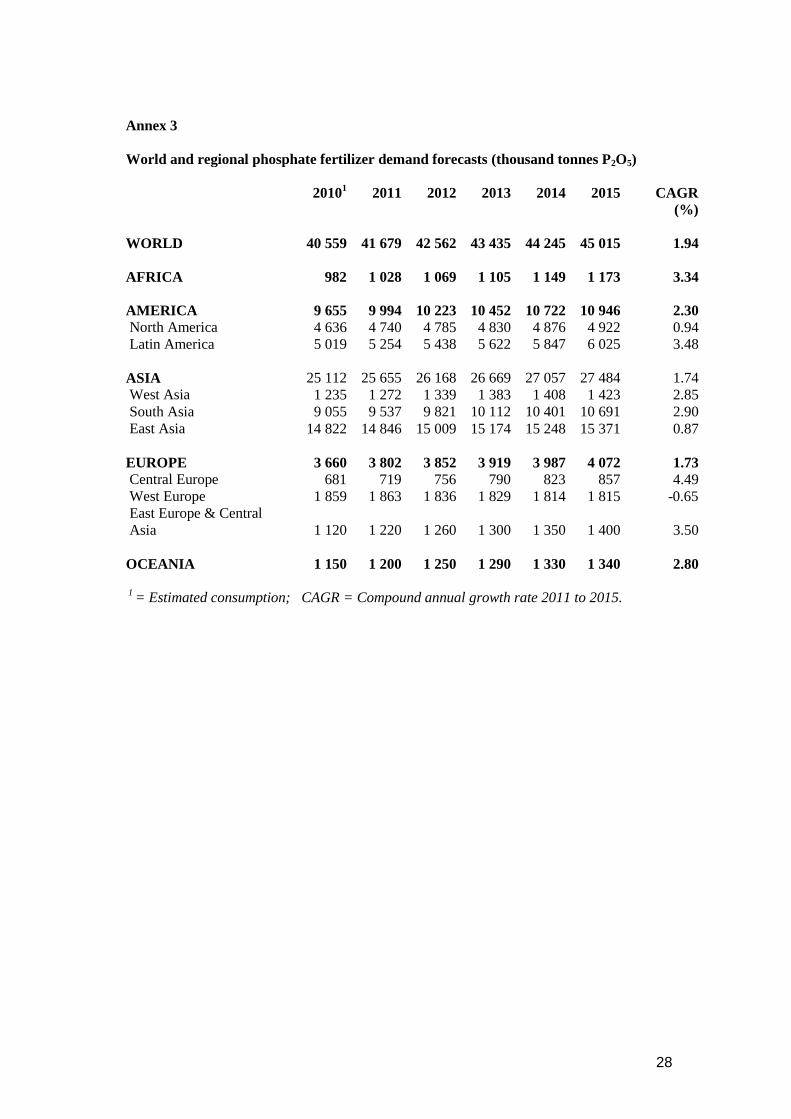
Annex 3
World and regional phosphate fertilizer demand forecasts (thousand tonnes P2O5)
20101 2011 2012 2013 2014 2015 CAGR
(%)
WORLD 40 559 41 679 42 562 43 435 44 245 45 015 1.94
AFRICA 982 1 028 1 069 1 105 1 149 1 173 3.34
AMERICA 9 655 9 994 10 223 10 452 10 722 10 946 2.30
North America 4 636 4 740 4 785 4 830 4 876 4 922 0.94
Latin America 5 019 5 254 5 438 5 622 5 847 6 025 3.48
ASIA 25 112 25 655 26 168 26 669 27 057 27 484 1.74
West Asia 1 235 1 272 1 339 1 383 1 408 1 423 2.85
South Asia 9 055 9 537 9 821 10 112 10 401 10 691 2.90
East Asia 14 822 14 846 15 009 15 174 15 248 15 371 0.87
EUROPE 3 660 3 802 3 852 3 919 3 987 4 072 1.73
Central Europe 681 719 756 790 823 857 4.49
West Europe 1 859 1 863 1 836 1 829 1 814 1 815 -0.65
East Europe & Central
Asia 1 120 1 220 1 260 1 300 1 350 1 400 3.50
OCEANIA 1 150 1 200 1 250 1 290 1 330 1 340 2.80
1 = Estimated consumption; CAGR = Compound annual growth rate 2011 to 2015.
29
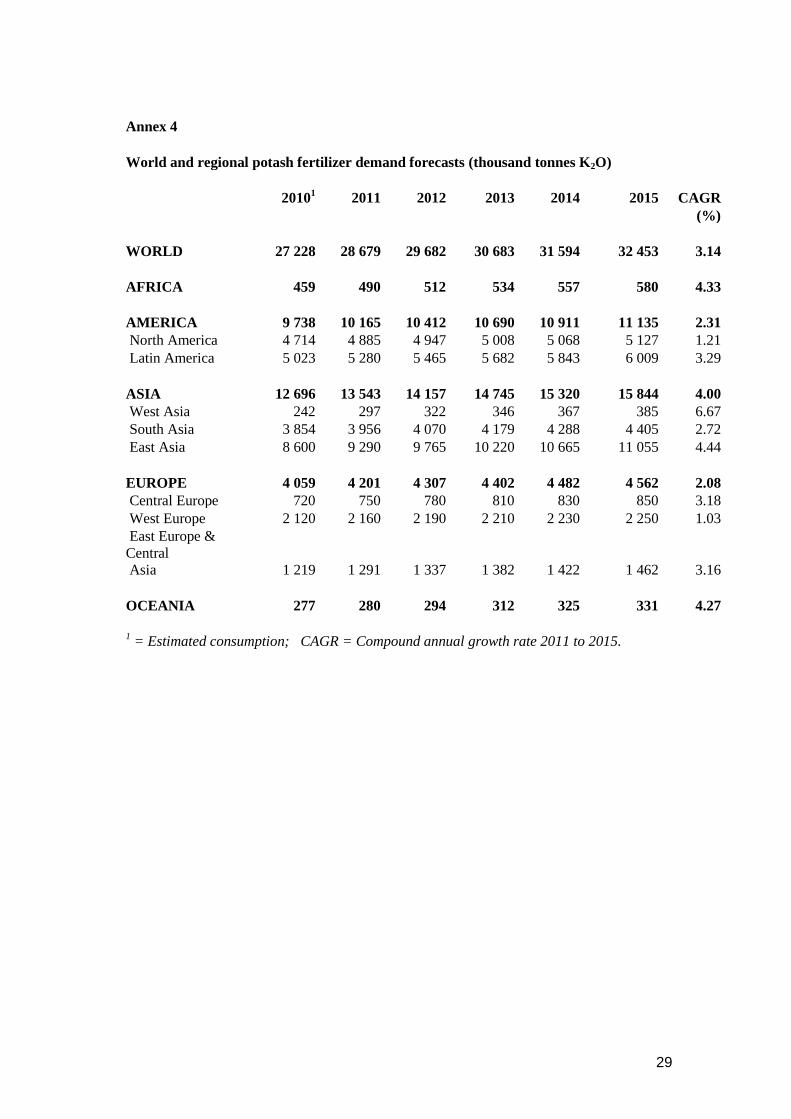
Annex 4
World and regional potash fertilizer demand forecasts (thousand tonnes K2O)
20101
2011 2012 2013 2014 2015 CAGR
(%)
WORLD 27 228 28 679 29 682 30 683 31 594 32 453 3.14
AFRICA 459 490 512 534 557 580 4.33
AMERICA 9 738 10 165 10 412 10 690 10 911 11 135 2.31
North America 4 714 4 885 4 947 5 008 5 068 5 127 1.21
Latin America 5 023 5 280 5 465 5 682 5 843 6 009 3.29
ASIA 12 696 13 543 14 157 14 745 15 320 15 844 4.00
West Asia 242 297 322 346 367 385 6.67
South Asia 3 854 3 956 4 070 4 179 4 288 4 405 2.72
East Asia 8 600 9 290 9 765 10 220 10 665 11 055 4.44
EUROPE 4 059 4 201 4 307 4 402 4 482 4 562 2.08
Central Europe 720 750 780 810 830 850 3.18
West Europe 2 120 2 160 2 190 2 210 2 230 2 250 1.03
East Europe &
Central
Asia 1 219 1 291 1 337 1 382 1 422 1 462 3.16
OCEANIA 277 280 294 312 325 331 4.27
1 = Estimated consumption; CAGR = Compound annual growth rate 2011 to 2015.
30
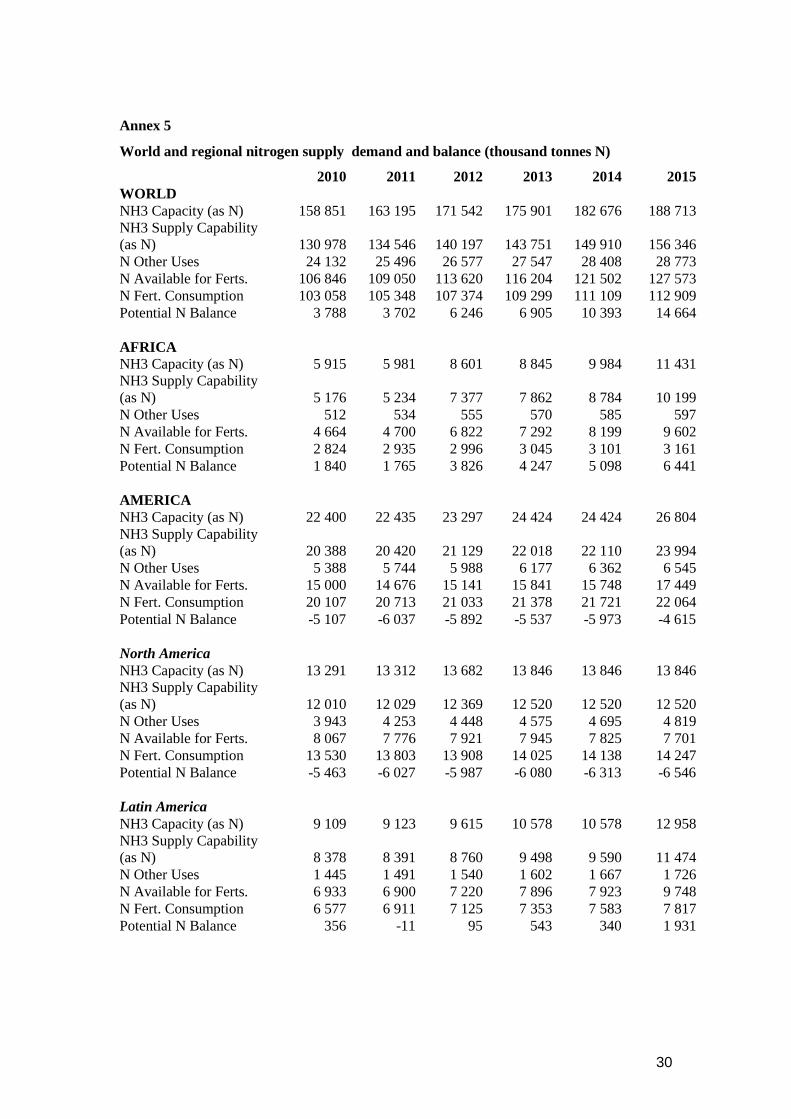
Annex 5
World and regional nitrogen supply demand and balance (thousand tonnes N)
2010 2011 2012 2013 2014 2015
WORLD
NH3 Capacity (as N) 158 851 163 195 171 542 175 901 182 676 188 713
NH3 Supply Capability
(as N) 130 978 134 546 140 197 143 751 149 910 156 346
N Other Uses 24 132 25 496 26 577 27 547 28 408 28 773
N Available for Ferts. 106 846 109 050 113 620 116 204 121 502 127 573
N Fert. Consumption 103 058 105 348 107 374 109 299 111 109 112 909
Potential N Balance 3 788 3 702 6 246 6 905 10 393 14 664
AFRICA
NH3 Capacity (as N) 5 915 5 981 8 601 8 845 9 984 11 431
NH3 Supply Capability
(as N) 5 176 5 234 7 377 7 862 8 784 10 199
N Other Uses 512 534 555 570 585 597
N Available for Ferts. 4 664 4 700 6 822 7 292 8 199 9 602
N Fert. Consumption 2 824 2 935 2 996 3 045 3 101 3 161
Potential N Balance 1 840 1 765 3 826 4 247 5 098 6 441
AMERICA
NH3 Capacity (as N) 22 400 22 435 23 297 24 424 24 424 26 804
NH3 Supply Capability
(as N) 20 388 20 420 21 129 22 018 22 110 23 994
N Other Uses 5 388 5 744 5 988 6 177 6 362 6 545
N Available for Ferts. 15 000 14 676 15 141 15 841 15 748 17 449
N Fert. Consumption 20 107 20 713 21 033 21 378 21 721 22 064
Potential N Balance -5 107 -6 037 -5 892 -5 537 -5 973 -4 615
North America
NH3 Capacity (as N) 13 291 13 312 13 682 13 846 13 846 13 846
NH3 Supply Capability
(as N) 12 010 12 029 12 369 12 520 12 520 12 520
N Other Uses 3 943 4 253 4 448 4 575 4 695 4 819
N Available for Ferts. 8 067 7 776 7 921 7 945 7 825 7 701
N Fert. Consumption 13 530 13 803 13 908 14 025 14 138 14 247
Potential N Balance -5 463 -6 027 -5 987 -6 080 -6 313 -6 546
Latin America
NH3 Capacity (as N) 9 109 9 123 9 615 10 578 10 578 12 958
NH3 Supply Capability
(as N) 8 378 8 391 8 760 9 498 9 590 11 474
N Other Uses 1 445 1 491 1 540 1 602 1 667 1 726
N Available for Ferts. 6 933 6 900 7 220 7 896 7 923 9 748
N Fert. Consumption 6 577 6 911 7 125 7 353 7 583 7 817
Potential N Balance 356 -11 95 543 340 1 931
31
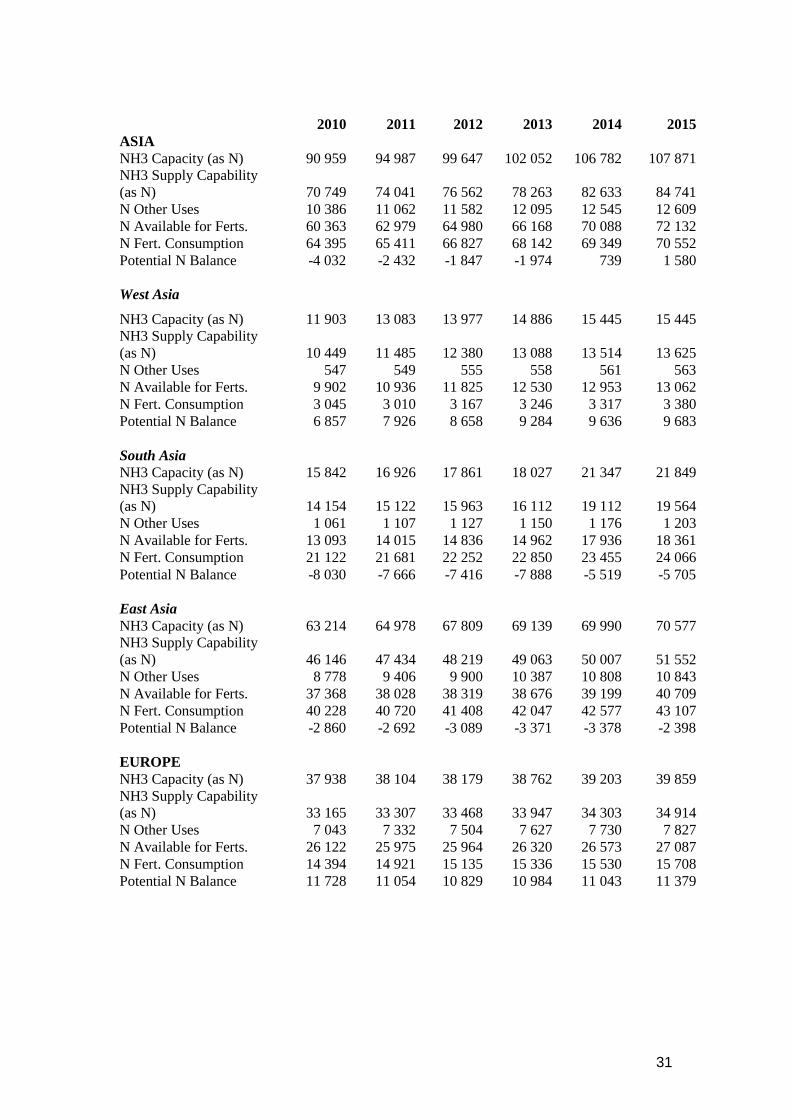
2010 2011 2012 2013 2014 2015
ASIA
NH3 Capacity (as N) 90 959 94 987 99 647 102 052 106 782 107 871
NH3 Supply Capability
(as N) 70 749 74 041 76 562 78 263 82 633 84 741
N Other Uses 10 386 11 062 11 582 12 095 12 545 12 609
N Available for Ferts. 60 363 62 979 64 980 66 168 70 088 72 132
N Fert. Consumption 64 395 65 411 66 827 68 142 69 349 70 552
Potential N Balance -4 032 -2 432 -1 847 -1 974 739 1 580
West Asia
NH3 Capacity (as N) 11 903 13 083 13 977 14 886 15 445 15 445
NH3 Supply Capability
(as N) 10 449 11 485 12 380 13 088 13 514 13 625
N Other Uses 547 549 555 558 561 563
N Available for Ferts. 9 902 10 936 11 825 12 530 12 953 13 062
N Fert. Consumption 3 045 3 010 3 167 3 246 3 317 3 380
Potential N Balance 6 857 7 926 8 658 9 284 9 636 9 683
South Asia
NH3 Capacity (as N) 15 842 16 926 17 861 18 027 21 347 21 849
NH3 Supply Capability
(as N) 14 154 15 122 15 963 16 112 19 112 19 564
N Other Uses 1 061 1 107 1 127 1 150 1 176 1 203
N Available for Ferts. 13 093 14 015 14 836 14 962 17 936 18 361
N Fert. Consumption 21 122 21 681 22 252 22 850 23 455 24 066
Potential N Balance -8 030 -7 666 -7 416 -7 888 -5 519 -5 705
East Asia
NH3 Capacity (as N) 63 214 64 978 67 809 69 139 69 990 70 577
NH3 Supply Capability
(as N) 46 146 47 434 48 219 49 063 50 007 51 552
N Other Uses 8 778 9 406 9 900 10 387 10 808 10 843
N Available for Ferts. 37 368 38 028 38 319 38 676 39 199 40 709
N Fert. Consumption 40 228 40 720 41 408 42 047 42 577 43 107
Potential N Balance -2 860 -2 692 -3 089 -3 371 -3 378 -2 398
EUROPE
NH3 Capacity (as N) 37 938 38 104 38 179 38 762 39 203 39 859
NH3 Supply Capability
(as N) 33 165 33 307 33 468 33 947 34 303 34 914
N Other Uses 7 043 7 332 7 504 7 627 7 730 7 827
N Available for Ferts. 26 122 25 975 25 964 26 320 26 573 27 087
N Fert. Consumption 14 394 14 921 15 135 15 336 15 530 15 708
Potential N Balance 11 728 11 054 10 829 10 984 11 043 11 379
32
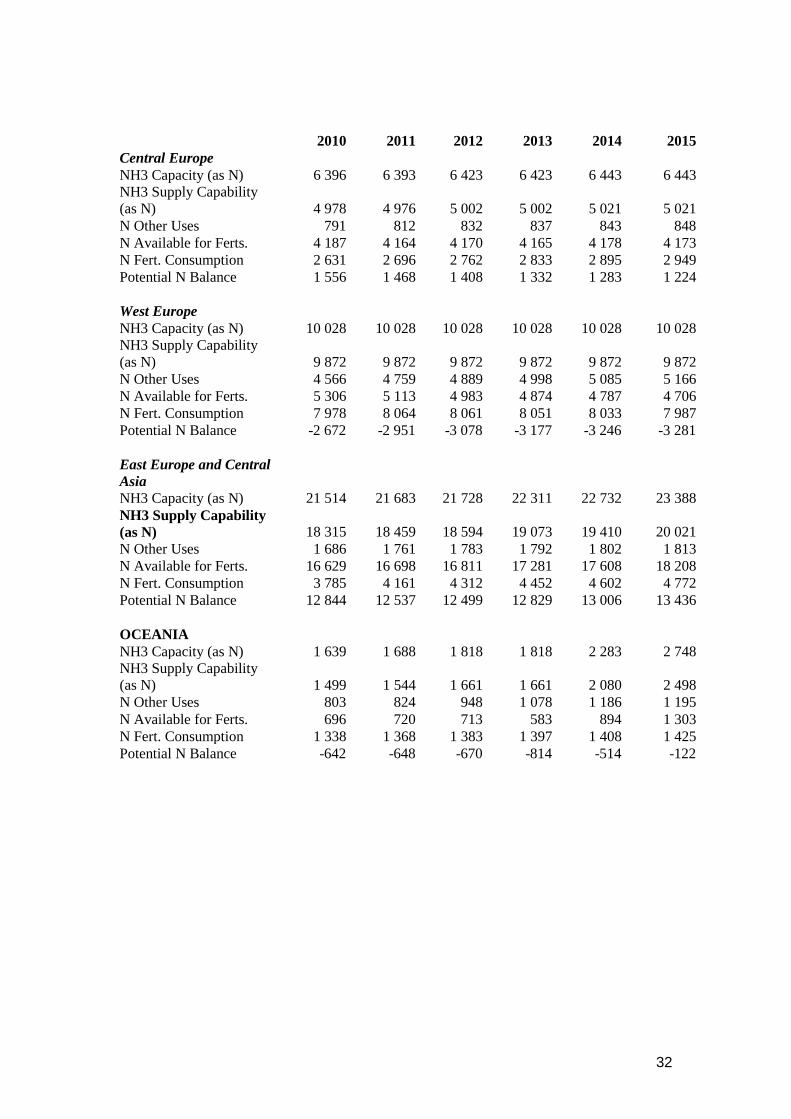
2010 2011 2012 2013 2014 2015
Central Europe
NH3 Capacity (as N) 6 396 6 393 6 423 6 423 6 443 6 443
NH3 Supply Capability
(as N) 4 978 4 976 5 002 5 002 5 021 5 021
N Other Uses 791 812 832 837 843 848
N Available for Ferts. 4 187 4 164 4 170 4 165 4 178 4 173
N Fert. Consumption 2 631 2 696 2 762 2 833 2 895 2 949
Potential N Balance 1 556 1 468 1 408 1 332 1 283 1 224
West Europe
NH3 Capacity (as N) 10 028 10 028 10 028 10 028 10 028 10 028
NH3 Supply Capability
(as N) 9 872 9 872 9 872 9 872 9 872 9 872
N Other Uses 4 566 4 759 4 889 4 998 5 085 5 166
N Available for Ferts. 5 306 5 113 4 983 4 874 4 787 4 706
N Fert. Consumption 7 978 8 064 8 061 8 051 8 033 7 987
Potential N Balance -2 672 -2 951 -3 078 -3 177 -3 246 -3 281
East Europe and Central
Asia
NH3 Capacity (as N) 21 514 21 683 21 728 22 311 22 732 23 388
NH3 Supply Capability
(as N) 18 315 18 459 18 594 19 073 19 410 20 021
N Other Uses 1 686 1 761 1 783 1 792 1 802 1 813
N Available for Ferts. 16 629 16 698 16 811 17 281 17 608 18 208
N Fert. Consumption 3 785 4 161 4 312 4 452 4 602 4 772
Potential N Balance 12 844 12 537 12 499 12 829 13 006 13 436
OCEANIA
NH3 Capacity (as N) 1 639 1 688 1 818 1 818 2 283 2 748
NH3 Supply Capability
(as N) 1 499 1 544 1 661 1 661 2 080 2 498
N Other Uses 803 824 948 1 078 1 186 1 195
N Available for Ferts. 696 720 713 583 894 1 303
N Fert. Consumption 1 338 1 368 1 383 1 397 1 408 1 425
Potential N Balance -642 -648 -670 -814 -514 -122
33
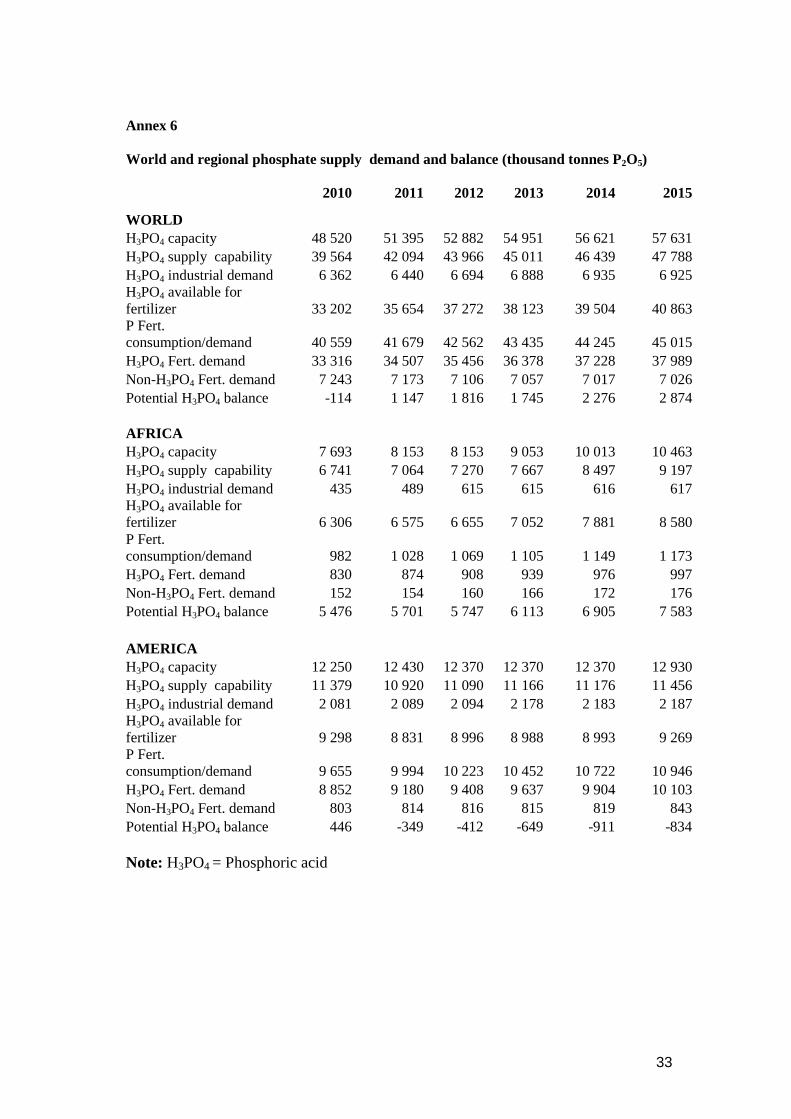
Annex 6
World and regional phosphate supply demand and balance (thousand tonnes P2O5)
2010 2011 2012 2013 2014 2015
WORLD
H3PO4 capacity 48 520 51 395 52 882 54 951 56 621 57 631
H3PO4 supply capability 39 564 42 094 43 966 45 011 46 439 47 788
H3PO4 industrial demand 6 362 6 440 6 694 6 888 6 935 6 925
H3PO4 available for
fertilizer 33 202 35 654 37 272 38 123 39 504 40 863
P Fert.
consumption/demand 40 559 41 679 42 562 43 435 44 245 45 015
H3PO4 Fert. demand 33 316 34 507 35 456 36 378 37 228 37 989
Non-H3PO4 Fert. demand 7 243 7 173 7 106 7 057 7 017 7 026
Potential H3PO4 balance -114 1 147 1 816 1 745 2 276 2 874
AFRICA
H3PO4 capacity 7 693 8 153 8 153 9 053 10 013 10 463
H3PO4 supply capability 6 741 7 064 7 270 7 667 8 497 9 197
H3PO4 industrial demand 435 489 615 615 616 617
H3PO4 available for
fertilizer 6 306 6 575 6 655 7 052 7 881 8 580
P Fert.
consumption/demand 982 1 028 1 069 1 105 1 149 1 173
H3PO4 Fert. demand 830 874 908 939 976 997
Non-H3PO4 Fert. demand 152 154 160 166 172 176
Potential H3PO4 balance 5 476 5 701 5 747 6 113 6 905 7 583
AMERICA
H3PO4 capacity 12 250 12 430 12 370 12 370 12 370 12 930
H3PO4 supply capability 11 379 10 920 11 090 11 166 11 176 11 456
H3PO4 industrial demand 2 081 2 089 2 094 2 178 2 183 2 187
H3PO4 available for
fertilizer 9 298 8 831 8 996 8 988 8 993 9 269
P Fert.
consumption/demand 9 655 9 994 10 223 10 452 10 722 10 946
H3PO4 Fert. demand 8 852 9 180 9 408 9 637 9 904 10 103
Non-H3PO4 Fert. demand 803 814 816 815 819 843
Potential H3PO4 balance 446 -349 -412 -649 -911 -834
Note: H3PO4 = Phosphoric acid
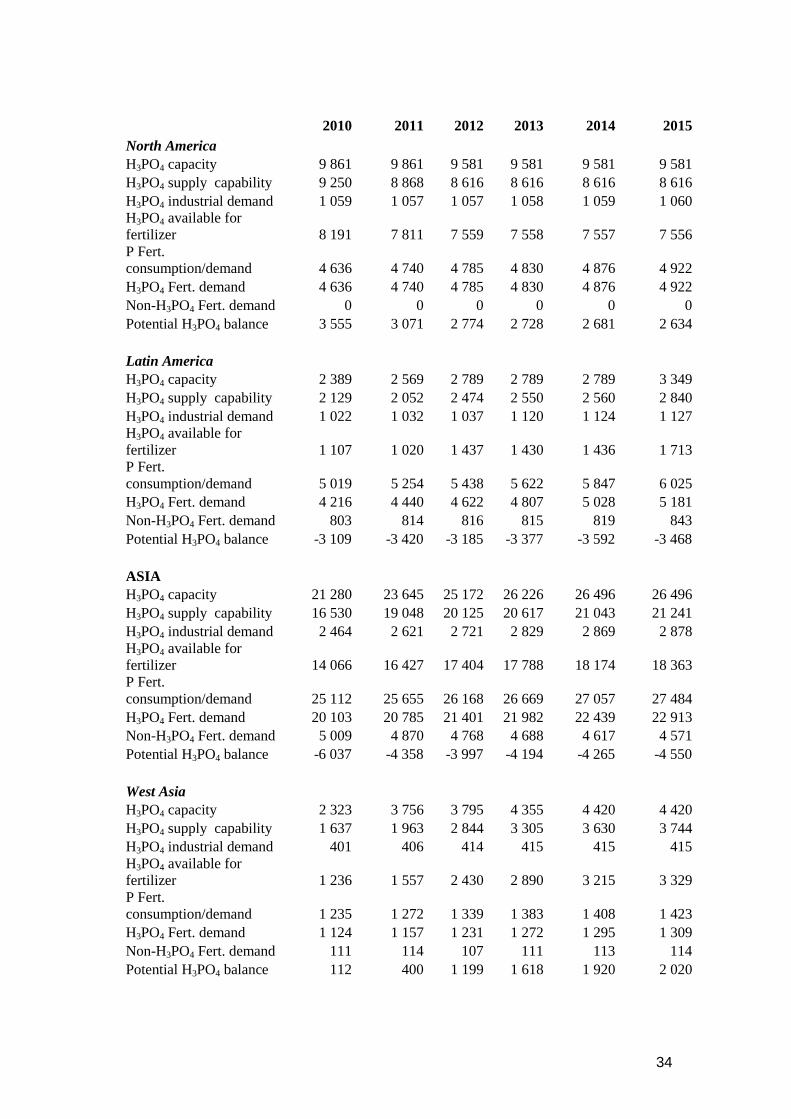
34
2010 2011 2012 2013 2014 2015
North America
H3PO4 capacity 9 861 9 861 9 581 9 581 9 581 9 581
H3PO4 supply capability 9 250 8 868 8 616 8 616 8 616 8 616
H3PO4 industrial demand 1 059 1 057 1 057 1 058 1 059 1 060
H3PO4 available for
fertilizer 8 191 7 811 7 559 7 558 7 557 7 556
P Fert.
consumption/demand 4 636 4 740 4 785 4 830 4 876 4 922
H3PO4 Fert. demand 4 636 4 740 4 785 4 830 4 876 4 922
Non-H3PO4 Fert. demand 0 0 0 0 0 0
Potential H3PO4 balance 3 555 3 071 2 774 2 728 2 681 2 634
Latin America
H3PO4 capacity 2 389 2 569 2 789 2 789 2 789 3 349
H3PO4 supply capability 2 129 2 052 2 474 2 550 2 560 2 840
H3PO4 industrial demand 1 022 1 032 1 037 1 120 1 124 1 127
H3PO4 available for
fertilizer 1 107 1 020 1 437 1 430 1 436 1 713
P Fert.
consumption/demand 5 019 5 254 5 438 5 622 5 847 6 025
H3PO4 Fert. demand 4 216 4 440 4 622 4 807 5 028 5 181
Non-H3PO4 Fert. demand 803 814 816 815 819 843
Potential H3PO4 balance -3 109 -3 420 -3 185 -3 377 -3 592 -3 468
ASIA
H3PO4 capacity 21 280 23 645 25 172 26 226 26 496 26 496
H3PO4 supply capability 16 530 19 048 20 125 20 617 21 043 21 241
H3PO4 industrial demand 2 464 2 621 2 721 2 829 2 869 2 878
H3PO4 available for
fertilizer 14 066 16 427 17 404 17 788 18 174 18 363
P Fert.
consumption/demand 25 112 25 655 26 168 26 669 27 057 27 484
H3PO4 Fert. demand 20 103 20 785 21 401 21 982 22 439 22 913
Non-H3PO4 Fert. demand 5 009 4 870 4 768 4 688 4 617 4 571
Potential H3PO4 balance -6 037 -4 358 -3 997 -4 194 -4 265 -4 550
West Asia
H3PO4 capacity 2 323 3 756 3 795 4 355 4 420 4 420
H3PO4 supply capability 1 637 1 963 2 844 3 305 3 630 3 744
H3PO4 industrial demand 401 406 414 415 415 415
H3PO4 available for
fertilizer 1 236 1 557 2 430 2 890 3 215 3 329
P Fert.
consumption/demand 1 235 1 272 1 339 1 383 1 408 1 423
H3PO4 Fert. demand 1 124 1 157 1 231 1 272 1 295 1 309
Non-H3PO4 Fert. demand 111 114 107 111 113 114
Potential H3PO4 balance 112 400 1 199 1 618 1 920 2 020
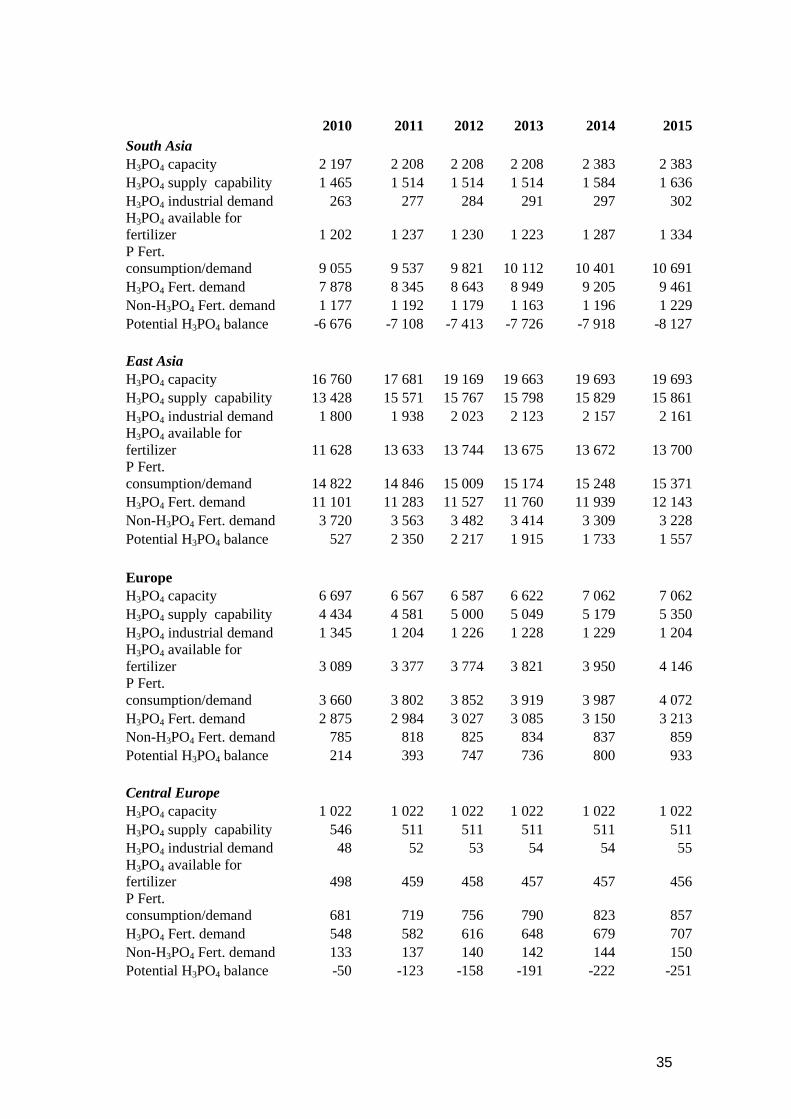
35
2010 2011 2012 2013 2014 2015
South Asia
H3PO4 capacity 2 197 2 208 2 208 2 208 2 383 2 383
H3PO4 supply capability 1 465 1 514 1 514 1 514 1 584 1 636
H3PO4 industrial demand 263 277 284 291 297 302
H3PO4 available for
fertilizer 1 202 1 237 1 230 1 223 1 287 1 334
P Fert.
consumption/demand 9 055 9 537 9 821 10 112 10 401 10 691
H3PO4 Fert. demand 7 878 8 345 8 643 8 949 9 205 9 461
Non-H3PO4 Fert. demand 1 177 1 192 1 179 1 163 1 196 1 229
Potential H3PO4 balance -6 676 -7 108 -7 413 -7 726 -7 918 -8 127
East Asia
H3PO4 capacity 16 760 17 681 19 169 19 663 19 693 19 693
H3PO4 supply capability 13 428 15 571 15 767 15 798 15 829 15 861
H3PO4 industrial demand 1 800 1 938 2 023 2 123 2 157 2 161
H3PO4 available for
fertilizer 11 628 13 633 13 744 13 675 13 672 13 700
P Fert.
consumption/demand 14 822 14 846 15 009 15 174 15 248 15 371
H3PO4 Fert. demand 11 101 11 283 11 527 11 760 11 939 12 143
Non-H3PO4 Fert. demand 3 720 3 563 3 482 3 414 3 309 3 228
Potential H3PO4 balance 527 2 350 2 217 1 915 1 733 1 557
Europe
H3PO4 capacity 6 697 6 567 6 587 6 622 7 062 7 062
H3PO4 supply capability 4 434 4 581 5 000 5 049 5 179 5 350
H3PO4 industrial demand 1 345 1 204 1 226 1 228 1 229 1 204
H3PO4 available for
fertilizer 3 089 3 377 3 774 3 821 3 950 4 146
P Fert.
consumption/demand 3 660 3 802 3 852 3 919 3 987 4 072
H3PO4 Fert. demand 2 875 2 984 3 027 3 085 3 150 3 213
Non-H3PO4 Fert. demand 785 818 825 834 837 859
Potential H3PO4 balance 214 393 747 736 800 933
Central Europe
H3PO4 capacity 1 022 1 022 1 022 1 022 1 022 1 022
H3PO4 supply capability 546 511 511 511 511 511
H3PO4 industrial demand 48 52 53 54 54 55
H3PO4 available for
fertilizer 498 459 458 457 457 456
P Fert.
consumption/demand 681 719 756 790 823 857
H3PO4 Fert. demand 548 582 616 648 679 707
Non-H3PO4 Fert. demand 133 137 140 142 144 150
Potential H3PO4 balance -50 -123 -158 -191 -222 -251
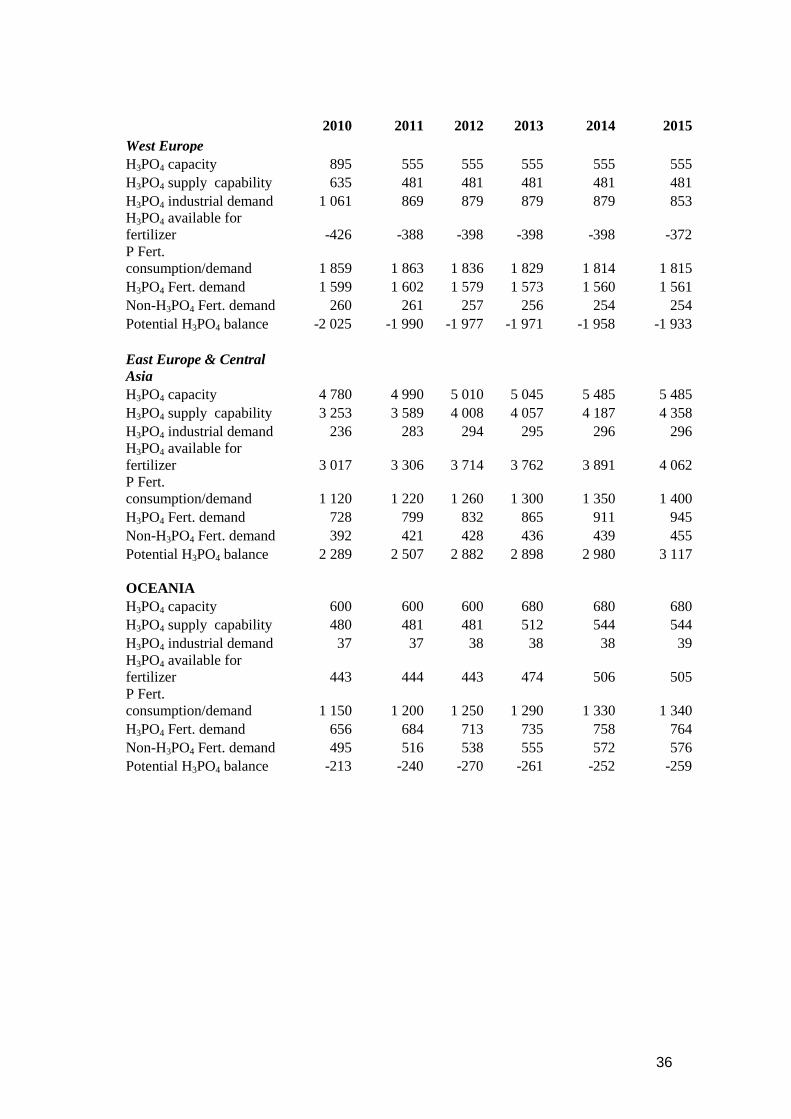
36
2010 2011 2012 2013 2014 2015
West Europe
H3PO4 capacity 895 555 555 555 555 555
H3PO4 supply capability 635 481 481 481 481 481
H3PO4 industrial demand 1 061 869 879 879 879 853
H3PO4 available for
fertilizer -426 -388 -398 -398 -398 -372
P Fert.
consumption/demand 1 859 1 863 1 836 1 829 1 814 1 815
H3PO4 Fert. demand 1 599 1 602 1 579 1 573 1 560 1 561
Non-H3PO4 Fert. demand 260 261 257 256 254 254
Potential H3PO4 balance -2 025 -1 990 -1 977 -1 971 -1 958 -1 933
East Europe & Central
Asia
H3PO4 capacity 4 780 4 990 5 010 5 045 5 485 5 485
H3PO4 supply capability 3 253 3 589 4 008 4 057 4 187 4 358
H3PO4 industrial demand 236 283 294 295 296 296
H3PO4 available for
fertilizer 3 017 3 306 3 714 3 762 3 891 4 062
P Fert.
consumption/demand 1 120 1 220 1 260 1 300 1 350 1 400
H3PO4 Fert. demand 728 799 832 865 911 945
Non-H3PO4 Fert. demand 392 421 428 436 439 455
Potential H3PO4 balance 2 289 2 507 2 882 2 898 2 980 3 117
OCEANIA
H3PO4 capacity 600 600 600 680 680 680
H3PO4 supply capability 480 481 481 512 544 544
H3PO4 industrial demand 37 37 38 38 38 39
H3PO4 available for
fertilizer 443 444 443 474 506 505
P Fert.
consumption/demand 1 150 1 200 1 250 1 290 1 330 1 340
H3PO4 Fert. demand 656 684 713 735 758 764
Non-H3PO4 Fert. demand 495 516 538 555 572 576
Potential H3PO4 balance -213 -240 -270 -261 -252 -259
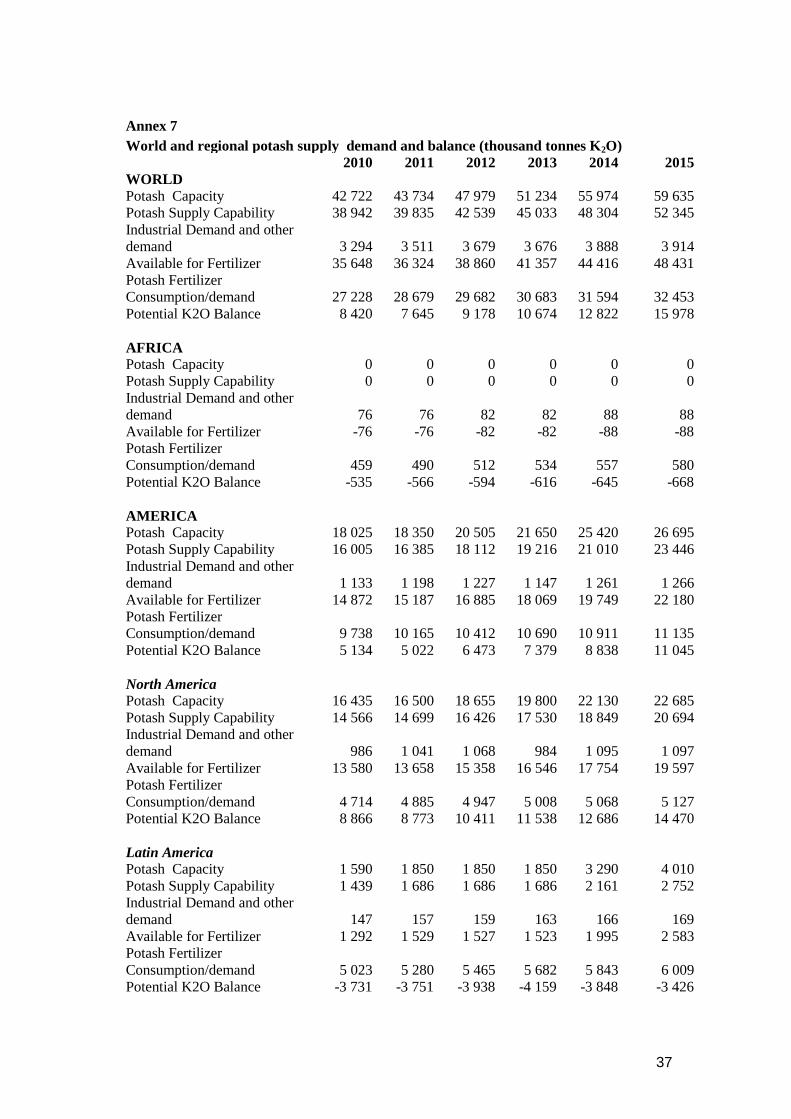
37
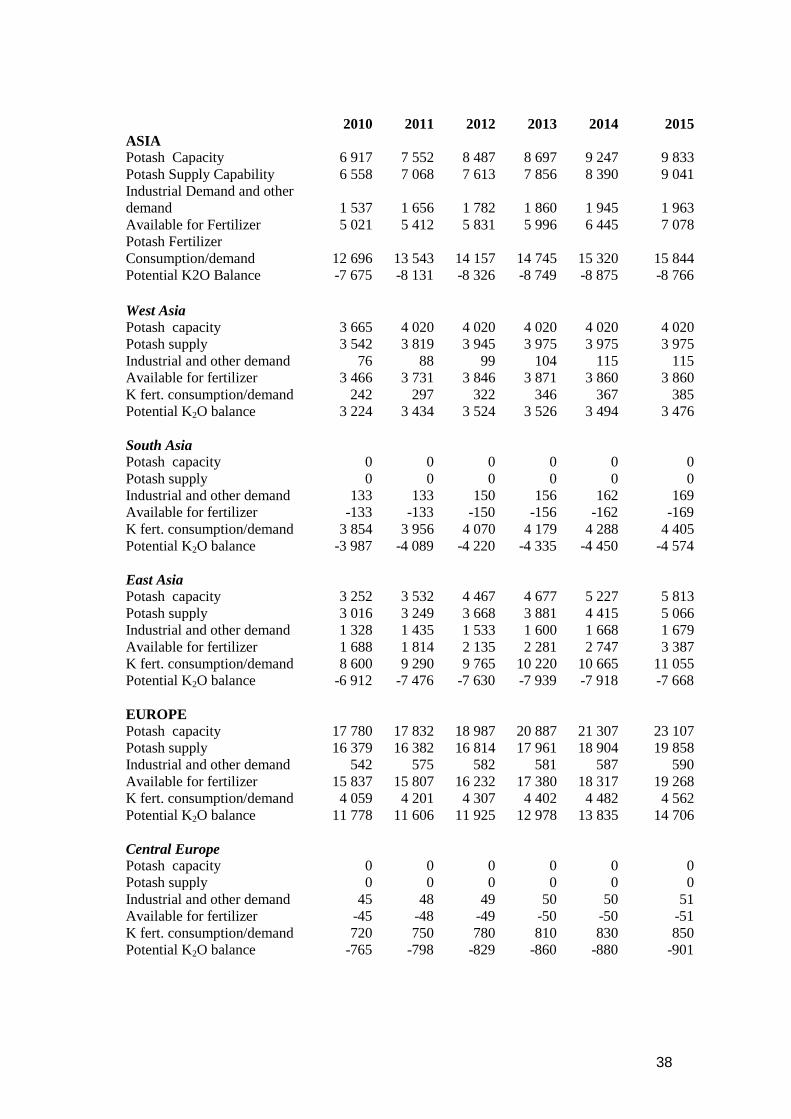
Annex 7
World and regional potash supply demand and balance (thousand tonnes K2O)
2010 2011 2012 2013 2014 2015
WORLD
Potash Capacity 42 722 43 734 47 979 51 234 55 974 59 635
Potash Supply Capability 38 942 39 835 42 539 45 033 48 304 52 345
Industrial Demand and other
demand 3 294 3 511 3 679 3 676 3 888 3 914
Available for Fertilizer 35 648 36 324 38 860 41 357 44 416 48 431
Potash Fertilizer
Consumption/demand 27 228 28 679 29 682 30 683 31 594 32 453
Potential K2O Balance 8 420 7 645 9 178 10 674 12 822 15 978
AFRICA
Potash Capacity 0 0 0 0 0 0
Potash Supply Capability 0 0 0 0 0 0
Industrial Demand and other
demand 76 76 82 82 88 88
Available for Fertilizer -76 -76 -82 -82 -88 -88
Potash Fertilizer
Consumption/demand 459 490 512 534 557 580
Potential K2O Balance -535 -566 -594 -616 -645 -668
AMERICA
Potash Capacity 18 025 18 350 20 505 21 650 25 420 26 695
Potash Supply Capability 16 005 16 385 18 112 19 216 21 010 23 446
Industrial Demand and other
demand 1 133 1 198 1 227 1 147 1 261 1 266
Available for Fertilizer 14 872 15 187 16 885 18 069 19 749 22 180
Potash Fertilizer
Consumption/demand 9 738 10 165 10 412 10 690 10 911 11 135
Potential K2O Balance 5 134 5 022 6 473 7 379 8 838 11 045
North America
Potash Capacity 16 435 16 500 18 655 19 800 22 130 22 685
Potash Supply Capability 14 566 14 699 16 426 17 530 18 849 20 694
Industrial Demand and other
demand 986 1 041 1 068 984 1 095 1 097
Available for Fertilizer 13 580 13 658 15 358 16 546 17 754 19 597
Potash Fertilizer
Consumption/demand 4 714 4 885 4 947 5 008 5 068 5 127
Potential K2O Balance 8 866 8 773 10 411 11 538 12 686 14 470
Latin America
Potash Capacity 1 590 1 850 1 850 1 850 3 290 4 010
Potash Supply Capability 1 439 1 686 1 686 1 686 2 161 2 752
Industrial Demand and other
demand 147 157 159 163 166 169
Available for Fertilizer 1 292 1 529 1 527 1 523 1 995 2 583
Potash Fertilizer
Consumption/demand 5 023 5 280 5 465 5 682 5 843 6 009
Potential K2O Balance -3 731 -3 751 -3 938 -4 159 -3 848 -3 426
38
2010 2011 2012 2013 2014 2015
ASIA
Potash Capacity 6 917 7 552 8 487 8 697 9 247 9 833
Potash Supply Capability 6 558 7 068 7 613 7 856 8 390 9 041
Industrial Demand and other
demand 1 537 1 656 1 782 1 860 1 945 1 963
Available for Fertilizer 5 021 5 412 5 831 5 996 6 445 7 078
Potash Fertilizer
Consumption/demand 12 696 13 543 14 157 14 745 15 320 15 844
Potential K2O Balance -7 675 -8 131 -8 326 -8 749 -8 875 -8 766
West Asia
Potash capacity 3 665 4 020 4 020 4 020 4 020 4 020
Potash supply 3 542 3 819 3 945 3 975 3 975 3 975
Industrial and other demand 76 88 99 104 115 115
Available for fertilizer 3 466 3 731 3 846 3 871 3 860 3 860
K fert. consumption/demand 242 297 322 346 367 385
Potential K2O balance 3 224 3 434 3 524 3 526 3 494 3 476
South Asia
Potash capacity 0 0 0 0 0 0
Potash supply 0 0 0 0 0 0
Industrial and other demand 133 133 150 156 162 169
Available for fertilizer -133 -133 -150 -156 -162 -169
K fert. consumption/demand 3 854 3 956 4 070 4 179 4 288 4 405
Potential K2O balance -3 987 -4 089 -4 220 -4 335 -4 450 -4 574
East Asia
Potash capacity 3 252 3 532 4 467 4 677 5 227 5 813
Potash supply 3 016 3 249 3 668 3 881 4 415 5 066
Industrial and other demand 1 328 1 435 1 533 1 600 1 668 1 679
Available for fertilizer 1 688 1 814 2 135 2 281 2 747 3 387
K fert. consumption/demand 8 600 9 290 9 765 10 220 10 665 11 055
Potential K2O balance -6 912 -7 476 -7 630 -7 939 -7 918 -7 668
EUROPE
Potash capacity 17 780 17 832 18 987 20 887 21 307 23 107
Potash supply 16 379 16 382 16 814 17 961 18 904 19 858
Industrial and other demand 542 575 582 581 587 590
Available for fertilizer 15 837 15 807 16 232 17 380 18 317 19 268
K fert. consumption/demand 4 059 4 201 4 307 4 402 4 482 4 562
Potential K2O balance 11 778 11 606 11 925 12 978 13 835 14 706
Central Europe
Potash capacity 0 0 0 0 0 0
Potash supply 0 0 0 0 0 0
Industrial and other demand 45 48 49 50 50 51
Available for fertilizer -45 -48 -49 -50 -50 -51
K fert. consumption/demand 720 750 780 810 830 850
Potential K2O balance -765 -798 -829 -860 -880 -901
39
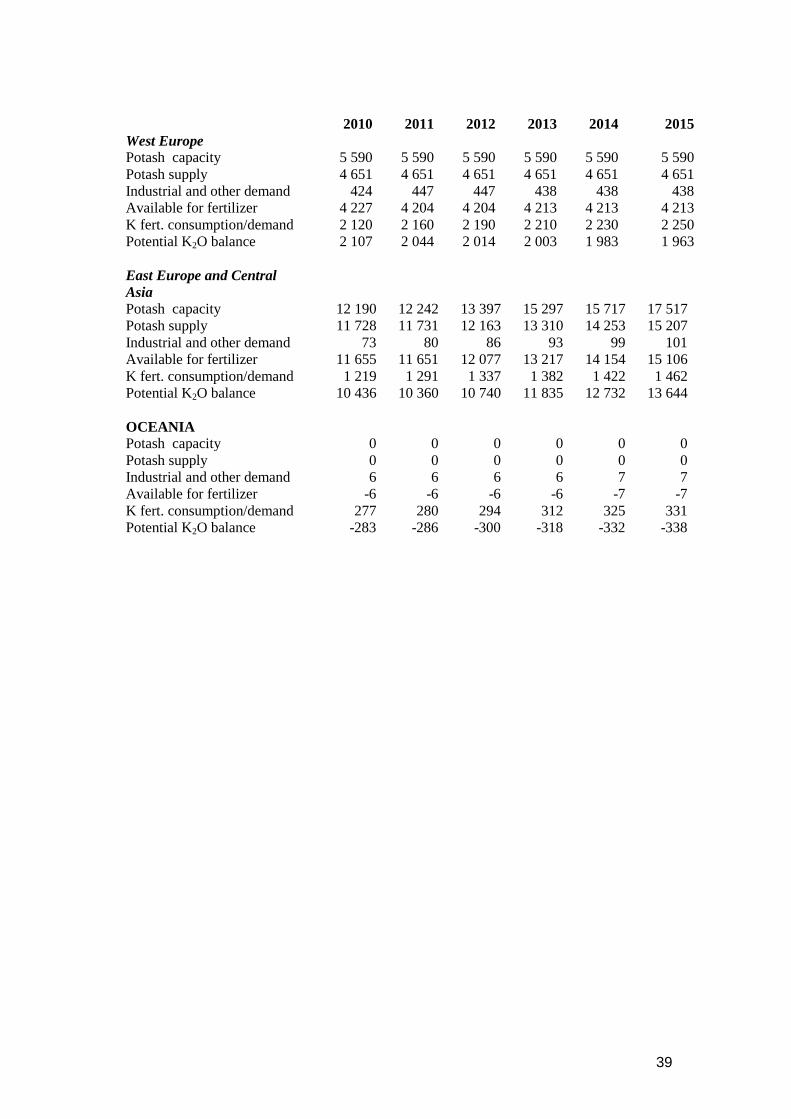
2010 2011 2012 2013 2014 2015
West Europe
Potash capacity 5 590 5 590 5 590 5 590 5 590 5 590
Potash supply 4 651 4 651 4 651 4 651 4 651 4 651
Industrial and other demand 424 447 447 438 438 438
Available for fertilizer 4 227 4 204 4 204 4 213 4 213 4 213
K fert. consumption/demand 2 120 2 160 2 190 2 210 2 230 2 250
Potential K2O balance 2 107 2 044 2 014 2 003 1 983 1 963
East Europe and Central
Asia
Potash capacity 12 190 12 242 13 397 15 297 15 717 17 517
Potash supply 11 728 11 731 12 163 13 310 14 253 15 207
Industrial and other demand 73 80 86 93 99 101
Available for fertilizer 11 655 11 651 12 077 13 217 14 154 15 106
K fert. consumption/demand 1 219 1 291 1 337 1 382 1 422 1 462
Potential K2O balance 10 436 10 360 10 740 11 835 12 732 13 644
OCEANIA
Potash capacity 0 0 0 0 0 0
Potash supply 0 0 0 0 0 0
Industrial and other demand 6 6 6 6 7 7
Available for fertilizer -6 -6 -6 -6 -7 -7
K fert. consumption/demand 277 280 294 312 325 331
Potential K2O balance -283 -286 -300 -318 -332 -338
40
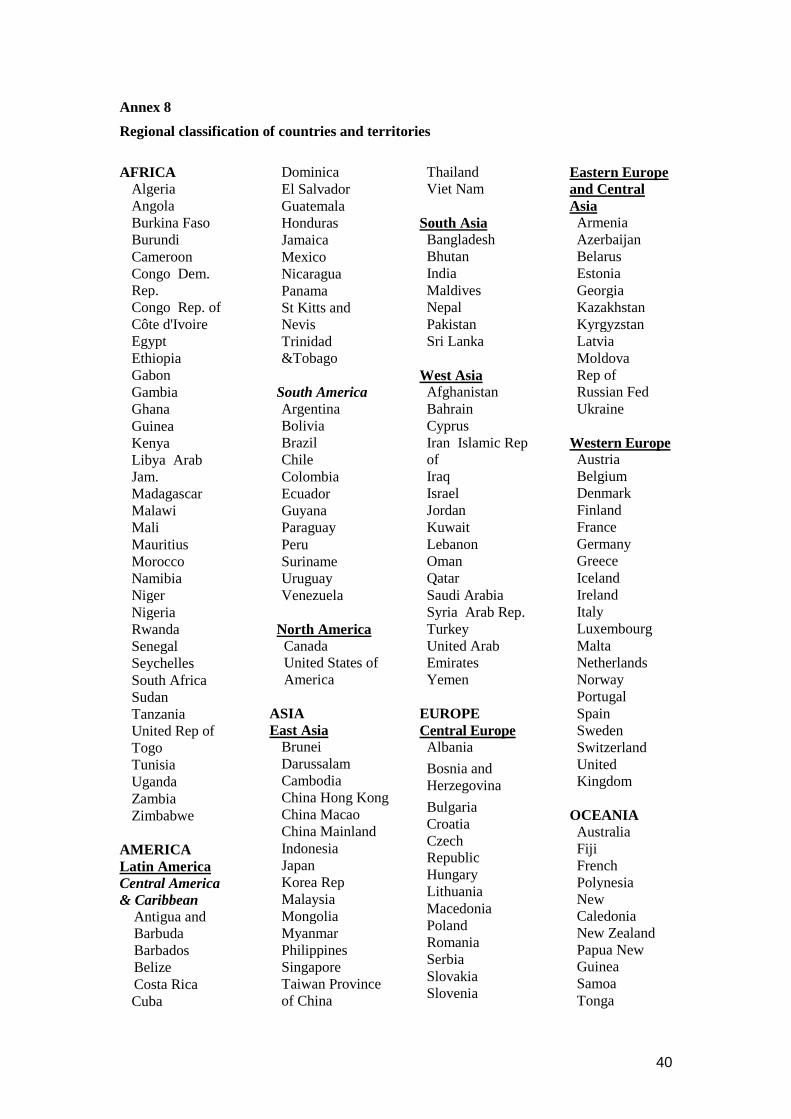
Annex 8
Regional classification of countries and territories
AFRICA
Algeria
Angola
Burkina Faso
Burundi
Cameroon
Congo Dem.
Rep.
Congo Rep. of
Côte d'Ivoire
Egypt
Ethiopia
Gabon
Gambia
Ghana
Guinea
Kenya
Libya Arab
Jam.
Madagascar
Malawi
Mali
Mauritius
Morocco
Namibia
Niger
Nigeria
Rwanda
Senegal
Seychelles
South Africa
Sudan
Tanzania
United Rep of
Togo
Tunisia
Uganda
Zambia
Zimbabwe
AMERICA
Latin America
Central America
& Caribbean
Antigua and
Barbuda
Barbados
Belize
Costa Rica
Cuba
Dominica
El Salvador
Guatemala
Honduras
Jamaica
Mexico
Nicaragua
Panama
St Kitts and
Nevis
Trinidad
&Tobago
South America
Argentina
Bolivia
Brazil
Chile
Colombia
Ecuador
Guyana
Paraguay
Peru
Suriname
Uruguay
Venezuela
North America
Canada
United States of
America
ASIA
East Asia
Brunei
Darussalam
Cambodia
China Hong Kong
China Macao
China Mainland
Indonesia
Japan
Korea Rep
Malaysia
Mongolia
Myanmar
Philippines
Singapore
Taiwan Province
of China
Thailand
Viet Nam
South Asia
Bangladesh
Bhutan
India
Maldives
Nepal
Pakistan
Sri Lanka
West Asia
Afghanistan
Bahrain
Cyprus
Iran Islamic Rep
of
Iraq
Israel
Jordan
Kuwait
Lebanon
Oman
Qatar
Saudi Arabia
Syria Arab Rep.
Turkey
United Arab
Emirates
Yemen
EUROPE
Central Europe
Albania
Bosnia and
Herzegovina
Bulgaria
Croatia
Czech
Republic
Hungary
Lithuania
Macedonia
Poland
Romania
Serbia
Slovakia
Slovenia
Eastern Europe
and Central
Asia
Armenia
Azerbaijan
Belarus
Estonia
Georgia
Kazakhstan
Kyrgyzstan
Latvia
Moldova
Rep of
Russian Fed
Ukraine
Western Europe
Austria
Belgium
Denmark
Finland
France
Germany
Greece
Iceland
Ireland
Italy
Luxembourg
Malta
Netherlands
Norway
Portugal
Spain
Sweden
Switzerland
United
Kingdom
OCEANIA
Australia
Fiji
French
Polynesia
New
Caledonia
New Zealand
Papua New
Guinea
Samoa
Tonga

41