Embed Size (px)
Citation preview

IOSR Journal of Pharmacy and Biological Sciences (IOSR-JPBS)
e-ISSN:2278-3008, p-ISSN:2319-7676. Volume 12, Issue 6 Ver. II (Nov. – Dec. 2017), PP 17-36
www.iosrjournals.org
DOI: 10.9790/3008-1206021736 www.iosrjournals.org 17 | Page
Current Trends in Performance of Forced Degradation Studies
and Stability Indicating Studies of Drugs
Panchumarthy Ravisankar1*, Vaka Swathi
1, Puttagunta Srinivasa Babu
1,
Md. Shaheem Sulthana1, SK. Gousepeer
1
1Department of Pharmaceutical Analysis and Quality Assurance, Vignan Pharmacy College, Vadlamudi,
Guntur – 522213 (A.P) India.
Corresponding Author: Panchumarthy Ravisankar
Abstract: The stability of a drug substance (or) drug product is a vital parameter which may affect purity,
safety and potency and. Changes in drug stability can threat patient safety by formation of a toxic degradation
product or products or deliver a lower dose than expected. Therefore it is necessary to know the purity profile
and behaviour of a drug substance under different environmental conditions. Forced degradation testing studies
are those undertaken to degrade the sample deliberately. These studies, which may be undertaken in the
development phase normally on the drug substances, are used to evaluate the overall photosensitivity of the
material for method development purposes and/or degradation pathway elucidation. The purpose of stability
testing is to give evidence on how the quality of a drug substance or drug product varies with time under the
influence of a variety of environmental factors such as temperature, humidity, and light, and to establish a re-
test period for the drug substance or a shelf life for the drug product and recommended storage conditions.
Stress testing of the drug substance can aid to identify the likely degradation products, which can in turn help
establish the degradation pathways and the intrinsic stability of the molecule and validate the stability
indicating power of the analytical procedures used. The nature of the stress testing will depend on the individual
drug substance and the type of drug product involved. Forced degradation studies show the chemical behavior
of the molecule which in turn aids in the development of formulation and package. Examining degradation
products under stress conditions is useful in establishing degradation pathways and developing and validating
suitable analytical procedures. However, it may not be necessary to examine specifically for certain
degradation products if it has been demonstrated that they are not formed under accelerated or long term
storage conditions. This review discusses the latest trends in performance of forced degradation studies and
also the development of stability indicating method.
Keywords: Drug product, Decomposition, Forced degradation, Stability indicating studies,
----------------------------------------------------------------------------------------------------------------------------- ----------
Date of Submission: 02-11-2017 Date of acceptance: 16-11-2017
----------------------------------------------------------------------------------------------------------------------------- ----------
I. Introduction An assay is an analytic procedure in pharmaceutical companies for qualitatively assessing or
quantitatively measuring the amount of an analyte. The analyte can be a drug or drug related substances. The
assay generally performed to measure a property of the analyte and express it in the measurement unit usually
in milligrams. Drug stability means the ability of the pharmaceutical dosage form to maintain the phys ical,
chemical, therapeutic or microbial properties throughout the time of storage and usage by the patient. It can
be measured by rate of changes that take place in the pharmaceutical ingredient in completed pharmaceutical
dosage forms. Changes in drug stability can risk patient safety by formation of a toxic degradation product(s) or
deliver a lower dose than expected. Thus, it is vital to know the purity profile and behaviour of a drug substance
under a variety of environmental conditions.
As stated by United States Food and Drug Administration guidelines, a Stability-Indicating method [1]
is defined as a validated analytical procedure that accurately and precisely measures active ingredients free
from potential interferences like degradation products, process impurities, excipients, or other potential
impurities, and the FDA recommends that all assay procedures for stability studies be stability indicating. The
definition in the draft guideline of 1998 read as ―Validated Quantitative analytical methods that can detect the
changes with time in the chemical, physical, or microbiological properties of the drug substance and drug
product, and that are specific so that the contents of active ingredient, degradation products, and other
components of interest can be accurately measured without interference‖. Stability-Indicating Method are
validated quantitative test methods that can detect changes with time in the chemical, physical, or
microbiological properties of drug substances or drug products. They are specific so that the quantity of the
active ingredient, degradation products and other components of interest may be accurately measured without

Current Trends in Performance of Forced Degradation Studies and Stability Indicating Studies of
DOI: 10.9790/3008-1206021736 www.iosrjournals.org 18 | Page
interference in the material being tested. A degradation product is a molecule resulting from a change in the
active ingredient brought about over time as a result of processing or storage.
The regulation requires a formal written stability testing program whose results are used to establish
storage conditions and expiration dates of drug products and further mandates the use of ―reliable, meaningful,
and specific test methods.‖ A drug application is expected to contain ―a full description of the drug substance or
drug product including its physical and chemical characteristics and stability‖ as well as ―such specifications
and analytical methods as are necessary to assure the identity, strength, quality, purity and bioavailability of the
drug product, and stability data with proposed expiration dating.‖ If such documentation is generated to support
a regulatory submission such as an Investigational New Drug Application (IND), Drug Master File (DMF) or
generated to satisfy cGMP requirements for a non-application drug substance or drug product. These data are
used to establish, confirm or extend retest intervals (usually) or expiration dating periods (if unstable) for drug
substances and expiration dating periods for drug products.
The stability indicating method assay is a method that is employed for the analysis of stability
samples in pharmaceutical industry. Under the guidance of International Conference on Harmonization (ICH)
guidelines, the requirement of establishment of stability indicating method assay method has become more
compulsory for the launch of finished dosage form in the market. The guidelines explicitly require conduct of
forced decomposition studies under a variety of conditions, like pH, light, oxidation, dry heat, etc. and
separation of drug from degradation products. The method is anticipated to allow analysis of individual
degradation products.
II. Forced Degradation Studies The ICH guideline Q1A on Stability Testing of New Drug Substances and Products gives indications
for the testing of parameters which are may be susceptible to change during long storage and are likely to
affect quality, safety and efficacy must be done by validated stability indicating testing methods. It is
mentioned that forced degradation studies [2] or stress testing at temperatures in 10 °C increments above the
accelerated temperatures, extremes pH and under oxidative and photolytic conditions have to be carried out
on the drug substance so to set up the stability characteristics and degradation pathways to back up the
suitability of the proposed analytical procedures.
2.1 Objectives of forced degradation studies are carried out to attain the following purposes:
Provide evidence on how the quality of a drug substance or drug product varies with time under the
influence of a variety of environmental factors such as temperature, humidity, and light. Lack of drug substance
or drug product stability may affect the purity, potency, and safety of the drug product.
To establish the degradation pathways of drug substances and drug products.
How each one of these factors has the capability to catalyze, accelerate or mediate one or more of the
various degradation reactions like hydrolysis, oxidation, photolysis (photolysis) or some other unwanted
conversion of the drug substance or drug product and understanding the degradation mechanism.
To determine the intrinsic stability of a drug substance in formulation.
To provide information on drug substance / product characteristics. Identification of potential degradants.
Develop of stability indicating assay of developed method.
Establish a re-test period for the drug substance or a shelf life of the drug product and recommended storage
conditions.
To generate more stable formulations.
To differentiate degradation products that are related to drug products from those that are generated from
non-drug product in a formulation
Process development, design and optimization of manufacturing process.
To elucidate the structure of degradation products.
To understand the chemical properties of drug molecule.
Design of formulation (including selection of excipient for formulation.)
To generate a degradation profile similar to that of what would be observed in a formal stability study under
ICH conditions.
Packaging development, and
To solve the stability related problems.
Stability studies are used to provide data to support clinical trials, registration submission, or
commercialization.
Different forced degradation conditions utilized for drug substances and finished dosage form is shown in
the "Fig. 1" and Conditions commonly applied for forced degradation is tabulated in "Table 1".

Current Trends in Performance of Forced Degradation Studies and Stability Indicating Studies of
DOI: 10.9790/3008-1206021736 www.iosrjournals.org 19 | Page
2.2. Forced degradation includes:
1. Photolytic
2. Thermal
3. Humidity
4. Acid/Base Hydrolysis
5. Oxidative
Figure 1: Different forced degradation conditions used for drug substances and finished dosage form
Table 1: Conditions usually applied for forced degradation studies
Degradation type Experimental conditions Storage conditions Sampling time
Hydrolysis
0.1 N HCl 40 ºC, 60 ºC 1,3,5 days
0.1 N NaOH 40 ºC, 60 ºC 1,3,5 days
pH: 2, 4, 6, 8 40 ºC, 60 ºC 1,3,5 days
Oxidative
3% H2O2 25 ºC, 60 ºC 1,3,5 days
Peroxide control 25 ºC, 60 ºC 1,3,5 days
Azobisisobutyronitrile (AIBN) 40 ºC, 60 ºC 1,3,5 days
Photolytic Light, 1 X ICH NA 1,3,5 days
Light, 3 X ICH NA 1,3,5 days
Light control NA 1,3,5 days
Thermal
Heat environment 60 ºC 1,3,5 days
Heat environment 60 ºC / 75% RH 1,3,5 days
Heat environment 80 ºC 1,3,5 days
Heat environment 80 ºC / 75 % RH 1,3,5 days
Heat control Room temperature 1,3,5 days
2.2.1. Appropriate Time to perform forced degradation:
The forced degradation studies are not performed earlier it is very vital to conduct them during the
phase III (FDA guidance states) to demonstrate the stability of a drug substance, potential degradation
pathways and capability and suitability of proposed analytical procedures. The forced degradation studies
conducted in a single batch. These studies are most useful if done initially in early development or phase I
clinical trials which provides timely recommendations for improvement in the manufacturing process, ensure
there is suffice time for degradation product identification, proper selection of stability indicating analytical
technique, degradation product identification and optimization of stress conditions which will help later in
manufacturing process.
2.2.2. Limits for degradation ( How much degradation is sufficient):
The question is how much stressing is suffice has been the subject of much discussion amongst
pharmaceutical scientists. Usually degradation of drug substance between 2 % - 30 % is considered as
reasonable and acceptable for validation of chromatographic assays. Some Pharmaceutical scientists have
agreed that approximately 10 % degradation is optimal for use in analytical validation. For small
pharmaceutical molecules for which acceptable stability limits of 90 % of label claim is common. In the event
that the experimental conditions generate no or little degradation due to the experimental stability of the
molecule, an evaluation should be made to verify if the drug substance has been exposed to energy in excess
Forced degradation study
Drug substance Drug product
Solutions/suspension-
Acid hydrolysis
- Base hydrolysis
- Oxidative
Semi-solids
-Photolytic
-Oxidative
-Thermal
- Humidity
Solids
- Photolytic
- Thermal
- Humidity
Solutions
- Photolytic
- Thermal
- Oxidative
Solids
-
Photolytic
-Thermal
-
Humidity

Current Trends in Performance of Forced Degradation Studies and Stability Indicating Studies of
DOI: 10.9790/3008-1206021736 www.iosrjournals.org 20 | Page
of the energy provided by accelerated storage (ie., 40 0C for six months). If the answer is yes, then the
experiment should be stopped and note of the stability of the drug substance can be made.
2.2.3. Selection of drug concentration:
Which concentration of the drug should be used for the degradation study has not been specified in
regulatory guidance. It is recommended that the studies should be initial concentration of 1 mg/ml. By using
drug concentration of 1mg/ml it is generally possible to get even minor decomposition products in the range
of detection. It is also suggested that some degradation studies should be done at a concentration which the
drug is expected to be present in the final formulations.
2.3. Conditions Generally employed for forced degradation
Strategy [3] and stress treatment [4]: Generally speaking one does these types studies is to subject
the material to various stress conditions. Then determine the extent of degradation based on decrease in
parent component response which can seen by chromatographic method.
The first question is how much you want to degrade a material?. Infact target a general 2- 30 % range of
degradation as an acceptable sample [5]. Use the sample for method development or method evaluation to
achieve a stability indicating assay. The high end is a desired target for the purpose of avoiding secondary
degradation. Can go higher if the degradation pattern is simple that is to say 1-2 peaks are formed. Many need
to go lower if observe significant non-specific degradation with numerous peaks or may conclude that
material highly stable under a given stress condition.
Primary Vs secondary degradation products: Stress treatments [6] should target a reasonable amount of
degradation, based on decrease of the parent response. One should observe emergence of primary degradation
products. Secondary degradation peaks are what result from breakdown of primary degradation products.
They are usually irrelevant and make the method development job unnecessarily more difficult.
When the degradation level is good (< 15 %), where one or more relevant degradants are observed :
Predictive.
When the degradation level is good (< 15 %), but no relevant degradants are observed : Deceptive.
Between 15 - 100 % degradation, but no relevant degradants are observed : useless.
How long do you go for stress treatment for drug substances?. First focus on the solid material stress
treatments. Make best effort possible to get degradation for thermal stress. If no degradation at 120 0C by 7
days, likely can stop. Consider aqueous unbuffered stress as an extreme humidity exposure. Stress for light at
1X-2X the ICH limits. Aqueous conditions typically viewed more as informational. If no degradation at 55 OC by two days likely can stop.
Forced degradation studies [7-10] used for degradation of drug product or drug substance are mentioned
bellow.
2.3.1. Hydrolytic degradation (Acidic and basic hydrolysis):
Hydrolytic degradation is one of the most frequent degradation chemical reactions over a wide range of
pH. Hydrolysis is a chemical process that includes decomposition of a chemical compound by reaction with
H2O. Hydrolytic degradation under acidic and basic condition involves catalysis of ionizable functional groups
present in the molecule. Base or acid degradation testing involves forced degradation of a drug substance by
exposure to acidic or basic conditions which generates primary degradants in desirable range. The selection of
the type and concentrations of acid or base depends on the stability of the drug substance. HCl or H2SO4 (0.1 to
1 M) for acid hydrolysis and NaOH (or ) KOH (0.1–1 M) for base hydrolysis are suggested as suitable reagents
for hydrolysis. If the compounds for stress testing are poorly soluble in water, then co-solvents can be used to
dissolve them in hydrochloric acid or Sodium hydroxide. Stress testing trial is normally started at room
temperature and if there is no degradation, elevated temperature (50 – 70 °C) is applied. Stress testing should
not exceed more than seven days. The degraded sample is then neutralized utilizing suitable acid, base or buffer,
to stop further decomposition.
2.3.2. Oxidative conditions:
H2O2 is extensively utilized for oxidation of drug substances in stress studies but other oxidizing
agents such as metal ions, oxygen, and radical initiators (e.g., AIBN ie., 2,2-Azobisisobutyronitrile, ACVA
(Azobiscyan-valeric acid) and AMPD (Azobis methyl propionamide dihydrochloride) can also be used.
Selection of an oxidizing agent, its concentration, and conditions depends on the drug substance. It is reported
that subjecting the solutions to 0.3 – 3 % dilute H2O2 at neutral pH and room temperature for 7 days or up to a
maximum 20 % degradation could potentially generate relevant degradation products. The oxidative degradation
of drug substance rivet an electron transfer mechanism to form reactive anions and cations. Reacts with low
energy C-H bonds, amines, sulfides and carbon-carbon double bonds are susceptible to peroxide radical and
give corresponding N - oxides, sulfoxides and epoxides respectively. The functional group with labile hydrogen
like benzylic carbon, allylic carbon, and tertiary carbon or α-positions with respect to hetero atom is susceptible
to oxidation to form hydro peroxides and ketones.
2.3.3. Photolytic conditions: Light exposure (Photostability)

Current Trends in Performance of Forced Degradation Studies and Stability Indicating Studies of
DOI: 10.9790/3008-1206021736 www.iosrjournals.org 21 | Page
Stability of component as function of light exposure. Photo stability studies are performed to generate
primary degradants of drug substance by exposure to ultra violet or fluorescent conditions. Samples of drug
substance and solid/liquid drug product should be exposed to a minimum of 200 W h/m2 light. The most
commonly accepted wavelength of light is in the range of 300 - 800 nm to cause the photolytic degradation.
Light stress conditions can induce photo oxidation by free radical mechanism. ICH guideline options
requirements widely regarded. UV exposure -NLT 200 watts (sq meters). Visible exposure- NLT 1.2 Million
lux-hrs. Functional groups like carbonyls, nitro aromatic, N-oxide, alkenes, aryl chlorides, weak C-H and O-H
bonds, sulfides and polyenes are likely to introduce drug photosensitivity. Options per ICH Q1B: Any light
source with output similar to D65/ID65 emission standard, such as (i) artificial daylight fluorescent lamp
combining visible and UV outputs (ii) xenon lamps or (iii) metal-halide lamps. A cool white fluorescent lamp
per ISO 10977 and a near UV fluorescent lamp having a spectral distribution 320 - 400 nm with a maximum
energy emission 350 - 370 nm. A significant portion should be in both bands 320 - 360 nm and 360 - 400 nm.
2.3.4. Thermal degradation:
It should be carried out at more strenuous conditions than recommended ICH Q1A accelerated testing
conditions. Typically performed on solid samples. Samples of solid-state drug substances and drug products
should be exposed to dry and wet heat, while liquid drug products should be exposed to dry heat. Studies may
be conducted at higher temperatures for a shorter period. Effect of temperature on thermal degradation of a
substance is studied through the Arrhenius equation: k = Ae−Ea/RT
(1)
where k is specific reaction rate, A is frequency factor, Ea is energy of activation, R is gas constant
(1.987 cal/deg mole) and T is absolute temperature. Thermal degradation study is carried out at 40–80 °C.
DSC/TGA data can reveal properties such as decomposition and sublimation, which can influence temperatures
limits. Arrhenius model assumption is for every 10OC increase, the degradation rate is doubled. For every 10
OC
decrease, the degradation rate is halved. This will work most of the time at reasonable temperature ranges. This
is helpful when under or over degrade your sample and want to get within target range.
III. Stability Indicating Assay Method (Siam) The stability-indicating assay method [11-12] is utilized for the analysis of stability samples in
pharmaceutical industry. With the advent of ICH guidelines, the requirement of establishment of stability-
indicating assay method (SIAM) has become more clearly mandated. The guidelines explicitly require conduct
of forced decomposition studies under a variety of conditions, like pH, light, oxidation, dry heat, etc. and
separation of drug from degradation products.
3.1. Stability of a pharmaceutical ingredient depends on many factors which majorly include the
following factors:
Temperature: High temperature accelerate oxidation, reduction and hydrolysis reaction which lead to
drug degradation
pH: Acidic and alkaline pH influence the rate of decomposition of most drugs. Depending on the amount
of ionization drug degradation increases.
Moisture: Water aid in catalysis of the degradation process.
Light: Affects drug stability through energy or thermal heat which lead to oxidation of ingredients .
Drug Incompatibility: Some other components which are present in finished pharmaceutical drug product
can show reactions between components itself or between these components and cover of the container.
3.2. Advantages of HPLC over other methods used for SIAM development
HPLC is the most specific technique for the separation of analytes, impurities, and degradation products.
Limit of detection of analyte for HPLC is low as compared to other techniques, i.e., it possesses greater
sensitivity when juxtapose with other techniques utilized for development of SIAM.[13-14]
HPLC needed less time for separation and quantification of analytes and degradation Products.
It gives improved resolution between the analytes and impurities with wide variety of stationary phases.
It is having greater sensitivity for the detection of small amounts of analytes and degradants as various
detectors can be utilized for the detection of response.
Another important advantage of HPLC is its reusable columns which can be used several times for the
analysis which makes it cost effective technique.
The technique is completely automated and quantification can also be done using this technique.
HPLC has been very widely employed. It has gained popularity in stability studies due to its high-resolution
capacity, sensitivity and specificity. Non-volatile, thermally unstable compounds can also be analyzed by
this technique. Thus, most of the SIAM have been established well using HPLC [15].
3.3. Regulatory Status of Stability-Indicating Assays
The ICH guidelines have been incorporated as law in the EU, Japan and in the US, but in reality,
besides these other countries are also using them. As these guidelines reflect the current inspectional tendencies,
they carry the de facto force of regulation.

Current Trends in Performance of Forced Degradation Studies and Stability Indicating Studies of
DOI: 10.9790/3008-1206021736 www.iosrjournals.org 22 | Page
ICH defines SIAM as quantitative analytical methods that are based on the characteristic structural,
chemical or biological properties of each ingredient of a drug product and that will distinguish each active
ingredient from its degradation products so that the active ingredient content can be accurately measured.
USFDA defines SIAM as Validated quantitative analytical methods that can detect the changes with time in the
physical, chemical or microbiological properties of the drug substance and drug product and that are specific so
that the contents active ingredient degradation products, and other components of interest can be accurately
measured without interference. Regulatory guidelines for stability testing is shown in "Table 2".
Table 2: Regulatory guidelines for stability testing Guideline Title
Q1A(R2) Stability testing of new drug substances and products.
Q1B Stability testing :photo stability testing of new drug substances and products.
Q1C Stability testing for new dosage forms.
Q1D Bracketing and matrixing designs for stability testing of new drug substances and products
Q1E Evaluation for stability data.
Q1F Stability data package for registration applications in climatic zones iii and iv.
Q5C Quality of biotechnological products: stability testing of Biotechnological/ biological
products.
Regulatory guidelines Various International guidelines recommended forced degradation studies
ICH guidelines sometimes apply only to the marketing applications for new products and do not cover the
part during clinical development. The ICH guidelines that are applicable to forced degradation studies are
ICH Q1A: Stability testing of new drug substances and products.
ICH Q1B: Photo stability testing of new drug substances and products.
ICH Q2B: Validation of analytical procedures: Methodology.
3.3.1. ICH Q1A (Stress testing): Recommended conditions for performing forced degradation studies on drug
substances and drug products. The recommendations are to inspect the results of temperature (above that for
accelerated testing, i.e., >50 C), humidity (75% relative humidity), oxidation and photolysis. Wide pH range
should be considered in the testing of solution or suspension. Eventually the stability-indicating method
developed from these samples.
3.3.2. ICH Q1B: Recommended approaches to assessing the photo stability of drug substances and drug
products. For drug substance and drug product forced degradation conditions are specified in photo stability
testing can be performed. These samples are then used to develop a stability indicating method. Some of the
degradation products formed during forced degradation studies may not really be experiential to form during
stability studies in which case they need not be examined further.
3.3.3. ICH Q2B: Gives guidance to validate the analytical methodology. To prove specificity, in section B
1.2.2 (impurities not available) there is a suggestion to utilize samples from forced degradation studies.
Whether the analytical method is stability indicating or not ‗specificity‘ is a key factor.
3.3.4. ICH Q3A (R2): [16] With respect to both chemistry and safety prospects the identification of each
impurity is required. The chemical prospects include classification and identification of impurities, report
creation, catalogue of impurities in the specification and a concise discussion of analytical methods. The
safety prospects include specific guidance for qualifying those impurities that were not present at
significantly minor levels in batch of a new drug substance.
3.4. Stability of pharmaceuticals
There is specification regarding quality and quantity attributes of pharmaceuticals, that‘s why change in
those attributes with time can be used to quantify in terms of stability of that drug substance or drug product so
related substances or shelf life of those. Commonly, the utmost shelf life for any product is five years.
pharmacopoeia limit for most of the drug substances (API):- 98 - 102 %
General pharmacopoeia limit for most of the drug products:- 95 - 105 %
According to the above general sentence, any API has an active ingredient lesser than 98 % or drug product
having active ingredient lesser than 95 % are due to degradation of active ingredients.
3.5. Importance of Stability-Indicating Analytical Methods
The introductory section addresses the various attributes that define analytical methods as stability
indicating as it relates to currently mandated regulatory testing of drug substances and drug products.
Pharmaceutical considerations regarding when and why it is necessary to employ such specialized validated
analytical procedures in the pharmaceutical laboratory are highlighted. Evaluation of analytical methods used in
formal drug substance and drug product stability programs is presented.
A Stability-Indicating Method (SIM) is a quantitative analytical procedure used to detect a decrease in
the amount of the Active Pharmaceutical Ingredient (API) present due to degradation. According to United

Current Trends in Performance of Forced Degradation Studies and Stability Indicating Studies of
DOI: 10.9790/3008-1206021736 www.iosrjournals.org 23 | Page
States Food and Drug Administration (USFDA) guidelines, a SIM is defined as a validated analytical procedure
that accurately and precisely measures active ingredients (drug substance or drug product) free from potential
interferences like degradation products, process impurities, excipients, or other potential impurities, and the
FDA recommends that all assay procedures for stability studies be stability indicating. The definition in the draft
guideline of 1998 read as ―Validated Quantitative analytical methods that can detect the changes with time in
the chemical, physical, or microbiological properties of the drug substance and drug product, and that are
specific so that the contents of active ingredient, degradation products, and other components of interest can be
accurately measured without interference‖. SIM are validated quantitative test methods that can detect changes
with time in the chemical, physical, or microbiological properties of drug substances or drug products. They are
specific so that the quantity of the active ingredient, degradation products and other components of interest may
be accurately measured without interference in the material being tested. A degradation product is a molecule
resulting from a change in the active ingredient brought about over time as a result of processing or storage (e.g.
oxidation, hydrolysis).
The regulation requires a formal written stability testing program whose results are used to establish
storage conditions and expiration dates of drug products and further mandates the use of ―reliable, meaningful,
and specific test methods.‖ A drug application is expected to contain ―a full description of the drug substance or
drug product including its physical and chemical characteristics and stability‖ as well as ―such specifications
and analytical methods as are necessary to assure the identity, strength, quality, purity and bioavailability of the
drug product, and stability data with proposed expiration dating.‖ If such documentation is generated to support
a regulatory submission such as an Investigational New Drug Application (IND), Drug Master File (DMF) or an
(A) NDA or generated to satisfy cGMP requirements for a non-application drug substance or drug product.
These data are used to establish, confirm or extend retest intervals (usually) or expiration dating periods (if
unstable) for drug substances and expiration dating periods for drug products.
IV. High Performance Liquid Chromatography The prominent principle of HPLC is that a sample of a solution of the substances is injected into a
column of a stationary phase and a mobile phase is pumped through the column. The separation of substances is
based on differences in rates of migration through the column arising from different partition of the substances
between the stationary phase and the mobile phases. Depending on the partition behaviour of the different types
of substances, these will elute at different times from column outlet.
Generally HPLC is divided in to 2 types
Normal-phase high performance liquid chromatography (NP-HPLC)
A relatively polar material i.e., water-soluble or hydrophilic with a high specific surface area is utilized
as the stationary phase, silica being the most popular, but alumina and magnesium oxide are also often used. The
mobile phase is relatively non-polar i,e., fat soluble or lipophilic as heptane or tetrahydrofuran. Polar drugs are
eluted later than non-polar drugs.
Reverse-Phase high performance liquid chromatography (RP-HPLC)
In RP- High Performance liquid chromatography is the term utilize to describe the state in which the
stationary phase is less polar than the mobile phase. Chemically bonded Octadecylsilane, an n-alkane with 18
carbon atoms, is the mainly utilized stationary phase. C8 and shorter alkyl chains and also cyclohexyl and phenyl
groups provide other alternatives. Phenyl groups are more polar than alkyl groups. The reverse of the above
applies that the stationary phase is very non-polar and mobile phase is relatively polar. So, non-polar drugs are
eluted later than polar drugs.
4.1. Need for HPLC method development
The evolutionary process of HPLC method development [17] and utilization at every stage of the drug
development process is to accomplish the scientific, regulatory, and business needs of a pharmaceutical
industry. Throughout the development process is critical to learn quickly all the desired information about the
compound under consideration. In this manner a therapeutic indication for the compound can be estimated, as
well as any potential adverse indications that may lead to the demise of the compound.
HPLC method development and validation play important role in the discovery, development and manufacture
of pharmaceutical products. The official test methods that result from the developmental processes are used by
quality control laboratories to ensure the identity, purity, potency, and performance of drug products.
Identification and quantification of impurities is a crucial task in pharmaceutical process development or quality
and safety. There is a great need for development of new analytical methods for quality evaluation of new
emerging drugs.
4.1.1. Early phase method development:
The primary objective of early phase method development is to gain a fundamental knowledge of the
chemistry of drug substances and drug products to facilitate optimization of synthetic schemes and drug product
formulations. Also, methods are required for release and stability studies to support clinical trials and must

Current Trends in Performance of Forced Degradation Studies and Stability Indicating Studies of
DOI: 10.9790/3008-1206021736 www.iosrjournals.org 24 | Page
assure that products are safe in vivo. Eventually, the knowledge gained during early development translates into
designing control methods for commercial supplies that assure patient safety and efficacy. To address changes
in the impurities and degradation product profiles generated during these activities, a systematic approach to
method development using an array of methods is advocated as a means of obtaining full knowledge of drug
substance and drug product chemistry. Key elements of the approach include the generation of degradation
products via forced decomposition and a continual evaluation of samples generated during the early
development cycle.
4.1.2. Late phase method development:
The late-phase methods are filed with regulatory authorities and are used for stability studies and for
the release of the drug product or drug substance validation batches. For release testing of production batches,
the methods are generally transferred to the operational quality control laboratories. Therefore, the aim of late-
phase method development is to develop quick, robust, reliable, and transferable high performance liquid
chromatographic methods. In this context, it is crucial to devote adequate time, thoughts, and resources to the
development of late-phase analytical methods.
4.2. Method development
Method development process never ends because every analyst could face any kind of problems and
there will be a question arises what is the acceptable method performance. The acceptable method
performance determined by the following objectives such as analyte, resolution, analysis time, adaptability
for Automation, accuracy and precision.
4.2.1. Analytes
Significant degradation products observed during stress testing should be investigated in the stability
indicating method development. Based on the ICH guidelines on specifications, the related method for active
pharmaceutical ingredients (API) should focus on both the API degradation products and synthetic impurities,
while during the same method for drug products should focus only on the degradation products. In general
practice, unless there is any special toxicology concerns with the related substances below the limit of
quantification (LOQ) should not be reported and therefore should not be identified. In this stage, relevant
related substances should be separated into two groups.
Significant related substances: Accuracy, Linearity, and response factors should be established for the
significant related substances during the method validation. To decrease the workload during method
development, mostly three or less significant related substances should be preferred in a method.
Other related substances: These are potential degradation products that are not significant in amount. The
developed high performance liquid chromatography conditions needs only to provide good resolution for
these related substances to show that they do not present in significant levels.
4.2.2. Resolution (RS):
A stability indicating method must resolve all significant degradation products from each other.
Generally the minimum requirement for baseline resolution is 1.5. This limit is valid for two Gaussian - shape
peaks of equal size. In actual method development, RS = 2.0 should be used as a minimum to account for day
to day variability, differences in peak sizes and non-ideal peak shapes.
4.2.3. Precision and Accuracy
Expectations for precision and accuracy should be determined by case basis. For a typical assay
method, mostly the relative standard deviation of six replicates should be less than 2 % and accuracy should
be within 95 % to 105 %.
4.2.4. Analysis time
A run time of about ten to fifteen minutes per injection is suffice in routine substance analyses.
Unless the method is intended to support a high-volume assay, shortening the run time is not recommended as
it may compromise the method performance in other aspects (e.g., specificity, precision and accuracy).
4.3. Development of stability indicating chromatographic conditions For selecting initial chromatographic condition for stability indicating methods for novel molecule,
frequently important to make sure about that degradants are in solution, separated and detected. The regular
separation variable includes flow mode, solvent types, mobile phase pH, column type and temperature.
4.3.1. Gradient Mode or Isocratic
Selection of isocratic or gradient mode generally depends on the number of active ingredient to be
separated. Commonly gradient mode is utilized for stability assessment but isocratic mode are more
preferable in day to day analysis. In Gradient mode Solvent strength increased with time and degradation
products are formed and monitored helps to resolve complete mixture.

Current Trends in Performance of Forced Degradation Studies and Stability Indicating Studies of
DOI: 10.9790/3008-1206021736 www.iosrjournals.org 25 | Page
4.3.2. Solvent type
The starting solvent selected for a given separation can be chosen by matching the relative polarity
of the solvent to that of the sample. This is done as a first approximation by selecting the solvent to match the
most polar functional group on the sample molecule (e.g. alcohols for OH, amines for NH 2, etc.). From this
attempt, the separation can be refined by the following procedure:
If the sample appears at the solvent front then the solvent is too polar to allow the adsorbent to retard the
sample.
Conversely if the sample does not appear in reasonable times go to a solvent or solvent blend lower down
(higher polarity) on the scale. Solvent type (methanol, acetonitrile and tetra hydro-furan) will affect
selectivity.
The choice between methanol and acetonitrile may be dependent on the solubility of the analyte as well
as the buffer used.
4.3.3. pH Mobile Phase
Most pharmaceutical compounds contain ionisable functionalities such as amino, pyridine and
carboxylic acid. A goal for the band spacing of a solute should be in the range of a 4 to 9 and run time of 10
minutes or 15 minutes for most routine product or stability runs. When the sample is eluted with a mobile
phase of 100 % (organic), there is no separation, as the sample is eluted in the void volume. This is because
the sample is not retained; but retention is observed when the mobile phase solvent strength is decreased to
allow equilibrium competition of the solute molecules between the bonded phase and the mobile phase.
Introduction of new packing material that are stable over a wide range of pH up to pH 12 .
4.3.4. Role of the column and mobile phase
The most significant part of HPLC is the column. Use of the different column will have mostly
effect on the resolution of the analytes. The main components of the HPLC column are column housing,
matrix and stationary phase. HPLC columns are made by packing the column housing with the spherical
silica gel coated with the hydrophobic stationary phase. The nature of the stationary phase has greatest effect
on the capacity factor, selectivity, efficiency and elution. The nature of the stationary phase will determine
whether a column can be used for normal phase or reverse phase chromatography. There are different types
off the matrix for the supports of the stationary phase are used including alumina, polymers, silica and
zirconium. Silica is the commonly used matrix for the column. Silica matrices are robust, having consistent
sphere size, easily derivatized and does not compress under pressure. Standard C18 Columns and similar
stationary phases will undergo phase collapse at highly aqueous mobile phases, typically at less than 5 -10 %
organic composition; this will decrease analyte-stationary phase interaction. Collapsed phases are also
difficult to re-equilibrate. To prevent phase collapse, C18 columns with a polar group embedded in the alkyl
chain have been developed to help solvate the hydrophobic chain in > 90 % aqueous mobile phases. Various
types of columns and their applications are summarized in "Table 3".
Table 3: Various types of columns and their applications COLUMN PHASE SOLVENTS APPLICATION
C18 Octadecyl Acetonitrile,
Methanol, Water
Examples of analytes that can be separated on
C18 columns: Organic compounds: small molecules (< 2,000
mw).
Peptides DNA
RNA oligonucleotides
Vitamins
Steroids
Herbicides
Pharmaceutical compounds
C8 Octyl Acetonitrile,
Methanol, Water
Small molecule (less than 2,000 mw),
pharmaceuticals, halides, vitamins, amino
acids, vitamins, herbicides, nucleic acids, Polycyclic aromatic hydrocarbons (PAH)
Ionizable organic compounds, Steroids
Peptide fragments.
Phenyl Stationary phase phenyl group having unique
selectivity for the Premier Phenyl phase is
derived from an interaction of the pi-electrons found in the phenyl groups. These
pi-electrons can enhance the selectivity of
aromatic compounds through an induced polarization of electrons. A unique
proprietary bonding process yields a phenyl
phase with improved pH stability and
Acetonitrile,
Methanol, Water
Particularly useful in the analysis of aromatic
containing compounds, Fatty acids, analgesics.

Current Trends in Performance of Forced Degradation Studies and Stability Indicating Studies of
DOI: 10.9790/3008-1206021736 www.iosrjournals.org 26 | Page
increased reliability.
Cyano Cyanopropyl
(Cyano more resistant to degradation from
acidic mobile phases than conventional cyano columns).
Acetonitrile,
Methanol,
Water, THF
Cyano columns are generally used in polar
pharmaceuticals such as anticonvulsants and
antimicrobials Aldehydes and ketones, flavonoids.
4.3.5. Column temperature
Column temperature is important for method reproducibility as temperature mainly affect the
selectivity. A target temperature range of 30 - 40 °C is normally sufficient for excellent reproducibility. The
temperature may affect selectivity pattern because analytes will respond to different temperature. Use of the
higher temperature can be effective for different reasons ie., Working at higher temperature than ambient
temperature reduces the viscosity of the mobile phase and for that backpressure on the column reduces
system pressure allow for faster flow rate and faster analysis.
4.3.6. Peak purity
An essential for separation analysis is the ability to verify the purity of the separated species, ie. To
ensure that no co-eluting or co-migrating impurity contributes to the peak response.To assess for the presence
of impurities under the main peak is an essential part of the validation of a stability indicating method. Direct
evaluation can be performed in-line by employing PDA detection. Indirect evaluation of peak purity can be
accomplished by changing one or more chromatographic parameters such as column, gradient composition,
mobile phase etc. That will significantly impact the separation selectivity. The resulting impurity profile is
then compared against that of the original method. If the number of degradants peaks is the same in both
separations, and if the per cent of the main component is the same in both separations, then there can be
reasonable confidence that all the degradants have been resolved from the main component.
4.4. Method validation parameters [18-25]
Proper validation of analytical method is important for pharmaceutical analysis when endurance of the
continuing efficacy and safety of each batch manufactured relies solely on the determination of quality. The
ability to control this quality is dependent upon the ability of the analytical methods, as applied under well-
defined conditions and at an established level of sensitivity, to give a reliable demonstration of all deviation
from target criteria. Analytical method validation is now required by regulatory authorities for marketing
authorizations and guidelines have been published. It is important to isolate analytical method validation from
the selection and development of the method. Method selection is the first step in establishing an analytical
method and consideration must be given to what is to be measured, and with what accuracy and precision.
4.4.1. Specificity
Developing a separation method for HPLC involves demonstrating specificity, which is the ability to
assess unequivocally the analyte in the presence of components which may be expected to be present. Typically
these potential sample components include placebo formulation, synthesis intermediates, excipients, degradation
products and process impurities and matrix etc. Lack of specificity of an individual analytical procedure may be
compensated by other supporting analytical procedures. Identification: To ensure the identity of an analyte.
Purity tests: To ensure that all the analytical procedures performed allow an accurate statement of the content of
impurities of an analyte, i.e. related substances test, heavy metals, residual solvents content, etc.
Assay (content or potency): to provide an exact result which allows an accurate statement on the content or
potency of the analyte in a sample.
4.4.2. Accuracy:
Accuracy is sometimes termed as trueness. Percentage accuracy can be defined in terms of the
percentage difference between the expected and the observed concentrations. Accuracy is generally determined
by measuring a known amount of standard material under a variety of conditions but preferably in the
formulation, bulk material or intermediate product to ensure that other components do not interfere with the
analytical method. For assay (dissolution samples) methods, spiked samples are prepared in triplicate at three
levels across a range of 50-150 % of the target concentration. The percent recovery should then be calculated.
The accuracy criterion for an assay method is that the mean recovery will be 100 ± 5 % at each concentration
across the range of 50-150 % of the target concentration. To document accuracy, ICH guidelines regarding
methodology recommend collecting data from a minimum of nine determinations across a minimum of three
concentration levels covering the specified range (for example, three concentrations, three replicates each).
4.4.3. Precision
Precision means that all measurements of an analyte should be very close together. All quantitative
results should be of high precision - there should be not more than a ± 2 % variation in the assay system. A
useful criterion is the relative standard deviation, coefficient of variation (CV), which is an sign of the
imprecision of the system. As stated by the ICH, precision should be performed at two different levels -
repeatability and intermediate precision. Repeatability is an indication of how easy it is for an operator in a
Current Trends in Performance of Forced Degradation Studies and Stability Indicating Studies of
DOI: 10.9790/3008-1206021736 www.iosrjournals.org 27 | Page
laboratory to obtain the same result for the same batch of material utilizing the same method at different times
using the same equipment and reagents. It should be determined from a minimum of 9 determinations covering
the specified range of the procedure (for example, 3 levels, 3 repetitions each) or from a minimum of six
determinations at 100 % of the test or target concentration. Intermediate precision (ruggedness) results from
variations such as different days, analysts and equipment. In determining intermediate precision, experimental
design should be employed so that the effects of the individual variables can be monitored. Reproducibility
express the within-laboratories variations: different days, different analysts, different equipments. Precision
criteria for an assay method are that the instrument precision and the intra-assay precision relative standard
deviation would be ≤ 2 %.
4.4.4. Detection limit (LOD): The detection limit of an individual analytical procedure is the lowest amount of
analyte in a sample which can be detected but not necessarily quantitated as an exact value.
Based on Signal-to-Noise
This approach can only be applied to analytical procedures which exhibit baseline noise. Determination
of the signal-to-noise ratio is performed by comparing measured signals from samples with known low
concentrations of analyte with those of blank samples and establishing the minimum concentration at which the
analyte can be reliably detected. A signal-to-noise ratio between 3 or 2:1 is generally considered acceptable for
estimating the detection limit.
Based on the Standard Deviation of the Response and the Slope
The detection limit (DL) may be expressed as:
(2)
where σ = the standard deviation of the response
S = the slope of the calibration curve
4.4.5. Quantification limit (LOQ):
The quantitation limit of an individual analytical procedure is the lowest amount of analyte in a sample
which can be quantitatively determined with suitable precision and accuracy.
Based on Signal-to-Noise Approach
This approach can only be applied to analytical procedures that exhibit baseline noise. Determination
of the signal-to-noise ratio is performed by comparing measured signals from samples with known low
concentrations of analyte with those of blank samples and by establishing the minimum concentration at which
the analyte can be reliably quantified. A typical signal-to-noise ratio is 10:1.
Based on the Standard Deviation of the Response and the Slope
The quantitation limit (QL) may be expressed as:
(3)
where σ = the standard deviation of the response
S = the slope of the calibration curve
4.4.6. Linearity and range:
The linearity of a test procedure is its ability (within a given range) to produce results that are directly
proportional to the concentration of analyte in the sample. The range is the interval between the upper and lower
levels of the analyte that have been determined with precision, accuracy and linearity using the method as
written. ICH guidelines specify a minimum of five concentration levels, along with certain minimum specified
ranges .Acceptability of linearity data is often judged by examining the correlation coefficient and y-intercept of
the linear regression line for the response versus concentration plot. The regression coefficient (r2) is 0.999 and
is generally considered as evidence of acceptable fit of the data to the regression line. The percent relative
standard deviation (RSD), intercept and slope should be calculated.
4.4.7. Robustness
Robustness measures the capacity of an analytical method to remain unaffected by small but deliberate
variations in method parameters such as mobile phase composition, pH of the mobile phase, temperature, buffer
concentration and injection volume. It also gives some indication of the reliability of an analytical method
during normal usage. The chromatography obtained for a sample containing representative impurities when
utilizing modified parameter(s) should be compared with the chromatography obtained using the target
parameter.
DL = 3.3 σ
S
QL = 10 σ
S

Current Trends in Performance of Forced Degradation Studies and Stability Indicating Studies of
DOI: 10.9790/3008-1206021736 www.iosrjournals.org 28 | Page
4.4.8. Bench top stability
Reference substances should be prepared so that they do not lose any of their potency. Thus it is
necessary to validate that the method will give reliable reference solutions that have not been deactivated by
weighing so little that an error is produced; adsorption onto containers; decomposition by light; and
decomposition by the solvent. If the reference is to be made up from a stock solution then it must be validated
that the stock solution does not degrade during storage. Samples and standards should be tested during a period
of at least twenty four hours (depending on intended use), and component quantitation should be determined by
comparison with freshly prepared standards. For the assay method, the sample solutions, standard solutions and
high performance liquid chromatography mobile phase should be stable for twenty four hour under defined
storage conditions. Acceptable stability is ≤ 2 % change in standard or sample response, relative to freshly
prepared standards. The mobile phase is considered to have acceptable stability if aged mobile phase produces
equivalent chromatography (capacity factors, resolution or tailing factor) and the assay results are within 2 % of
the value obtained with fresh mobile phase.
4.4.9. System suitability testing
It is advisable to run system suitability tests in these robustness experiments. During the robustness
testing of the method validation, critical method parameters such as mobile phase composition and column
temperature are varied to mimic the day-to-day variability. So the system suitability results from these
robustness experiments should reflect the expected range. Thus, the limits for system suitability tests can be
estimated from these experiments.
The chromatographic parameters used in system suitability test report are as follows:
Number of theoretical plates or Efficiency (N)
Capacity factor (K)
Separation or Relative retention (α)
Resolution (Rs)
Tailing factor (T)
Relative Standard Deviation (RSD)
These are measured on a peak or peaks of known retention time and peak width.
4.4.9.1. Efficiency or Plate number (or) number of theoretical plates (N):
Efficiency is a measure of the dispersion of the analyte band as it travels through the HPLC column.
sharpness of the peaks (Gaussian shape) and therefore the efficiency of the column. Efficiency N is often
referred to as the plate number. Higher values of N are seen for subsequent peaks within the chromatogram.
This can be calculated in various ways, for example the USP uses the peak width at the base and the BP uses the
peak width at half the height. Plate number is represented in following equation and shown in "Fig 2".
Figure 2: Plate number (or) number of theoretical plates (N)
N = 5.545 [tR /w1/2]2 (B.P)
or
N = 16 [ tR/wb]2 (USP) (4)
Where
w1/2 = Peak width at 1/2 peak height.
Wb = Peak width at base.
tR = retention time of peak or elution volume.
Therefore plates number is high the column is more efficient. The plate number usually depends on column
length - i.e. the longer the column the larger the plate number. Therefore the column's efficiency can also be quoted as the plate height (h) or the height
equivalent to one theoretical plate (HETP).
HETP = L/N (5)

Current Trends in Performance of Forced Degradation Studies and Stability Indicating Studies of
DOI: 10.9790/3008-1206021736 www.iosrjournals.org 29 | Page
Where, L = length of column N or plates/meter
N = plate number.
There are several factors negatively impact peak efficicncy
1. Column 2. particle size of the column packing 3. injection volume 4. column dimensions 5. flow rate 6. Dead
volume.
Typically plate number for a 4.6 X 100mn, 5µm column is 5000 - 8000 theoretical plates. More plates means
less dispersion of chromatographic bands.
Effect of column efficiency on resolution: By changing the mobile phase flow rate efficiency can be altered
"Fig 3". It can be seen that the increase in resolution follows an approximately straight line with shallow slope.
Figure 3: Effect of column efficiency (theoretical plate number) Vs resolution
4.4.9.1. Capacity factor or Capacity ratio or Retention factor (K):
Capacity factor means of measuring the retention of an analyte on the chromatographic column.
Capacity factor or retention factor is equal to the ratio of retention time of the analyte on the column to the
retention time of
an unretained compound. The non-retained or unretained compounded has no affinity for the stationary phase
and elutes with the solvent front at a time to, which is also known as the hold-up time or dead time.
This value gives an indication of how long each component is retained on the column (i.e. how many times
longer the component is retarded by the stationary phase than it spends in the mobile phase). K is independent of
flow rate and column dimensions. High K values for strongly retained compounds.
Capacity factor
K = tR – t0/ t0 (6)
Where, tR = Unretained peaks retention time,
t0 = Retention time of the peak of interest.
K is used in preference to retention time because it is less sensitive to fluctuations in chromatographic
conditions (i.e. flow rate) and therefore ensures greater reproducibility from run to run. In practice the k value
for the first peak of interest should be > l to assure that it is separated from the solvent.
A high K value indicates that the sample is highly retained and has spend a significant amount of the interacting
with the stationary phase.
Chromatographers like to keep K values between 1 and 10 for good separations. If the t0 time of the system was
1.0 minute, this would equation to a retention time range of :
tR = (K x to ) + to = 2 minutes to 11.0 minutes (7)
(K=1) (K=10)
There are several ways to determine to including The time at the baseline disturbance seen due to differences in absorbance or refractive index as the injection
solvent passes through the detector. 1. Retention time of uracil (RP-HPLC) 2. Retention time of hexane (NP-
HPLC). "Fig. 4" shows the capacity factor or capacity ratio.

Current Trends in Performance of Forced Degradation Studies and Stability Indicating Studies of
DOI: 10.9790/3008-1206021736 www.iosrjournals.org 30 | Page
Figure 4: Capacity factor or Capacity ratio (K)
4.4.9.2. Selectivity (Separation Factor) or Relative retention (α):
One of the best way to change resolution is selectivity. Selectivity is denoted by (α) gives a measure of the
ability of the chromatographic system to chemically distinguish between sample components. It is measured as a
ratio of the retention factors, K.
α is always greater than 1 as when it equals one the peaks are co-eluting that is to say there is no space
between the apices of the two peaks. High α values indicate good separating power and a good separation between
the peak apices.
Effect of α on resolution: Changing the α largest impact on resolution . α can be altered by using the following
parameters.
1. pH
2. Type of organic solvent
3. Solvent strength
4. Stationary phase chemistry
5. Temperature
Selectivity can be altered by changing the solvent strength of the mobile phase. Altering the system
selectivity gives an excellent means of optimizing the chromatographic resolution because small change in
selectivity can lead to large change in resolution. Selectivity is shown in the following equation.
(8)
4.4.9.3. Resolution (Rs):
The resolution of two neighbouring peaks is defined by the ratio of the distance between the two peak
maxima. It is the difference between the retention times of two solutes divided by their average peak width. For
baseline separation, the ideal value of resolution is 1.5. By increasing the Rs resolution is also increased. It is
calculated by using the formula which is shown in "Fig. 5."

Current Trends in Performance of Forced Degradation Studies and Stability Indicating Studies of
DOI: 10.9790/3008-1206021736 www.iosrjournals.org 31 | Page
Figure 5: Resolution
Where, tR1 and tR2 are the retention times of components 1 and 2
Wb1 and Wb2 are peak widths of components 1 and 2 at the base.
The most important thing in HPLC is to obtained the optimum resolution in the minimum time. Resolution
value of 1.5 or greater between 2 peaks will ensure that the sample components are well separated., to a degree
at which the area or height of each peak may be accurately measured.
Sometimes it is often more convenient to measure the peak width at the half height of each peak because this
overcomes problems associated with peak tailing, non-baseline resolved peaks etc. is shown in " Fig. 6".
Figure 6: Measuring the resolution with peak width at the half height of each peak
In order to gain resolution three fundamental parameters are very important
The retention factor denoted by (K)
The selectivity denoted by (α) (separation of the peak apexes)
The efficiency which is denoted by (N) (width of the peaks).
If we change any of these 3 parameters we get better resolution and better chromatography. Selectivity and
efficiency has come in. Selectivity has greatest impact on improving resolution.
The width at the base of each peak is the segment of the peak base intercepted by the tangents drawn to the
inflection points on either side of the peak. The peak width as well as the retention time is measured in the units,
because of that resolution is a dimensionless parameter.
Finally we want to achieve resolution (separation) of all components in the minimum amount of time and
reproducibly. Normally resolution in chromatography is governed by three parameters. 1. Retention 2.
selectivity 3. efficiency. Infact selectivity (α) has the greatest impact on improving resolution. The fundamental
resolution equation is shown in " Fig. 7".
Current Trends in Performance of Forced Degradation Studies and Stability Indicating Studies of
DOI: 10.9790/3008-1206021736 www.iosrjournals.org 32 | Page
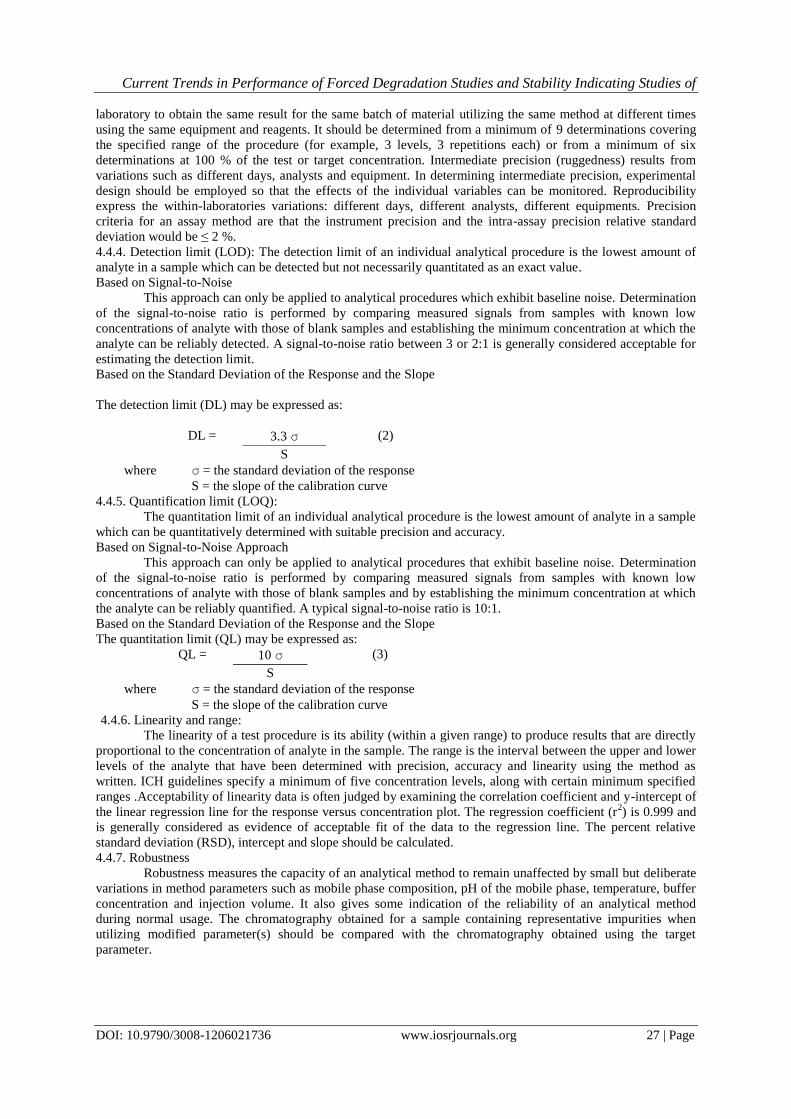
Figure 7: Important three chromatographic parameters
Effect of K (retention factor) on resolution:
The most effective and convenient way to alter K is to change the solvent strength of the mobile phase.
By increasing the % of organic solvent in mobile phase (by changing the organic modifier) the larger gain in the
resolution is obtained. Generally larger gain in resolution is achieved with K values between 1 and 5.
The largest gain in resolution is achieved when the K values is between 1 and 5. K value is less than 1
are unreliable because analytes may be eluting with other solvents or other sample components.
Above a K value of 5, increasing retention only provides minimal increasing in resolution. Too much retention
wastes valuable analysis time and the chromatographic peak height will decrease as the band width of the peak
increases. For more complex sample mixtures the useful K range may be extended to 2< K < 10. If the desired
resolution is not achieved for the K values of your sample components are above 10, then selectivity or
efficiency should be increased which is shown in "Fig. 8".
Figure 8: Effect of K on resolution and increasing the organic solvent strength
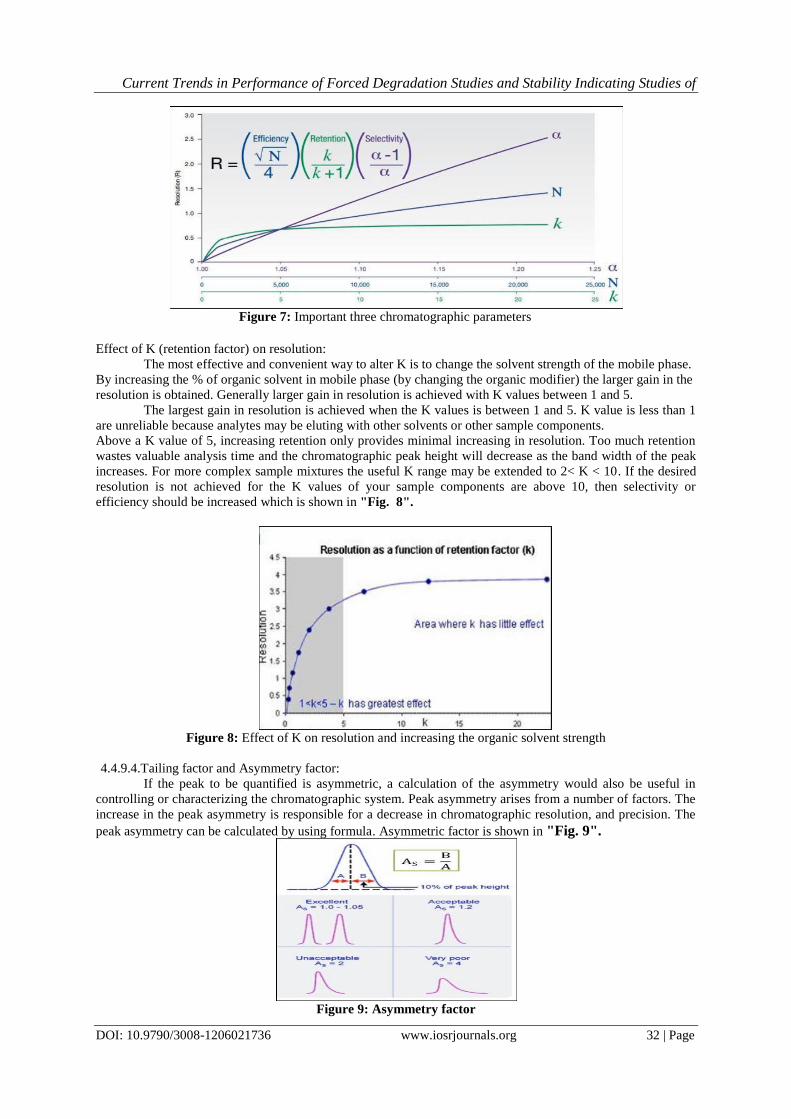
4.4.9.4.Tailing factor and Asymmetry factor:
If the peak to be quantified is asymmetric, a calculation of the asymmetry would also be useful in
controlling or characterizing the chromatographic system. Peak asymmetry arises from a number of factors. The
increase in the peak asymmetry is responsible for a decrease in chromatographic resolution, and precision. The
peak asymmetry can be calculated by using formula. Asymmetric factor is shown in "Fig. 9".
Figure 9: Asymmetry factor
Current Trends in Performance of Forced Degradation Studies and Stability Indicating Studies of
DOI: 10.9790/3008-1206021736 www.iosrjournals.org 33 | Page
Asymmetry factor:
Where, As is peak asymmetry factor
B is distance from the point at the peak midpoint to the trailing edge.
A is distance from the leading edge of peak midpoint to the midpoint.
The ideal peaks would be symmetrical. Generally some peaks exhibit tailing which is caused by following
reasons
a. Column packing
b. Dead volume
c. Adsorptive effects
d. Injection solvent effects.
Normally values should be less than 2. Fronting peaks can be caused by sample concentration being too high or
if a column has been damaged and contains channels.
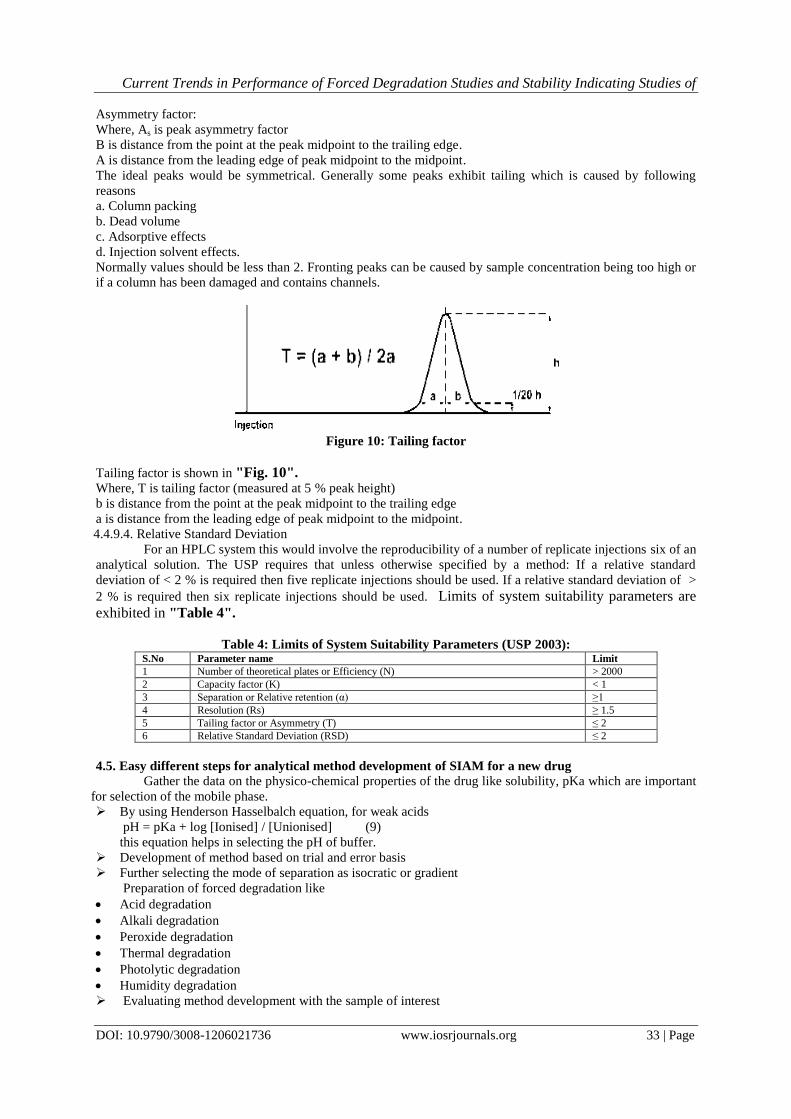
Figure 10: Tailing factor
Tailing factor is shown in "Fig. 10". Where, T is tailing factor (measured at 5 % peak height)
b is distance from the point at the peak midpoint to the trailing edge
a is distance from the leading edge of peak midpoint to the midpoint.
4.4.9.4. Relative Standard Deviation
For an HPLC system this would involve the reproducibility of a number of replicate injections six of an
analytical solution. The USP requires that unless otherwise specified by a method: If a relative standard
deviation of < 2 % is required then five replicate injections should be used. If a relative standard deviation of >
2 % is required then six replicate injections should be used. Limits of system suitability parameters are
exhibited in "Table 4".
Table 4: Limits of System Suitability Parameters (USP 2003): S.No Parameter name Limit
1 Number of theoretical plates or Efficiency (N) > 2000
2 Capacity factor (K) < 1
3 Separation or Relative retention (α) ≥1
4 Resolution (Rs) ≥ 1.5
5 Tailing factor or Asymmetry (T) ≤ 2
6 Relative Standard Deviation (RSD) ≤ 2
4.5. Easy different steps for analytical method development of SIAM for a new drug
Gather the data on the physico-chemical properties of the drug like solubility, pKa which are important
for selection of the mobile phase.
By using Henderson Hasselbalch equation, for weak acids
pH = pKa + log [Ionised] / [Unionised] (9)
this equation helps in selecting the pH of buffer.
Development of method based on trial and error basis
Further selecting the mode of separation as isocratic or gradient
Preparation of forced degradation like
Acid degradation
Alkali degradation
Peroxide degradation
Thermal degradation
Photolytic degradation
Humidity degradation
Evaluating method development with the sample of interest

Current Trends in Performance of Forced Degradation Studies and Stability Indicating Studies of
DOI: 10.9790/3008-1206021736 www.iosrjournals.org 34 | Page
To separate the impurities formed during the degradation process
Finally optimizing HPLC method with information obtained
To carry out Validation parameters like
a) System suitability
b) Specificity
- Placebo Interference
- Impurity Interference
- Force degradation
c) Precision
d) Linearity
e) Accuracy
f) Filter Validation
g) Stability of Standard and test solutions
h) Ruggedness
i) Robustness
4.6. Method development
4.6.1. Selection of the analytical technique
Stability Indicating Assay methods require separation of multiple components (impurities and
degradants) during analysis of stability samples. Impurities developed during degradation or as a part of process
which are interfering with drugs peak need to be separated for getting accurate and precise assay values. Due to
this reason, Chromatography is considered best suitable for development of SIAM.
4. 6.2. Selection of Chromatographic technique
Greater accuracy and sensitivity for even small quantities of degradation products produced can be
obtained by HPLC when compared to other methods that have been used in SIAM development.
If the drug is a quite non polar molecules which shows high solubility in Methanol. So, Reverse phase
chromatography was tried first for the analysis of such drugs and it showed good elution during the preliminary
trials.
4. 6.3. Selection of Detection Method
HPLC gives the analyst freedom to choose from a variety of detectors based on drug characters, such a
UV, Refractive Index, ELSD, Fluorimetry etc. Mostly HPLC method development is carried out with UV
detection using either a variable-wavelength (Spectrophotometric) or a diode-array detector. Preferred detector
for SIAM is PDA detector which help in identifying closely related impurities by seeing purity plots.
4.6.4. Selection of Detection Wavelength
The sensitivity of method that uses UV detector depends upon the proper selection of wavelength that
gives maximum absorbance and good response for the given candidate drug. A UV spectrum of methanol was
recorded by scanning from 200 to 400 nm.
4.6.5. Selection of Diluent
In assay method development diluent plays an important role. Drug and drug product solubility affect
the diluent selection. Sample diluent is defined as the vehicle that dissolves test material that will be assayed.
The ideal sample diluent should have the following attributes:
Dissolves the major analyte
Dissolves impurities and degradation products
It is conducive to acceptable peak shape
Does not interfere with analyte response
Prevents analyte interaction with container surfaces, and
Does not promote analyte degradation.
4.6.6. Selection of Column
Column selection is depends on drug structure. It is also depends on the functional groups present in
drug molecule and their hydrophilicity and lipophilicity. So the initial trial was done with various pH ranges
with various columns such as
Thermo Hypersil BDS C18, 250 X 4.6 mm, 5 µm Column. Make : THERMO FISHER- USA.
Welchrom C18, 250 X 4.6 mm, 5µm HPLC Column. Make : WELCHROME.
C18 250 X 4.6 , 5 µm HPLC Column. Make : IMSIL, JAPAN.
Thermo scientific, Agilent, Kromasil, Hamilton PRP- C18, Intertsil ODS 3V, Hypersil BDS, Hypersil gold,
XTerra RP-18 and X Bridge column, zorbax. Phenomenex.
4.6.7. Selection of mobile phase
Drug solubility, dissociation constant (Pka) etc. mainly affect mobile phase selection. Solvent mixtures
are used some times for better resolution of the components.

Current Trends in Performance of Forced Degradation Studies and Stability Indicating Studies of
DOI: 10.9790/3008-1206021736 www.iosrjournals.org 35 | Page
4.6.8. Selection of injection volume
Injection volume selection depends on peak area, peak height and peak shape. The trials were done
with different injection volume. Injection volume 20 μl is used.
4.6.9. Selection of column oven temperature
Column oven temperature affect the retention time of drug and degradation of drug. Increase in column
temperature within certain limits may decrease the retention time of the analyte, by decreasing the viscosity of
the mobile phase.
4.6.10. Bench top stability of Standard and test preparation
A study to establish the stability of standard and test preparations at Bench top was conducted for 24
hours. Similarity factor is calculated for bench top stability study of the standard solution. The difference in
% assay of test preparations between initial and after 24 hours is found to be within the limit. Acceptance
criteria: The % assay results of test solutions should not deviate by ± 2.0 from that of initial.
4.6.11. Bench top stability of mobile phase
A study to establish stability of mobile phase on bench top was conducted for 3 days. The system
suitability parameters were evaluated as per the test method by using the same mobile phase on different days.
4.6.12. Filter validation
A study to establish the suitability of filters was conducted by using different filters namely, 0.45 μm
Polyvinylidene difluoride (PVDF) membrane filters, 0.45 μm and 0.45 μm Polyethersulfone (PES)
Membrane filters. Test solutions prepared in duplicate were centrifuged and filtered through the above
different filters and were analyzed as per test method. The difference in % Assay between centrifuged and
filtered test solutions is found to be within the limit. The standard solution prepared as per test method was
filtered through the above different filters and analyzed along with unfiltered standard solution.
4.6.13. Robustness
Effect of variation in Flow rate:
A study was conducted to determine the effect of variation in flow rate. The system suitability
parameters were tested whether it is found to be within the limits or not.
Effect of variation in column oven temperature:
A study was conducted to determine the effect of variation in column oven temperature. The system
suitability parameters were evaluated at 28 °C and 32 °C column oven temperatures. The system suitability
results were tested whether it is found to be within the limits at both column oven temperatures or not.
Effect of variation in pH of the mobile phase:
A study was conducted to determine the effect of variation in pH of the mobile phase. Effect of
variation in mobile phase composition (Organic variation): A study to establish the effect of variation in
mobile phase composition was conducted. Mobile phases were prepared by changing the volume of each
organic component in mobile phase by absolute ± 10%. The System suitability parameters were evaluated
with the different mobile phases.
4.6.14. Calculation
% Assay = [(AT/AS)* (WS/DS)* (DT/WT)* (P/100)* (Average Weight/Label claim)]*100 (10)
AT = Peak area of drug obtained with test preparation.
AS = Peak area of drug obtained with standard preparation.
WS = Weight of working standard taken in mg.
WT = Weight of the sample taken in mg.
DS = Dilution of standard solution.
DT = Dilution of sample solution.
P = Percentage purity of working standard.
V. Conclusion Forced degradation is an essential step in the drug development process. Forced degradation studies
are required to develop stability indicating methods (to determine the intrinsic stability of drug product in
formulation to solve stability related problems), to generate more stable formulations, to establish degradation
pathways of drug products, to elucidate the structure of degradation products, to reveal the degradation
mechanisms such as hydrolysis, thermolysis, photolysis and oxidation of drug product, to understand the
chemical properties of drug molecules, The ICH guideline Q1A on Stability Testing of New Drug Substances
and Products emphasizes that the testing of those features which are susceptible to change during storage and
are likely to influence quality, safety and/or efficacy must be done by validated stability-indicating testing
methods. It is also mentioned that forced decomposition studies (stress testing) at temperatures in 10°C
increments above the accelerated temperatures, extremes of pH and under oxidative and photolytic conditions
should be carried out on the drug substance so as to establish the inherent stability characteristics and
degradation pathways to support the suitability of the proposed analytical procedures.

Current Trends in Performance of Forced Degradation Studies and Stability Indicating Studies of
DOI: 10.9790/3008-1206021736 www.iosrjournals.org 36 | Page
References [1] ICH guidelines, Q1A (R2): Stability Testing of New Drug Substances and Products (revision 2), November 2003. [2] G. Ngwa, Forced degradation studies as an integral part of HPLC stability indicating method development, Drug Deliv.
Technol., 10(5), 2010, 56-59.
[3] H. Brummer, How to approach a forced degradation study, Life Sci. Technol. Bull., 31, 2011, 1-4. [4] S. Singh, M. Bakshi, Guidance on conduct of stress tests to determine inherent stability of drugs Pharm. Technol., 24,2000, 1-14.
[5] K.M. Alsante, A. Ando, R. Brown, et al. The role of degradant profiling in active pharmaceutical ingredients and drug products
Adv. Drug Deliv. Rev., 59(1), 2007, 29-37. [6] S. Klick, G.M. Pim, J. Waterval, et al. Toward a generic approach for stress testing of drug substances and drug products Pharm.
Technol., 29(2),2005, 48-66.
[7] R. Singh, Z. Rehman, Current trends in forced degradation study for pharmaceutical product development J. Pharm. Educ. Res., 3(1), 2012, 54-63.
[8] D.W. Reynolds, K.L. Facchine, J.F. Mullaney, et al. Available guidance and best practices for conducting forced degradation
studies, Pharm. Technol., 26(2), 2002, 48-56. [9] M. Blessy, Y.K. Agrawal, Development of forced degradation and stability indicating studies of drugs- A review, 4(3), 2014, 159-
165.
[10] Reynolds DW, Facchine KL, Mullaney JF, Alsante KM, Hatajik TD, Motto MG. Available guidance and best practices for conducting forced degradation studies, Pharm Tech. 2002, 48-56.
[11] M. Bakshi, S. Singh, Development of validated stability-indicating assay methods- critical review J. Pharm. Biomed. Anal., 28(6),
2002,1011-1040. [12] J.W. Dolan Stability-indicating assays: LC troubleshooting LC-GC N. Am., 20(4), 2002, 346-349.
[13] J.W. Smela, Regulatory considerations for stability indicating analytical methods in drug substance and drug product testing Am.
Pharm. Rev., 8(3), 2005, 51-54. [14] M.P. Riddhiben, M.P. Piyushbhai, M.P. Natubhai, Stability indicating HPLC method development—a review Int. Res. J.
Pharm., 2(5), 2011,79-87.
[15] Panchumarthy Ravisankar, Shaheem Sultana, Kamma Harsha Sri, Development and validation of stability-indicating reversed phase HPLC method for determination of Apremilast in bulk and pharmaceutical dosage form, Der Pharma Lettre, 9(6), 2017, 75-85.
[16] ICH, Q3A (R2): Impurities in New Drug Substances, International Conference on Harmonization, Geneva.
[17] L.R. Synder, J.J. Kirkland, J.L. Glajch, Practical HPLC Method Development (second ed.), Wiley, New York, 2012). [18] G. Szepesi, Selection of high-performance liquid chromatographic methods in pharmaceutical analysis. III. Method validation, J.
Chromatogr., 464, 1989, 265-278.
[19] G.P. Carr, J.C. Wahlich, A practical approach to method validation in pharmaceutical analysis, J. Pharm. Biomed. Anal., 86, 1990, 613-618.
[20] Panchumarthy Ravisankar, Ch. Naga Navya, D. Pravallika, D. Navya Sri, A review on step-by-step analytical method validation,
IOSR Journal of Pharmacy, 5(10), 2015, 07-19.
[21] D.R. Jenke, Chromatographic method validation: A review of common practices and procedures II J. Liq. Chromatogr., 19,
1996, 737-757. [22] P. Ravisankar, G. Rajyalakshmi, Ch. Devadasu and G. Devala Rao, Instant tips for right and effective approach to solve HPLC
trouble shooting, Journal of chemical and pharmaceutical sciences, 7(3), 2014, 259-274.
[23] P. Ravisankar, S. Gowthami, and G. Devala Rao, A review on analytical method development, Indian journal of research in
pharmacy and biotechnology, 2(3), 2014, 1183-1195. [24] G. Szepesi, Selection of high-performance liquid chromatographic methods in pharmaceutical analysis. J Chromatogr, 464, 1989,
265-278.
[25] GP Carr, JC, Wahlich, A practical approach to method validation in pharmaceutical analysis. J Pharm Biomed Anal, 86, 1990,613-618.
IOSR Journal of Pharmacy and Biological Sciences (IOSR-JPBS) is UGC approved Journal
with Sl. No. 5012, Journal no. 49063.
Panchumarthy Ravisankar Current Trends in Performance of Forced Degradation Studies and
Stability Indicating Studies of Drugs.‖ IOSR Journal of Pharmacy and Biological Sciences
(IOSR-JPBS) , vol. 12, no. 6, 2017, pp. 17-36.


![Stability diagram for the forced Kuramoto model - arxiv.org · PDF filearXiv:0807.4717v2 [nlin.PS] 31 Oct 2008 Stability diagram for the forced Kuramoto model Lauren M. Childs and](https://img.pdfslide.us/doc/110x75/5a7314237f8b9a98538e3afb/stability-diagram-for-the-forced-kuramoto-model-arxivorg-a-arxiv08074717v2.jpg)


![STABILITY OF FORCED OSCILLATIONS OF A SPHERICAL PENDULUM* · 1962] STABILITY OF FORCED OSCILLATIONS OF A SPHERICAL PENDULUM 23 Forming the Lagrangian T — V from (2.4b) and (2.5b),](https://img.pdfslide.us/doc/110x75/5e89537783f57d385c620850/stability-of-forced-oscillations-of-a-spherical-pendulum-1962-stability-of-forced.jpg)