Embed Size (px)
Citation preview
Current trends among startups and how they keep momentum in Japan
Yusuke AsakuraVisiting Scholar at Stanford UniversityFormer-CEO of mixi, Inc.
2015/4/7
Entrepreneurship in Asian High-Tech Industries
1
Self introduction
How startups keep momentum
Startup trends in Japan

2
Self introduction
How startups keep momentum
Startup trends in Japan

3
How startups keep momentum after IPO in Japan

Overview of mixi Inc.
4
• Founded in1999 originally as online recruitment information media provider for Web engineers.
• Social networking service “mixi” launched in 2004.
• Main features were such as diary, community and photo sharing.
• Listed on the Tokyo Stock Exchange in 2006
• Became dominant social media platform in Japan

Market cap of mixi in the first 5 years after IPO
0
1,000
2,000
3,000
Q2Q1Q2 Q3 Q4Q1 Q4 Q2Q1Q3Q2Q4 Q1Q3Q4Q3Q2Q1Q4Q3
Market cap(USD million; USD 1 = JPY 100)
FY2006 FY2007
IPO4
FY2008 FY2009 FY2010 FY2011
NT acquiredby mixi

Sales of mixi from FY 2011 to the time I became the CEO
Became CEO
Sales(USD million; USD 1 = JPY 100)
2418
2127
313335
3834
3130
58
0
10
20
30
40
50
60
Q3 Q4Q4Q3Q2 Q2Q1Q4Q1 Q3Q2Q1FY2011 FY2012 FY2013
Acquired bymixi 3

Problems mixi faced with
•Competitor
•Customer
•Company
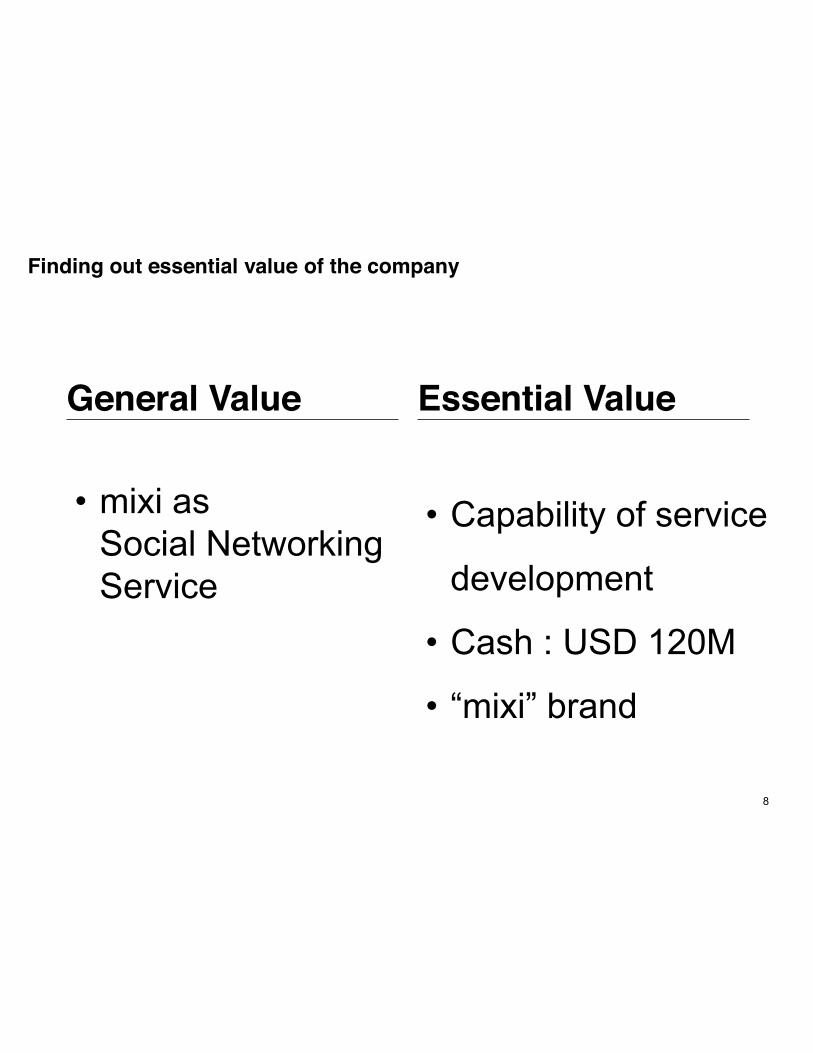
Finding out essential value of the company
8
General Value
• mixi as Social Networking Service
Essential Value
• Capability of service
development
• Cash : USD 120M
• “mixi” brand

Basic strategy
9
• Improving the bottom line of existing
business
• Diversification through
• New business development
• External business acquisition
• Recreation of corporate culture
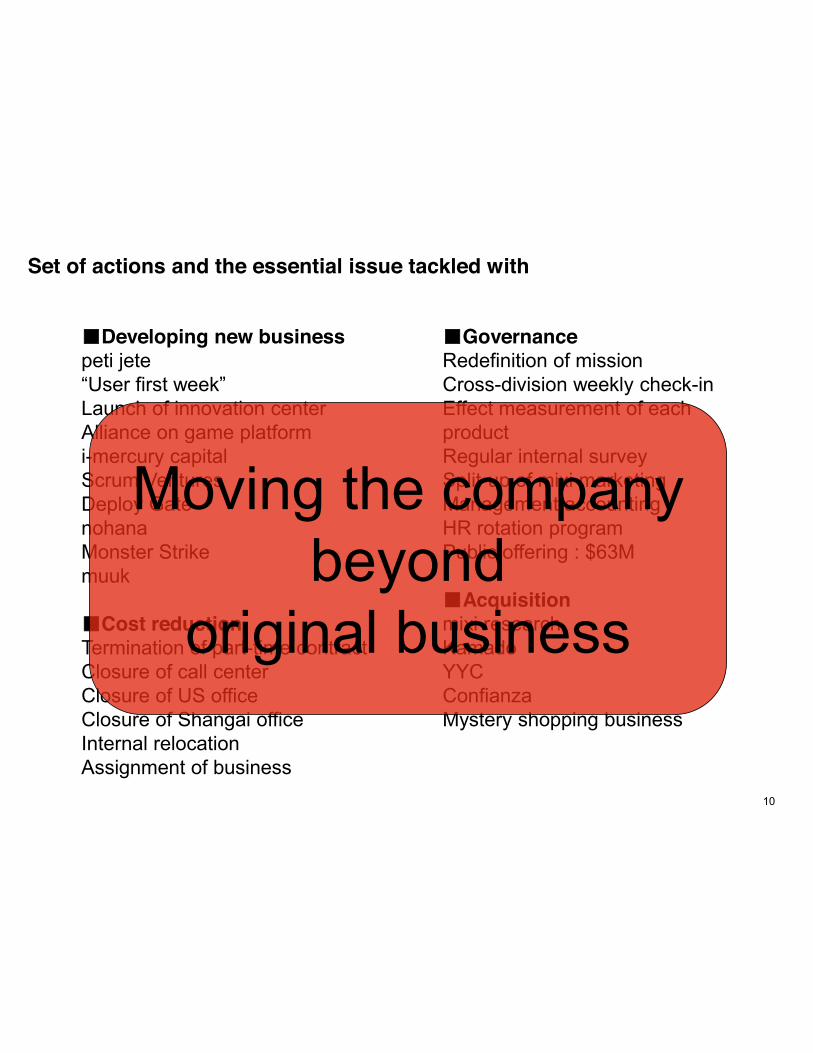
Set of actions and the essential issue tackled with
10
■Developing new businesspeti jete“User first week”Launch of innovation centerAlliance on game platformi-mercury capitalScrum VenturesDeploy GatenohanaMonster Strikemuuk
■Cost reductionTermination of part-time contractClosure of call centerClosure of US officeClosure of Shangai officeInternal relocationAssignment of business
■GovernanceRedefinition of missionCross-division weekly check-inEffect measurement of each productRegular internal surveySplit-up of mixi marketingManagement accountingHR rotation programPublic offering : $63M
■Acquisitionmixi researchKamadoYYCConfianzaMystery shopping business
Moving the company beyond
original business

Triggers to regrowth
11
• Blockbuster app
• Buyout of profitable services
• Assignment of underperforming business

Boosting top-line growth through business diversification
Became CEO
Sales(USD million; USD 1 = JPY 100)
58
2418
2127
313335
3834
3130
0
10
20
30
40
50
60
Q3 Q4Q4Q3Q2 Q2Q1Q4Q1 Q3Q2Q1FY2011 FY2012 FY2013
Acquired bymixi 3
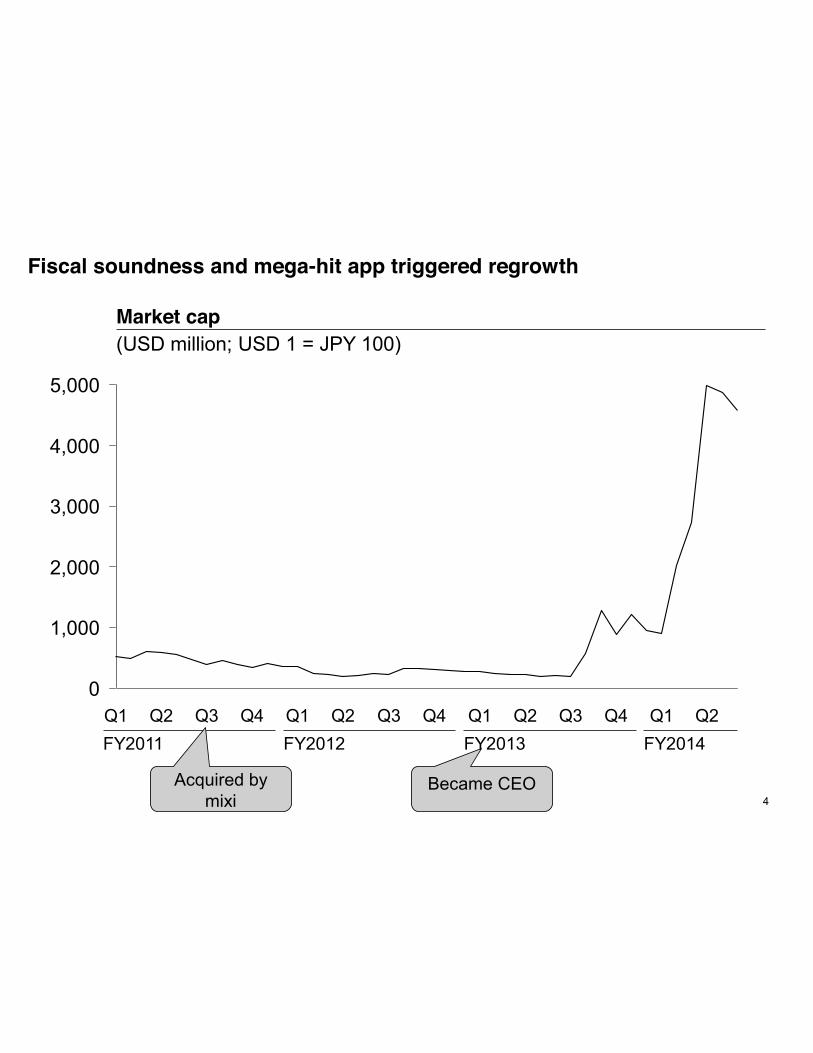
Fiscal soundness and mega-hit app triggered regrowth
0
1,000
2,000
3,000
4,000
5,000
Q4 Q1Q2 Q2Q3Q1 Q4 Q1 Q4 Q2Q3 Q2 Q3 Q1
Market cap(USD million; USD 1 = JPY 100)
FY2011 FY2012 FY2013 FY2014
Became CEOAcquired bymixi 4

14
• Obligation to grow
• Brave new frontier
• Forget about current sales and profit margin
• There is NO synergy
• Accept cannibalism
• ‘Big Company Disease’ is preventable
Some lessons learned from the case
15
Self introduction
How startups keep momentum
Startup trends in Japan

GDP of Japan in the last 20 years
16SOURCE: Cabinet office Government of Japan
Real GDP of Japan(JPY Trillion; 1994-2014)
0
100
200
300
400
500
600
1994 1996 1998 2000 2002 2004 2006 2008 2010 2012 2014
+1%

Japan’s GDP doesn’t show significant growth in the last 20 years
17SOURCE: SPEEDA, International Monetary Fund (IMF)『World Economic Outlook Database』
Real GDP(USD Trillion; 1994-2014)
02468
1012141618
1994 1996 1998 2000 2002 2004 2006 2008 2010 2012 2014
China
United States
Japan
5
16
0
CAGR(%)

Internet and Mobile sectors are key drivers of Japan’s economic growth
18SOURCE: GLOBIS CAPITAL PARTNERS, Ministry of Internal Affairs and Communications
Real GDP Growth(%; Compound Annual Growth Rate; 2005-2011)
-4.4-3.7
-1.6-1.2-0.4
0.40.60.9
7.6
13.5
-5
0
5
10
15
Retail
-1.0
Other IT
Electric machinery
Transport machinery
Mobile communication
SteelInternet services
Average
Transportation
Wholesale
Construction

IPO activity surged in 2014
19
Number of IPOs on TSE Mothers1 Quick Facts
44
32
24
12
64
13
22
4037
2013 201420122008 2009 2010 2011200720062005
1 Market of the high-growth and emerging stocksSOURCE: TSE, Nikkei, GLOBIS CAPITAL PARTNERS, NASDAQ, Bloomberg
• Median Market Cap at IPO on TSE Mothers is US 55 million in 2013
• 70% of newly public companies are internet-related business in 2014
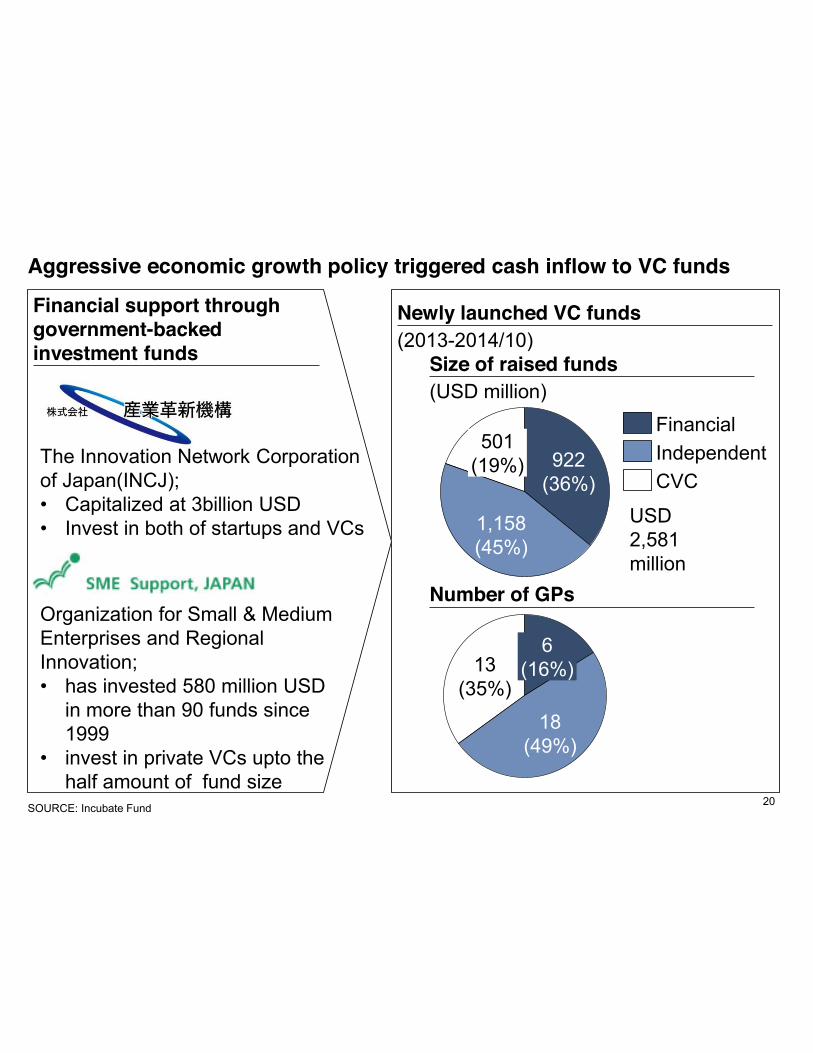
Aggressive economic growth policy triggered cash inflow to VC funds
20SOURCE: Incubate Fund
501(19%)
1,158(45%)
922(36%) CVC
IndependentFinancial
13(35%)
6(16%)
18(49%)
Newly launched VC funds(2013-2014/10)
Size of raised funds(USD million)
Number of GPs
Financial support through government-backed investment funds
Organization for Small & Medium Enterprises and Regional Innovation;• has invested 580 million USD
in more than 90 funds since 1999
• invest in private VCs upto the half amount of fund size
The Innovation Network Corporation of Japan(INCJ);• Capitalized at 3billion USD• Invest in both of startups and VCs USD
2,581 million

Independent VCs are playing active roles in Japan’s startup ecosystem
21SOURCE: Incubate Fund

Venture capital business is becoming more profitable in terms of IPO
22
Average ratio of stock price at IPO to the value of stock at the last round before IPO*(Multiple)
* Please note the data may not be comprehensiveSOURCE: Japan Venture Research
4.584.77
2.30
1.552.04
6.26
0.00
1.00
2.00
3.00
4.00
5.00
6.00
7.00
2005 2006 2007 2008 2009 2010 2011 2012 2013 2014
2.39
1.29
4.14
2.36
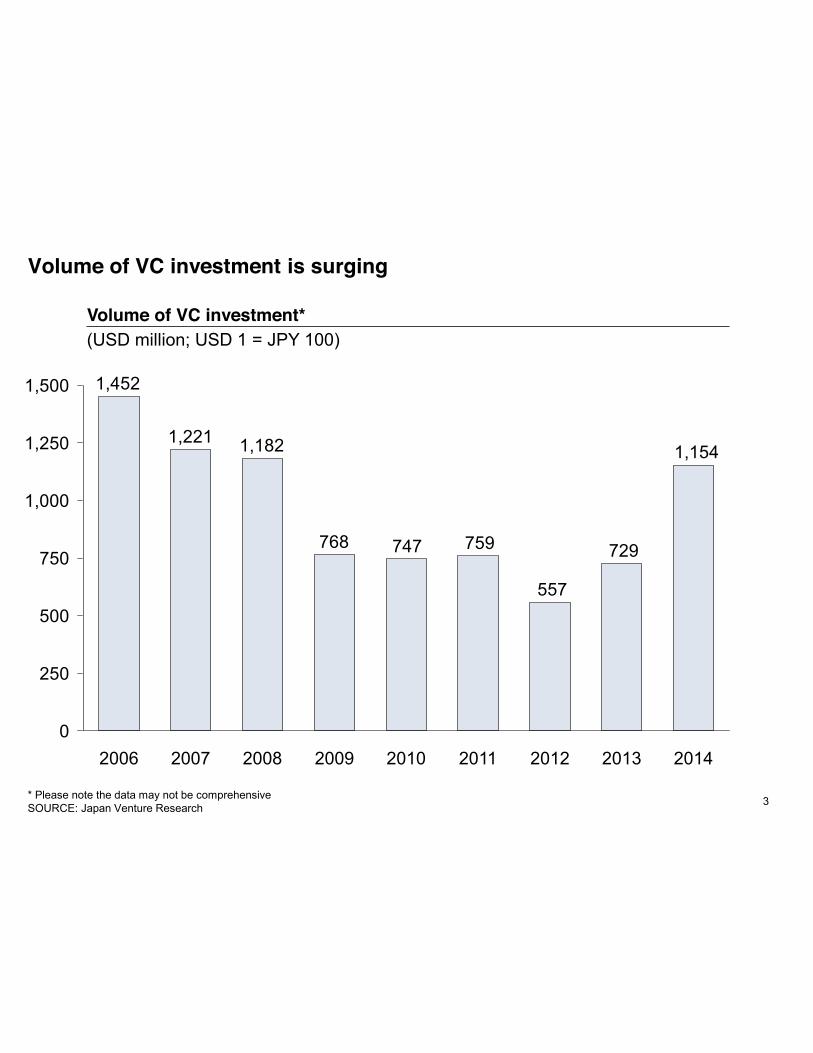
Volume of VC investment is surging
Volume of VC investment*(USD million; USD 1 = JPY 100)
1,154
729
557
759747768
1,1821,221
1,452
0
250
500
750
1,000
1,250
1,500
2011201020092008 20142012 201320072006
3* Please note the data may not be comprehensiveSOURCE: Japan Venture Research
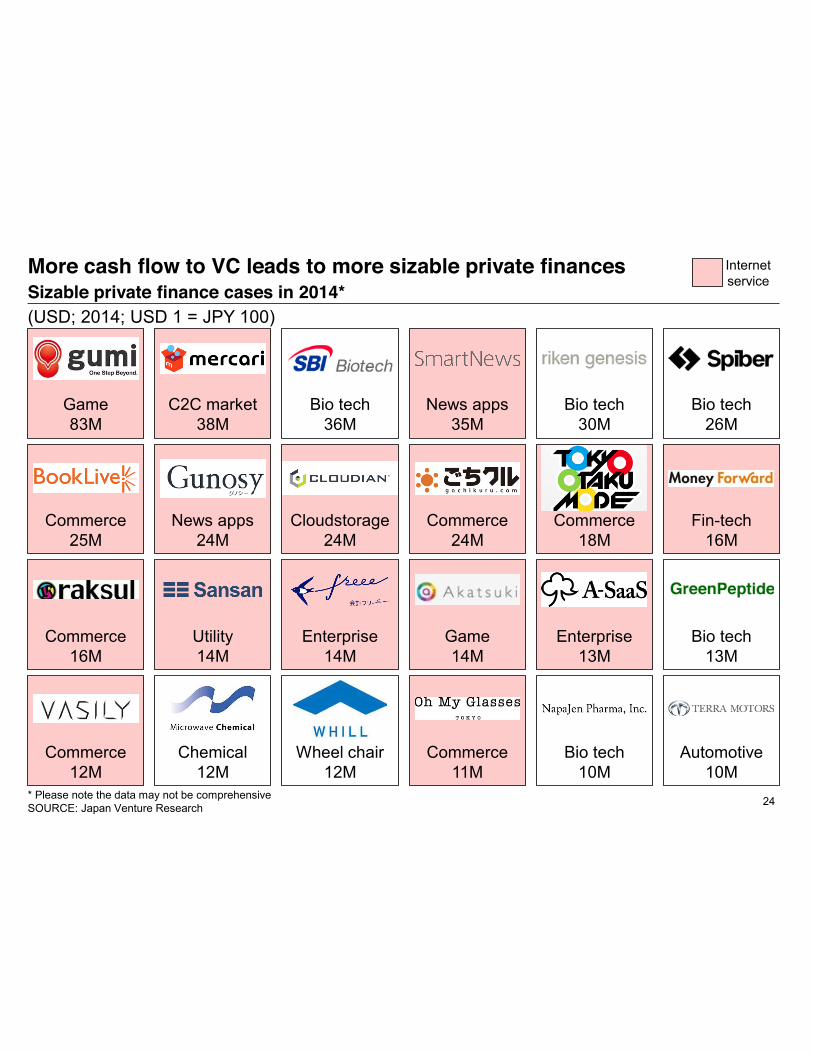
More cash flow to VC leads to more sizable private finances
24* Please note the data may not be comprehensiveSOURCE: Japan Venture Research
Sizable private finance cases in 2014*(USD; 2014; USD 1 = JPY 100)
Game83M
Commerce16M
Commerce12M
Commerce25M
C2C market38M
Utility14M
Chemical12M
News apps24M
Bio tech36M
Enterprise14M
Wheel chair12M
Cloudstorage24M
Commerce24M
News apps35M
Game14M
Commerce11M
Commerce18M
Bio tech30M
Enterprise13M
Bio tech10M
Fin-tech16M
Bio tech13M
Automotive10M
Bio tech26M
Internet service

More Japanese startups are going global
25
Mercari
Smart News
gumi
Metaps
Moi
Mobile C2C shopping app.Opened US office and launched US version in 2014.
Android monetization platform and credit card processing service.Focusing on Asian region.
News curation apps for smartphones and tablets.Opened US office and launched US version in 2014.Ranked #1 on App Store
Providing TwitCasting, realtime video broadcasting platform.Opened US office in 2013.
Social games provider for smartphone and feature phone.Subsidiary companies in 8 countries.Listed on TSE 1st in 2014.
SOURCE: TECH IN ASIA

Given the current GDP, the volume of acquisition deal in Japan is lower than expectation
26
Number of deals in 90sNumber of deals from 2000 to August of 2013 GDP
(USD billion; 2013)
12,411Germany
US
Japan
72,111
2,198
117,666
18,563
19,532 3,730
4,899
16,768
Japan X Japan X Japan X
32.8
5.6
1
6.3
1.1
1
3.4
0.8
1
SOURCE: Industrial Growth Platform, Inc.

Acquisition accelerating1
27
Announced Acquirer Target2 Service of target company
1 Picked up only notable cases. Not meant to be comprehensive2 Target name is based on service name. Not corporate name except Aratana.
Aggregate Value(USD million)
10/2014 MERY:Ladies fashion curation serviceiemo:Home-design curation service50
9/2014 Japan's largest lifehack media siteNA
10/2013 Rewarding app for customers who visit participating storesNA
9/2013 C2C market place for coaches and people who seeks lessons10
2/2015 18 Fashion-oriented VIP flash sales site
3/2015 116 Consumer-to-consumer ticket marketplace
3/2015 30 Social appE-Commerce solution
SOURCE: SPEEDA, Tech Crunch, TECH IN ASIA

• Strong demands for startup but not
enough supply
• Scarcity and immobility of talents
• More acquisitions needed
My observation about current startup environment in Japan
29
Appendix
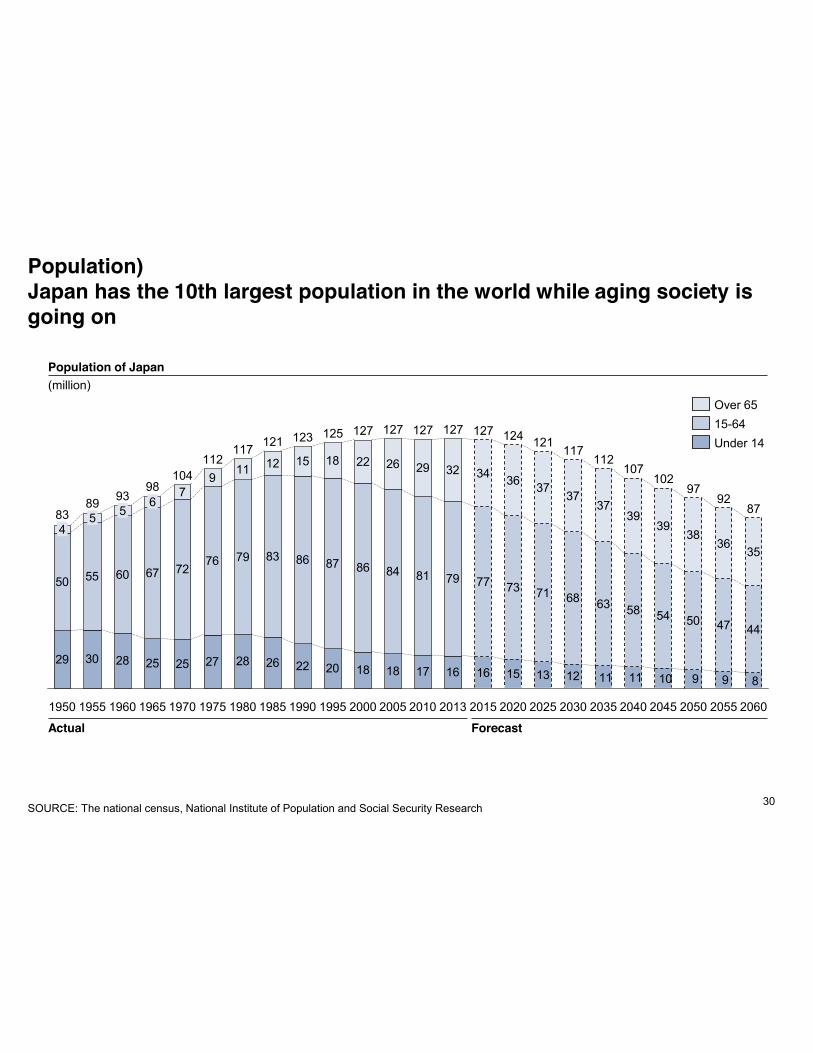
Population)Japan has the 10th largest population in the world while aging society is going on
30
29 30 28 25 25 27 28 26 22 20 18 18 17 16 16 15 13 12
50 55 60 67 7276 79 83 86 87 86 84 81 79 77 73 71 68 63 58 54 50 47 44
79
11 12 15 18 22 26 29 32 34 36 3737
3739
3938
3635
899101111
124
2015
127
2013
127
1960
93
2030
483
1950
589
117
2060
87
1955
5
97
2050
92
2055
112
2035
107
2040
102
20452025
121
20201995
125
1990
123
1985
121
1980
117
1975
112
1970
104
1965
986
2010
127
2005
127
2000
127Under 14
Over 6515-64
SOURCE: The national census, National Institute of Population and Social Security Research
Actual Forecast
Population of Japan(million)

Internet penetration)More than 90% of people over 13-59 use internet
31
100.496.596.194.694.190.988.187.585.379.577.3
0
10
20
30
40
50
60
70
80
90
100
110
2003 20052006 2008200920102011201220132004 2007
Number of internet user in Japan(million)
SOURCE: Ministry of Internal Affairs and Communications
22.3
48.9
68.976.6
91.496.697.498.597.9
73.3
0
20
40
60
80
100
30-39
20-29
40-49
13-19
50-59
60-64
70-79
65-69
80-
Average82.8
6-12
Internet penetration rate by generation in Japan(%; 2013)

Smartphone)iPhone has become the most successful smartphone in Japan
32
Penetration rate of device in household(%)
SOURCE: Ministry of Internal Affairs and Communications, IDC Japan, MMD
0
25
50
75
100
2008 2009 2010 2011 2012 2013
PC
Tablet
Smartphone
Mobile
Domestic shipments of smartphone by vendor(%; 100%=5.2 million; 2014/7-2014/9)
Samsung
11%
4%
Other
9%Sony6%
Kyocera
64%Apple
6%
Sharp
Smartphone device survey(%; N=18,182; 2014)
Xperia
iPhone
15%
13%AQUOS
44%
12%DIGNO
ARROWS 7%
GALAXY 5% 2%
Other
2%
MEDIAS

Mobile contents)Japan’s mobile contents market shows strong growth
33
0
5,000
10,000
15,000
20,000
25,000
2011
19,061
2010
16,550
2009
15,206
2008
13,524
2007
9,681
6,465
10,085
7,345
11,716
8,510
14,997
4,835
8,689
5,525
2012
5,641
3,150
4,0747,329
3,666 4,272
23,507
11,601
2006
9,307
2005
7,224
+18%
Market size of mobile contents and commerce(million USD; 1USD = JPY100)
1 Calculated based on global digital goods market size and U.S. market share among global mobile contents marketSOURCE: Ministry of Internal Affairs and Communications, GLOBIS CAPITAL PARTNERS, Mobile Contents Forum, Deutsche Bank, ResearchMoz,
ITU - ICT Statistics
Mobile ContentsMobile Commerce
US mobile contents market is estimated to be 6.8 billion USD1

E-Commerce)B2C E-Commerce shows steady growth led by key players and smartphone penetration
34
111,660
95,13084,590
77,88066,960
60,890
0
20,000
40,000
60,000
80,000
100,000
120,000
2008
+13%
201220112010 20132009
Market size of B2C E-Commerce in Japan(million USD; 1USD = JPY100)
SOURCE: Ministry of Internal Affairs and Communications
1.79 2.08 2.46 2.83 3.67
Share of E-Commercein Japan’s consumer Market (%)
3.11
Key E-Commerce companies

SNS 1/2)Line is the most commonly used service in Japan. Japanese users prefer to communicate anonymously
35
59.6
52.0
39.3
21.7
16.4
13.5
10.3
13.7
11.4
20.8
5.96.8
3.4
4.8
2.7
3.7
4.1
Line
4.4Twit Casting
Viber
5.2
5.0
Tumblr
Kakao talk
5.3
mixi
5.2
Google+
Used previsouyUsing now
Survey on SNS/communication service(2014; N=562)
Survey on anonymous use of Twitter by country(2014)
75%
31%
19%
56%
60%
42%
55%
48%
36%
40%
32%
45%
13%
14%
539
France 278
UK 9%
US
13%
498
6%Japan
8%
402
Anonimity
Korea
100%
Real name
494Singapore
Both
569
SOURCE: MMD, Ministry of Internal Affairs and Communications

SNS 2/2)People in their 20s is the most active users
36
Mobage
mixi
LINE
GREE
14.4
8.6
22.3
39.6
70.5
14.4
Survey on web service use by generation(%; 2013)
SOURCE: Ministry of Internal Affairs and Communications
16.6
57.0
80.3
34.1
22.9
47.1
65.4
19.2
16.4
16.4
42.0
13.3
11.8
13.9
9.8
12.5
20.3
42.6
2.7
3.9
7.0
3.5
15.2
22.3
1.0
0.7
1.7
3.0
5.0
4.3
10-19 20-29 30-39 40-49 50-59 60-
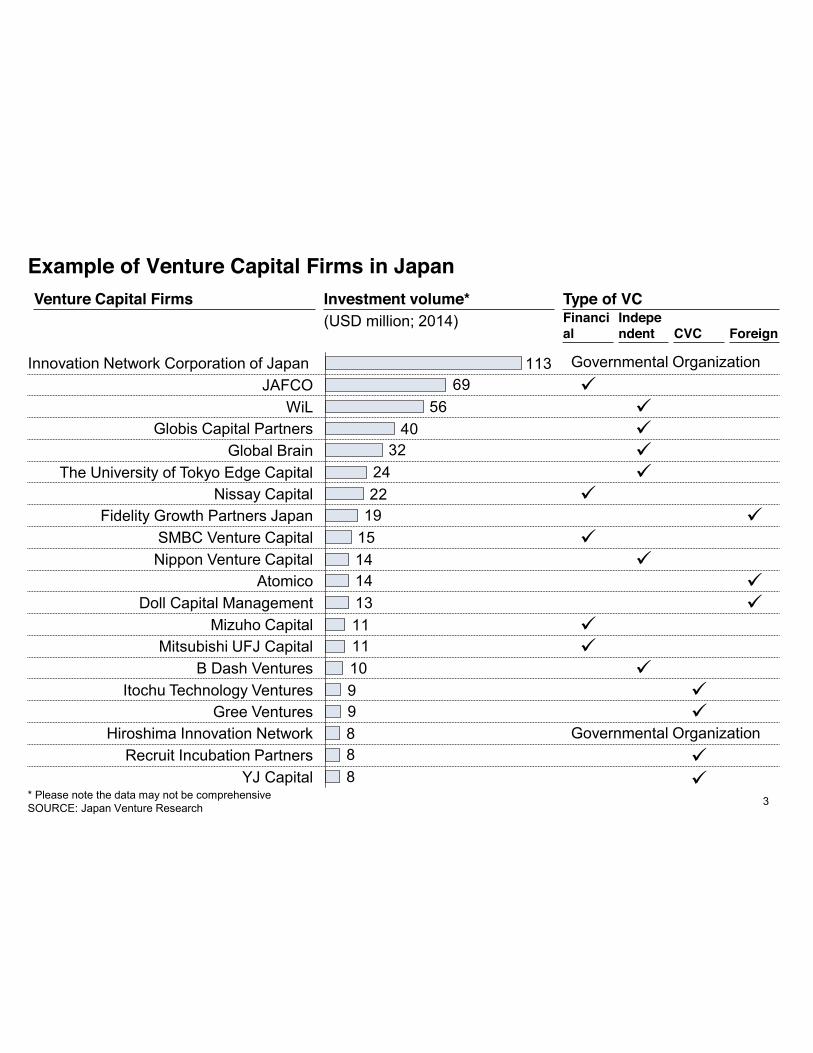
Example of Venture Capital Firms in JapanInvestment volume*(USD million; 2014)
3* Please note the data may not be comprehensiveSOURCE: Japan Venture Research
8889910111113141415192224
3240
5669
113JAFCO
WiL
Doll Capital ManagementAtomico
Fidelity Growth Partners JapanNissay Capital
Nippon Venture CapitalSMBC Venture Capital
Globis Capital PartnersGlobal Brain
The University of Tokyo Edge Capital
Innovation Network Corporation of Japan
B Dash Ventures
Gree Ventures
Mitsubishi UFJ Capital
YJ CapitalRecruit Incubation Partners
Itochu Technology Ventures
Hiroshima Innovation Network
Mizuho Capital
Venture Capital Firms Type of VCFinancial
Independent CVC Foreign
Governmental Organization9
9999
99
99
99
99
999
99
Governmental Organization


![[WEBINAR] How To Keep Your Business Momentum Up All Year](https://img.pdfslide.us/doc/110x75/55a633711a28ab7d488b46fc/webinar-how-to-keep-your-business-momentum-up-all-year.jpg)