Embed Size (px)
Citation preview

Current Status of an On-going Gravel Injection Experiment on
the Lower Yuba River, CA
Prepared by
Dr. Greg Pasternack 39601 Lupine Court
Davis, CA 95616
June 30, 2009

GravelInjectionAssessment G.B.Pasternack,2009
p. 2
Background
Most large tributaries to the Sacramento and San Joaquin Rivers that drain the Sierra
Nevada mountains have large dams. Below several of these there exists a continuous stretch
(>0.5 km) of exposed bedrock channel (or covered by a transient sediment veneer) as defined by
(Wohl and Tinkler 1998). These include the Sacramento River as well as the Feather, Yuba,
Calaveras, and Stanislaus Rivers. In some cases a bedrock canyon may have always existed (e.g.
Yuba), while in others channel and floodplain sediments scoured away after the dam cut off re-
supply (e.g. Feather). The study reported herein facilitates rehabilitation of these bedrock
reaches to promote viable salmonid populations in the Central Valley, which is a pre-condition
necessary for continued water withdrawals for California’s agricultural and municipal uses.
Four distinct races of Chinook salmon occupy the Sacramento/San Joaquin river system
(Banks et al. 2000). The spring run Chinook salmon (SRCS), is a federally threatened species
that is differentiated by the time at which adults migrate from the ocean to freshwater systems
(Yoshiyama et al. 1996). SRCS generally enter freshwater between April and June and over-
summer in cool high-elevation pools before spawning on main-stem gravel riffles in August and
September. Prior to dams blocking migration, this life history strategy enabled SRCS to migrate
high into the Sierra Nevada watersheds during snowmelt events that opened passage over natural
cascades that were impassable for other Chinook salmon runs later in the year (Yoshiyama et al.
1996). The dramatic decline in SRCS in California has been attributed to dams, as they block up
to 80% of historic habitat (Wheaton et al. 2004a). Based on life history, dams have hurt the
spawning life stage of adult SRCS the most, because spawning is the purpose behind the
migration of SRCS to Sierran headwaters.

GravelInjectionAssessment G.B.Pasternack,2009
p. 3
Under a regulated flow regime, SRCS migrate to bedrock reaches at the base of large
water-supply dams and hold in pools supplied with cold sub-thermocline water releases (Fig. 1).
On Butte Creek, a small stream with warm water when SRCS oversummer, a large minority
(38%) were reported to abandon upward migration and head downstream to spawn in suitable
gravel-bed habitat in 2007 (McReynolds and Garman 2008). Despite the poor temperature and
availability of more spawning habitat downstream, the majority of salmon attempted to spawn
upstream where they were holding. For perennial coldwater streams like the Feather and Yuba,
such downstream migration may be even less likely, because cold water is more amenable for
holding adults. For example, in 2007 UC Davis researchers observed SRCS attempting to spawn
on bedrock covered with a thin veneer of angular gravel on the Yuba below Englebright Dam.
Overall, bedrock reaches at the base of the large dams can play a key role in SRCS viability.
One approach to aiding SRCS is to rejuvenate or create good conditions for the spawning
life stage that has been most impacted by dams. One approach to obtaining good spawning
conditions is to implement gravel injection (Wheaton et al. 2004a). Gravel injection is defined
as the piling up of coarse sediment (usually a mixture of gravel and cobble ranging in size from
0.3-4 inches (8-100 mm) in diameter) within or along a river so that future floods will entrain it
and deposit it downstream. The geomorphic goal of gravel injection is to reinstate sustainable
sediment transport downstream of a dam, which is necessary maintain diverse morphological
units, such as riffles, pools, point bars, and runs. A key ecological benefit is that sufficient
gravel injection can yield deeper, looses substrates that are more suitably sized for anadromous
salmon to use for spawning and embryo incubation in downstream reaches. Gravel injection can
serve other life stages and species, depending on the hydrogeomorphic regime of the system.

GravelInjectionAssessment G.B.Pasternack,2009
p. 4
Figure 1. SRCS holding in the bedrock/boulder section of the lower Yuba River near the mouth of Deer Creek (photo courtesy of Ralph Mullican).
The purpose of this report is to describe an on-going gravel injection experiment on the
lower Yuba River at the base of Englebright Dam, evaluate its current status, and project its
future prospects. The project was implemented in November 2007 (USACE 2007) and a few
uncontrolled floods have occurred over Englebright Dam, warranting an investigation of the
status of the experiment.
Study Site
The 3,490 km2 Yuba River basin (Fig. 2, inset) has hot, dry summers and cool, wet
winters. Relative to other Sierra basins, the Yuba has among the highest mean annual
precipitation (>1,500 mm), so its development for hydropower, water supply, flood regulation,
gold mining and sediment control (James 2005) is of no surprise. During the Gold Rush (mid- to
late 1800’s), hillsides were hydraulically mined until the practice was outlawed in 1884. Vast

GravelInjectionAssessment G.B.Pasternack,2009
p. 5
mining sediments exist in the Yuba basin (e.g. ~522 million m3 injected into the South Fork
(Curtis et al. 2005). Today, the river is also impacted by flow regulation, bank alteration,
channelization, and in-channel gravel mining. Englebright Dam (capacity of just 82.6 million
m3) was built in 1941 as a debris barrier downstream of the junction of the three forks. In 1971,
New Bullards Bar Reservoir (capacity of 1.19 billion m3) was built on the North Fork for water
supply and flood control. Englebright and New Bullards Bar dams restrict SRCS access to 73%
of upper habitat areas. A remnant population of <1000 SRCS persists below Englebright.
Streamflow is recorded at the United States Geological Survey Smartville gage
(#11418000) 0.5 km downstream of Englebright. Between 1942 and 1971, the statistical bankful
discharge (Qb, 1.5 year recurrence interval) at the Smartville gage was 328.5 m3 s-1. In the
period since 1971, the gage’s Qb is 159.2 m3 s-1. Given that the Middle and South Forks lack
large reservoirs, winter storms and spring snowmelt produce floods that overtop Englebright.

GravelInjectionAssessment G.B.Pasternack,2009
p. 6
Figure 2. EDR topographic map showing locations of existing shot rock deposits. Inset map shows location of study site within the Yuba River Basin and within California.

GravelInjectionAssessment G.B.Pasternack,2009
p. 7
The Lower Yuba River (LYR) is ~38 km (24 mi) long from Englebright to the junction
with the Feather. Steelhead trout and Chinook salmon utilize the LYR for spawning, rearing,
and migration. SRCS habits and lifecycle patterns on the LYR are poorly documented.
Management of the LYR involves diverse local, state, and federal entities.
The Englebright Dam Reach (EDR) extends from Englebright down to the junction with
Deer Creek (Fig. 2). It is a relatively straight bedrock canyon with a veneer of “shot rock”
debris. Shot rock is irregular shaped rock blasted from surrounding hillsides. In the EDR, shot
rock was generated and spread by two distinct processes; rock excavation during the construction
of Englebright Dam and hillside scouring during major floods. EDR is also influenced by a
backwater effect imposed by Deer Creek, since flood pulses out of Deer Creek usually come
before the larger (and more snow-covered) Yuba River.
Baseline Studies
Prior to performing any gravel injection on the lower Yuba River, a baseline study was
done to characterize the status of the Englebright Dam Reach (Pasternack, 2008). One key
finding was that for the baseline pool topography of the Narrows II pool, a 4-year flow event of
about 710 m3 s-1 (25100 cfs) was predicted to be necessary to initiate gravel movement in the
Narrows II pool (Fig. 3d). Transport in the constricted channel downstream of the pool was
predicted to begin at a lower discharge of ~270 m3 s-1 (9570 cfs) (Fig. 3c). These predictions
were based on a 2D hydrodynamic model of a small section of the EDR between the Narrows I
and II powerhouses. Subsequently, a larger model spanning the whole EDR was developed, but
at present there is inadequate stage-discharge data to drive the large model across a range of
GravelInjectionAssessment G.B.Pasternack,2009
p. 8
important flow conditions. Both models are highly detailed, but they have a lot of uncertainties.
The models do not account for 1) hydraulic jets coming out of the Narrows I or II powerhouses,
2) any possible complex 3D flows or turbulent bursts associated with water spilling over the
dam, 3) the fact that injected gravel decreases depth and may be present in a lose, steep pile that
is more susceptible to scour, 4) the wide range of gravel sizes present in the injected material, or
5) the porous nature of the jumble of boulders composing the bed in much of the channel. These
uncertainties present extremely challenging conditions for any model and render the predictions
into a guide of what might happen rather than a highly accurate depiction of fact. Consequently,
having some direct observational evidence to evaluate actual processes is very important for
planning how to proceed with a gravel injection program.
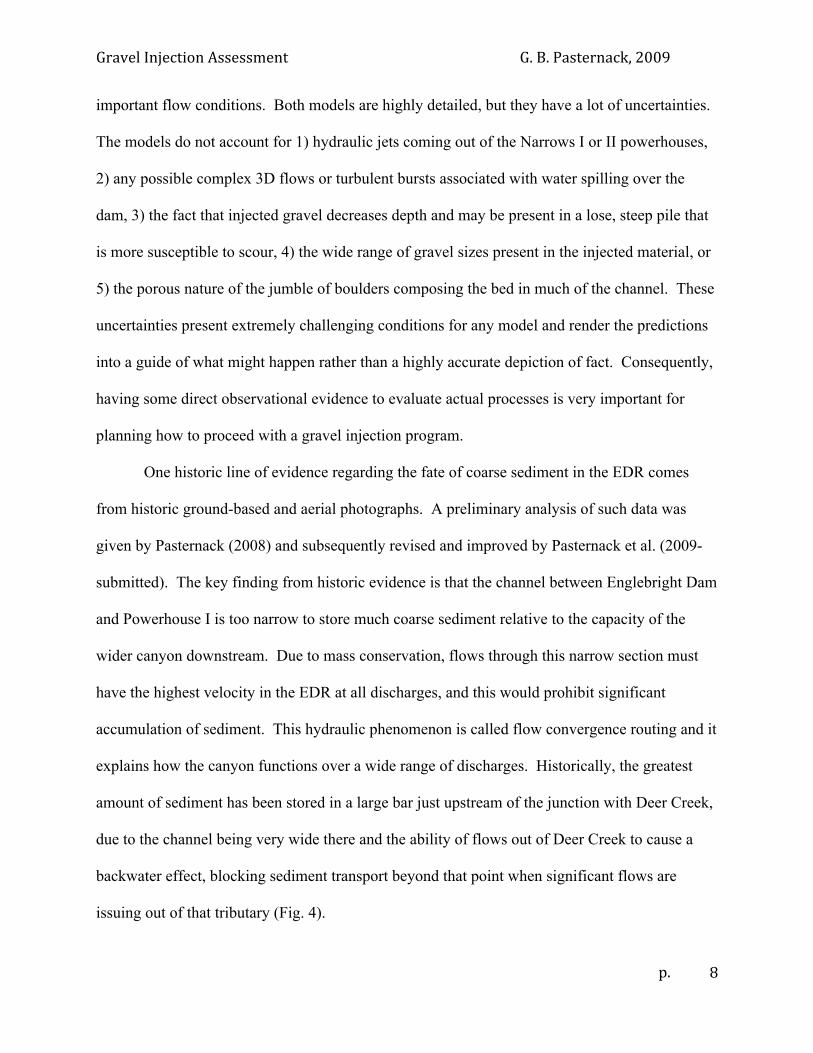
One historic line of evidence regarding the fate of coarse sediment in the EDR comes
from historic ground-based and aerial photographs. A preliminary analysis of such data was
given by Pasternack (2008) and subsequently revised and improved by Pasternack et al. (2009-
submitted). The key finding from historic evidence is that the channel between Englebright Dam
and Powerhouse I is too narrow to store much coarse sediment relative to the capacity of the
wider canyon downstream. Due to mass conservation, flows through this narrow section must
have the highest velocity in the EDR at all discharges, and this would prohibit significant
accumulation of sediment. This hydraulic phenomenon is called flow convergence routing and it
explains how the canyon functions over a wide range of discharges. Historically, the greatest
amount of sediment has been stored in a large bar just upstream of the junction with Deer Creek,
due to the channel being very wide there and the ability of flows out of Deer Creek to cause a
backwater effect, blocking sediment transport beyond that point when significant flows are
issuing out of that tributary (Fig. 4).

GravelInjectionAssessment G.B.Pasternack,2009
p. 9
Figure 3. Spatially distributed predictions of Shields stress below the Narrows II powerhouse made with a 2D model. Orange and red indicate predictions of full transport of sediment rolling and skipping along the bed as a sheet.
Figure 4. 1909 G.K. Gilbert photo looking downstream toward the mouth of Deer Creek confirming the presence of gravel-bed riffles in this wide section of EDR historically. Sinoro Bar is along the right bank of the river in the photo.

GravelInjectionAssessment G.B.Pasternack,2009
p. 10
EDR Gravel Injection Experiment
UC Davis, USFWS, and USACE collaborated on an experimental gravel injection below
Englebright Dam in November 2007. The purpose of this experiment was to find out if and
where gravel would deposit in the EDR and thus gain insight into the efficacy of gravel injection
as a habitat enhancement tool for spring-run Chinook salmon in the EDR. The basic study
design involved injecting gravel during low flow in autumn of 2007 and then waiting for high
flows in subsequent water years to move it. Then it would be possible to track where those
materials went.
Five hundred short tons of triple washed river gravel was purchased from a nearby quarry
downstream. Based on bucket tests in a quarry, Merz et al. (2006) reported a dry bulk density of
gravel to be ~0.722 yds3 per short ton for a Mokelumne River quarry. Using this estimate, a total
of 361 yds3 of gravel was available to be injected in the EDR. The material was trucked in ahead
of time and piled on top of the gravel parking lot at the Narrows II powerhouse (Fig. 5). Gravel
injection took place on November 29, 2007 beginning at 9:30 am and finishing by 3:00 pm. A
TB 135 truck-mounted gravel conveyor was used to reach out over the river and inject gravel
into the Narrows II pool (Fig. 6). A single small loader was used to transfer piled gravel into the
hopper, but it turned out that not all the gravel could be fully injected during the single allotted
day using that one loader. Consequently, a small amount ended up being incorporated into the
parking lot, instead of going into the river (Fig. 7). Using a tape measure, the volume of gravel
left behind on the parking lot, in between boulders on the edge of the lot, and spilled over the
side was estimated to be ~34 yds3. That suggests that in the future two loaders be used per 500
short tons of gravel placed per day and ideally the gravel should be stored on steel plates to

GravelInjectionAssessment G.B.Pasternack,2009
p. 11
minimize losses into the ground. Nevertheless, ~327 yds3 of gravel and cobble was placed into
the river. As the material was being placed into the river, ~400 painted, magnetized tracer stones
were put into the hopper with the gravel to facilitate tracking. Those tracers are thus integrated
all throughout the in-river gravel pile. Those stones will be traceable using a magnetic locator,
but any rounded gravel that is found downstream in the EDR must be coming from this source,
because there is virtually no other such material in this reach.
Post-Injection Hydrology
The flow in EDR is gaged in the bedrock canyon roughly half way down (USGS
Smartville Gage #11418000). The hourly record was obtained from the California Data
Exchange Center website (Fig. 8). During the 2007-2008 water year, the maximum flow was
3500 cfs. That is so low that it would not have made any sense to scout the river for gravel
transport. On February 23, 2009 flow began to rise at 8 am and reached a peak of 8014 cfs at 5
am on February 24. Flow was back down to the base level by midnight on February 27. On
March 2 flow rose again and peaked at 6726 cfs on March 4 at 2 am. Flow was back to the base
level at 1 am on March 7. These events were short and flashy, but provided an opportunity to
evaluate the veracity of the 2D model at a peak ~68% lower than that predicted to be necessary
to entrain the injected gravel. As a result, a site investigation was made on April 1, 2009.
Subsequently, on May 3 flow began to rise again and this time it reached a peak of 15381 cfs.
This high peak dropped down to 4500 cfs by 6 am on May 7, but then a flow of ~4000-4500 cfs
was sustained until May 25.

GravelInjectionAssessment G.B.Pasternack,2009
p. 12
Figure 5. 500 short tons of triple-washed gravel prior to injection.
Figure 6. Gravel injection on November 29, 2007. Gravel pile is located in zone of aeration downstream of the Narrows II powerhouse.

GravelInjectionAssessment G.B.Pasternack,2009
p. 13
Figure 7. Residual gravel left on the parking lot surface, between boulders, and spilled over the side.
Figure 8. EDR hydrograph showing flow peaks and the timing of key activities.

GravelInjectionAssessment G.B.Pasternack,2009
p. 14
Reconnaissance Methods
Two site visits were made in the first half of 2009 to evaluate the status of the gravel
injection experiment. The first visit was done on April 1 after peaks of 8014 and 6726 cfs. The
second visit was done on June 29 after a peak of 15381 cfs. The methods used were limited by
site conditions. One problem is that the part of the Narrows II pool where the gravel was
injected is highly aerated with bubbles coming from the hydraulic jet out of the powerhouse (Fig.
9). Aeration is not present when the powerhouse is off, which is usually in September for
maintenance and inspection. Otherwise, the bubbles limit the use of an echosounder over the
gravel pile to map changes in its volume and shape after individual events. Another problem is
that the topography of the river bed is highly complex due to the presence of jumbles of boulders
on the bed. That complexity means that repeat surveys to track gravel changes is unlikely to be
successful, because each survey is going to map different points on the jumble of boulders and
yield too much topographic variation/noise even in the absence of gravel to be able to track the
volume of a small amount of gravel as it moves downstream through the jumble, as was
previously done on the gravel-bedded lower Mokelumne River (Merz et al., 2006) and
downstream in Timbuctoo Bend on the lower Yuba River (Pasternack, 2008). So detailed repeat
mapping methods are not well suited to this particular monitoring situation.
The best approach to use to achieve the goals of the experiment proved to be to manually
track gravel and manually measure the dimensions of deposits. Gravel was traced by scouting
the river by kayak from the Narrows II powerhouse down to the junction with Deer Creek as
well as by walking along the canyon wall on the north side of the river and looking down with
the aid of direct morning sunlight penetrating the water. To facilitate tracking from ground-level

GravelInjectionAssessment G.B.Pasternack,2009
p. 15
and from the canyon wall, polarized sunglasses that can see further through the water were used.
In the April and June surveys the bed visible down to depths of 5’ and 8’, respectively. Also, a
7’-long rod was used to probe the bed for gravel, which makes a distinct grinding sound when
pushed on as opposed to bedrock or boulders. The kayak was maneuvered back and forth across
the channel to carefully scout the river bed. Locations deeper than could be viewed or probed
were not assessed in detail, but lines of evidence of transport leading into and out of such deep
pools were carefully inspected. For example, as the results below show, injected gravel is highly
unlikely to move into a pool without leaving a residual trail in the jumble of boulders at the pool
entrance. Once located, deposits of injected sediment were mapped spatially and their thickness
estimated using the probe rod. Volumetric estimates of gravel deposits were used to construct a
sediment budget for the experiment.
Figure 9. Region of highly aerated flow downstream of the Narrows II powerhouse. This is where the gravel pile is situated. Echosounder surveys would require the absence of aeration.
GravelInjectionAssessment G.B.Pasternack,2009
p. 16
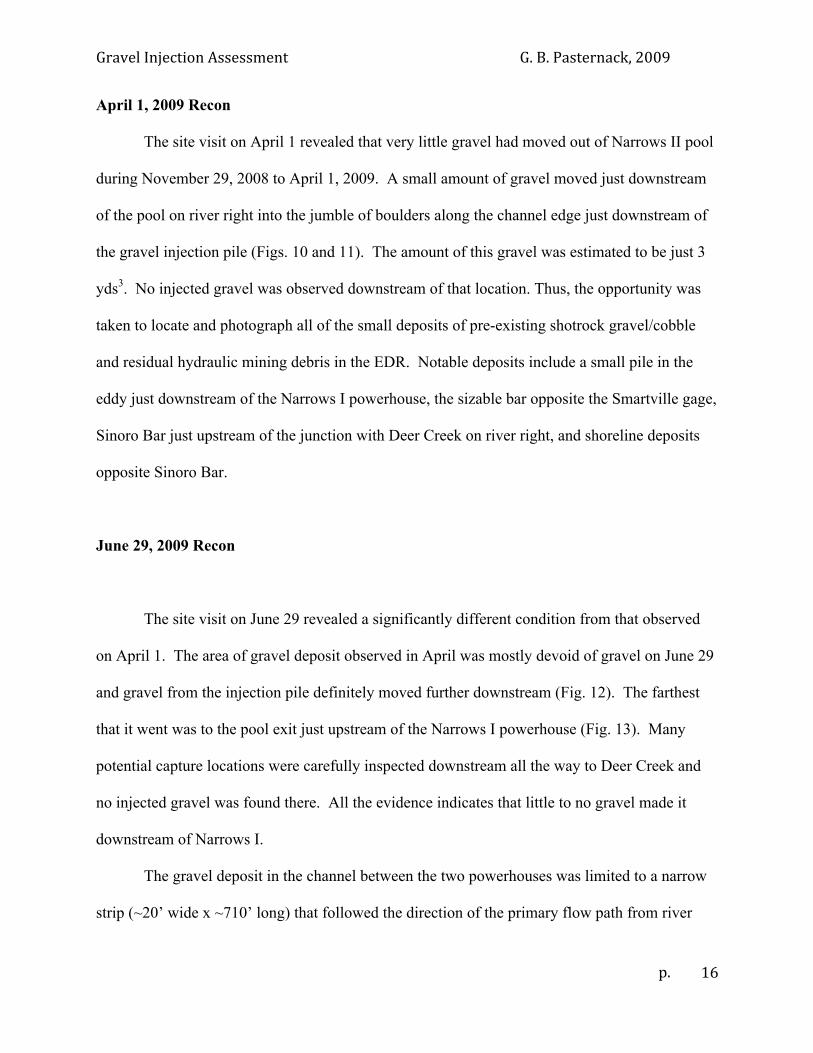
April 1, 2009 Recon
The site visit on April 1 revealed that very little gravel had moved out of Narrows II pool
during November 29, 2008 to April 1, 2009. A small amount of gravel moved just downstream
of the pool on river right into the jumble of boulders along the channel edge just downstream of
the gravel injection pile (Figs. 10 and 11). The amount of this gravel was estimated to be just 3
yds3. No injected gravel was observed downstream of that location. Thus, the opportunity was
taken to locate and photograph all of the small deposits of pre-existing shotrock gravel/cobble
and residual hydraulic mining debris in the EDR. Notable deposits include a small pile in the
eddy just downstream of the Narrows I powerhouse, the sizable bar opposite the Smartville gage,
Sinoro Bar just upstream of the junction with Deer Creek on river right, and shoreline deposits
opposite Sinoro Bar.
June 29, 2009 Recon
The site visit on June 29 revealed a significantly different condition from that observed
on April 1. The area of gravel deposit observed in April was mostly devoid of gravel on June 29
and gravel from the injection pile definitely moved further downstream (Fig. 12). The farthest
that it went was to the pool exit just upstream of the Narrows I powerhouse (Fig. 13). Many
potential capture locations were carefully inspected downstream all the way to Deer Creek and
no injected gravel was found there. All the evidence indicates that little to no gravel made it
downstream of Narrows I.
The gravel deposit in the channel between the two powerhouses was limited to a narrow
strip (~20’ wide x ~710’ long) that followed the direction of the primary flow path from river

GravelInjectionAssessment G.B.Pasternack,2009
p. 17
right at the injection pile to river left at the pool exit just upstream of the Narrows I powerhouse.
Minimal lateral dispersal of injected gravel was evident. Throughout the strip of deposition, the
gravel was primarily located in the pore spaces of the jumble of boulders. In the first ~200 feet
of length, the gravel filled ~90% of the 20’ wide strip, while in the next ~510 feet of length it
only filled ~25% of the strip. Probes of the thickness of fill revealed that it ranged from 0-4”
thick. Also, a lot of the gravel observed to have moved was pea gravel (~2-16 mm), though
some coarse gravel and fine cobble was observed throughout the deposit. The volumes of the
two sections of the deposit were estimated to be 44 and 31 yds3, respectively.
Experiment Gravel Budget
The gravel budget for the experiment began with 500 short tons of gravel that was
estimated to be equivalent to a volume of 361 yds3. Of this, 34 yds3 was left up on the bank. Of
the 327 yds3 that was successfully injected to the river, only 3 yds3 moved during the period
when flow was ≤ 8014 cfs. After a flood with a peak flow of 15381 cfs, a total of 75 yds3
moved. That amount includes the 3 yds3 that was moved prior to that, so that means that 252 yds3
remains in the gravel injection pile in the Narrows II pool as of July 1, 2009.
For comparison, the average annual load of gravel and cobble into Englebright Lake is
61,600 yds3/yr (Snyder et al., 2004). Also, the annual average amount of sediment scoured out
of Timbuctoo Bend (further downstream) from 1999-2006 was 86,500 yds3/yr (Pasternack,
2008).

GravelInjectionAssessment G.B.Pasternack,2009
p. 18
Figure 10. High view of the small deposit of gravel just downstream of the gravel injection pile. The gravel appears as a lighter color just downstream of a boulder in the top center of the photo.
Figure 11. Close view of the small deposit of gravel just downstream of the gravel injection pile. The gravel is filling the interstices of the boulders.

GravelInjectionAssessment G.B.Pasternack,2009
p. 19
Figure 12. Narrow strip of deposited gravel on river right downstream of the injection pile. Flow is from left to right. Gravel is the light colored strip underwater along the bottom of the photo.
Figure 13. Gravel deposit (white area in the foreground of the photo) just upstream of the Narrows I powerhouse on river left.

GravelInjectionAssessment G.B.Pasternack,2009
p. 20
Discussion
Based on the findings of the experiment so far, a picture of how and where gravel
injected into the Narrows II pool moves is emerging. The injection procedure results in a steep
pile of very loose gravel submerged in the pool. The pool is ~15’ deep and the gravel pile was
likely ~11’ high right after injection. With the constant assault by the hydraulic jet coming out
of the Narrows II powerhouse, it is highly likely that gravel landslides down the backside of the
pile, spreading and settling into the pool over time. Nevertheless, the pile protrudes up from the
bed and is highly exposed to scour. A flood peak of 8014 cfs recorded at the Smartville gage
was only sufficient to just nip off the very top of the pile and push it a few tens of feet directly
downstream along the river right bank where it got caught into the jumble of bounders on the bed
and bank. The subsequent peak of 15381 cfs was able to scour somewhat deeper into the pile,
but it left behind a majority of the gravel, suggesting that a significantly higher discharge is
needed o entrain the majority of the injected gravel. Most of the gravel that was transported was
small in size and it was primarily captured into the nooks and crannies of the jumble of boulders
on the channel bottom. These pore spaces provide excellent sheltering from higher velocities.
Given the constricted width of the channel just downstream of the Narrows II pool, the velocity
was high enough to maintain some material higher in the flow field to hop and skip downstream
for up to ~720’. The flow path shifted from river right to left and thus aimed straight at the
Narrows I powerhouse outlet. During the May flood, discharge out of the powerhouse was ~500
cfs, so with the line of gravel transport pointed toward that nozzle of the jet, it appears that even
this small amount of outflow was enough to force the gravel to drop out upstream of it.
In the baseline study, the 2D model that was used did not include a gravel pile, so it is not

GravelInjectionAssessment G.B.Pasternack,2009
p. 21
surprising that it predicted a higher discharge necessary to entrain gravel from the bottom of the
pool rather than at a higher elevation on the top of a gravel pile. No pile was used in the model,
because at the time the model was developed the subsequent method of gravel injection was
unknown. The fact that the majority of the gravel has not scoured out of the pool suggests that
the 2D model prediction of the discharge required to entrain the material is holding up. In the
future it would be possible to build a gravel pile into the 2D model to yield a more accurate
prediction of the discharge necessary to entrain gravel. Similarly, using the larger model it
would be possible to add a flow inlet at the location of the Narrows I powerhouse to evaluate the
significance of a backwater effect there.
The 2D model predicted that any discharge capable of entraining gravel out of the deep
pool would certainly be able to move it through the constricted reach. The observations confirm
that the gravel follows the hydraulic flow path predicted by the 2D model, but they contradict the
prediction that the gravel will pass through the constricted section without depositing in it. The
reason the model failed is that it assumes a smooth bed with a parameterization of bed roughness
using a Manning’s bed roughness value that does not actually simulate pores between boulders.
The topographic map of the river bed is not detailed enough to resolve bed pores and neither
mapping software nor the 2D modeling program can handle undercut surfaces. The 2D model
resolved the mechanism of flow convergence routing that predicted gravel to move through the
constricted reach, but lacking a 3D porous bed the 2D model is not capable of predicting gravel
capture into bed pore spaces. Notably, present 3D models cannot be run in that fine of detail
either, so there is no model that can simulate the actual process of gravel capture in the bed pores
at this time. This represents a fundamental limitation of predictive models at this time, making
real injection experiments such as the one in the EDR highly valuable.

GravelInjectionAssessment G.B.Pasternack,2009
p. 22
The gravel that was caught up in the porous bed yielded a thin veneer, so it is unlikely
that SRCS will be able to spawn in it. These fish are already trying to spawn on the bedrock, so
the current situation with the experiment is unlikely to cause a biological nuisance beyond the
existing problem. It might be worthwhile to have a biologist observe SRCS in the autumn of
2009 to see how the fish behave given the presence of some gravel in the upper canyon.
The most important outcome of the experiment so far is that a pile of ~ 360 yds3 of
injected gravel will be entrained at ~15,000 cfs. The higher the gravel is piled up, the lower the
discharge necessary to move it. As it erodes down, it will take higher discharges to further erode
it down. Once entrained the gravel will advect along the hydraulic flow path and not disperse
laterally, even in the presence of large eddies and complex patterns of turbulence. The gravel
itself appears to fractionate according to size, with the finer pea gravel being most susceptible to
transport. Transported gravel moves downstream along the bed and is captured into pores in the
jumble of boulders along the bottom.
Future Outlook of the Current Experiment
So far the gravel experiment is providing new insights that are highly useful for planning
gravel injection in bedrock/boulder canyons, such as the Englebright Dam Reach of the lower
Yuba River. The simple method of manually tracking and measuring the injected gravel works
well, because there is almost no other rounded river gravel in the canyon. Future monitoring can
continue this method and possibly include an echosounder surveyor of the Narrows II pool at a
time when the powerhouse is off.
In the future it will take higher floods to entrain the remaining gravel in the Narrows II

GravelInjectionAssessment G.B.Pasternack,2009
p. 23
pool, because the pile is likely lower now. However, the gravel that is presently in the channel
downstream is very likely to be lifted up and out of the pores by random bursts and sweeps of
turbulent flow during floods. Thus, transport will continue to disperse gravel downstream and
that is worth monitoring.
The fact that gravel deposited between the powerhouses raises the likelihood that a larger
gravel injection program would yield even more deposition in that section. That is a concern,
because some of that gravel might dewater during the lowest flow release during September and
October when the Narrows II powerhouse is shut down for maintenance. This is the same period
when SRCS attempt to spawn. Several creative options are available to mitigate this problem.
First, the area of concern could be dewatered before spawning begins. Second, one could use the
new Narrows II bypass to keep that part of the channel wet. Third, one could limit gravel
injection timing and volumes to minimize storage in the area of concern. Fourth, one could
inject so much gravel as to completely fill in the constricted section and then provide sustained
flows to support SRCS spawning there. Fifth, one could build a gravel conveyance line further
downstream to inject gravel into the Narrows I pool where there is no concern. A variety of
factors need to be weighed by stakeholders and regulators, but the evidence does suggest that
further evaluation of this particular question is needed.
Given that the injected gravel pile has gone down a fair amount, enough space now exists
in the Narrows II pool to accommodate another injection of 500 short tons. This would enable
lower flows to entrain the material and allow for more tracking of sediment further downstream
over time. The main scientific benefit would be to see how the canyon continues to fill with
gravel rather than letting the current pulse of material subside. It also might be worthwhile to
investigate what it would take to build a permanent gravel converyor system onto the hillside to

GravelInjectionAssessment G.B.Pasternack,2009
p. 24
feed the material down to the Narrows I pool to avoid any concerns with channel dewatering
upstream of Narrows I, if that is still a concern of the stakeholders.
Large-Scale Vision of EDR Rehabilitation
In the past, people have considered whether gravel should be added to the lower Yuba
River. Pasternack (2008) provided strong evidence that there is no need for gravel injection
downstream of the Narrows. The best value in adding gravel to the river comes in providing
spawning habitat specifically for SRCS. To serve that purpose, gravel should be added to the
river to provide more grave-bed channel features in the Englebright Dam Reach and in the
Narrows, which are the reaches preferred by SRCS. To achieve that goal the two best options
are to either inject the gravel into the EDR and/or build a spawning habitat rehabilitation project
at Sinoro Bar at the junction with Deer Creek. Ideally, both of these activities should be
undertaken in combination. However, each option has complications that warrant further study
and close consultation among stakeholders and regulators.
Pasternack et al. (2009-submitted) thoroughly evaluated the history and suitability of the
Sinoro Bar site for spawning habitat rehabilitation. They concluded that a comprehensive project
should be undertaken at that location. Specifically, the massive amount of undesirable shot rock
debris located there (~170,000 yds3) should be removed off site and replaced with ~100,000 yds3
of suitable rounded river gravel, to be placed by rational design using the Spawning Habitat
Integrated Rehabilitation Approach of Wheaton et al. (2004a,b).
Once the Sinoro Bar site is rehabilitated, gravel injection at Englebright Dam could feed
and sustain it, allowing it to adjust itself naturally over time. Existing shot rock and friable
hillsides at the dam should be furthered stabilized to reduce erosion. Then a gravel injection

GravelInjectionAssessment G.B.Pasternack,2009
p. 25
program should be established to feed gravel to the Sinoro Bar area. This has the benefit of
possibly yielding smaller pockets of deposition further up in the canyon behind local
obstructions (Fulton 2008) and it avoids impacting local land owners adjacent to Sonoro Bar
with annual gravel deliveries.Based on our experience with gravel injection in California,
~13,000 yds3 yr-1 would promote sustainable deposition behind flow obstructions that would be
large enough to support a SRCS population as well as replenish any losses to mesohabitat in the
Sinoro Bar area. If no large-scale gravel placement was done at Sinoro Bar at the time of shot
rock removal, then injection of ~26,000 yds3 yr-1 at the dam would likely be large enough to
yield sustainable gravel bar and riffle formation down at Sinoro Bar in 5-15 years, depending on
the flood regime. After that, the injected amount could be reduced to a maintenance level of
~13,000 yds3 yr-1. However, injecting that volume into the river at the dam would be extremely
challenging without engineering a permanent gravel conveyance system into the hillside. Also,
direct gravel placement at Sinoro Bar would have the benefit of providing immediate SRCS
habitat for all freshwater life stages with much less uncertainty.
References
Banks, M. A., V. K. Rashbrook, M. J. Calavetta, C. A. Dean, and D. Hedgecock. 2000. Analysis
of microsatellite DNA resolves genetic structure and diversity of chinook salmon (Oncorhynchus tshawytscha) in California's Central Valley. Canadian Journal of Fisheries and Aquatic Science 57: 915-927.
Curtis, J. A., L. E. Flint, C. N. Alpers, and S. M. Yarnell. 2005. Conceptual model of sediment processes in the upper Yuba River watershed, Sierra Nevada, CA. Geomorphology 68: 149-166.
Fulton, A. A. 2008. Gravel for Salmon in Bedrock Channels: Elucidating Mitigation Efficacy Through Site Characterization, 2D-Modeling, and Comparison Along the Yuba River, CA. University of California.
James, L. A. 2005. Sediment from hydraulic mining detained by Englebright and small dams in the Yuba basin. Geomorphology 71: 202-226.
McReynolds, T. R., and C. E. Garman. 2008. Butte Creek spring-run Chinook salmon,

GravelInjectionAssessment G.B.Pasternack,2009
p. 26
Oncoryhnchus Tshawytscha pre-spawn mortality evaluation 2007. California Department of Fish and Game.
Merz, J. E., Pasternack, G. B., Wheaton, J. M. 2006. Sediment Budget for Salmonid Spawning Habitat Rehabilitation in the Mokelumne River. Geomorphology 76:1-2:207-228.
Pasternack, G. B. 2008. SHIRA-Based River analysis and field-based manipulative sediment transport experiments to balance habitat and geomorphic goals on the lower Yuba River., p. 569. University of California at Davis.
Pasternack, G. B., Fulton, A. A., and Morford, S. L. 2009-submitted. Historical Analysis of the Englebright Dam Reach of the Lower Yuba River, CA to aid Spring-Run Chinook Salmon Habitat Rehabilitation. California Agriculture.
Snyder, N. P. and others 2004. Estimating accumulation rates and physical properties behind a dam: Englebright Lake, Yuba River, northern California. Water Resources Research 40: 1-19.
USACE. 2007. Lower Yuba River pilot gravel injection project, Yuba and Nevada Counties, California- draft environmental assessment, p. 59. In U. S. A. C. o. Engineers [ed.]. U.S. Army Corps f Engineers, Sacramento District.
Wheaton, J. M., G. B. Pasternack, and J. E. Merz. 2004a. Spawning habitat rehabilitation-I. conceptual approach and models. International Journal of River Basin Management 2: 3-20.
---. 2004b. Spawning habitat rehabilitation-II. Using hypothesis development and testing in design, Mokelumne River, California, U.S.A. International Journal of River Basin Management 2: 21-37.
Wohl, E., and K. J. Tinkler. 1998. A primer on bedrock channels. In E. Wohl and K. J. Tinkler [eds.], Rivers Over Rock: Fluvial processes in bedrock channels. American Geophysical Union.
Yoshiyama, R. M., E. R. Gerstung, F. W. Fisher, and P. B. Moyle. 1996. Historical and Present Distribution of Chinook Salmon in the Central Valley Drainage of California. Sierra Nevada Ecosystem Project, Final Report to Congress, Volume III. University of California, Centers for Water and Wildland Resources.