Embed Size (px)
Citation preview
The Cryosphere, 7, 81–102, 2013www.the-cryosphere.net/7/81/2013/doi:10.5194/tc-7-81-2013© Author(s) 2013. CC Attribution 3.0 License.
The Cryosphere
Current state of glaciers in the tropical Andes: a multi-centuryperspective on glacier evolution and climate change
A. Rabatel1, B. Francou2, A. Soruco3, J. Gomez4, B. Caceres5, J. L. Ceballos6, R. Basantes2,7, M. Vuille 8, J.-E. Sicart2,C. Huggel9, M. Scheel9, Y. Lejeune10, Y. Arnaud2, M. Collet2,7, T. Condom2, G. Consoli2, V. Favier1, V. Jomelli11,R. Galarraga7, P. Ginot1,12, L. Maisincho5, J. Mendoza13, M. M enegoz1, E. Ramirez13, P. Ribstein14, W. Suarez15,M. Villacis 7, and P. Wagnon2
1UJF-Grenoble 1/CNRS, Laboratoire de Glaciologie et Geophysique de l’Environnement (LGGE) UMR5183, Grenoble,38041, France2IRD/UJF-Grenoble 1/CNRS/Grenoble-INP, Laboratoire d’etude des Transferts en Hydrologie et Environnement (LTHE)UMR5564, Grenoble, 38041, France3UMSA, IGEMA, Calle 27, Cota Cota, La Paz, Bolivia4ANA, UGRH, Huaraz, Peru5INAMHI, I naquito N36-14 y Corea, Quito, Ecuador6IDEAM, Carrera 10 N20-30, Bogota DC, Colombia7EPN, DICA, Ladron de Guevara E11-253, Quito, Ecuador8Department of Atmospheric and Environmental Sciences, University at Albany, Albany, NY, USA9Department of Geography, University of Zurich, 8057 Zurich, Switzerland10CEN, CNRM-GAME, Meteo-France/CNRS, Saint Martin d’Heres, France11UPS-Paris 1/CNRS/UVM-Paris 12, Laboratoire de Geographie Physique (LGP) UMR8591, Meudon, 92195, France12IRD/CNRS/IFSTTAR/Meteo-France/UJF-Grenoble 1/Universite de Savoie/Grenoble-INP, Observatoire des Sciences del’Univers Grenoble (OSUG) UMS222, St Martin d’Heres, 38400, France13UMSA, IHH, Calle 30, Cota Cota, La Paz, Bolivia14UMPC/CNRS/EPHE, Sisyphe UMR7619, Paris, 75252, France15SENAMHI, av. Las Palmas s/n, Lima, Peru
Correspondence to:A. Rabatel ([email protected])
Received: 13 June 2012 – Published in The Cryosphere Discuss.: 16 July 2012Revised: 28 November 2012 – Accepted: 15 December 2012 – Published: 22 January 2013
Abstract. The aim of this paper is to provide the communitywith a comprehensive overview of the studies of glaciers inthe tropical Andes conducted in recent decades leading tothe current status of the glaciers in the context of climatechange. In terms of changes in surface area and length, weshow that the glacier retreat in the tropical Andes over thelast three decades is unprecedented since the maximum ex-tension of the Little Ice Age (LIA, mid-17th–early 18th cen-tury). In terms of changes in mass balance, although therehave been some sporadic gains on several glaciers, we showthat the trend has been quite negative over the past 50 yr,with a mean mass balance deficit for glaciers in the tropi-cal Andes that is slightly more negative than the one com-puted on a global scale. A break point in the trend ap-
peared in the late 1970s with mean annual mass balanceper year decreasing from−0.2 m w.e. in the period 1964–1975 to−0.76 m w.e. in the period 1976–2010. In addition,even if glaciers are currently retreating everywhere in thetropical Andes, it should be noted that this is much morepronounced on small glaciers at low altitudes that do nothave a permanent accumulation zone, and which could dis-appear in the coming years/decades. Monthly mass balancemeasurements performed in Bolivia, Ecuador and Colombiashow that variability of the surface temperature of the PacificOcean is the main factor governing variability of the massbalance at the decadal timescale. Precipitation did not dis-play a significant trend in the tropical Andes in the 20th cen-tury, and consequently cannot explain the glacier recession.
Published by Copernicus Publications on behalf of the European Geosciences Union.
82 A. Rabatel et al.: Current state of glaciers in the tropical Andes
On the other hand, temperature increased at a significant rateof 0.10◦C decade−1 in the last 70 yr. The higher frequencyof El Nino events and changes in its spatial and temporaloccurrence since the late 1970s together with a warming tro-posphere over the tropical Andes may thus explain much ofthe recent dramatic shrinkage of glaciers in this part of theworld.
1 Introduction
The tropical Andes are host to more than 99 % of all tropicalglaciers (Kaser, 1999) between Peru (71 %), Bolivia (20 %),Ecuador (4 %) and Colombia–Venezuela (4 %). Glacier in-ventories have been conducted in almost all tropical moun-tain ranges (Jordan, 1991; Poveda and Pineda, 2009; UGRH,2010) from 1975 in Bolivia to 2006 in Peru. Based on theseinventories and current rates of retreat documented for a sam-ple of glaciers in different cordilleras, Francou and Vincent(2007) estimated the total glacier surface area in the tropicalAndes in the early 2000s to be around 1920 km2.
The Intergovernmental Panel on Climate Change (IPCC)pointed to the role of mountain glaciers as key indica-tors of recent climate change (Lemke et al., 2007). Tropi-cal glaciers are known to be especially sensitive to climatechange (e.g. Hastenrath, 1994; Kaser and Osmaston, 2002).Due to the specific climate conditions in the tropical zone,ablation occurs all year round on the lowest part of theglaciers, resulting in a short-time response of the position ofthe glacier terminus to changes in mass balance, and con-sequently to changes in climate (e.g. Francou et al., 1995,2003, 2004; Wagnon et al., 1999). An increase of more than+4◦C at elevations above 4000 m a.s.l. is projected for the21st century using IPCC scenario A2 (Bradley et al., 2006;Urrutia and Vuille, 2009). With no change in precipitation,such a temperature change could lead to a major reductionin glacial coverage and even to the complete disappearanceof small glaciers, whose upper reaches are located close tothe current equilibrium-line altitude (ELA). This is a seriousconcern because a large proportion of the population livesin arid regions to the west of the Andes (especially in Peruand Bolivia, where the percentage of glaciers is the highest).As a consequence, the supply of water from high altitudeglacierized mountain chains is important for agricultural anddomestic consumption as well as for hydropower (Vergaraet al., 2007). This is all the more true since these regionsalso exhibit a combination of warm and dry conditions asa part of the seasonal cycle, with limited seasonal temper-ature variability and a dry season lasting from May/June toAugust/September (Kaser et al., 2010). As a consequence,mountain glaciers in the tropical Andes act as buffers againsthighly seasonal precipitation at times when rainfall is low oreven absent (Vuille et al., 2008a).
To better understand glaciological processes, to link cli-mate parameters and their variability to glacier mass bal-ance, and to document current glacier changes, permanentglacier monitoring networks have been set up in each coun-try between Colombia and Bolivia. The oldest data series areavailable in Peru, where partial surveillance of glaciers be-gan in the early 1970s. Since the early 1990s, an importanteffort has been made by IRD (the French Institute of Re-search and Development), in association with Andean part-ners in Bolivia, Ecuador and Peru, as well as other interna-tional scientific teams such as the University of Innsbruck(Austria), the Ohio State University (USA) and the Univer-sity of Zurich (Switzerland). The observation system mainlyconsists of measuring the glacier mass balance and surfaceenergy balance. In parallel, remote-sensing studies have beenperformed using aerial photographs and satellite images toreconstruct changes in the volume, surface area and lengthof a large number of glaciers in the area since the middle ofthe 20th century. In addition to this permanent monitoring,considerable effort has been made to reconstruct glacier fluc-tuations since the Little Ice Age (LIA) maximum across thetropical Andes (e.g. Rabatel et al., 2005a, 2008a; Jomelli etal., 2009).
The objective of this review is to provide the scientificcommunity with a comprehensive overview of studies per-formed on glaciers in the tropical Andes in recent decades,which will allow the current status of the glaciers to be deter-mined. These are important issues to estimate the future be-havior of glaciers and their impacts on the hydrological func-tioning of high-altitude glacierized watersheds in comingdecades. The main topics being reviewed are (1) the magni-tude of glacier changes since the LIA; (2) the glacier changessince the mid-20th century; (3) the mass balance observa-tions over the last two decades; and (4) the links of glacierchanges to local/regional climate at different timescales. Re-search questions addressed also include whether the glacialretreat of tropical glaciers in recent decades is unprecedentsince the LIA, and whether the glacial recession in the tropi-cal Andes is related to the observed increase in atmospherictemperature. Finally, this review brings a new perspective onthe nature of recent decadal glacier retreat, particularly onthe link between mass balance and maximum elevation andsize of the glaciers.
2 General settings and methodologies
2.1 Climate settings
From a climatological point of view, the tropical zone can bedivided into two zones with different characteristics. Troll(1941) distinguished the inner tropical climate with moreor less continuous precipitation throughout the year andthe outer tropical climate which, when subtropical condi-tions prevail, is characterized by a dry season from May
The Cryosphere, 7, 81–102, 2013 www.the-cryosphere.net/7/81/2013/
A. Rabatel et al.: Current state of glaciers in the tropical Andes 83
to September, and when tropical conditions prevail, by awet season from October to March. Here we consider thatColombia and Ecuador belong to the inner tropics and Peruand Bolivia to the outer tropics.
For both inner and outer tropics, the climate is charac-terized by homogeneous temperature conditions throughoutthe year with a slight seasonality of air temperature in theouter tropics (1◦ to 2◦C higher temperatures during the aus-tral wet summer in October to March than during the australdry winter in May to September). In the tropical zone, inci-dent solar radiation is also more or less constant throughoutthe year, as the seasonality of the extraterrestrial irradiance inthe outer tropics is attenuated by pronounced cloud season-ality (maximum cloud cover during austral summer). In theinner tropics, humidity remains almost unchanged through-out the year, whereas the outer tropics are characterized bypronounced seasonality of specific humidity, cloud cover andprecipitation. Thus, notable accumulation occurs in the outertropics only during the wet season (Kaser, 2001). Precipita-tion mainly results from an easterly flow of moisture fromthe Amazon Basin (e.g. Garreaud et al., 2003). At interan-nual timescales, the variability of precipitation has been de-scribed in many studies and there is general agreement thata significant fraction of this variability is related to the ElNino–Southern Oscillation (ENSO) phenomenon (e.g. Fran-cou and Pizarro, 1985; Aceituno, 1988; Vuille et al., 2000;Garreaud and Aceituno, 2001). These studies concluded thatEl Nino years (warm phase of ENSO) tend to be warm anddry, while La Nina years (ENSO cold phase) are associatedwith cold and wet conditions on the Altiplano. However, theclimate characteristics of La Nina/El Nino are not uniformacross the tropical Andes region. Even at the scale of a coun-try, the consequences of an El Nino event may vary consider-ably, for instance between the northern coast of Peru and thesouthern Peruvian Altiplano region.
With the aim of linking changes in glacier mass balancewith climate variability and atmospheric circulation at a re-gional to global scale, many recent studies have focused onvariables that are relevant for the glacier energy balance,such as temperature, precipitation, humidity and convectivecloud cover (Wagnon et al., 1999; Francou et al., 2003, 2004;Favier et al., 2004a; Sicart et al., 2005; Vuille et al., 2008b;Salzmann et al., 2012). A common theme in all these studiesis the significant role of the tropical Pacific sea surface tem-perature (SST) and the ENSO phenomenon in modulatingglacier mass balance at interannual timescales. Other stud-ies have focused on temperature evolution in the last decadesfrom NCEP/NCAR reanalysis (Kalnay et al., 1996). Bradleyet al. (2009) showed that this data set is feasible to representnear-surface temperature trends in the Andes. Nonethelessit should be kept in mind that reanalysis data consider free-tropospheric temperature based on a 2.5◦ resolution. Hence,actual temperature measurements on or near the glaciers, forexample on Zongo or Antisana glaciers, may show absolutetemperatures that are somewhat higher than reanalysis data.
However, reanalysis temperature data and surface tempera-tures are significantly correlated, as changes in temperatureare similar at the surface and in the adjacent free air (Hardyet al., 2003; Bradley et al., 2009).
2.2 Reconstruction of LIA glacier changes
In the early 1980s, Hastenrath (1981) and Clapperton (1983)had already mentioned that glaciers in the tropical Andeswere much larger during the LIA than today, but the dateof their maximum extent and the stages of their subse-quent retreat remained highly conjectural. Historical sourcesand mining settlements established in the colonial period(Broggi, 1945) indicate that glaciers advanced considerablyduring the 16th–19th centuries, then began to retreat after1860 AD in Peru (Ames and Francou, 1995) and Ecuador(Hastenrath, 1981). Some authors tried to date the LIA inthe tropical Andes using glacier evidence with14C dating(Gouze et al., 1986; Seltzer, 1992). In Bolivia, Gouze etal. (1986) suggested 670–280 cal yr BP as the interval dis-playing maximum ice extension. In Peru, on the basis of evi-dence found in the ice core retrieved on the Quelccaya icecap, Thompson et al. (1986) assumed that the LIA lastedfrom 1500 AD to 1900 AD. Lichenometry has also beenused to date very well preserved moraines on glacier fore-lands (see the maps of the Bolivian eastern cordillera byJordan (1991), where the main moraine stages are repre-sented). Muller (1985) applied this technique for relativedating in Bolivia, and Rodbell (1992) dated Peruvian LIAmoraines to the period 750–1900 AD, but without providinga detailed chronology of glacier fluctuations during the pe-riod. New detailed chronologies of glacier fluctuations dur-ing the LIA concerning the tropical Andes have been pro-posed in the past decade with systematic measurements ofRhizocarpon Geographicumsp. made on each moraine inseveral proglacial margins in Bolivia (Rabatel et al., 2005a,2008a), Peru (Solomina et al., 2007; Jomelli et al., 2008),and Ecuador (Jomelli et al., 2009). A new statistical approachwas developed to process data based on the extreme valuestheory, as the largest lichens measured for moraine datingare extreme values (Cooley et al., 2006; Naveau et al., 2007;Jomelli et al., 2010).
Glacier length, surface area and ELA for the LIA maxi-mum and the following moraine stages were reconstructedusing digital elevation models (DEM) on the basis of themoraines (Rabatel et al., 2006, 2008a; Jomelli et al., 2009).For five glaciers in Cerro Charquini Massif in Bolivia, Ra-batel et al. (2006) computed changes in volume between themost important moraine stages by reconstructing glacier hyp-sometry.
www.the-cryosphere.net/7/81/2013/ The Cryosphere, 7, 81–102, 2013
84 A. Rabatel et al.: Current state of glaciers in the tropical Andes
2.3 20th century observations: from field measurementsto remote-sensing studies
2.3.1 Pioneering studies
Unlike mid-latitude glaciers where continuous mass bal-ance series have been available for five to six decades, fieldmeasurements of mass balance in the tropical Andes werevery scarce before 1990. Data on glacier terminus fluctua-tions have been available for four glaciers in the PeruvianCordillera Blanca since the late 1940s, and since the late1970s, a few years of mass balance measurements for threeof them (Kaser et al., 1990; Ames and Francou, 1995; Has-tenrath and Ames, 1995a, b; Ames and Hastenrath, 1996).
2.3.2 Monitoring mass balance in the field
In 1991, a project by the French IRD and Bolivian partnersenabled instrumentation of two glaciers for full permanentmonitoring of their mass balance, hydrological balance, andsurface energy balance (Francou and Ribstein, 1995; Fran-cou et al., 1995). The same monitoring system was set upin Ecuador in 1994 (Francou et al., 2000), in Peru in 2003,and in Colombia starting in 2006 (Table 1 and Fig. 1). Thiscollaborative effort is now part of a permanent monitor-ing network called GLACIOCLIM (www-lgge.ujf-grenoble.fr/ServiceObs/index.htm), and a joint international projectcalled GREAT ICE, involving academic and research insti-tutions in France, Bolivia, Ecuador, Peru and Colombia. Inaddition, two of the glaciers that belong to this monitoringnetwork, Zongo in Bolivia and Antisana 15 in Ecuador, areamong the benchmark glaciers in the tropics referenced bythe World Glacier Monitoring Service (WGMS, 2011).
Glacier mass balance is computed using the glaciologi-cal method (Paterson, 1994). In the lower part of the glacier,monthly measurements (in Bolivia, Ecuador and Colombia)of stake emergence are made using a network of 10 to 25stakes (depending on the glacier). Snow height and densitymeasurements are required as well as stake emergence mea-surements because snowfall can occur at the glacier surfaceat any time during the year. In the upper part of the glacier,net accumulation (snow height and density) is measured atthe end of the hydrological year at two to four locations. Tocompute the annual mass balance of the glaciers, glacier hyp-sometry is calculated using a DEM computed by aerial pho-togrammetry (Bolivia and Ecuador) or using maps from theNational Geographical Institute (Peru, Colombia).
2.3.3 Surface energy balance: measurements andmodeling
Climate controls glacier mass balance through energy andmass fluxes at the ice or snow surface. The energy avail-able for melt can be calculated as the residual of the en-ergy balance equation, whose main terms on temperate trop-ical glaciers are short-wave and long-wave radiation fluxes
and the turbulent fluxes of sensible and latent heat. Radiationfluxes on glaciers can be accurately measured with radiome-ters, whereas turbulent fluxes are generally derived fromaerodynamic profile methods with one or two levels of wind,temperature and humidity measurements. These methods arenot very accurate and require parameters such as roughnesslengths or eddy diffusivity coefficients. Measurements of en-ergy fluxes on tropical glaciers began in the 1960s but arestill relatively rare (e.g. Platt, 1966; Hastenrath, 1978; Hardyet al., 1998). In 1995, automated weather stations began tobe used to monitor surface energy fluxes in the ablation areaof Zongo Glacier, in Bolivia, and Antisana 15 Glacier, inEcuador (Wagnon et al., 1999; Favier et al., 2004b).
The interpretation of point-scale energy flux measure-ments can lead to erroneous generalizations of melt charac-teristics when they are extrapolated to the whole glacier. Forexample, albedo is highly variable near the snow line, so thatthe contribution of solar radiation to melt energy depends onthe location of the weather station. A distributed energy bal-ance model is thus required to investigate the link betweenatmospheric forcing and the total glacier mass balance andto quantify the contribution of glacier melt to water resourcesdownstream. With the objective of investigating seasonal cli-mate forcing on the mass balance and meltwater discharge oftropical glaciers, Sicart et al. (2011) applied the spatially dis-tributed energy balance model of Hock and Holmgren (2005)to the Bolivian Zongo Glacier at an hourly time step for anentire hydrological year. The model calculates the surfaceenergy fluxes for each glacier grid cell from measurementscollected at a weather station located in the ablation area. Itis based on equations of mass and energy conservation, andthe parameters theoretically have a physical interpretation(Beven, 1989), so they can be linked to measurable physi-cal quantities. The model had to be adjusted to tropical highmountains mainly for the calculations of albedo, due to thefrequent alternation of melt and snowfall periods during thewet season, and of long-wave incoming radiation, due to thepronounced seasonality of sky emission.
2.3.4 Contribution of remote sensing
To complete glaciological data time series in terms ofchanges in surface area and volume before the beginning offield measurements, and to calculate these changes at a re-gional scale, remote-sensing techniques have proved to bevery efficient. Brecher and Thompson (1993) used terres-trial photogrammetry to quantify the retreat of Qori KalisGlacier (Quelccaya ice cap, Peru). Aerial photographs (avail-able since the 1950s) and satellite images (available sincethe late 1970s) have been widely used for glacier invento-ries (Jordan, 1991; Georges, 2004; Silverio and Jaquet, 2005;Jordan et al., 2005; Morris et al., 2006; Raup et al., 2007;Racoviteanu et al., 2007; Poveda and Pineda, 2009; UGRH,2010) and to quantify variations in glacier surface area at adecadal to interannual timescale since the mid-20th century
The Cryosphere, 7, 81–102, 2013 www.the-cryosphere.net/7/81/2013/
A. Rabatel et al.: Current state of glaciers in the tropical Andes 85
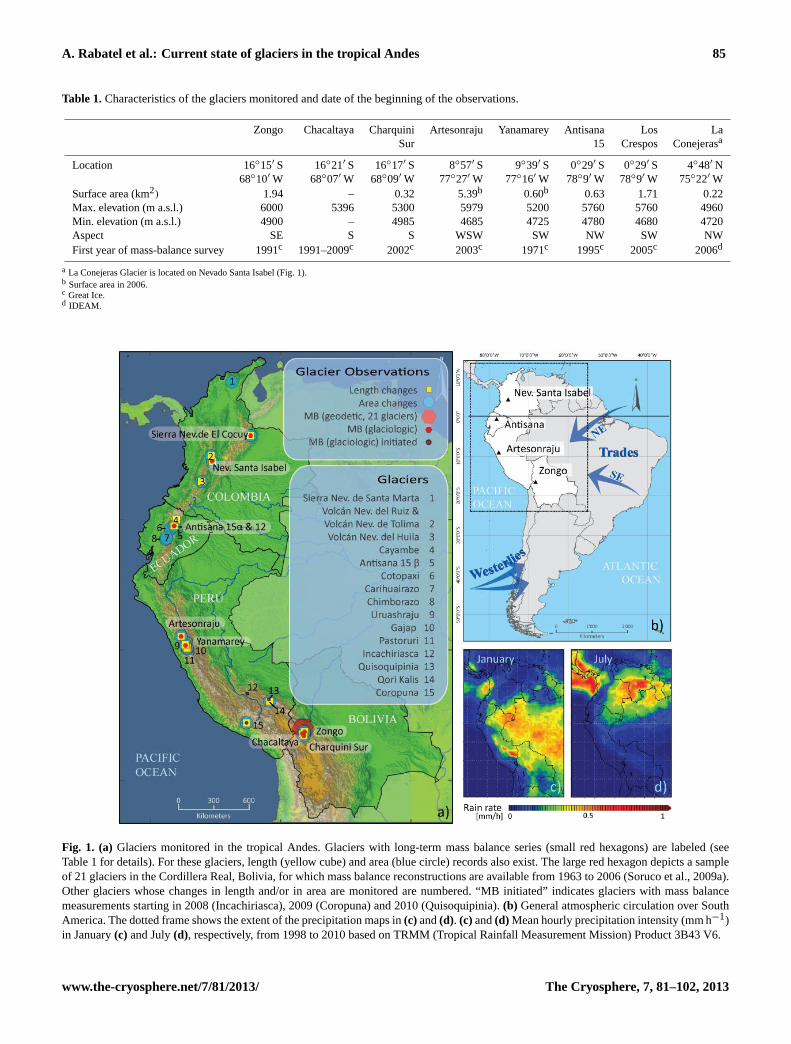
Table 1.Characteristics of the glaciers monitored and date of the beginning of the observations.
Zongo Chacaltaya Charquini Artesonraju Yanamarey Antisana Los LaSur 15 Crespos Conejerasa
Location 16◦15′ S 16◦21′ S 16◦17′ S 8◦57′ S 9◦39′ S 0◦29′ S 0◦29′ S 4◦48′ N68◦10′ W 68◦07′ W 68◦09′ W 77◦27′ W 77◦16′ W 78◦9′ W 78◦9′ W 75◦22′ W
Surface area (km2) 1.94 – 0.32 5.39b 0.60b 0.63 1.71 0.22Max. elevation (m a.s.l.) 6000 5396 5300 5979 5200 5760 5760 4960Min. elevation (m a.s.l.) 4900 – 4985 4685 4725 4780 4680 4720Aspect SE S S WSW SW NW SW NWFirst year of mass-balance survey 1991c 1991–2009c 2002c 2003c 1971c 1995c 2005c 2006d
a La Conejeras Glacier is located on Nevado Santa Isabel (Fig. 1).b Surface area in 2006.c Great Ice.d IDEAM.
52
Figure 1. a): Glaciers monitored in the tropical Andes. Glaciers with long-term mass balance series 1225
(small red hexagons) are labeled (see Table 1 for details). For these glaciers length (yellow cube) 1226
and area (blue circle) records also exist. The large red hexagon depicts a sample of 21 glaciers in 1227
the Cordillera Real, Bolivia, for which mass balance reconstructions are available from 1963 to 1228
2006 (Soruco et al., 2009a). Other glaciers whose changes in length and/or in area are monitored are 1229
numbered. ´MB initiated´ indicates glaciers with mass balance measurements starting in 2008 1230
(Incachiriasca), 2009 (Coropuna) and 2010 (Quisoquipinia). b): General atmospheric circulation 1231
over South America. The dotted frame shows the extent of the precipitation maps in figures 1c and 1232
d. c): and d): Mean hourly precipitation intensity (mm/h) in January (c) and July (d), respectively, 1233
from 1998 to 2010 based on TRMM (Tropical Rainfall Measurement Mission) Product 3B43 V6. 1234
1235
Fig. 1. (a) Glaciers monitored in the tropical Andes. Glaciers with long-term mass balance series (small red hexagons) are labeled (seeTable 1 for details). For these glaciers, length (yellow cube) and area (blue circle) records also exist. The large red hexagon depicts a sampleof 21 glaciers in the Cordillera Real, Bolivia, for which mass balance reconstructions are available from 1963 to 2006 (Soruco et al., 2009a).Other glaciers whose changes in length and/or in area are monitored are numbered. “MB initiated” indicates glaciers with mass balancemeasurements starting in 2008 (Incachiriasca), 2009 (Coropuna) and 2010 (Quisoquipinia).(b) General atmospheric circulation over SouthAmerica. The dotted frame shows the extent of the precipitation maps in(c) and(d). (c) and(d) Mean hourly precipitation intensity (mm h−1)in January(c) and July(d), respectively, from 1998 to 2010 based on TRMM (Tropical Rainfall Measurement Mission) Product 3B43 V6.
www.the-cryosphere.net/7/81/2013/ The Cryosphere, 7, 81–102, 2013
86 A. Rabatel et al.: Current state of glaciers in the tropical Andes
(Rabatel et al., 2006, 2011; Basantes, 2010; Caceres, 2010;Collet, 2010).
Variations in glacier volume at a decadal timescale sincethe mid-1950s were reconstructed for 26 glaciers in Bo-livia (Rabatel et al., 2006; Soruco et al., 2009a, b) and twoglaciers in Ecuador (Caceres, 2010) on the basis of aerialphotograph pairs processed using photogrammetric restitu-tion techniques. For three glaciers in the Cordillera Blanca,Peru, Mark and Seltzer (2005) assessed changes in vol-ume between 1962 and 1999 using similar photogrammet-ric techniques, while Salzmann et al. (2012) applied a com-bined remote-sensing data and modeling approach to esti-mate changes in volume in the Cordillera Vilcanota, south-ern Peru, for a similar period. This type of geodetic methodto compute volume variation over the whole glacier surfaceis very useful to validate and adjust mass balance data cal-culated using both glaciological and hydrological methods.Such an adjustment was performed for Zongo Glacier in Bo-livia by Soruco et al. (2009b).
Finally, Rabatel et al. (2012) showed that the method toreconstruct annual mass balance based on snow line altitude(SLA) measured on satellite images and used as a proxyof the ELA can be used for glaciers in the outer tropi-cal zone. This method was first developed for mid-latitudeglaciers (Rabatel et al., 2005b, 2008b), and was then success-fully tested, validated, and applied on 11 Bolivian glaciers(Bermejo, 2010; Consoli, 2011).
3 How did tropical glaciers change over time?From centennial to annual scale
3.1 Glacier changes since the LIA maximum
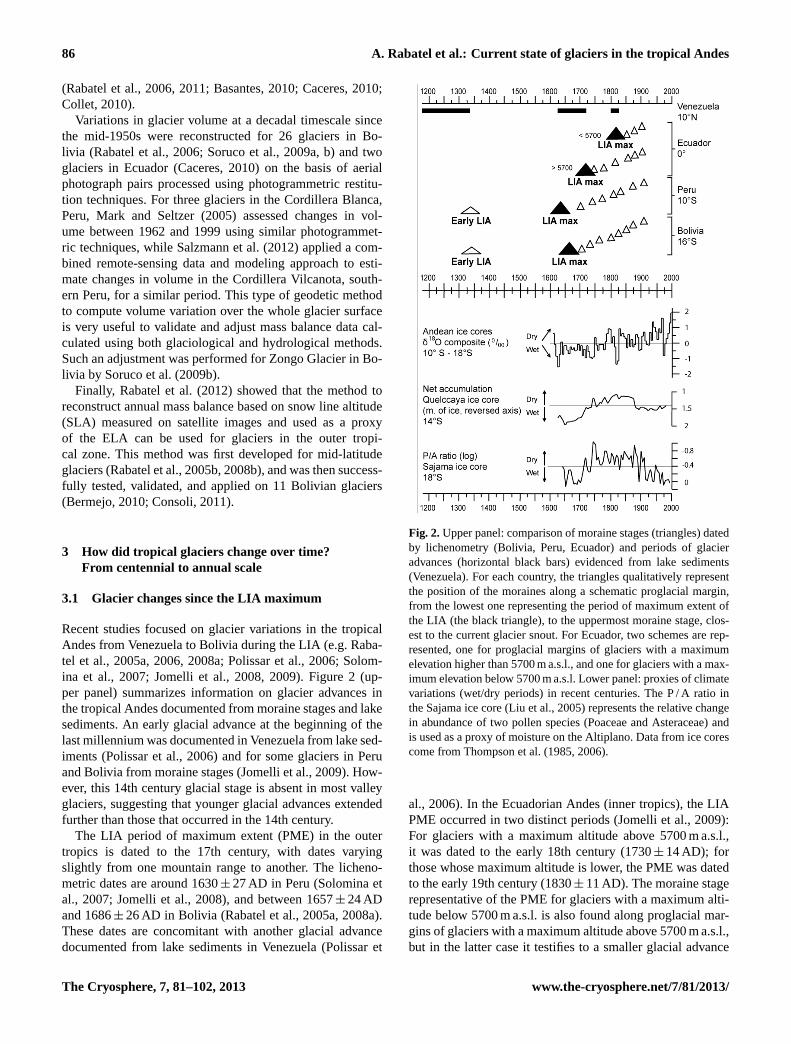
Recent studies focused on glacier variations in the tropicalAndes from Venezuela to Bolivia during the LIA (e.g. Raba-tel et al., 2005a, 2006, 2008a; Polissar et al., 2006; Solom-ina et al., 2007; Jomelli et al., 2008, 2009). Figure 2 (up-per panel) summarizes information on glacier advances inthe tropical Andes documented from moraine stages and lakesediments. An early glacial advance at the beginning of thelast millennium was documented in Venezuela from lake sed-iments (Polissar et al., 2006) and for some glaciers in Peruand Bolivia from moraine stages (Jomelli et al., 2009). How-ever, this 14th century glacial stage is absent in most valleyglaciers, suggesting that younger glacial advances extendedfurther than those that occurred in the 14th century.
The LIA period of maximum extent (PME) in the outertropics is dated to the 17th century, with dates varyingslightly from one mountain range to another. The licheno-metric dates are around 1630± 27 AD in Peru (Solomina etal., 2007; Jomelli et al., 2008), and between 1657± 24 ADand 1686± 26 AD in Bolivia (Rabatel et al., 2005a, 2008a).These dates are concomitant with another glacial advancedocumented from lake sediments in Venezuela (Polissar et
Fig. 2.Upper panel: comparison of moraine stages (triangles) datedby lichenometry (Bolivia, Peru, Ecuador) and periods of glacieradvances (horizontal black bars) evidenced from lake sediments(Venezuela). For each country, the triangles qualitatively representthe position of the moraines along a schematic proglacial margin,from the lowest one representing the period of maximum extent ofthe LIA (the black triangle), to the uppermost moraine stage, clos-est to the current glacier snout. For Ecuador, two schemes are rep-resented, one for proglacial margins of glaciers with a maximumelevation higher than 5700 m a.s.l., and one for glaciers with a max-imum elevation below 5700 m a.s.l. Lower panel: proxies of climatevariations (wet/dry periods) in recent centuries. The P / A ratio inthe Sajama ice core (Liu et al., 2005) represents the relative changein abundance of two pollen species (Poaceae and Asteraceae) andis used as a proxy of moisture on the Altiplano. Data from ice corescome from Thompson et al. (1985, 2006).
al., 2006). In the Ecuadorian Andes (inner tropics), the LIAPME occurred in two distinct periods (Jomelli et al., 2009):For glaciers with a maximum altitude above 5700 m a.s.l.,it was dated to the early 18th century (1730± 14 AD); forthose whose maximum altitude is lower, the PME was datedto the early 19th century (1830± 11 AD). The moraine stagerepresentative of the PME for glaciers with a maximum alti-tude below 5700 m a.s.l. is also found along proglacial mar-gins of glaciers with a maximum altitude above 5700 m a.s.l.,but in the latter case it testifies to a smaller glacial advance
The Cryosphere, 7, 81–102, 2013 www.the-cryosphere.net/7/81/2013/
A. Rabatel et al.: Current state of glaciers in the tropical Andes 87
than the one that occurred during the maximum extent. Theadvance dated from the early 19th century was also docu-mented from reliable historical sources in Ecuador (Fran-cou, 2004). Finally, the early 19th century advance was alsoconcomitant with an advance phase documented from lakesediments in Venezuela (Polissar et al., 2006). Jomelli etal. (2009) proposed that this difference in the timing of thePME in Ecuador between glaciers with a maximum altitudeabove/below 5700 m a.s.l. could be the result of a cold anddry period that would have followed a humid period. How-ever, this difference is not yet clearly understood.
Following the PME, the evolution of glaciers in the in-ner and outer tropics was remarkably homogeneous (Jomelliet al., 2009). A slow withdrawal occurred during the late18th and then during the first half of the 19th century. Inthe outer tropics, among the moraine stages observed alongthe proglacial margins, two are clearly the consequence ofan advancing glacier because they partly removed previ-ous deposits (Rabatel et al., 2008a); they are dated to about1730 AD and about 1800 AD. After 1840 AD, withdrawalwas more pronounced and accelerated in the late 19th cen-tury (from about 1870 to the early 20th century) in both innerand outer tropics (Jomelli et al., 2009).
The withdrawal following the LIA maximum extent andthe absence of a major readvance in the 19th century (equiva-lent to the magnitude of LIA maximum) in the entire tropicalbelt are the main differences from the evolution of glaciers intemperate latitudes of the Northern Hemisphere. In Bolivia,Rabatel et al. (2006) observed that glaciers retreated by about1000 m in length from the mid-17th to the late 19th century.
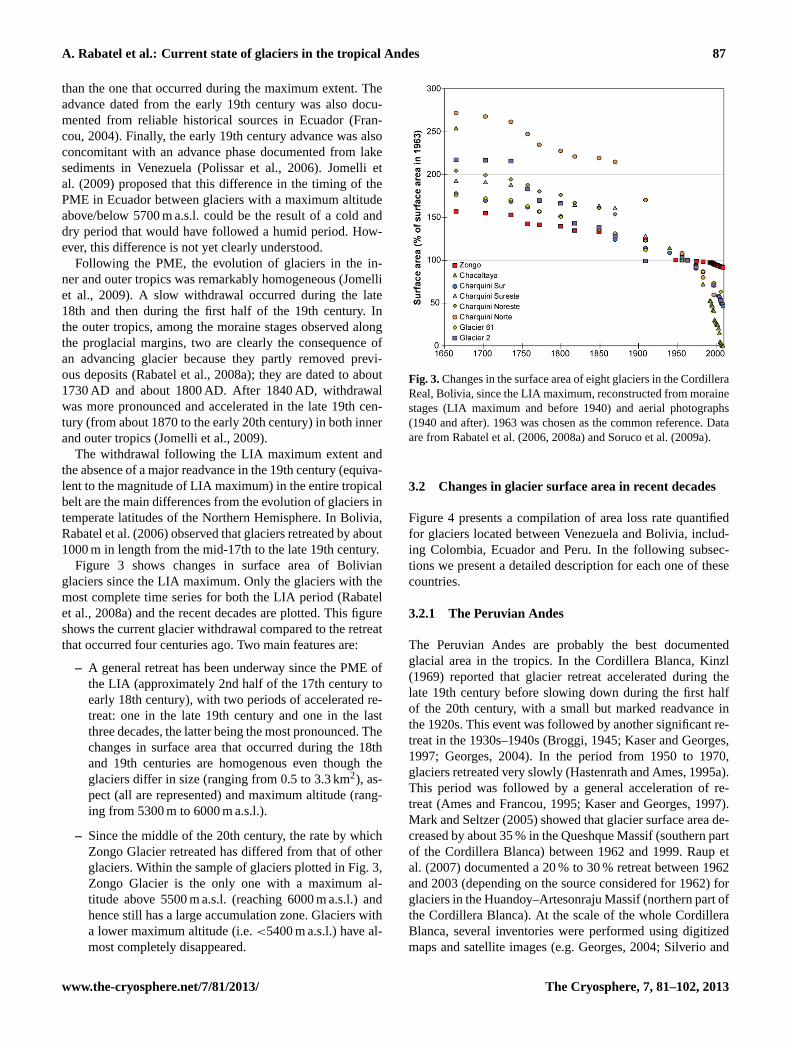
Figure 3 shows changes in surface area of Bolivianglaciers since the LIA maximum. Only the glaciers with themost complete time series for both the LIA period (Rabatelet al., 2008a) and the recent decades are plotted. This figureshows the current glacier withdrawal compared to the retreatthat occurred four centuries ago. Two main features are:
– A general retreat has been underway since the PME ofthe LIA (approximately 2nd half of the 17th century toearly 18th century), with two periods of accelerated re-treat: one in the late 19th century and one in the lastthree decades, the latter being the most pronounced. Thechanges in surface area that occurred during the 18thand 19th centuries are homogenous even though theglaciers differ in size (ranging from 0.5 to 3.3 km2), as-pect (all are represented) and maximum altitude (rang-ing from 5300 m to 6000 m a.s.l.).
– Since the middle of the 20th century, the rate by whichZongo Glacier retreated has differed from that of otherglaciers. Within the sample of glaciers plotted in Fig. 3,Zongo Glacier is the only one with a maximum al-titude above 5500 m a.s.l. (reaching 6000 m a.s.l.) andhence still has a large accumulation zone. Glaciers witha lower maximum altitude (i.e.<5400 m a.s.l.) have al-most completely disappeared.
Fig. 3.Changes in the surface area of eight glaciers in the CordilleraReal, Bolivia, since the LIA maximum, reconstructed from morainestages (LIA maximum and before 1940) and aerial photographs(1940 and after). 1963 was chosen as the common reference. Dataare from Rabatel et al. (2006, 2008a) and Soruco et al. (2009a).
3.2 Changes in glacier surface area in recent decades
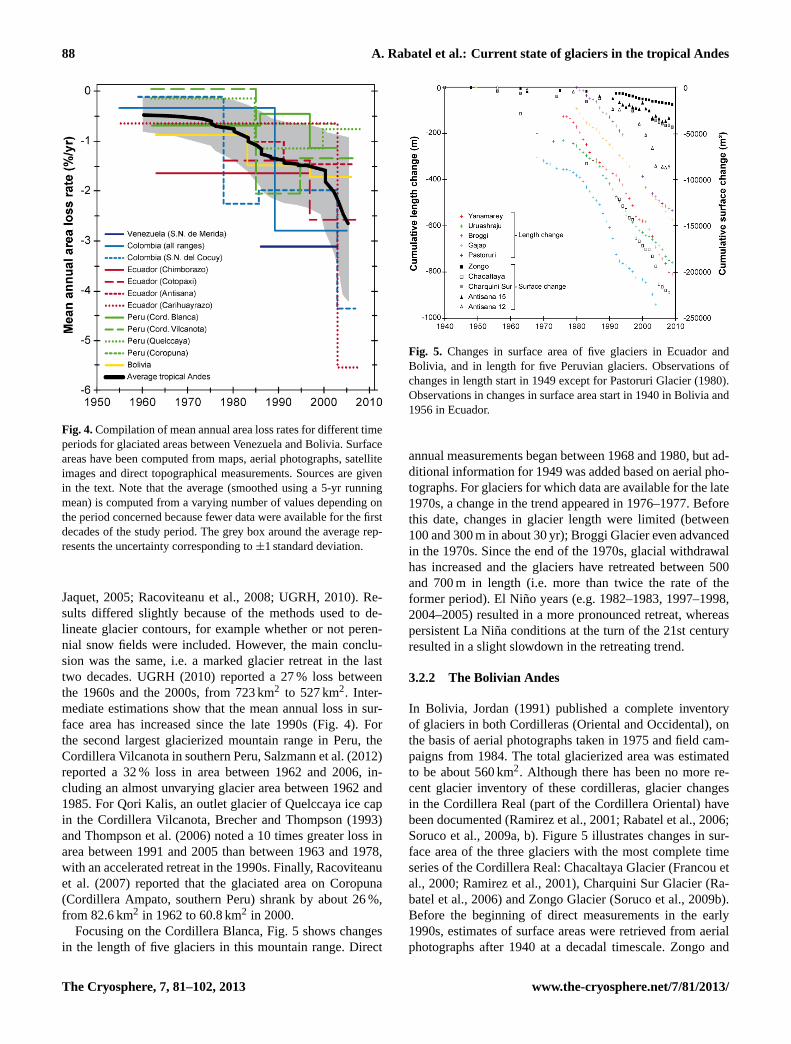
Figure 4 presents a compilation of area loss rate quantifiedfor glaciers located between Venezuela and Bolivia, includ-ing Colombia, Ecuador and Peru. In the following subsec-tions we present a detailed description for each one of thesecountries.
3.2.1 The Peruvian Andes
The Peruvian Andes are probably the best documentedglacial area in the tropics. In the Cordillera Blanca, Kinzl(1969) reported that glacier retreat accelerated during thelate 19th century before slowing down during the first halfof the 20th century, with a small but marked readvance inthe 1920s. This event was followed by another significant re-treat in the 1930s–1940s (Broggi, 1945; Kaser and Georges,1997; Georges, 2004). In the period from 1950 to 1970,glaciers retreated very slowly (Hastenrath and Ames, 1995a).This period was followed by a general acceleration of re-treat (Ames and Francou, 1995; Kaser and Georges, 1997).Mark and Seltzer (2005) showed that glacier surface area de-creased by about 35 % in the Queshque Massif (southern partof the Cordillera Blanca) between 1962 and 1999. Raup etal. (2007) documented a 20 % to 30 % retreat between 1962and 2003 (depending on the source considered for 1962) forglaciers in the Huandoy–Artesonraju Massif (northern part ofthe Cordillera Blanca). At the scale of the whole CordilleraBlanca, several inventories were performed using digitizedmaps and satellite images (e.g. Georges, 2004; Silverio and
www.the-cryosphere.net/7/81/2013/ The Cryosphere, 7, 81–102, 2013
88 A. Rabatel et al.: Current state of glaciers in the tropical Andes
Fig. 4.Compilation of mean annual area loss rates for different timeperiods for glaciated areas between Venezuela and Bolivia. Surfaceareas have been computed from maps, aerial photographs, satelliteimages and direct topographical measurements. Sources are givenin the text. Note that the average (smoothed using a 5-yr runningmean) is computed from a varying number of values depending onthe period concerned because fewer data were available for the firstdecades of the study period. The grey box around the average rep-resents the uncertainty corresponding to±1 standard deviation.
Jaquet, 2005; Racoviteanu et al., 2008; UGRH, 2010). Re-sults differed slightly because of the methods used to de-lineate glacier contours, for example whether or not peren-nial snow fields were included. However, the main conclu-sion was the same, i.e. a marked glacier retreat in the lasttwo decades. UGRH (2010) reported a 27 % loss betweenthe 1960s and the 2000s, from 723 km2 to 527 km2. Inter-mediate estimations show that the mean annual loss in sur-face area has increased since the late 1990s (Fig. 4). Forthe second largest glacierized mountain range in Peru, theCordillera Vilcanota in southern Peru, Salzmann et al. (2012)reported a 32 % loss in area between 1962 and 2006, in-cluding an almost unvarying glacier area between 1962 and1985. For Qori Kalis, an outlet glacier of Quelccaya ice capin the Cordillera Vilcanota, Brecher and Thompson (1993)and Thompson et al. (2006) noted a 10 times greater loss inarea between 1991 and 2005 than between 1963 and 1978,with an accelerated retreat in the 1990s. Finally, Racoviteanuet al. (2007) reported that the glaciated area on Coropuna(Cordillera Ampato, southern Peru) shrank by about 26 %,from 82.6 km2 in 1962 to 60.8 km2 in 2000.
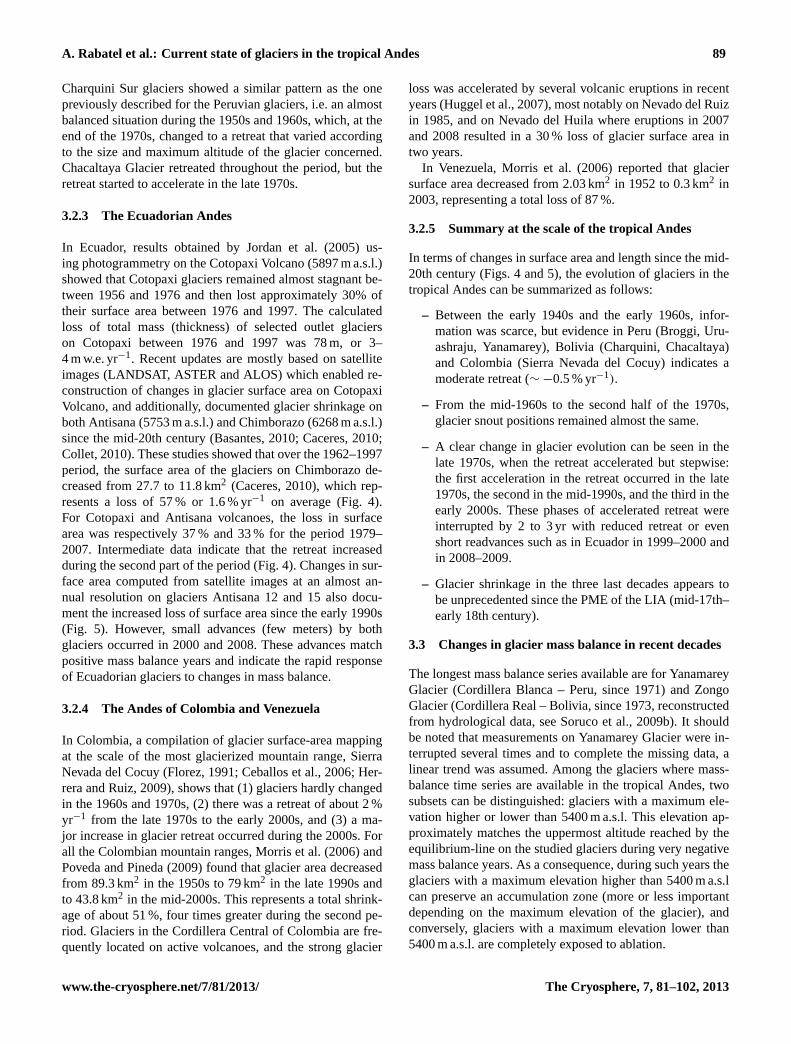
Focusing on the Cordillera Blanca, Fig. 5 shows changesin the length of five glaciers in this mountain range. Direct
Fig. 5. Changes in surface area of five glaciers in Ecuador andBolivia, and in length for five Peruvian glaciers. Observations ofchanges in length start in 1949 except for Pastoruri Glacier (1980).Observations in changes in surface area start in 1940 in Bolivia and1956 in Ecuador.
annual measurements began between 1968 and 1980, but ad-ditional information for 1949 was added based on aerial pho-tographs. For glaciers for which data are available for the late1970s, a change in the trend appeared in 1976–1977. Beforethis date, changes in glacier length were limited (between100 and 300 m in about 30 yr); Broggi Glacier even advancedin the 1970s. Since the end of the 1970s, glacial withdrawalhas increased and the glaciers have retreated between 500and 700 m in length (i.e. more than twice the rate of theformer period). El Nino years (e.g. 1982–1983, 1997–1998,2004–2005) resulted in a more pronounced retreat, whereaspersistent La Nina conditions at the turn of the 21st centuryresulted in a slight slowdown in the retreating trend.
3.2.2 The Bolivian Andes
In Bolivia, Jordan (1991) published a complete inventoryof glaciers in both Cordilleras (Oriental and Occidental), onthe basis of aerial photographs taken in 1975 and field cam-paigns from 1984. The total glacierized area was estimatedto be about 560 km2. Although there has been no more re-cent glacier inventory of these cordilleras, glacier changesin the Cordillera Real (part of the Cordillera Oriental) havebeen documented (Ramirez et al., 2001; Rabatel et al., 2006;Soruco et al., 2009a, b). Figure 5 illustrates changes in sur-face area of the three glaciers with the most complete timeseries of the Cordillera Real: Chacaltaya Glacier (Francou etal., 2000; Ramirez et al., 2001), Charquini Sur Glacier (Ra-batel et al., 2006) and Zongo Glacier (Soruco et al., 2009b).Before the beginning of direct measurements in the early1990s, estimates of surface areas were retrieved from aerialphotographs after 1940 at a decadal timescale. Zongo and
The Cryosphere, 7, 81–102, 2013 www.the-cryosphere.net/7/81/2013/
A. Rabatel et al.: Current state of glaciers in the tropical Andes 89
Charquini Sur glaciers showed a similar pattern as the onepreviously described for the Peruvian glaciers, i.e. an almostbalanced situation during the 1950s and 1960s, which, at theend of the 1970s, changed to a retreat that varied accordingto the size and maximum altitude of the glacier concerned.Chacaltaya Glacier retreated throughout the period, but theretreat started to accelerate in the late 1970s.
3.2.3 The Ecuadorian Andes
In Ecuador, results obtained by Jordan et al. (2005) us-ing photogrammetry on the Cotopaxi Volcano (5897 m a.s.l.)showed that Cotopaxi glaciers remained almost stagnant be-tween 1956 and 1976 and then lost approximately 30% oftheir surface area between 1976 and 1997. The calculatedloss of total mass (thickness) of selected outlet glacierson Cotopaxi between 1976 and 1997 was 78 m, or 3–4 m w.e. yr−1. Recent updates are mostly based on satelliteimages (LANDSAT, ASTER and ALOS) which enabled re-construction of changes in glacier surface area on CotopaxiVolcano, and additionally, documented glacier shrinkage onboth Antisana (5753 m a.s.l.) and Chimborazo (6268 m a.s.l.)since the mid-20th century (Basantes, 2010; Caceres, 2010;Collet, 2010). These studies showed that over the 1962–1997period, the surface area of the glaciers on Chimborazo de-creased from 27.7 to 11.8 km2 (Caceres, 2010), which rep-resents a loss of 57 % or 1.6 % yr−1 on average (Fig. 4).For Cotopaxi and Antisana volcanoes, the loss in surfacearea was respectively 37 % and 33 % for the period 1979–2007. Intermediate data indicate that the retreat increasedduring the second part of the period (Fig. 4). Changes in sur-face area computed from satellite images at an almost an-nual resolution on glaciers Antisana 12 and 15 also docu-ment the increased loss of surface area since the early 1990s(Fig. 5). However, small advances (few meters) by bothglaciers occurred in 2000 and 2008. These advances matchpositive mass balance years and indicate the rapid responseof Ecuadorian glaciers to changes in mass balance.
3.2.4 The Andes of Colombia and Venezuela
In Colombia, a compilation of glacier surface-area mappingat the scale of the most glacierized mountain range, SierraNevada del Cocuy (Florez, 1991; Ceballos et al., 2006; Her-rera and Ruiz, 2009), shows that (1) glaciers hardly changedin the 1960s and 1970s, (2) there was a retreat of about 2 %yr−1 from the late 1970s to the early 2000s, and (3) a ma-jor increase in glacier retreat occurred during the 2000s. Forall the Colombian mountain ranges, Morris et al. (2006) andPoveda and Pineda (2009) found that glacier area decreasedfrom 89.3 km2 in the 1950s to 79 km2 in the late 1990s andto 43.8 km2 in the mid-2000s. This represents a total shrink-age of about 51 %, four times greater during the second pe-riod. Glaciers in the Cordillera Central of Colombia are fre-quently located on active volcanoes, and the strong glacier
loss was accelerated by several volcanic eruptions in recentyears (Huggel et al., 2007), most notably on Nevado del Ruizin 1985, and on Nevado del Huila where eruptions in 2007and 2008 resulted in a 30 % loss of glacier surface area intwo years.
In Venezuela, Morris et al. (2006) reported that glaciersurface area decreased from 2.03 km2 in 1952 to 0.3 km2 in2003, representing a total loss of 87 %.
3.2.5 Summary at the scale of the tropical Andes
In terms of changes in surface area and length since the mid-20th century (Figs. 4 and 5), the evolution of glaciers in thetropical Andes can be summarized as follows:
– Between the early 1940s and the early 1960s, infor-mation was scarce, but evidence in Peru (Broggi, Uru-ashraju, Yanamarey), Bolivia (Charquini, Chacaltaya)and Colombia (Sierra Nevada del Cocuy) indicates amoderate retreat (∼ −0.5 % yr−1).
– From the mid-1960s to the second half of the 1970s,glacier snout positions remained almost the same.
– A clear change in glacier evolution can be seen in thelate 1970s, when the retreat accelerated but stepwise:the first acceleration in the retreat occurred in the late1970s, the second in the mid-1990s, and the third in theearly 2000s. These phases of accelerated retreat wereinterrupted by 2 to 3 yr with reduced retreat or evenshort readvances such as in Ecuador in 1999–2000 andin 2008–2009.
– Glacier shrinkage in the three last decades appears tobe unprecedented since the PME of the LIA (mid-17th–early 18th century).
3.3 Changes in glacier mass balance in recent decades
The longest mass balance series available are for YanamareyGlacier (Cordillera Blanca – Peru, since 1971) and ZongoGlacier (Cordillera Real – Bolivia, since 1973, reconstructedfrom hydrological data, see Soruco et al., 2009b). It shouldbe noted that measurements on Yanamarey Glacier were in-terrupted several times and to complete the missing data, alinear trend was assumed. Among the glaciers where mass-balance time series are available in the tropical Andes, twosubsets can be distinguished: glaciers with a maximum ele-vation higher or lower than 5400 m a.s.l. This elevation ap-proximately matches the uppermost altitude reached by theequilibrium-line on the studied glaciers during very negativemass balance years. As a consequence, during such years theglaciers with a maximum elevation higher than 5400 m a.s.lcan preserve an accumulation zone (more or less importantdepending on the maximum elevation of the glacier), andconversely, glaciers with a maximum elevation lower than5400 m a.s.l. are completely exposed to ablation.
www.the-cryosphere.net/7/81/2013/ The Cryosphere, 7, 81–102, 2013
90 A. Rabatel et al.: Current state of glaciers in the tropical Andes
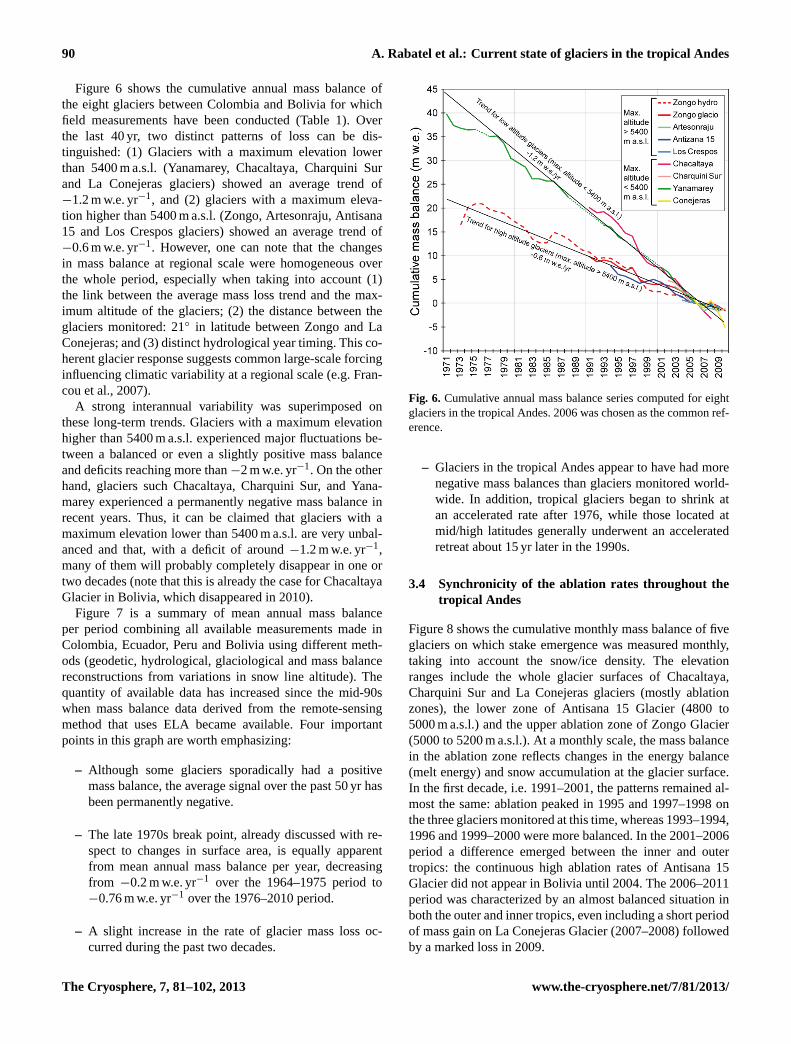
Figure 6 shows the cumulative annual mass balance ofthe eight glaciers between Colombia and Bolivia for whichfield measurements have been conducted (Table 1). Overthe last 40 yr, two distinct patterns of loss can be dis-tinguished: (1) Glaciers with a maximum elevation lowerthan 5400 m a.s.l. (Yanamarey, Chacaltaya, Charquini Surand La Conejeras glaciers) showed an average trend of−1.2 m w.e. yr−1, and (2) glaciers with a maximum eleva-tion higher than 5400 m a.s.l. (Zongo, Artesonraju, Antisana15 and Los Crespos glaciers) showed an average trend of−0.6 m w.e. yr−1. However, one can note that the changesin mass balance at regional scale were homogeneous overthe whole period, especially when taking into account (1)the link between the average mass loss trend and the max-imum altitude of the glaciers; (2) the distance between theglaciers monitored: 21◦ in latitude between Zongo and LaConejeras; and (3) distinct hydrological year timing. This co-herent glacier response suggests common large-scale forcinginfluencing climatic variability at a regional scale (e.g. Fran-cou et al., 2007).
A strong interannual variability was superimposed onthese long-term trends. Glaciers with a maximum elevationhigher than 5400 m a.s.l. experienced major fluctuations be-tween a balanced or even a slightly positive mass balanceand deficits reaching more than−2 m w.e. yr−1. On the otherhand, glaciers such Chacaltaya, Charquini Sur, and Yana-marey experienced a permanently negative mass balance inrecent years. Thus, it can be claimed that glaciers with amaximum elevation lower than 5400 m a.s.l. are very unbal-anced and that, with a deficit of around−1.2 m w.e. yr−1,many of them will probably completely disappear in one ortwo decades (note that this is already the case for ChacaltayaGlacier in Bolivia, which disappeared in 2010).
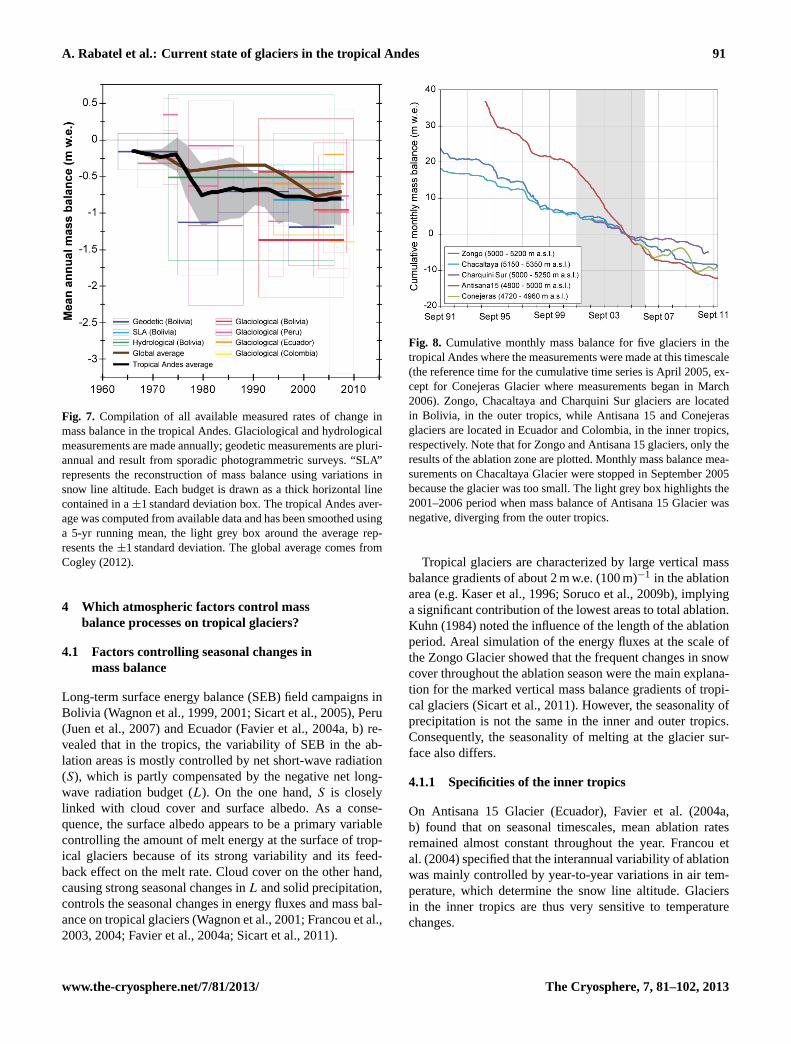
Figure 7 is a summary of mean annual mass balanceper period combining all available measurements made inColombia, Ecuador, Peru and Bolivia using different meth-ods (geodetic, hydrological, glaciological and mass balancereconstructions from variations in snow line altitude). Thequantity of available data has increased since the mid-90swhen mass balance data derived from the remote-sensingmethod that uses ELA became available. Four importantpoints in this graph are worth emphasizing:
– Although some glaciers sporadically had a positivemass balance, the average signal over the past 50 yr hasbeen permanently negative.
– The late 1970s break point, already discussed with re-spect to changes in surface area, is equally apparentfrom mean annual mass balance per year, decreasingfrom −0.2 m w.e. yr−1 over the 1964–1975 period to−0.76 m w.e. yr−1 over the 1976–2010 period.
– A slight increase in the rate of glacier mass loss oc-curred during the past two decades.
Fig. 6. Cumulative annual mass balance series computed for eightglaciers in the tropical Andes. 2006 was chosen as the common ref-erence.
– Glaciers in the tropical Andes appear to have had morenegative mass balances than glaciers monitored world-wide. In addition, tropical glaciers began to shrink atan accelerated rate after 1976, while those located atmid/high latitudes generally underwent an acceleratedretreat about 15 yr later in the 1990s.
3.4 Synchronicity of the ablation rates throughout thetropical Andes
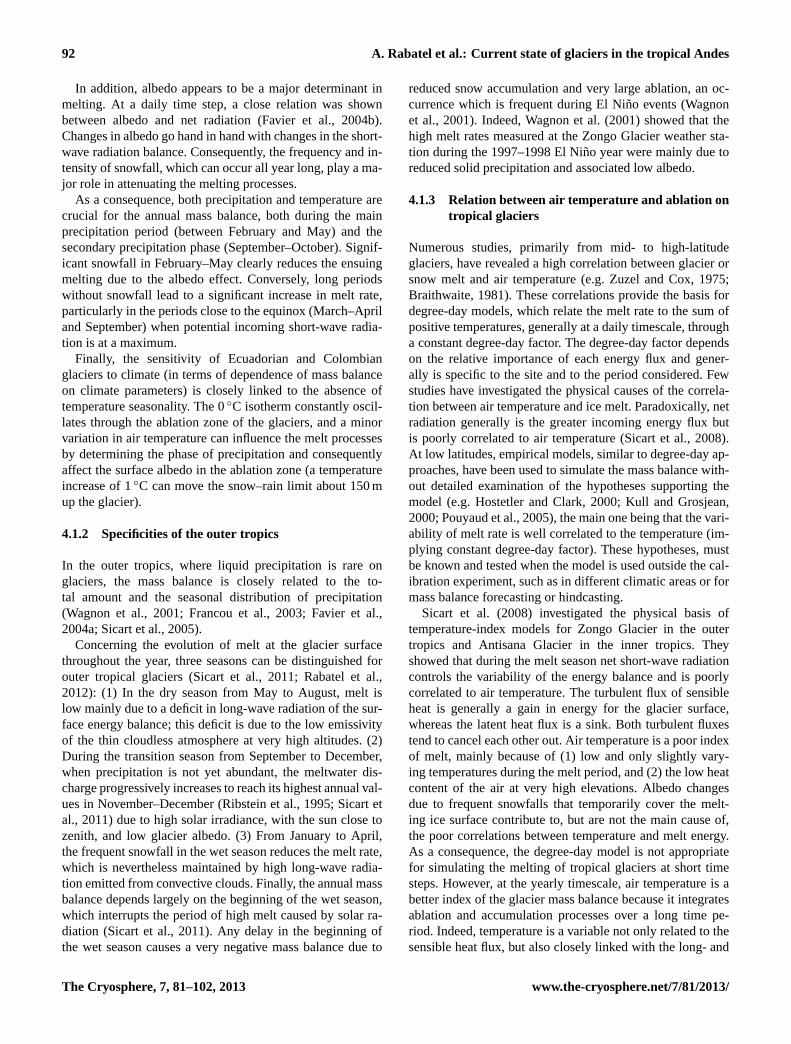
Figure 8 shows the cumulative monthly mass balance of fiveglaciers on which stake emergence was measured monthly,taking into account the snow/ice density. The elevationranges include the whole glacier surfaces of Chacaltaya,Charquini Sur and La Conejeras glaciers (mostly ablationzones), the lower zone of Antisana 15 Glacier (4800 to5000 m a.s.l.) and the upper ablation zone of Zongo Glacier(5000 to 5200 m a.s.l.). At a monthly scale, the mass balancein the ablation zone reflects changes in the energy balance(melt energy) and snow accumulation at the glacier surface.In the first decade, i.e. 1991–2001, the patterns remained al-most the same: ablation peaked in 1995 and 1997–1998 onthe three glaciers monitored at this time, whereas 1993–1994,1996 and 1999–2000 were more balanced. In the 2001–2006period a difference emerged between the inner and outertropics: the continuous high ablation rates of Antisana 15Glacier did not appear in Bolivia until 2004. The 2006–2011period was characterized by an almost balanced situation inboth the outer and inner tropics, even including a short periodof mass gain on La Conejeras Glacier (2007–2008) followedby a marked loss in 2009.
The Cryosphere, 7, 81–102, 2013 www.the-cryosphere.net/7/81/2013/
A. Rabatel et al.: Current state of glaciers in the tropical Andes 91
Fig. 7. Compilation of all available measured rates of change inmass balance in the tropical Andes. Glaciological and hydrologicalmeasurements are made annually; geodetic measurements are pluri-annual and result from sporadic photogrammetric surveys. “SLA”represents the reconstruction of mass balance using variations insnow line altitude. Each budget is drawn as a thick horizontal linecontained in a±1 standard deviation box. The tropical Andes aver-age was computed from available data and has been smoothed usinga 5-yr running mean, the light grey box around the average rep-resents the±1 standard deviation. The global average comes fromCogley (2012).
4 Which atmospheric factors control massbalance processes on tropical glaciers?
4.1 Factors controlling seasonal changes inmass balance
Long-term surface energy balance (SEB) field campaigns inBolivia (Wagnon et al., 1999, 2001; Sicart et al., 2005), Peru(Juen et al., 2007) and Ecuador (Favier et al., 2004a, b) re-vealed that in the tropics, the variability of SEB in the ab-lation areas is mostly controlled by net short-wave radiation(S), which is partly compensated by the negative net long-wave radiation budget (L). On the one hand,S is closelylinked with cloud cover and surface albedo. As a conse-quence, the surface albedo appears to be a primary variablecontrolling the amount of melt energy at the surface of trop-ical glaciers because of its strong variability and its feed-back effect on the melt rate. Cloud cover on the other hand,causing strong seasonal changes inL and solid precipitation,controls the seasonal changes in energy fluxes and mass bal-ance on tropical glaciers (Wagnon et al., 2001; Francou et al.,2003, 2004; Favier et al., 2004a; Sicart et al., 2011).
Fig. 8. Cumulative monthly mass balance for five glaciers in thetropical Andes where the measurements were made at this timescale(the reference time for the cumulative time series is April 2005, ex-cept for Conejeras Glacier where measurements began in March2006). Zongo, Chacaltaya and Charquini Sur glaciers are locatedin Bolivia, in the outer tropics, while Antisana 15 and Conejerasglaciers are located in Ecuador and Colombia, in the inner tropics,respectively. Note that for Zongo and Antisana 15 glaciers, only theresults of the ablation zone are plotted. Monthly mass balance mea-surements on Chacaltaya Glacier were stopped in September 2005because the glacier was too small. The light grey box highlights the2001–2006 period when mass balance of Antisana 15 Glacier wasnegative, diverging from the outer tropics.
Tropical glaciers are characterized by large vertical massbalance gradients of about 2 m w.e. (100 m)−1 in the ablationarea (e.g. Kaser et al., 1996; Soruco et al., 2009b), implyinga significant contribution of the lowest areas to total ablation.Kuhn (1984) noted the influence of the length of the ablationperiod. Areal simulation of the energy fluxes at the scale ofthe Zongo Glacier showed that the frequent changes in snowcover throughout the ablation season were the main explana-tion for the marked vertical mass balance gradients of tropi-cal glaciers (Sicart et al., 2011). However, the seasonality ofprecipitation is not the same in the inner and outer tropics.Consequently, the seasonality of melting at the glacier sur-face also differs.
4.1.1 Specificities of the inner tropics
On Antisana 15 Glacier (Ecuador), Favier et al. (2004a,b) found that on seasonal timescales, mean ablation ratesremained almost constant throughout the year. Francou etal. (2004) specified that the interannual variability of ablationwas mainly controlled by year-to-year variations in air tem-perature, which determine the snow line altitude. Glaciersin the inner tropics are thus very sensitive to temperaturechanges.
www.the-cryosphere.net/7/81/2013/ The Cryosphere, 7, 81–102, 2013
92 A. Rabatel et al.: Current state of glaciers in the tropical Andes
In addition, albedo appears to be a major determinant inmelting. At a daily time step, a close relation was shownbetween albedo and net radiation (Favier et al., 2004b).Changes in albedo go hand in hand with changes in the short-wave radiation balance. Consequently, the frequency and in-tensity of snowfall, which can occur all year long, play a ma-jor role in attenuating the melting processes.
As a consequence, both precipitation and temperature arecrucial for the annual mass balance, both during the mainprecipitation period (between February and May) and thesecondary precipitation phase (September–October). Signif-icant snowfall in February–May clearly reduces the ensuingmelting due to the albedo effect. Conversely, long periodswithout snowfall lead to a significant increase in melt rate,particularly in the periods close to the equinox (March–Apriland September) when potential incoming short-wave radia-tion is at a maximum.
Finally, the sensitivity of Ecuadorian and Colombianglaciers to climate (in terms of dependence of mass balanceon climate parameters) is closely linked to the absence oftemperature seasonality. The 0◦C isotherm constantly oscil-lates through the ablation zone of the glaciers, and a minorvariation in air temperature can influence the melt processesby determining the phase of precipitation and consequentlyaffect the surface albedo in the ablation zone (a temperatureincrease of 1◦C can move the snow–rain limit about 150 mup the glacier).
4.1.2 Specificities of the outer tropics
In the outer tropics, where liquid precipitation is rare onglaciers, the mass balance is closely related to the to-tal amount and the seasonal distribution of precipitation(Wagnon et al., 2001; Francou et al., 2003; Favier et al.,2004a; Sicart et al., 2005).
Concerning the evolution of melt at the glacier surfacethroughout the year, three seasons can be distinguished forouter tropical glaciers (Sicart et al., 2011; Rabatel et al.,2012): (1) In the dry season from May to August, melt islow mainly due to a deficit in long-wave radiation of the sur-face energy balance; this deficit is due to the low emissivityof the thin cloudless atmosphere at very high altitudes. (2)During the transition season from September to December,when precipitation is not yet abundant, the meltwater dis-charge progressively increases to reach its highest annual val-ues in November–December (Ribstein et al., 1995; Sicart etal., 2011) due to high solar irradiance, with the sun close tozenith, and low glacier albedo. (3) From January to April,the frequent snowfall in the wet season reduces the melt rate,which is nevertheless maintained by high long-wave radia-tion emitted from convective clouds. Finally, the annual massbalance depends largely on the beginning of the wet season,which interrupts the period of high melt caused by solar ra-diation (Sicart et al., 2011). Any delay in the beginning ofthe wet season causes a very negative mass balance due to
reduced snow accumulation and very large ablation, an oc-currence which is frequent during El Nino events (Wagnonet al., 2001). Indeed, Wagnon et al. (2001) showed that thehigh melt rates measured at the Zongo Glacier weather sta-tion during the 1997–1998 El Nino year were mainly due toreduced solid precipitation and associated low albedo.
4.1.3 Relation between air temperature and ablation ontropical glaciers
Numerous studies, primarily from mid- to high-latitudeglaciers, have revealed a high correlation between glacier orsnow melt and air temperature (e.g. Zuzel and Cox, 1975;Braithwaite, 1981). These correlations provide the basis fordegree-day models, which relate the melt rate to the sum ofpositive temperatures, generally at a daily timescale, througha constant degree-day factor. The degree-day factor dependson the relative importance of each energy flux and gener-ally is specific to the site and to the period considered. Fewstudies have investigated the physical causes of the correla-tion between air temperature and ice melt. Paradoxically, netradiation generally is the greater incoming energy flux butis poorly correlated to air temperature (Sicart et al., 2008).At low latitudes, empirical models, similar to degree-day ap-proaches, have been used to simulate the mass balance with-out detailed examination of the hypotheses supporting themodel (e.g. Hostetler and Clark, 2000; Kull and Grosjean,2000; Pouyaud et al., 2005), the main one being that the vari-ability of melt rate is well correlated to the temperature (im-plying constant degree-day factor). These hypotheses, mustbe known and tested when the model is used outside the cal-ibration experiment, such as in different climatic areas or formass balance forecasting or hindcasting.
Sicart et al. (2008) investigated the physical basis oftemperature-index models for Zongo Glacier in the outertropics and Antisana Glacier in the inner tropics. Theyshowed that during the melt season net short-wave radiationcontrols the variability of the energy balance and is poorlycorrelated to air temperature. The turbulent flux of sensibleheat is generally a gain in energy for the glacier surface,whereas the latent heat flux is a sink. Both turbulent fluxestend to cancel each other out. Air temperature is a poor indexof melt, mainly because of (1) low and only slightly vary-ing temperatures during the melt period, and (2) the low heatcontent of the air at very high elevations. Albedo changesdue to frequent snowfalls that temporarily cover the melt-ing ice surface contribute to, but are not the main cause of,the poor correlations between temperature and melt energy.As a consequence, the degree-day model is not appropriatefor simulating the melting of tropical glaciers at short timesteps. However, at the yearly timescale, air temperature is abetter index of the glacier mass balance because it integratesablation and accumulation processes over a long time pe-riod. Indeed, temperature is a variable not only related to thesensible heat flux, but also closely linked with the long- and
The Cryosphere, 7, 81–102, 2013 www.the-cryosphere.net/7/81/2013/
A. Rabatel et al.: Current state of glaciers in the tropical Andes 93
short-wave radiation balance through the phase of precipita-tion which controls the albedo.
4.2 Regional forcing of the mass balance interannualvariability: the Pacific Ocean
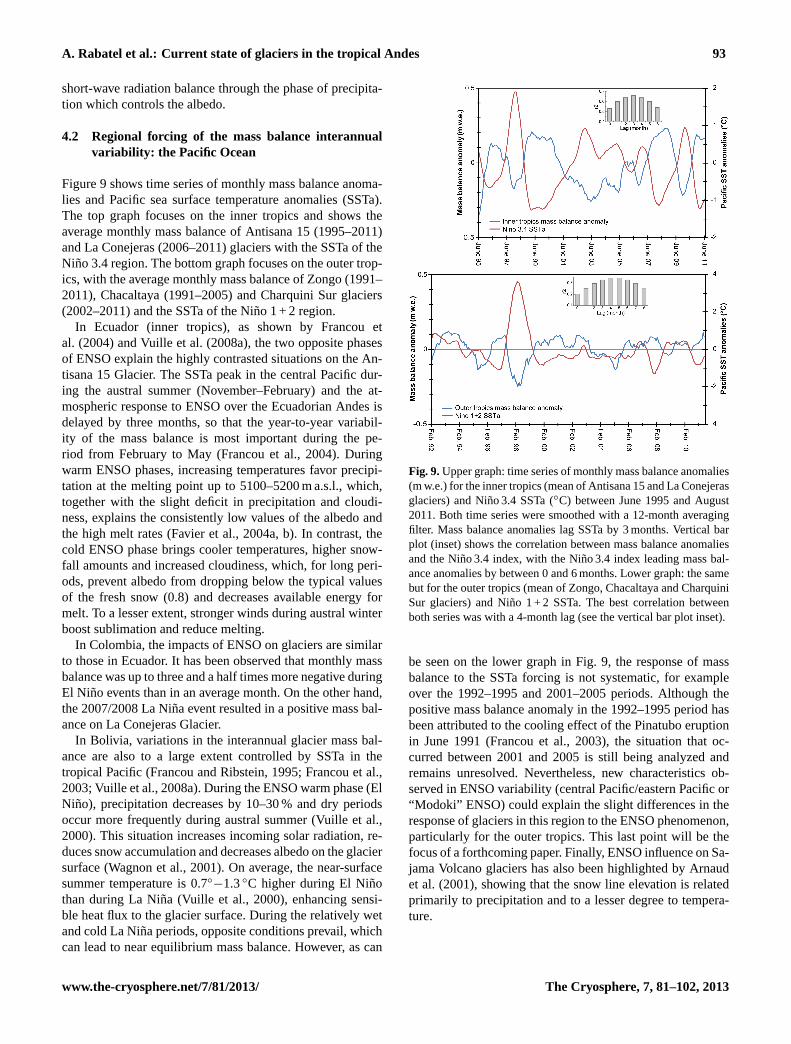
Figure 9 shows time series of monthly mass balance anoma-lies and Pacific sea surface temperature anomalies (SSTa).The top graph focuses on the inner tropics and shows theaverage monthly mass balance of Antisana 15 (1995–2011)and La Conejeras (2006–2011) glaciers with the SSTa of theNino 3.4 region. The bottom graph focuses on the outer trop-ics, with the average monthly mass balance of Zongo (1991–2011), Chacaltaya (1991–2005) and Charquini Sur glaciers(2002–2011) and the SSTa of the Nino 1 + 2 region.
In Ecuador (inner tropics), as shown by Francou etal. (2004) and Vuille et al. (2008a), the two opposite phasesof ENSO explain the highly contrasted situations on the An-tisana 15 Glacier. The SSTa peak in the central Pacific dur-ing the austral summer (November–February) and the at-mospheric response to ENSO over the Ecuadorian Andes isdelayed by three months, so that the year-to-year variabil-ity of the mass balance is most important during the pe-riod from February to May (Francou et al., 2004). Duringwarm ENSO phases, increasing temperatures favor precipi-tation at the melting point up to 5100–5200 m a.s.l., which,together with the slight deficit in precipitation and cloudi-ness, explains the consistently low values of the albedo andthe high melt rates (Favier et al., 2004a, b). In contrast, thecold ENSO phase brings cooler temperatures, higher snow-fall amounts and increased cloudiness, which, for long peri-ods, prevent albedo from dropping below the typical valuesof the fresh snow (0.8) and decreases available energy formelt. To a lesser extent, stronger winds during austral winterboost sublimation and reduce melting.
In Colombia, the impacts of ENSO on glaciers are similarto those in Ecuador. It has been observed that monthly massbalance was up to three and a half times more negative duringEl Nino events than in an average month. On the other hand,the 2007/2008 La Nina event resulted in a positive mass bal-ance on La Conejeras Glacier.
In Bolivia, variations in the interannual glacier mass bal-ance are also to a large extent controlled by SSTa in thetropical Pacific (Francou and Ribstein, 1995; Francou et al.,2003; Vuille et al., 2008a). During the ENSO warm phase (ElNino), precipitation decreases by 10–30 % and dry periodsoccur more frequently during austral summer (Vuille et al.,2000). This situation increases incoming solar radiation, re-duces snow accumulation and decreases albedo on the glaciersurface (Wagnon et al., 2001). On average, the near-surfacesummer temperature is 0.7◦
−1.3◦C higher during El Ninothan during La Nina (Vuille et al., 2000), enhancing sensi-ble heat flux to the glacier surface. During the relatively wetand cold La Nina periods, opposite conditions prevail, whichcan lead to near equilibrium mass balance. However, as can
Fig. 9.Upper graph: time series of monthly mass balance anomalies(m w.e.) for the inner tropics (mean of Antisana 15 and La Conejerasglaciers) and Nino 3.4 SSTa (◦C) between June 1995 and August2011. Both time series were smoothed with a 12-month averagingfilter. Mass balance anomalies lag SSTa by 3 months. Vertical barplot (inset) shows the correlation between mass balance anomaliesand the Nino 3.4 index, with the Nino 3.4 index leading mass bal-ance anomalies by between 0 and 6 months. Lower graph: the samebut for the outer tropics (mean of Zongo, Chacaltaya and CharquiniSur glaciers) and Nino 1 + 2 SSTa. The best correlation betweenboth series was with a 4-month lag (see the vertical bar plot inset).
be seen on the lower graph in Fig. 9, the response of massbalance to the SSTa forcing is not systematic, for exampleover the 1992–1995 and 2001–2005 periods. Although thepositive mass balance anomaly in the 1992–1995 period hasbeen attributed to the cooling effect of the Pinatubo eruptionin June 1991 (Francou et al., 2003), the situation that oc-curred between 2001 and 2005 is still being analyzed andremains unresolved. Nevertheless, new characteristics ob-served in ENSO variability (central Pacific/eastern Pacific or“Modoki” ENSO) could explain the slight differences in theresponse of glaciers in this region to the ENSO phenomenon,particularly for the outer tropics. This last point will be thefocus of a forthcoming paper. Finally, ENSO influence on Sa-jama Volcano glaciers has also been highlighted by Arnaudet al. (2001), showing that the snow line elevation is relatedprimarily to precipitation and to a lesser degree to tempera-ture.
www.the-cryosphere.net/7/81/2013/ The Cryosphere, 7, 81–102, 2013
94 A. Rabatel et al.: Current state of glaciers in the tropical Andes
Concerning the Cordillera Blanca in Peru, the mechanismslinking ENSO and glacier mass balance are similar to thosein Bolivia, with the SSTa exerting the prevailing large-scalecontrol on interannual mass balance variations. Typically, ElNino events result in negative mass balance anomalies, andLa Nina in above average signals. However, these telecon-nections are spatially unstable and ENSO events with re-versed effects on glacier mass balance have been observed(Vuille et al., 2008b).
During periods when ENSO is near neutral conditions,other atmospheric forcing factors might also have an impacton interannual mass balance variability, but their relative roleis poorly documented. Such factors might, for example, in-clude variations in intensity and duration of the South Amer-ican monsoon, or the so-calledsurazos, which cause precip-itation during the dry period due to Southern Hemispheremid-latitude disturbances tracking abnormally north of theirusual path (Ronchail, 1995).
5 Climatic causes of tropical glacier changes
5.1 Causes of glacier retreat during the LIA (from thePME to the late 19th–early 20th century)
The formation of moraines at a distance of about 800 to1000 m from the present glacier snout during the PME ofthe LIA means that the specific mass balance was very posi-tive, generating a significant transfer of ice downstream fromthe glacier to offset increasing ablation at low altitude. Fromsensitivity studies, Rabatel et al. (2006) suggested that con-ditions may have been wetter during the LIA, thus increasingaccumulation rates, and, in conjunction with lower tempera-tures, leading to a decrease in the freezing level. This hypoth-esis is consistent with other proxies, one based on ice core ev-idence (Fig. 2 lower panel). For example, in several ice cores,Thompson et al. (2006) and Vimeux et al. (2009) noted amarked centennial-scale decrease in theδ18O of the snow/icebetween the late 16th and early 19th century. The minimumδ18O content between∼ 1620 AD and∼ 1730 AD can beconsidered to be related to increasing convective activity dur-ing the PME (Vimeux et al., 2009). Newδ18O records fromAndean speleothems and lake records also confirm that, inthis region, the LIA period must have been wet (Bird et al.,2011). Pollen analyses from the Sajama ice core (Liu et al.,2005) are also in agreement with wetter conditions during thePME of the LIA.
Quantitatively, the application of simple climate/glaciermodels (Polissar et al., 2006; Rabatel et al., 2008a; Jomelliet al., 2009) highlights several points:
– In Venezuela, for the period 1250–1820 AD, averageair temperature may have been 3.2± 1.4◦C cooler, andprecipitation about 22 % higher than at present.
– In Ecuador, air temperature may have been 0.8◦C to1.1◦C below today’s values, and a 25 % to 35 % in-crease in accumulation appears to have occurred in the18th century.
– In Bolivia, the PME of the LIA could be the result of adecrease in temperature of 1.1◦C to 1.2◦C, and a 20 %to 30 % increase in accumulation.
– In Colombia, the air temperature during the PME of theLIA was estimated to be 1.2◦C to 1.5◦C lower than atthe turn of the 21st century (Baumann, 2006).
A major difference between tropical and mid-latitudeglaciers is that the tropical glaciers began to retreat just after1740–1750 AD, a long trend of recession which may havebeen associated with drier conditions. Indeed, drier condi-tions are indicated by the analysis of paleo-lake levels on thePeruvian–Bolivian Altiplano (Chepstow-Lusty et al., 2003).The shift to drier conditions between the late 18th and early19th centuries is also apparent in pollen analyses of the Sa-jama ice core (Liu et al., 2005) and net accumulation from theQuelccaya ice core (Thompson et al., 1985). However, the re-cession was probably not continuous since distinct moraineswere deposited between the PME and the late 19th–early20th century, indicative of small glacial advances, althoughthose never reached a magnitude as great as those in thePME. Such small glacial advances occurred during the firsthalf of the 19th century in Bolivia and Peru as well (Rabatelet al., 2006, 2008a; Jomelli et al., 2009), with moraine stagesdated from∼ 1800 AD and∼ 1860 AD; they could be relatedto relatively wetter conditions.
The last decades of the 19th century were characterized bya substantial glacier retreat at a regional scale, which could bedue to dry conditions as documented in climate proxies andthe first instrumental measurements (Kraus, 1955; Torrenceand Webster, 1999).
5.2 Causes of the accelerated retreat in the last 30 yr
5.2.1 Climate changes in recent decades
Recently, Vuille et al. (2008a) presented a review of climatechanges in the 20th century along the tropical Andes. Theseauthors reported that:
– Precipitation changes are difficult to document be-cause of the lack of high-quality long-term precipita-tion records. Moreover, the variability at the decadaltimescale is higher than the multi-decadal trend, partlydue to ENSO effects. However, studies showed an in-creasing trend in precipitation after the mid-20th cen-tury (both at an annual scale and during the wet sea-son) north of 11◦ S, i.e. in Ecuador and northern/centralPeru. Inversely, in southern Peru and the Bolivian Al-tiplano, most weather stations indicated a decreasingtrend (Vuille et al., 2003; Haylock et al., 2006).
The Cryosphere, 7, 81–102, 2013 www.the-cryosphere.net/7/81/2013/
A. Rabatel et al.: Current state of glaciers in the tropical Andes 95
– Changes in humidity are very hard to quantify as, inthe Andes, no long-term continuous records exist. How-ever, based on CRU05 data, Vuille et al. (2003) found asignificant increase in relative humidity for the 1950–1995 period ranging from 0.5 % decade−1 (in Bolivia)to more than 2.5 % decade−1 (in Ecuador). Similarly,based on NCEP reanalysis data, Salzmann et al. (2012)found a significant increasing trend in specific humidityin the southern Peruvian Altiplano over the past 50 yr.
– During the 1974–2005 period, outgoing long-wave ra-diation (OLR) decreased in the inner tropics, suggest-ing an increase in convective activity and cloud cover,whereas in the outer tropics, the opposite trend is doc-umented (Vuille et al., 2003). This pattern is consistentwith precipitation trends in the same period.
– Temperature is by far the best documented climate pa-rameter. Based on 279 weather stations located be-tween 1◦ N and 23◦ S, Vuille et al. (2008a) showed thatnear-surface air temperature increased significantly (by0.10◦C decade−1) in the last 70 yr, which representsan overall temperature increase of 0.68◦C since 1939.These findings confirm results obtained by other authorsin Peru (Mark and Seltzer, 2005), Bolivia and northernChile (Vuille et al., 2000), Ecuador (Quintana-Gomez,2000; Villacis, 2008) and along the entire tropical An-des from Ecuador to northern Chile (Vuille and Bradley,2000), all of whom reported a significant warming trendand a reduced daily temperature range (difference be-tween daily minimum and maximum temperatures).Consistent with this increase in temperature, Gilbert etal. (2010) showed from englacial temperature measure-ments in a 138 m deep borehole drilled near the sum-mit of Illimani (6340 m a.s.l., Bolivia) that a warmingtrend can also be identified along the temperature profileat very high altitudes. These authors quantified a meanrise in atmospheric temperature of 1.1± 0.2◦C overthe 20th century. It should be noted that this increasein temperature is the only long-term evidence recordedover the full 20th century in the Andes at the elevationof glaciers, as most weather stations are located below4000 m a.s.l., or have only short-term records.
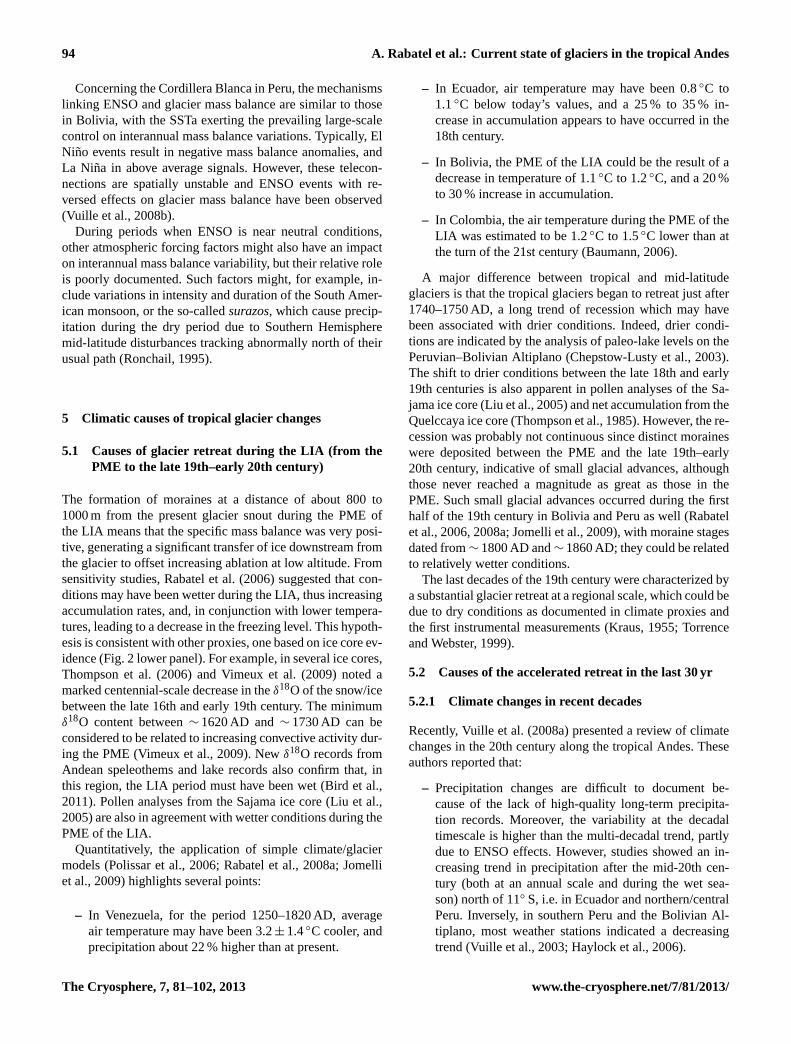
Figure 10 shows changes in freezing level height in theAndean Cordillera documented based on NCEP/NCAR re-analysis data. Freezing level height was computed usingmonthly temperatures and geopotential height and plottedas a 12-month running mean for the 1955–2011 period atthree sites (Antisana in Ecuador, Cordillera Blanca in Peru,and Cordillera Real in Bolivia) using an elevation range be-tween the glacier snout and the mean glacier altitude at eachsite as a backdrop. For each site, the grid cell including thesite was selected. The freezing level height plotted as a 12-month running mean provides an annual mean freezing lineelevation, with seasonality removed (albeit the seasonality is
Fig. 10.Changes in freezing level height in the Andean Cordilleracomputed from NCEP/NCAR reanalysis data (1955–2011) forthree sites (Antisana in Ecuador, Cordillera Blanca in Peru, andCordillera Real in Bolivia) in parallel with a range of elevationsfrom glacier snouts to the mean elevation of glaciers at each site(blue shaded area). These elevations are averages for each one ofthe sites corresponding to values from the 2000 decade.
small in the tropics). In the inner tropics the freezing line isclosely associated with the ELA, while in the outer tropicsthe ELA tends to be above the freezing line (due to moisturelimitations). From Fig. 10, one can note that, in the innertropics (Antisana in Ecuador), during the 1955–2011 period,the ablation zone extended down to the freezing level, thusexplaining the year-round strong ablation rates. In the outertropics of Peru (∼ 9◦ S) and Bolivia (∼ 16◦ S), except duringstrong El Nino events, the ablation zone tended to be locatedabove the annual mean freezing line during the first half ofthe study period. However, the marked increase in freezinglevels since the late 1970s–early 1980s led to a situation inwhich the ablation zones of the Cordillera Blanca and todayeven of the Cordillera Real are mostly located within the al-titudinal range of the annual mean freezing level.
Quantitatively, the freezing level height has increased byabout 60 m and 160 m over the last five and a half decadesin the inner and outer tropics, respectively. This increase canbe partially traced back to the increase in the tropical PacificSST (Diaz et al., 2003; Bradley et al., 2009).
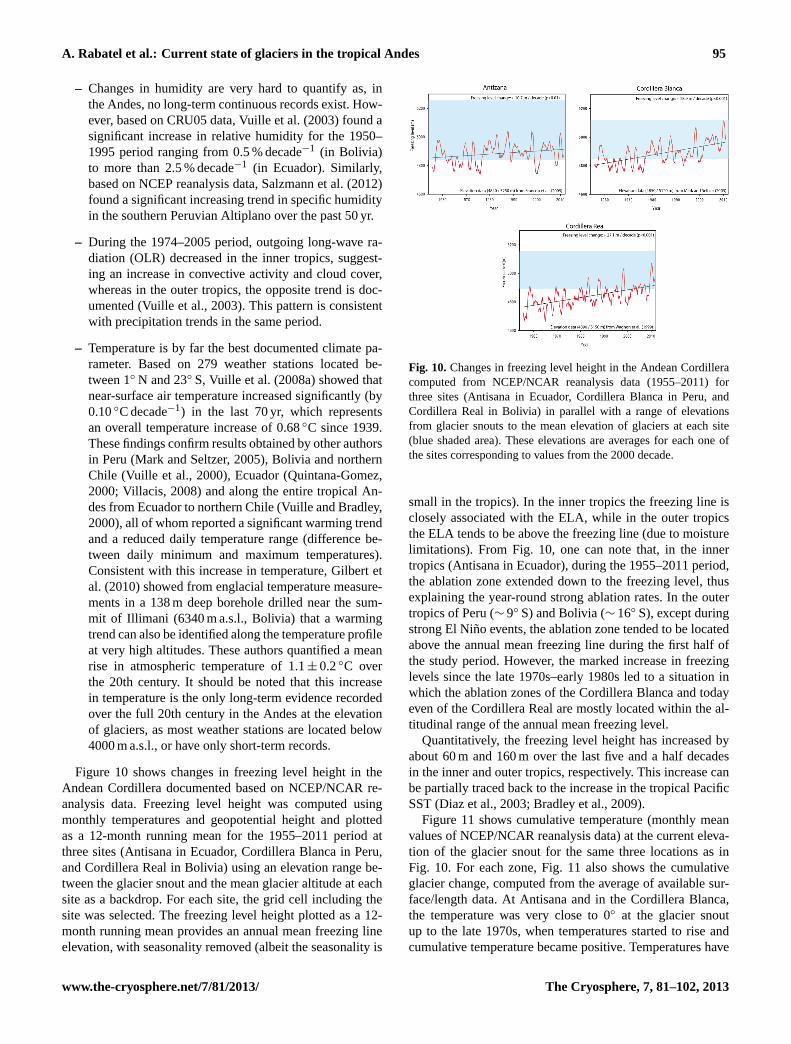
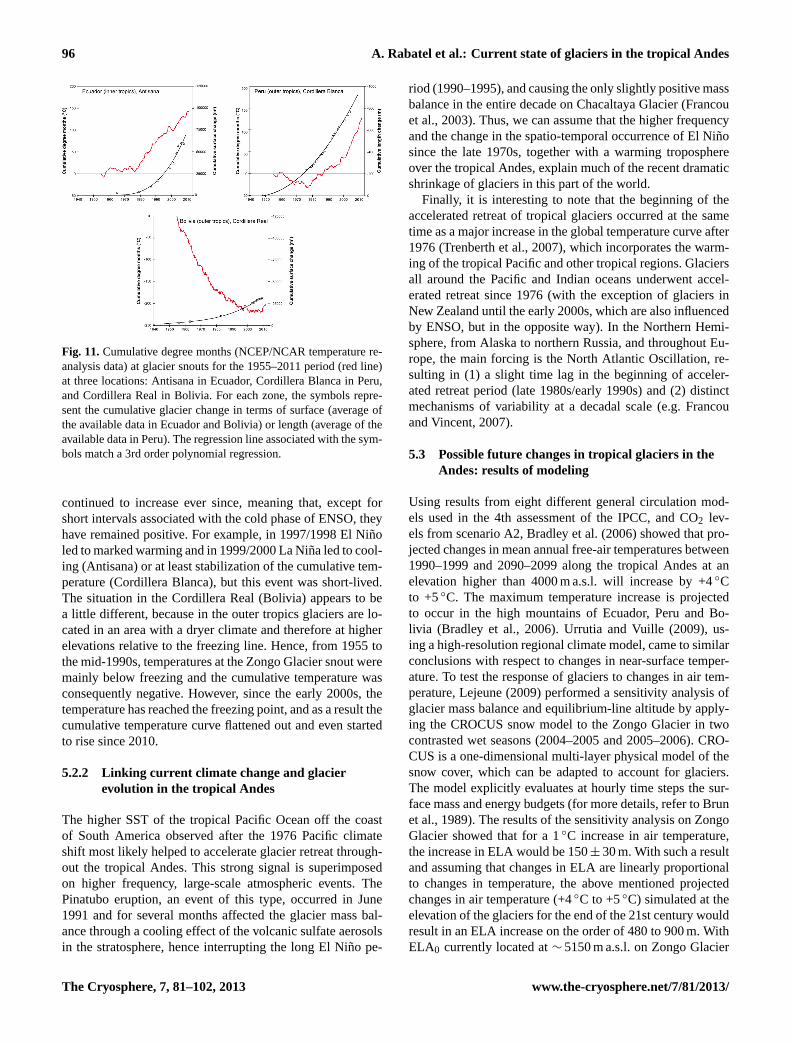
Figure 11 shows cumulative temperature (monthly meanvalues of NCEP/NCAR reanalysis data) at the current eleva-tion of the glacier snout for the same three locations as inFig. 10. For each zone, Fig. 11 also shows the cumulativeglacier change, computed from the average of available sur-face/length data. At Antisana and in the Cordillera Blanca,the temperature was very close to 0◦ at the glacier snoutup to the late 1970s, when temperatures started to rise andcumulative temperature became positive. Temperatures have
www.the-cryosphere.net/7/81/2013/ The Cryosphere, 7, 81–102, 2013
96 A. Rabatel et al.: Current state of glaciers in the tropical Andes
Fig. 11.Cumulative degree months (NCEP/NCAR temperature re-analysis data) at glacier snouts for the 1955–2011 period (red line)at three locations: Antisana in Ecuador, Cordillera Blanca in Peru,and Cordillera Real in Bolivia. For each zone, the symbols repre-sent the cumulative glacier change in terms of surface (average ofthe available data in Ecuador and Bolivia) or length (average of theavailable data in Peru). The regression line associated with the sym-bols match a 3rd order polynomial regression.
continued to increase ever since, meaning that, except forshort intervals associated with the cold phase of ENSO, theyhave remained positive. For example, in 1997/1998 El Ninoled to marked warming and in 1999/2000 La Nina led to cool-ing (Antisana) or at least stabilization of the cumulative tem-perature (Cordillera Blanca), but this event was short-lived.The situation in the Cordillera Real (Bolivia) appears to bea little different, because in the outer tropics glaciers are lo-cated in an area with a dryer climate and therefore at higherelevations relative to the freezing line. Hence, from 1955 tothe mid-1990s, temperatures at the Zongo Glacier snout weremainly below freezing and the cumulative temperature wasconsequently negative. However, since the early 2000s, thetemperature has reached the freezing point, and as a result thecumulative temperature curve flattened out and even startedto rise since 2010.
5.2.2 Linking current climate change and glacierevolution in the tropical Andes
The higher SST of the tropical Pacific Ocean off the coastof South America observed after the 1976 Pacific climateshift most likely helped to accelerate glacier retreat through-out the tropical Andes. This strong signal is superimposedon higher frequency, large-scale atmospheric events. ThePinatubo eruption, an event of this type, occurred in June1991 and for several months affected the glacier mass bal-ance through a cooling effect of the volcanic sulfate aerosolsin the stratosphere, hence interrupting the long El Nino pe-
riod (1990–1995), and causing the only slightly positive massbalance in the entire decade on Chacaltaya Glacier (Francouet al., 2003). Thus, we can assume that the higher frequencyand the change in the spatio-temporal occurrence of El Ninosince the late 1970s, together with a warming troposphereover the tropical Andes, explain much of the recent dramaticshrinkage of glaciers in this part of the world.
Finally, it is interesting to note that the beginning of theaccelerated retreat of tropical glaciers occurred at the sametime as a major increase in the global temperature curve after1976 (Trenberth et al., 2007), which incorporates the warm-ing of the tropical Pacific and other tropical regions. Glaciersall around the Pacific and Indian oceans underwent accel-erated retreat since 1976 (with the exception of glaciers inNew Zealand until the early 2000s, which are also influencedby ENSO, but in the opposite way). In the Northern Hemi-sphere, from Alaska to northern Russia, and throughout Eu-rope, the main forcing is the North Atlantic Oscillation, re-sulting in (1) a slight time lag in the beginning of acceler-ated retreat period (late 1980s/early 1990s) and (2) distinctmechanisms of variability at a decadal scale (e.g. Francouand Vincent, 2007).
5.3 Possible future changes in tropical glaciers in theAndes: results of modeling
Using results from eight different general circulation mod-els used in the 4th assessment of the IPCC, and CO2 lev-els from scenario A2, Bradley et al. (2006) showed that pro-jected changes in mean annual free-air temperatures between1990–1999 and 2090–2099 along the tropical Andes at anelevation higher than 4000 m a.s.l. will increase by +4◦Cto +5◦C. The maximum temperature increase is projectedto occur in the high mountains of Ecuador, Peru and Bo-livia (Bradley et al., 2006). Urrutia and Vuille (2009), us-ing a high-resolution regional climate model, came to similarconclusions with respect to changes in near-surface temper-ature. To test the response of glaciers to changes in air tem-perature, Lejeune (2009) performed a sensitivity analysis ofglacier mass balance and equilibrium-line altitude by apply-ing the CROCUS snow model to the Zongo Glacier in twocontrasted wet seasons (2004–2005 and 2005–2006). CRO-CUS is a one-dimensional multi-layer physical model of thesnow cover, which can be adapted to account for glaciers.The model explicitly evaluates at hourly time steps the sur-face mass and energy budgets (for more details, refer to Brunet al., 1989). The results of the sensitivity analysis on ZongoGlacier showed that for a 1◦C increase in air temperature,the increase in ELA would be 150± 30 m. With such a resultand assuming that changes in ELA are linearly proportionalto changes in temperature, the above mentioned projectedchanges in air temperature (+4◦C to +5◦C) simulated at theelevation of the glaciers for the end of the 21st century wouldresult in an ELA increase on the order of 480 to 900 m. WithELA0 currently located at∼ 5150 m a.s.l. on Zongo Glacier
The Cryosphere, 7, 81–102, 2013 www.the-cryosphere.net/7/81/2013/
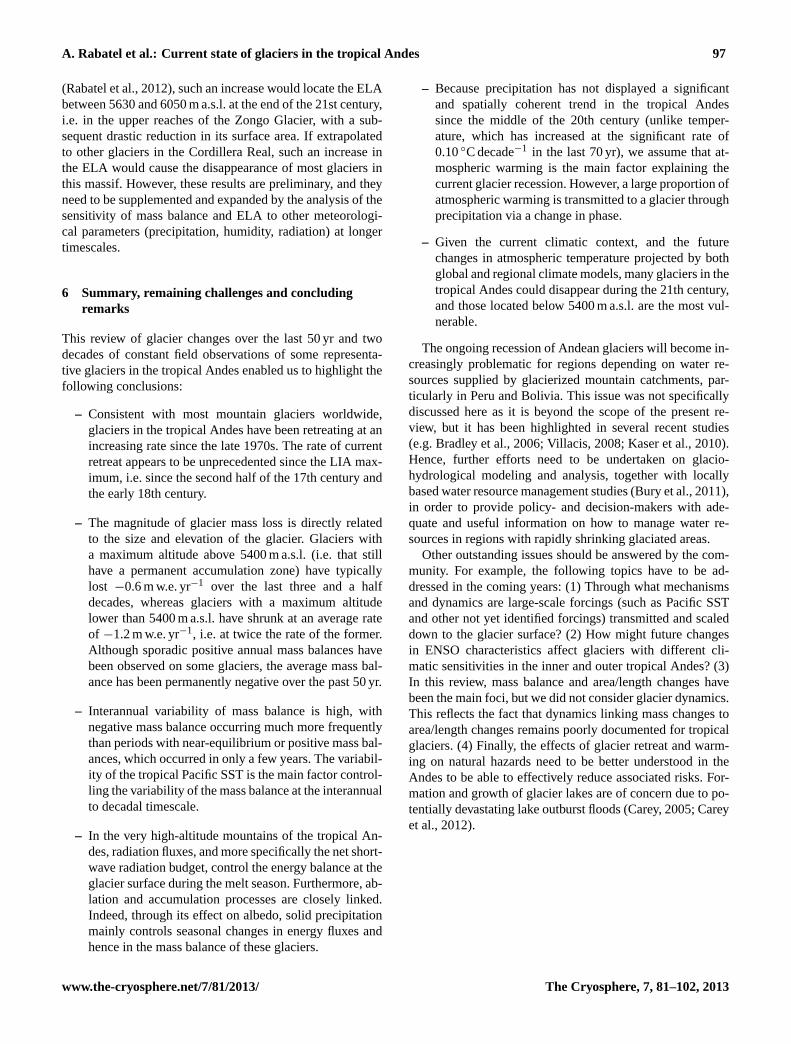
A. Rabatel et al.: Current state of glaciers in the tropical Andes 97
(Rabatel et al., 2012), such an increase would locate the ELAbetween 5630 and 6050 m a.s.l. at the end of the 21st century,i.e. in the upper reaches of the Zongo Glacier, with a sub-sequent drastic reduction in its surface area. If extrapolatedto other glaciers in the Cordillera Real, such an increase inthe ELA would cause the disappearance of most glaciers inthis massif. However, these results are preliminary, and theyneed to be supplemented and expanded by the analysis of thesensitivity of mass balance and ELA to other meteorologi-cal parameters (precipitation, humidity, radiation) at longertimescales.
6 Summary, remaining challenges and concludingremarks
This review of glacier changes over the last 50 yr and twodecades of constant field observations of some representa-tive glaciers in the tropical Andes enabled us to highlight thefollowing conclusions:
– Consistent with most mountain glaciers worldwide,glaciers in the tropical Andes have been retreating at anincreasing rate since the late 1970s. The rate of currentretreat appears to be unprecedented since the LIA max-imum, i.e. since the second half of the 17th century andthe early 18th century.
– The magnitude of glacier mass loss is directly relatedto the size and elevation of the glacier. Glaciers witha maximum altitude above 5400 m a.s.l. (i.e. that stillhave a permanent accumulation zone) have typicallylost −0.6 m w.e. yr−1 over the last three and a halfdecades, whereas glaciers with a maximum altitudelower than 5400 m a.s.l. have shrunk at an average rateof −1.2 m w.e. yr−1, i.e. at twice the rate of the former.Although sporadic positive annual mass balances havebeen observed on some glaciers, the average mass bal-ance has been permanently negative over the past 50 yr.
– Interannual variability of mass balance is high, withnegative mass balance occurring much more frequentlythan periods with near-equilibrium or positive mass bal-ances, which occurred in only a few years. The variabil-ity of the tropical Pacific SST is the main factor control-ling the variability of the mass balance at the interannualto decadal timescale.
– In the very high-altitude mountains of the tropical An-des, radiation fluxes, and more specifically the net short-wave radiation budget, control the energy balance at theglacier surface during the melt season. Furthermore, ab-lation and accumulation processes are closely linked.Indeed, through its effect on albedo, solid precipitationmainly controls seasonal changes in energy fluxes andhence in the mass balance of these glaciers.
– Because precipitation has not displayed a significantand spatially coherent trend in the tropical Andessince the middle of the 20th century (unlike temper-ature, which has increased at the significant rate of0.10◦C decade−1 in the last 70 yr), we assume that at-mospheric warming is the main factor explaining thecurrent glacier recession. However, a large proportion ofatmospheric warming is transmitted to a glacier throughprecipitation via a change in phase.
– Given the current climatic context, and the futurechanges in atmospheric temperature projected by bothglobal and regional climate models, many glaciers in thetropical Andes could disappear during the 21th century,and those located below 5400 m a.s.l. are the most vul-nerable.
The ongoing recession of Andean glaciers will become in-creasingly problematic for regions depending on water re-sources supplied by glacierized mountain catchments, par-ticularly in Peru and Bolivia. This issue was not specificallydiscussed here as it is beyond the scope of the present re-view, but it has been highlighted in several recent studies(e.g. Bradley et al., 2006; Villacis, 2008; Kaser et al., 2010).Hence, further efforts need to be undertaken on glacio-hydrological modeling and analysis, together with locallybased water resource management studies (Bury et al., 2011),in order to provide policy- and decision-makers with ade-quate and useful information on how to manage water re-sources in regions with rapidly shrinking glaciated areas.
Other outstanding issues should be answered by the com-munity. For example, the following topics have to be ad-dressed in the coming years: (1) Through what mechanismsand dynamics are large-scale forcings (such as Pacific SSTand other not yet identified forcings) transmitted and scaleddown to the glacier surface? (2) How might future changesin ENSO characteristics affect glaciers with different cli-matic sensitivities in the inner and outer tropical Andes? (3)In this review, mass balance and area/length changes havebeen the main foci, but we did not consider glacier dynamics.This reflects the fact that dynamics linking mass changes toarea/length changes remains poorly documented for tropicalglaciers. (4) Finally, the effects of glacier retreat and warm-ing on natural hazards need to be better understood in theAndes to be able to effectively reduce associated risks. For-mation and growth of glacier lakes are of concern due to po-tentially devastating lake outburst floods (Carey, 2005; Careyet al., 2012).
www.the-cryosphere.net/7/81/2013/ The Cryosphere, 7, 81–102, 2013
98 A. Rabatel et al.: Current state of glaciers in the tropical Andes
Acknowledgements.This study was conducted within the frame-work of the International Joint Laboratory GREAT-ICE, aninitiative of the French Institute of Research for Development(IRD) and universities and institutions in Bolivia, Peru, Ecuadorand Colombia. IRD researchers: B. Pouyaud, R. Gallaire,E. Cadier, P. Garreta and A. Coudrain are acknowledged fortheir participation in the development of the glacier monitoringprogram in the tropical Andes. We are grateful to all thosewho took part in field campaigns for mass balance measure-ments. We also appreciate collaboration with Nadine Salzmann,Mario Rohrer, Walter Silverio, Cesar Portocarrero and BryanMark. This study was funded by the French IRD (Institut deRecherche pour le Developpement) through the Andean part ofthe French glaciers observatory service: GLACIOCLIM (http://www-lgge.ujf-grenoble.fr/ServiceObs/SiteWebAndes/index.htm)and through the JEAI-IMAGE, and by the Grant SENESCYT-EPN-PIC-08-506. We also acknowledge funding from, andcollaboration with, the Comunidad Andina de Naciones (CAN) andthe World Bank, the Inter-American Institute, the Swiss Agencyfor Development and Cooperation, the Swiss Federal Office for theEnvironment, the Servicio Nacional de Meteorologıa e Hidrologıadel Peru, Helvetas Swiss Intercooperation, US-NSF, the US StateDepartment and CARE. Special thanks to the USGS-EDC forallowing us free access to Landsat images. SPOT images wereprovided through the CNES/SPOT-Image ISIS program, contract#503. Visualizations used in Fig. 1 were produced with theGiovanni online data system, developed and maintained by theNASA GES DISC. We also acknowledge the TRMM missionscientists and associated NASA personnal for the production of thedata used.
Edited by: A. Klein
The publication of this article is financed by CNRS-INSU.
References
Aceituno, P.: On the functioning of the Southern Oscillation in theSouth American sector, Part I: Surface climate, Mon. WeatherRev., 116, 505–524, 1988.
Ames, A. and Francou, B.: Cordillera Blanca, Glaciares en la histo-ria, Bull. Inst. fr.etud. andin., 24, 37–64, 1995.
Ames, A. and Hastenrath, S.: Diagnosing the imbalance of GlaciarSanta Rosa, Peru, J. Glaciol., 42, 212–218, 1996.
Arnaud, Y., Muller, F., Vuille, M., and Ribstein, P.: El Nino-Southern Oscillation (ENSO) influence on a Sajama volcanoglacier (Bolivia) from 1963 to 1998 as seen from Landsat dataand aerial photography, J. Geophys. Res., 106, 17773–17784,2001.
Basantes, R.: Analisis espacio-temporal de comportamientogeometrico de los glaciares del Volcan Antisana y su relacion
con la variabilidad climatica, Master Thesis, Univ. Nice, France,71 pp., 2010.
Baumann, S.: Aufbau einer Gletscherinventars fur Kolumbien undAbschatzung glaziologischer Parameter, Munchen, TechnicalUniversity (TU), Munchen, 2006.
Bermejo, A.: Test de validacion del metodo de reconstruccion delbalance de masa a partir de la altitud de la lınea de equilib-rio (ELA) medida sobre imagenes satelitales del Glaciar Zongo(16◦ S, Cordillera Real, Bolivia) durante el periodo 1997–2006,Master Thesis, Univ. Polytech. Valencia, Spain, 75 pp., 2010.
Beven, K.: Changing ideas in hydrology – The case of physically-based models, J. Hydrol., 105, 157–172, 1989.
Bird, B. W., Abbott, M. B., Vuille, M., Rodbell, D. T., Rosenmeier,M. F., and Stansell, N. D.: A 2300-year-long annually resolvedrecord of the South American summer monsoon from the Peru-vian Andes, P. Natl. Acad. Sci., 108, 8583–8588, 2011.
Bradley, R. S., Vuille, M., Diaz, H. F., and Vergara, W.: Threats towater supplies in the Tropical Andes, Science, 312, 1755–1756,doi:10.1126/science.1128087, 2006.
Bradley, R. S., Keimig, F. T., Diaz, H. F., and Hardy, D. R.: Recentchanges in freezing level heights in the Tropics with implicationsfor the deglacierization of high mountain regions, Geophys. Res.Lett., 36, L17701,doi:10.1029/2009GL037712, 2009.
Braithwaite, R. J.: On glacier energy balance, ablation, and air tem-perature. J. Glaciol., 27, 381–391, 1981.
Brecher, H. H. and Thompson, L. G.: Measurement of the retreatof Qori Kalis glacier in the tropical Andes of Peru by terres-trial photogrammetry, Photogramm. Eng. Rem. Sens., 59, 1017–1022, 1993.
Broggi, J. A.: La desglaciacion actual de los Andes del Peru, Bol.Mus. Hist. Nat. “Javier Prado”, 9, 222–248, 1945.
Brun, E., Martin, E., Simon, V., Gendre, C., and Coleou, C.: Anenergy and mass model of snow cover suitable for operationalavalance forecasing, J. Glaciol, 35, 333–342, 1989.
Bury, J. T., Mark, B. G., McKenzie, J. M., French, A., Baraer, M.,Huh, K. I., Zapata Luyo, M. A., and Gomez Lopez, R. J.: Glacierrecession and human vulnerability in the Yanamarey watershedof the Cordillera Blanca, Peru, Climatic Change, 105, 179–206,doi:10.1007/s10584-010-9870-1, 2011.
Caceres, B.: Actualizacion del inventario de tres casquetes glaciaresdel Ecuador, Master Thesis, Univ. Nice, France, 84 pp., 2010.
Carey, M.: Living and dying with glaciers: people’s historical vul-nerability to avalanches and outburst floods in Peru, Glob. Planet.Change, 47, 122–134, 2005.
Carey, M., Huggel, C., Bury, J., Portocarrero, C., and Haeberli,W.: An integrated socio-environmental framework for climatechange adaptation and glacier hazard management: Lessons fromLake 513, Cordillera Blanca, Peru, Clim. Change, 112, 733–767,2012.
Ceballos, J. L., Euscategui, C., Ramirez, J., Canon, M., Huggel,C., Haeberli, W., and Machguth, H.: Fast shrinkage of tropicalglaciers in Colombia, Ann. Glaciol., 43, 194–201, 2006.
Chepstow-Lusty, A., Frogley, M. R., Bauer, B. S., Bush, M. B., andTupayachi Herrer, A.: A late Holocene record of arid events fromthe Cuzco region, Peru. J. Quat. Sci, 18, 491–502, 2003.
Clapperton, C. M.: The glaciations of the Andes, Quat. Sci. Rev., 2,83–155, 1983.
Cogley, G.: The future of World’s glaciers, Chapter 8, From Barry,R., Hock, R. and Polyakov, I., The Future of the World’s Glaciers,
The Cryosphere, 7, 81–102, 2013 www.the-cryosphere.net/7/81/2013/
A. Rabatel et al.: Current state of glaciers in the tropical Andes 99
in: The Future of the World’s Climate, edited by: Henderson-Sellers, A. and McGuffie, K., Elsevier, Amsterdam, 197–222,2012.
Collet, M.: Suivi spatio-temporel des calottes glaciaires del’Antisana et du Cotopaxi (Equateur), Analyse par teledetectiondans un contexte de changement climatique, Master Thesis,Univ. Rennes, France, 102 pp., 2010.
Consoli, G.: Reconstruction des bilans de masse annuels de11 glaciers de la Cordillere Royale de Boliviea partir del’observation de la ligne de neige, Master Thesis, Univ. Greno-ble, France, 90 pp., 2011.
Cooley, D., Naveau, P., Jomelli, V., Rabatel, A., and Grancher, D.: ABayesian Hierarchical Extreme Value Model for Lichenometry,Environmetrics, 17, 555–574,doi:10.1002/env.764, 2006.
Diaz, H. F., Eischeid, J. K., Duncan, C., and Bradley, R. S.: Variabil-ity of freezing levels, melting season indicators and snow coverfor selected high elevation and continental regions in the last 50years, Climatic Change, 59, 33–52, 2003.
Favier, V., Wagnon, P., and Ribstein, P.: Glaciers of the outerand inner tropics: a different behavior but a common re-sponse to climatic forcing, Geophys. Res. Lett., 31, L16403,doi:10.1029/2004GL020654, 2004a.
Favier, V., Wagnon, P., Chazarin, J.-P., Maisincho, L., and Coudrain,A.: One-year measurements of surface heat budget on the abla-tion zone of Antizana glacier 15, Ecuadorian Andes, J. Geophys.Res., 109, D18105,doi:10.1029/2003JD004359, 2004b.
Florez, A.: La Sierra Nevada del Cocuy, Chita o Guican, EPG-Geografia, 1, 7–18, 1991.
Francou, B.: Andes del Ecuador: los glaciares en laepoca de losviajeros (siglos XVIII a XX), In Los Andes el reto del espaciomundo andino: homenaje a Olivier Dollfus, edited by: Deler, J.P. and Mesclier, E., Inst. Fr. Et. And., Lima, 137–152, 2004.
Francou, B. and Pizarro, F.: El Nino y la Sequıa en los Altos An-des Centrales (Peru y Bolivia), Bull. Inst. Fr. Et. And., 14, 1–18,1985.
Francou, B. and Ribstein, P.: Glaciers etevolution climatique dansles Andes boliviennes, Glacier de Zongo et Glacier de Chacal-taya, Cordillere Royale, 16◦ Sud, Bull. Inst. Fr. Et. And., 24, 23–36, 1995.
Francou, B. and Vincent, C.: Les glaciersa l’epreuve du climat,IRD, Belin, Paris, 274 pp., 2007.
Francou, B., Ribstein, P., Saravia, R., and Tiriau, E.: Monthly bal-ance and water discharge of an inter-tropical glacier: ZongoGlacier, Cordillera Real, Bolivia, 16◦ S, J. Glaciol., 41, 61–67,1995.
Francou, B., Ramirez, E., Caceres, B., and Mendoza, J.: Glacierevolution in the tropical Andes during the last decades of the 20thcentury: Chacaltaya, Bolivia and Antizana, Ecuador, Ambio, 29,416–422, 2000.
Francou, B., Vuille, M., Wagnon, P., Mendoza, J., and Sicart,J. E.: Tropical climate change recorded by a glacier in thecentral Andes during the last decades of the twentieth cen-tury: Chacaltaya, Bolivia, 16◦ S, J. Geophys. Res., 108, 4154,doi:10.1029/2002JD002959, 2003.
Francou, B., Vuille, M., Favier, V., and Caceres, B.: New evi-dence for an ENSO impact on low-latitude glaciers: Antizana15, Andes of Ecuador, 0◦28′ S, J. Geophys. Res., 109, D18106,doi:10.1029/2003JD004484, 2004.
Francou, B., Caceres, B., Gomez, J., and Soruco, A.: Coherenceof the glacier signal throughout the tropical Andes over the lastdecades, Proceedings of the First International Conference on theImpact of Climate Change on High-Mountain System, IDEAM,Bogota, 87–97, 2007.
Garreaud, R. and Aceituno, P.: Interannual rainfall variability overthe South American Altiplano, J. Clim., 14, 2779–2789, 2001.
Garreaud, R., Vuille, M., and Clement, A.: The climate of the Al-tiplano: observed current conditions and mechanisms of pastchanges, Palaeogeogr. Palaeocl., 194, 5–22,doi:10.1016/S0031-0182(03)00269-4, 2003.
Georges, C.: The 20th century glacier fluctuations in the tropicalCordillera Blanca, Peru, Arct. Antarct. Alp. Res., 36, 100–107,2004.
Gilbert, A., Wagnon, P., Vincent, C., Ginot, P., and Funk, M.: At-mospheric warming at a high-elevation tropical site revealedby englacial temperatures at Illimani, Bolivia (6340 m abovesea level, 16◦ S, 67◦ W), J. Geophys. Res., 115, D10109,doi:10.1029/2009JD012961, 2010.
Gouze, P., Argollo, J., Saliege, J. F., and Servant, M.: Interpretationpaleoclimatique des oscillations des glaciers au cours des 20derniers millenaires dans les regions tropicales; exemple des An-des boliviennes, C. R. Acad. Sci., 303, 219–224, 1986.
Hardy, D. R., Vuille, M., Braun, C., Keimig, F., and Bradley, R.S.: Annual and daily meteorological cycles at high altitude on atropical mountain, B. Am. Meteorol. Soc., 79, 1899–1913, 1998.
Hardy, D. R., Vuille, M., and Bradley, R. S.: Variability of snowaccumulation and isotopic composition on Nevado Sajama, Bo-livia. J. Geophys. Res., 108, 4693,doi:10.1029/2003JD003623,2003.
Hastenrath, S.: Heat-budget measurements on the Quelccaya IceCap, Peruvian Andes, J. Glaciol., 20, 85–97, 1978.
Hastenrath, S.: The glaciation of the Ecuadorian Andes, A. A.Balkema Publishers, Rotterdam, 1981.
Hastenrath, S.: Recession of tropical glaciers, Science, 265, 1790–1791, 1994.
Hastenrath, S. and Ames, A.: Recession of Yanamarey Glacier inCordillera Blanca, Peru, during the 20th century, J. Glaciol., 41,191–196, 1995a.
Hastenrath, S. and Ames, A.: Diagnosing the imbalance of Yana-marey Glacier in the Cordillera Blanca of Peru, J. Geophys. Res.,100, 5105–5112, 1995b.
Haylock, M. R., Peterson, T. C., Alves, L. M., Ambrizzi, T., Anun-ciacao, M. T., Baez, J., Barros, V. R., Berlato, M. A., Bidegain,M., Coronel, G., Corradi, V., Garcia, V. J., Grimm, A. M., Karoly,D., Marengo, J. A., Marino, M. B., Moncunill, D. F., Nechet, D.,Quintana, J., Rebello, E., Rusticucci, M., Santos, J. L., Trebejo,I., and Vincent, L. A.: Trends in total and extreme South Ameri-can rainfall in 1960–2000 and links with sea surface temperature,J. Clim., 19, 1490–1512, 2006.
Herrera, G. and Ruiz, J.: Retroceso glaciar en la Sierra Nevada delCocuy, Boyaca – Colombia, 1986–2007, Perspectiva Geografica,13, 27–36, 2009.
Hock, R. and Holmgren, B.: A distributed surface energy-balancemodel for complex topography and its application to Storglacia-ren, Sweden, J. Glaciol., 51, 25–36, 2005.
Hostetler, S. W. and Clark, P. U.: Tropical Climate at the LastGlacial Maximum inferred from glacier mass-balance modeling,Science, 290, 1747–1750, 2000.
www.the-cryosphere.net/7/81/2013/ The Cryosphere, 7, 81–102, 2013
100 A. Rabatel et al.: Current state of glaciers in the tropical Andes
Huggel, C., Ceballos, J. L., Pulgarin, B., Ramirez, J., and Thouret,J.: Review and reassessment of hazards owing to volcano-glacierinteractions in Colombia, Ann. Glaciol., 45, 128–136, 2007.
Jomelli, V., Grancher, D., Brunstein, D., and Solomina, O.: Recal-ibration of the yellow Rhizocarpon growth curve in CordilleraBlanca (Peru) and implications for LIA chronology, Geomor-phology, 93, 201–212,doi:10.1016/j.geomorph.2007.02.021,2008.
Jomelli, V., Favier, V., Rabatel, A., Brunstein, D., Hoffmann,G., and Francou, B.: Fluctuations of glaciers in the tropi-cal Andes over the last millennium and palaeoclimatic im-plications: A review, Palaeogeogr. Palaeocl., 281, 269–282,doi:10.1016/j.palaeo.2008.10.033, 2009.
Jomelli, V., Naveau, P., Cooley, D., Grancher, D., Brunstein, D.,and Rabatel, A.: A response to Bradwell’s commentary on recentstatistical studies in lichenometry, Geog. Ann., 92A, 487–489,2010.
Jordan, E.: Die Gletscher der Bolivianischen Anden: einephotogrammetrisch-kartographische Bestandsaufnahme derGletscher Boliviens als Grundlage fur klimatische Deutungenund Potential fur die wirtschaftliche Nutzung. Stuttgart, FranzSteiner Verlag, (Erdwissenschaftliche Forschung 23.), 1991.
Jordan, E., Ungerechts, L., Caceres, B., Penafiel, A., and Francou,B.: Estimation by photogrammetry of the glacier recession on theCotopaxi Volcano (Ecuador) between 1956 and 1997, Hydrol.Sci. J., 50, 949–961, 2005.
Juen, I., Kaser, G., and Georges, C.: Modeling observed and futurerunoff froma glacierized tropical catchment (Cordillera Blanca,Peru), Glob. Planet. Change, 59, 37–48, 2007.
Kalnay, E., Kanamitsu, M., Kistler, R., Collins, W., Deaven, D.,Gandin, L., Iredell, M., Saha, S., White, G., Woollen, J., Zhu, Y.,Chelliah, M., Ebisuzaki, W., Higgins, W., Janowiak, J., Mo, K.C., Ropelewski, C., Wang, J., Leetmaa, A., Reynolds, R., Jenne,R., and Joseph, D.: The NCEP/NCAR 40-year reanalysis project,B. Am. Meteorol. Soc., 77, 437–471, 1996.
Kaser, G.: A review of the modern fluctuations of tropical glaciers,Glob. Planet. Change, 22, 93–103, 1999.
Kaser, G.: Glacier-climate interaction at low latitudes, J. Glaciol.,47, 195–204, 2001.
Kaser, G. and Georges, C.: Changes of the equilibrium-line altitudein the tropical Cordillera Blanca, Peru, 1930–50, and their spatialvariations, Ann. Glaciol., 24, 344–349, 1997.
Kaser, G. and Osmaston, H. A.: Tropical Glaciers, Cambridge Uni-versity Press, New York, 209 pp., 2002.
Kaser, G., Ames, A., and Zamora, M.: Glacier fluctuations and cli-mate in the Cordillera Blanca, Peru, Ann. Glaciol., 14, 136–140,1990.
Kaser, G., Hastenrath, S., and Ames, A.: Mass balance profiles ontropical glaciers, Z. Gletscherkd. Glazialgeol., 32, 75–81, 1996.
Kaser, G., Grosshauser, M., and Marzeion, B.: Contributionpotential of glaciers to water availability in different cli-mate regimes, P. Natl. Acad. Sci. USA, 107, 20223–20227,doi:10.1073/pnas.1008162107, 2010.
Kinzl, H.: La glaciacion actual y pleistocenica en los Andes cen-trales, Bol. Soc. Geog. Lima, 89, 89–100, 1969.
Kraus, E. B.: Secular changes of tropical rainfall regimes, Q. J. Roy.Meteor. Soc., 81, 198–210, 1955.
Kuhn, M.: Mass budget imbalances as criterion for a climatic clas-sification of glaciers, Geog. Ann., 66, 229–238, 1984.
Kull, C. and Grosjean, M.: Late Pleistocene climate conditions inthe north Chilean Andes drawn from a climate-glacier model, J.Glaciol., 46, 622–632, 2000.
Lejeune, Y.: Apports des modeles de neige CROCUS et de sol ISBAa l’etude du bilan glaciologique d’un glacier tropical et du bilanhydrologique de son bassin versant, Ph.D. Thesis, University ofGrenoble, France, 358 pp., 2009.
Lemke, P., Ren, J., Alley, R. B., Allison, I., Carrasco, J., Flato, G.,Fujii, Y., Kaser, G., Mote, P., Thomas, R. H., and Zhang, T.: Ob-servations: Changes in snow, ice and frozen ground, in: ClimateChange 2007: The Physical Science Basis, edited by: Solomon,S., Qin, D., Manning, M., Chen, Z., Marquis, M., Averyt, K. B.,Tignor, M., and Miller, H. L., 337–383, Cambridge Univ. Press,Cambridge, United Kingdom and New York, NY, USA, 2007.
Liu, K., Reese, C. A., and Thompson, L. G.: Ice-core pollen recordof climatic changes in the central Andes during the last 400 yr,Quat. Res., 64, 272–278, 2005.
Mark, B. G. and Seltzer, G. O.: Evaluation of recent glacier reces-sion in the Cordillera Blanca, Peru (AD 1962–1999): spatial dis-tribution of mass loss and climatic forcing, Quat. Sci. Rev., 24,2265–2280, 2005.
Morris, J. N., Poole, A. J., and Klein, A. G.: Retreat of tropicalglaciers in Colombia and Venezuela from 1984 to 2004 as mea-sured from ASTER and Landsat images, in: Proc. 63rd EasternSnow Conference, Newark, Delaware, USA, 181–191, 2006.
Muller, R.: Zur gletschergeschichte in der Cordillera Quimsa Cruz(Depto. La Paz, Bolivien), Ph.D. Thesis, Zurich, Switzerland,188 pp., 1985.
Naveau, P., Jomelli, V., Cooley, D., Grancher, D., and Rabatel, A.:Modelling uncertainties in lichenometry studies, Arct. Antarct.Alp. Res., 39, 277–285, 2007.
Paterson, W. S. B.: The physics of glaciers, 3 Edn., Oxford, Elsevier,1994.
Platt, C. M.: Some observations of the climate of Lewis Glacier,Mount Kenya, during the rainy season, J. Glaciol., 6, 267–287,1966.
Polissar, P. J., Abbott, M. B., Wolfe, A. P., Bezada, M., Rull, V.,and Bradley, R. S.: Solar modulation of Little Ice Age climatein the tropical Andes, P. Natl. Acad. Sci. USA, 103, 8937–8942,doi:10.1073/pnas.0603118103, 2006.
Pouyaud, B., Zapata, M., Yerren, J., Gomez, J., Rosas, G., Suarez,W., and Ribstein, P.: On the future of the water resources fromglacier melting in the Cordillera Blanca, Peru, Hydrol. Sci. J.,50, 999–1022, 2005.
Poveda, G. and Pineda, K.: Reassessment of Colombia’s trop-ical glaciers retreat rates: are they bound to disappear dur-ing the 2010–2020 decade?, Adv. Geosci., 22, 107–116,doi:10.5194/adgeo-22-107-2009, 2009.
Quintana-Gomez, R. A.: Trends of maximum and minimum tem-peratures in Ecuador and homogeneity evaluation during 1961–90, 6th International Conference on Southern Hemisphere Me-teorology and Oceanography, 3–7 April 2000, Santiago, Chile,292–293, 2000.
Rabatel, A., Jomelli, V., Naveau, P., Francou, B., and Grancher, D.:Dating of Little Ice Age glacier fluctuations in the tropical An-des: Charquini glaciers, Bolivia, 16◦ S, C. R. Geosci., 337, 1311–1322,doi:10.1016/j.crte.2005.07.009, 2005a.
Rabatel, A., Dedieu, J.-P., and Vincent, C.: Using remote-sensingdata to determine equilibrium-line altitude and mass-balance
The Cryosphere, 7, 81–102, 2013 www.the-cryosphere.net/7/81/2013/
A. Rabatel et al.: Current state of glaciers in the tropical Andes 101
time series: validation on three French glaciers, 1994–2002,J. Glaciol., 51, 539–546,doi:10.3189/172756505781829106,2005b.
Rabatel, A., Machaca, A., Francou, B., and Jomelli, V.: Glacier re-cession on the Cerro Charquini (Bolivia 16◦ S) since the maxi-mum of the Little Ice Age (17th century), J. Glaciol., 52, 110–118,doi:10.3189/172756506781828917, 2006.
Rabatel, A., Francou, B., Jomelli, V., Naveau, P., and Grancher, D.:A chronology of the Little Ice Age in the tropical Andes of Bo-livia (16◦ S) and its implications for climate reconstruction, Quat.Res., 70, 198–212,doi:10.1016/j.yqres.2008.02.012, 2008a.
Rabatel, A., Dedieu, J.-P., Thibert, E., Letreguilly, A., and Vin-cent, C.: 25 years (1981–2005) of equilibrium-line altitude andmass-balance reconstruction on Glacier Blanc, French Alps, us-ing remote-sensing methods and meteorological data, J. Glaciol.,54, 307–314,doi:10.3189/002214308784886063, 2008b.
Rabatel, A., Castebrunet, H., Favier, V., Nicholson, L., and Kin-nard, C.: Glacier changes in the Pascua-Lama region, ChileanAndes (29◦ S): recent mass balance and 50 yr surface area vari-ations, The Cryosphere, 5, 1029–1041,doi:10.5194/tc-5-1029-2011, 2011.
Rabatel, A., Bermejo, A., Loarte, E., Soruco, A., Gomez, J., Leonar-dini, G., Vincent, C., and Sicart, J. E.: Relationship betweensnowline altitude, equilibrium-line altitude and mass balanceon outer tropical glaciers: Glaciar Zongo – Bolivia, 16◦ S andGlaciar Artesonraju – Peru, 9◦ S, J. Glaciol., 58, 1027–1036,doi:10.3189/2012JoG12J027, 2012.
Racoviteanu, A. E., Manley, W., Arnaud, Y., and Williams, M.W.: Evaluating digital elevation models for glaciologic appli-cations: an example from Nevado Coropuna, Peruvian Andes,Glob. Planet. Change, 59, 110–125, 2007.
Racoviteanu, A. E., Arnaud, Y., Williams, M. W., and Ordonez, J.:Decadal changes in glacier parameters in the Cordillera Blanca,Peru, derived from remote sensing, J. Glaciol., 54, 499–510,2008.
Ramirez, E., Francou, B., Ribstein, P., Descloitres, M., Guerin, R.,Mendoza, J., Gallaire, R., Pouyaud, B., and Jordan, E.: Smallglaciers disappearing in the tropical Andes: a case-study in Bo-livia: Glaciar Chacaltaya (16◦ S), J. Glaciol., 47, 187–194, 2001.
Raup, B., Racoviteanu, A., Khalsa, S. J. S., Helm, C., Armstrong,R., and Arnaud, Y.: The GLIMS geospatial glacier database: anew tool for studying glacier change, Glob. Planet. Change, 56,101–110, 2007.
Ribstein, P., Tiriau, E., Francou, B., and Saravia, R.: Tropical cli-mate and glacier hydrology: A case study in Bolivia, J. Hydrol.,165, 221–234,doi:10.1016/0022-1694(94)02572-S, 1995.
Rodbell, D. T.: Lichenometric and radiocarbon dating of Holoceneglaciation, Cordillera Blanca, Peru, Holocene, 2, 19–29, 1992.
Ronchail, J.: Variabilidad interannual de las precipitaciones en Bo-livia, Bull. Inst. Fr. Et. And., 46, 13–33, 1995.
Salzmann, N., Huggel, C., Rohrer, M., Silverio, W., Mark, B. G.,Burns, P., and Portocarrero, C.: Glacier changes and climatetrends derived from multiple sources in the data scarce CordilleraVilcanota region, Southern Peruvian Andes, The CryosphereDiscuss., 6, 387–426,doi:10.5194/tcd-6-387-2012, 2012.
Seltzer, G. O.: Late Quaternary Glaciation of the Cordillera Real,Bolivia, J. Quat. Sci., 7, 87–98, 1992.
Sicart, J.-E., Wagnon, P., and Ribstein, P.: Atmospheric controls ofheat balance of Zongo Glacier (16◦ S, Bolivia), J. Geophys. Res.,
110, D12106,doi:10.1029/2004JD005732, 2005.Sicart, J.-E., Hock, R., and Six, D.: Glacier melt, air temperature,
and energy balance in different climates: The Bolivian Tropics,the French Alps, and northern Sweden, J. Geophys. Res., 113,D24113,doi:10.1029/2008JD010406, 2008.
Sicart, J.-E., Hock, R., Ribstein, P., Litt, M., and Ramirez, E.: Anal-ysis of seasonal variations in mass balance and meltwater dis-charge of the Tropical Zongo Glacier by application of a dis-tributed energy balance model, J. Geophys. Res., 116, D13105,doi:10.1029/2010JD015105, 2011.
Silverio, W. and Jaquet, J.-M.: Glacial cover mapping (1987–1996)of the Cordillera Blanca (Peru) using satellite imagery, RemoteSens. Environ., 95, 342–350, 2005.
Solomina, O., Jomelli, V., Kaser, G., Ames, A., Berger, B., andPouyaud, B.: Lichenometry in the Cordillera Blanca, Peru: “Lit-tle Ice Age” moraine chronology, Glob. Planet. Change, 59, 225–235, 2007.
Soruco, A., Vincent, C., Francou, B., and Gonzalez, J. F.: Glacierdecline between 1963 and 2006 in the Cordillera Real, Bolivia,Geophys. Res. Lett., 36, L03502,doi:10.1029/2008GL036238,2009a.
Soruco, A., Vincent, C., Francou, B., Ribstein, P., Berger, T., Sicart,J. E., Wagnon, P., Arnaud, Y., Favier, V., and Lejeune, Y.: Massbalance of Glaciar Zongo, Bolivia, between 1956 and 2006,using glaciological, hydrological and geodetic methods, Ann.Glaciol., 50, 1–8, 2009b.
Thompson, L. G., Mosley-Thompson, E., and Koci, J. F.: A 1500-year record of tropical precipitation in ice cores from the Quelc-caya ice cap, Peru, Science, 229, 971–973, 1985.
Thompson, L. G., Mosley-Thompson, E., Dansgaard, W., andGrootes, P. M.: The LIA as recorded in the stratigraphy of thetropical Quelccaya Ice Cap, Science, 234, 361–364, 1986.
Thompson, L. G., Mosley-Thompson, E., Brecher, H., Davis, M.,Leon, B., Les, D., Lin, P.-N., Mashiotta, T., and Mountain, K.:Abrupt tropical climate change: past and present, P. Natl. Acad.Sci. USA, 103, 10536–10543,doi:10.1073/pnas.0603900103,2006.
Trenberth, K. E., Jones, P. D., Ambenje, P., Bojariu, R., Easterling,D., Klein Tank, A., Parker, D., Rahimzadeh, F., Renwick, J. A.,Rusticucci, M., Soden, B., and Zhai, P.: Observations: Surfaceand Atmospheric Climate Change, in: Climate Change 2007:The Physical Science Basis, edited by: Solomon, S., Qin, D.,Manning, M., Chen, Z., Marquis, M., Averyt, K. B., Tignor, M.,and Miller, H. L., 235–336, Cambridge Univ. Press, Cambridge,United Kingdom and New York, NY, USA, 2007.
Troll, C.: Studien zur vergleichenden Geographie der Hochgebirgeder Erde, Bonner Mitteilungen, Bonn, Germany, 1941.
Torrence, C. and Webster, P. J.: Interdecadal changes in the ENSO-monsoon system, J. Clim., 12, 2679–2690, 1999.
Unidad de Glaciologıa y Recursos Hıdricos (UGRH): Inventario deglaciares, Cordillera Blanca, Peru, Autoridad Nacional del Agua,Huaraz, 81 pp., 2010.
Urrutia, R. and Vuille, M.: Climate change projections for the trop-ical Andes using a regional climate model: Temperature and pre-cipitation simulations for the end of the 21st century, J. Geophys.Res., 114, D02108,doi:10.1029/2008JD011021, 2009.
Vergara, W., Deeb, A. M., Valencia, A. M., Bradley, R. S., Francou,B., Zarzar, A., Grunwaldt, A., and Haeussling, S. M.: Economicimpacts of rapid glacier retreat in the Andes, Eos, 88, 261–264,
www.the-cryosphere.net/7/81/2013/ The Cryosphere, 7, 81–102, 2013
102 A. Rabatel et al.: Current state of glaciers in the tropical Andes
2007.Villacıs, M.: Ressources en eau glaciaire dans les Andes d’Equateur
en relation avec les variations du climat: le cas du volcan Anti-sana, Ph.D. Thesis, University of Montpellier II, France, 231 pp.,2008.
Vimeux, F., Ginot, P., Schwikowski, M., Vuille, M., Hoffmann, G.,Thompson, L. G., and Schotterer, U.: Climate variability duringthe last 1000 years inferred from Andean ice cores: A reviewof methodology and recent results, Palaeogeogr. Palaeocl., 281,229–241,doi:10.1016/j.palaeo.2008.03.054, 2009.
Vuille, M. and Bradley, R. S.: Mean annual temperature trends andtheir vertical structure in the tropical Andes, Geophys. Res. Lett.,27, 3885–3888, 2000.
Vuille, M., Bradley, R. S., and Keimig, F.: Interannual climate vari-ability in the Central Andes and its relation to tropical Pacific andAtlantic forcing, J. Geophys. Res., 105, 12447–12460, 2000.
Vuille, M., Bradley, R. S., Werner, M., and Keimig, F.: 20th centuryclimate change in the tropical Andes: observations and modelresults, Climatic Change, 59, 75–99, 2003.
Vuille, M., Francou, B., Wagnon, P., Juen, I., Kaser, G., Mark, B.G., and Bradley, R. S.: Climate change and tropical Andeanglaciers: Past, present and future, Earth-Sci. Rev., 89, 79–96,doi:10.1016/j.earscirev.2008.04.002, 2008a.
Vuille, M., Kaser, G., and Juen, I.: Glacier mass balance variabilityin the Cordillera Blanca, Peru and its relationship with climateand the large-scale circulation, Glob. Planet. Change, 62, 14–28,2008b.
Wagnon, P., Ribstein, P., Francou, B., and Pouyaud, B.: Annual cy-cle of energy balance of Zongo Glacier, Cordillera Real, Bolivia,J. Geophys. Res., 104, 3907–3923, 1999.
Wagnon, P., Ribstein, P., Francou, B., and Sicart, J. E.: Anomalousheat and mass balance budget of Glaciar Zongo, Bolivia, duringthe 1997/98, El Nino year, J. Glaciol., 47, 21–28, 2001.
WGMS: Glacier Mass Balance Bulletin #11 (2008–2009), editedby: Zemp, M., Nussbaumer, S. U., Gartner-Roer, I., Hoel-zle, M., Paul, F., and Haeberli, W., ICSU(WDS)/IUGG(IACS)/UNEP/UNESCO/WMO, World Glacier Monitoring Service,Zurich, Switzerland, 102 pp., 2011.
Zuzel, J. F. and Cox, L. M.: Relative importance of meteorologicalvariables in snowmelt, Water Resour. Res., 11, 174–176, 1975.
The Cryosphere, 7, 81–102, 2013 www.the-cryosphere.net/7/81/2013/