Embed Size (px)
Citation preview

Office of Research and DevelopmentNational Risk Management Research LaboratoryWater Supply and Water Resources Division
Photo image area measures 2” H x 6.93” W and can be masked by a collage strip of one, two or three images.
The photo image area is located 3.19” from left and 3.81” from top of page.
Each image used in collage should be reduced or cropped to a maximum of 2” high, stroked with a 1.5 pt white frame and positioned edge-to-edge with accompanying images.
Michael Borst
Current Research at EPA’s Urban Watershed Research Facility

1 EPA Bioretention Research May 29, 2008
Acknowledgements Photos, slides, data, results …. have been liberated from
–Swarna Muthukrishnan–Chris Neitch–Tom O’Connor–Amy Rowe
–Ari Selvakumar–Emilie Stander–Scott Struck

2 EPA Bioretention Research May 29, 2008
Agenda• Background on developing the current approach
• Current and future direction with sample data

3 EPA Bioretention Research May 29, 2008
Secret Agenda• Promote collaborative research efforts at the EPA facilities in Edison, New Jersey

4 EPA Bioretention Research May 29, 2008
Nomenclature

5 EPA Bioretention Research May 29, 2008
Nomenclature

6 EPA Bioretention Research May 29, 2008
Definitions• Performance is the ability of a management practice to reduce the stressor load reaching the receiving water.
• Effectiveness is the affect the management practice has on the receiving waters.

7 EPA Bioretention Research May 29, 2008
Initial research questions• How should alternatives be distributed within a watershed?
• What is the performance of the alternatives?• What do the alternatives cost?• How do we maintain the alternatives?

8 EPA Bioretention Research May 29, 2008
A dominant Research questionWhat is the performance of each management alternative?– Effects of loading variation? – Effects of antecedent conditions– Changes with season?– Effects of design options?

9 EPA Bioretention Research May 29, 2008
How we got to where we are . . .Literature Review
• Researchers have published extensively on performance
• The literature has a wealth of information on the performance of management controls
• Often difficult to determine ancillary information
• Reported performance results vary widely

10 EPA Bioretention Research May 29, 2008
Approach 1: Statistics• Document the performance and the conditions of many operating management practices
• Statistical analysis of the performance under range of conditions

11 EPA Bioretention Research May 29, 2008
• BMP Database
http://www.bmpdatabase.org/Docs/BMP%20Database%20History%20&%20Future%20Needs%202004.pdf
Approach 1: Statistics

12 EPA Bioretention Research May 29, 2008
• BMP Database
http://www.bmpdatabase.org/Docs/BMP%20Database%20History%20&%20Future%20Needs%202004.pdf
Approach 1: Statistics

13 EPA Bioretention Research May 29, 2008
http://www.stormcon.com/sw_0205_national.html
http://www.bmpdatabase.org/Docs/Performance%20by%20BMP%20Category%20Oct%202007_Final.pdf
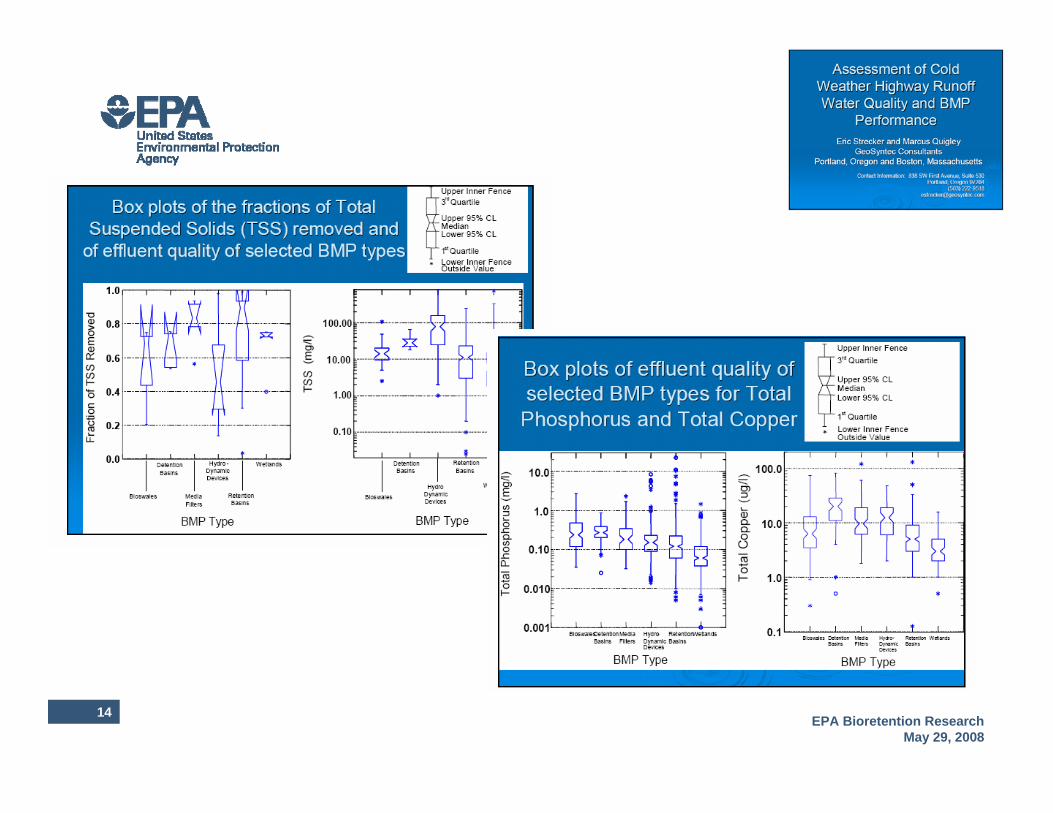
14 EPA Bioretention Research May 29, 2008

15 EPA Bioretention Research May 29, 2008
He uses statistics as a drunken man uses lampposts - for support rather than for illumination. ~Andrew Lang
http
://w
ww
.thew
eew
eb.c
o.uk
“Almost all the current guidelines for swales in the United States and the United Kingdom are founded on the results of a single study….This study [conducted by Washington State Department of Ecology] is the basis for hydraulic residence time requirements, appropriate slopes, and maximum velocities …”
Water Environment Research Foundation, 2004
Post-Project Monitoring of BMPs/SUDS to Determine Performance and Whole-Life Costs
Page A-79

16 EPA Bioretention Research May 29, 2008
Approach 2: Targeted monitoring• Select “Easy to monitor” stormwater controls
–Single inlet–Single outlet–Well-defined drainage area–Inlet and outlet above water
• Select stormwater controls with safe all-season access• Select location with permission for site access

17 EPA Bioretention Research May 29, 2008
Richmond Creek Site 5
http
://w
ww
.bm
pdat
abas
e.or
g/do
cs/U
rban
%20
Sto
rmw
ater
%20
BM
P%
20P
erfo
rman
ce%
20M
onito
ring.
Staten Island, NY

18 EPA Bioretention Research May 29, 2008
• Easy-to-monitor sites for structural management practices are not easy to monitor
• Field installations are not designed to facilitate monitoring
• Infiltration-based approaches are an order of magnitude more difficult.
Preliminary observations

19 EPA Bioretention Research May 29, 2008
Some of the reasons• Field installations are not designed to facilitate monitoring• Climatic uncertainty at the sewershed scale• Site access • Safety (people and equipment)• Vandalism• NPDES sampling requirements• Analytical maximum holding times
• Cost• EMC sampling• Sampler triggers• Flow measurements

20 EPA Bioretention Research May 29, 2008
2.3 Sample Type
http://www.epa.gov/npdes/pubs/dmr-fin.pdf
GUIDANCE MANUAL FOR THE MONITORINGAND REPORTING REQUIREMENTS OF THENPDES MULTI-SECTOR STORM WATERGENERAL PERMIT
Grab samples may be used for all visual, analytical, and compliance monitoring required in the MSGP, except at airports required to conduct analytical monitoring of deicing/anti-icing activities. Such facilities must collect a flow-weighted composite in addition to a grab sample. All grab samples must be collected from the discharge resulting from a storm event greater than 0.1 inches in magnitude and that occurs at least 72 hours from the previously measurable (greater than 0.1 inch rainfall) storm event. The 72-hour storm event interval may be waived where:• the preceding measurable storm event did not result in a measurable discharge from the facility; or• the permittee documents that less than a 72-hour interval is representative for local storm events during the season when sampling is being conducted.

21 EPA Bioretention Research May 29, 2008
http://www.epa.gov/npdes/pubs/dmr-fin.pdf
GUIDANCE MANUAL FOR THE MONITORINGAND REPORTING REQUIREMENTS OF THENPDES MULTI-SECTOR STORM WATERGENERAL PERMIT
All grab samples must be collected from the discharge resulting from a storm event greater than 0.1 inches in magnitude and that occurs at least 72 hours from the previously measurable (greater than 0.1 inch rainfall) storm event.

22 EPA Bioretention Research May 29, 2008
• Field data collection for performance evaluation is expensive, difficult, hazardous, time consuming, and generates uncertain data.
• How to complete statistical replication of a stochastic event?
Preliminary conclusion

23 EPA Bioretention Research May 29, 2008
Approach 3: Build a demonstration site • Introduce a “significant” level of control• Design site for monitoring and instrumentation• Educational outreach / demonstration site• Plan for improved QA/QC• Collaborative opportunities

24 EPA Bioretention Research May 29, 2008
(Internal) Customer feedback
• Office of Water–Size is important–Must look like the element–Long term data is needed
• Buildings and Facilities–Greening the Agency–Demonstration sites needed

25 EPA Bioretention Research May 29, 2008
Driving distance about 6 miles
We are hereWe are here
EPA Edison, NJEPA Edison, NJ

26 EPA Bioretention Research May 29, 2008 G
oogl
e Ea
rth
Permeable Surfaces
Green Roof
UWRFconstructed wetlandswalesrain gardensPermeable pavementpipelines
Edison Environmental Center

27 EPA Bioretention Research May 29, 2008
Swales
Rain Garden
Constructed wetlands
Permeable surface(being installed)
Laboratory space(analytical and engineering)
28 EPA Bioretention Research May 29, 2008
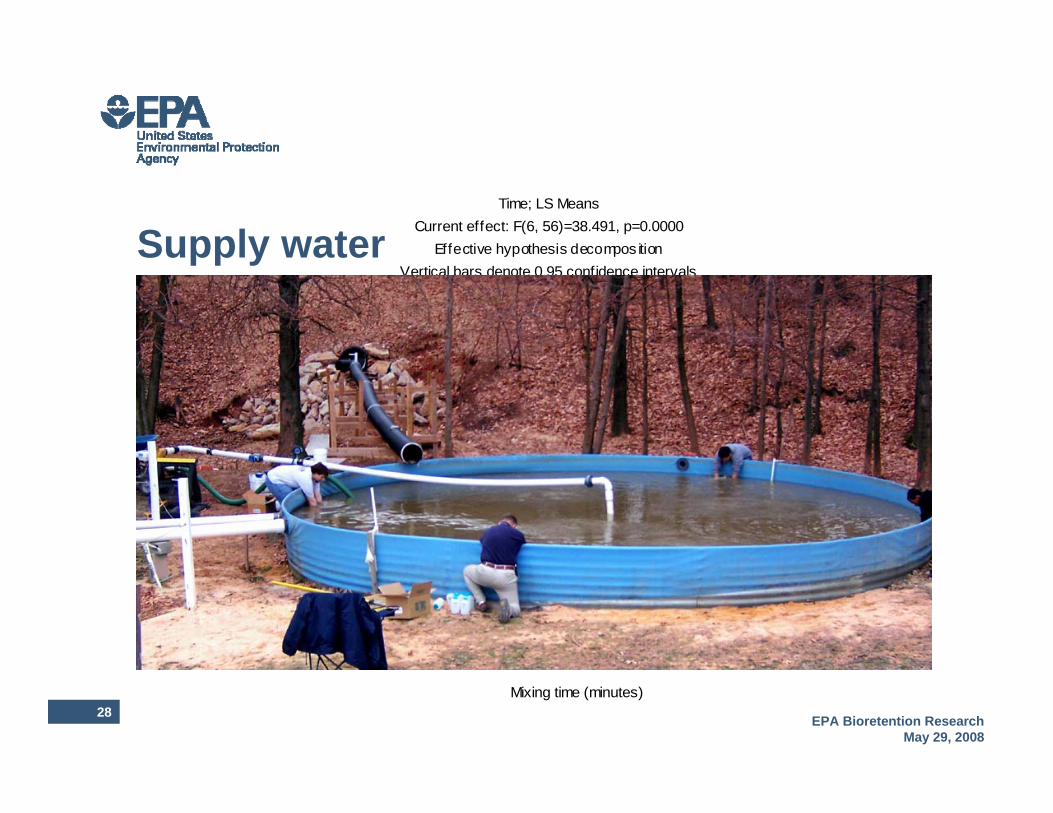
Time; LS MeansCurrent effect: F(6, 56)=38.491, p=0.0000
Effective hypothesis decompos itionVertical bars denote 0.95 confidence intervals
0 30 60 90 120 150 180
Mixing time (minutes)
125
130
135
140
145
150
155
160
165
170
175
180
TSS
(mg/
L)
Supply water

29 EPA Bioretention Research May 29, 2008
Mixing Eductors
1 / unit time
3 / unit time
4 / unit time
Trade pressure for volume
Pump discharge

30 EPA Bioretention Research May 29, 2008
Constructed wetlands
1
54 8 97
12
3
2 10
11
6
Open water wet pondsSynthetic plantsCattails
• Variables–Shape–Loading–Vegetation
• Stressors–Solids–Bacteria–Metals–Nutrients

31 EPA Bioretention Research May 29, 2008

32 EPA Bioretention Research May 29, 2008

33 EPA Bioretention Research May 29, 2008
0
100
200
300
400
500
600
0.00 1.00 2.00 3.00
Elapsed time (min)
Mix
er s
peed
(rpm
)
Mixing characteristics1-min acceleration
4-min at speed
Sample CollectionLabmaster® Mixer in50-gallon container

34 EPA Bioretention Research May 29, 2008
Source(storage tank, supply tank Feed, composite effluent,timed effluent, free water)
Sample(container immersed in Source, numbered sequentially)Subsample
(laboratory homogenization and split of sample, lettered sequentially)
35 EPA Bioretention Research May 29, 2008
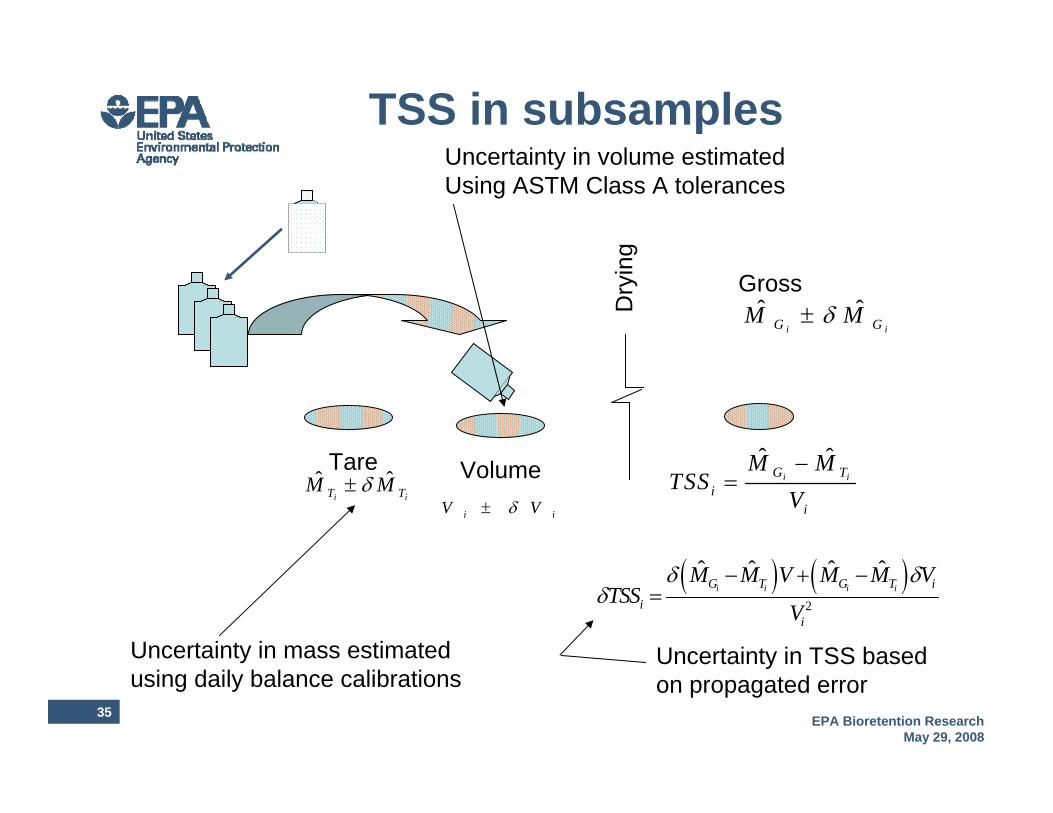
TSS in subsamples
ˆ ˆi iG T
ii
M MTSS
V−
=Tare
i iV Vδ±
Volumeˆ ˆi iT TM Mδ±
( ) ( )2
ˆ ˆ ˆ ˆi i i iG T G T i
ii
M M V M M VTSS
V
δ δδ
− + −=
ˆ ˆi iG GM Mδ±
Gross
Uncertainty in mass estimated using daily balance calibrations
Uncertainty in volume estimated Using ASTM Class A tolerances
Uncertainty in TSS based on propagated error
Dry
ing

36 EPA Bioretention Research May 29, 2008
Estimate of balance variability
7/26 7/27 7/280 0.0000 0.0000 0.00000.5 0.5000 0.5002 0.50021 1.0000 1.0050 1.00045 5.0000 5.0011 5.0008
10 10.0001 10.0008 10.000550 50.0000 50.0057 50.0020
100 100.0000 100.0064 100.0038
a -0.00002 -0.00141 -0.00026b 1.00000 0.99994 0.99996r² 1.00000 1.00000 1.00000std error 0.00004 0.00202 0.00021
Std. Wt.
Indicated Wt.
• Greater of • Least-squares estimate at 95%
level of confidence• ±1.5 least significant digit
0 1W c c W= +
( )2
2( )1 1
2,0.05 ( )ˆ ,1.5W W
N k NY X W WW MAX t S LSDδ −
− −
⎡ ⎤= + +⎢ ⎥∑⎣ ⎦
07/27 data
0
50
100
0 50 100
Indicated weightTr
ue w
eigh
t

37 EPA Bioretention Research May 29, 2008
Note:Uncertainty analysis does not use Markov chain Monte Carlo analysis.
A Markov chain is a sequence of random variables X1, X2, X3, ... with the Markov property, namely that, given the present state, the future and past states are independent. Formally,
The possible values of Xi form a countable set S called the state space of the chain.
Markov chains are often described by a directed graph, where the edges are labeled by the probabilities of going from one state to the other states.

38 EPA Bioretention Research May 29, 2008
Volume uncertainty
• Filtered volume set to reduce problems with filter plugging (per SM).
• Uncertainty estimated as published tolerance of Class A “TD”graduated cylinders
• Uncertainty in V varies with volume • Volume and volume uncertainty have a strong effect on TSS
uncertainty.
0.0
0.5
1.0
1.5
2.0
2.5
3.0
0 200 400 600 800 1000 1200
Sample volume (ml)
Estim
ated
unc
erta
inty
(ml) 2.5
1.30.8
0.4

39 EPA Bioretention Research May 29, 2008
Pooling subsamples into samples
2
1
2
1
/
1 /
SS
SS
i N
i ii
j i N
ii
TSS TSSTSS
TSS
δ
δ
=
==
=
=∑
∑
2
1
1 /SSi N
j ii
TSS TSSδ δ=
=
= ∑NSS subsamples
}
Sample TSS reported as the weighted average of subsample TSS results withassociated pooled uncertainty. (Taylor, 1997)

40 EPA Bioretention Research May 29, 2008
Pooling samples into sources
2
1
2
1
/
1/
S
S
j N
j ji
j N
jj
TSS TSSTSS
TSS
δ
δ
=
==
=
=∑
∑
2
11/
Sj N
jj
TSS TSSδ δ=
=
= ∑
NS samples

41 EPA Bioretention Research May 29, 2008
TSS free-water samples
Blank 1.3352 1.3349 ± 0.0028 1000 ± 2.5 1.3352 1.3349 ± 0.0028 0.0 ± 3.9 ok 3.9LCS P109507 1.3304 1.3299 ± 0.0028 100 ± 0.4 1.3335 1.3330 ± 0.0028 31 ± 39 97 ± 122 32.0 ok 39Free Water MESO 01 1 A 1.3328 1.3323 ± 0.0028 200 ± 0.8 1.3361 1.3356 ± 0.0028 16 ± 20 ok 20Free Water MESO 01 2 A 1.3239 1.3234 ± 0.0028 200 ± 0.8 1.3275 1.3270 ± 0.0028 18 ± 20 20Free Water MESO 02 1 A 1.3436 1.3431 ± 0.0028 500 ± 1.3 1.3444 1.3439 ± 0.0028 1.6 ± 7.8 ok 7.8Free Water MESO 02 2 A 1.3364 1.3359 ± 0.0028 500 ± 1.3 1.3371 1.3366 ± 0.0028 1.4 ± 7.8 7.8Free Water MESO 03 1 A 1.3157 1.3152 ± 0.0028 500 ± 1.3 1.3164 1.3159 ± 0.0028 1.4 ± 7.8 ok 7.8Free Water MESO 03 2 A 1.3237 1.3232 ± 0.0028 500 ± 1.3 1.3244 1.3239 ± 0.0028 1.4 ± 7.8 7.8Free Water MESO 04 1 A 1.3334 1.3329 ± 0.0028 500 ± 1.3 1.3371 1.3366 ± 0.0028 7.4 ± 7.8 ok 7.8Free Water MESO 04 2 A 1.3325 1.3320 ± 0.0028 500 ± 1.3 1.3363 1.3358 ± 0.0028 7.6 ± 7.8 7.8LCS P109507 1.3295 1.3290 ± 0.0028 100 ± 0.4 1.3327 1.3322 ± 0.0028 32 ± 39 100 ± 122 32.0 ok 39Free Water MESO 05 1 A 1.3345 1.3340 ± 0.0028 500 ± 1.3 1.3352 1.3347 ± 0.0028 1.4 ± 7.8 ok 7.8Free Water MESO 05 2 A 1.3239 1.3234 ± 0.0028 500 ± 1.3 1.3243 1.3238 ± 0.0028 0.8 ± 7.8 7.8Free Water MESO 06 1 A 1.3273 1.3268 ± 0.0028 500 ± 1.3 1.3282 1.3277 ± 0.0028 1.8 ± 7.8 ok 7.8Free Water MESO 06 2 A 1.3391 1.3386 ± 0.0028 500 ± 1.3 1.3400 1.3395 ± 0.0028 1.8 ± 7.8 7.8Free Water MESO 07 1 A 1.3282 1.3277 ± 0.0028 500 ± 1.3 1.3294 1.3289 ± 0.0028 2.4 ± 7.8 ok 7.8Free Water MESO 07 2 A 1.3344 1.3339 ± 0.0028 500 ± 1.3 1.3354 1.3349 ± 0.0028 2.0 ± 7.8 7.8Free Water MESO 08 1 A 1.3280 1.3275 ± 0.0028 500 ± 1.3 1.3284 1.3279 ± 0.0028 0.8 ± 7.8 ok 7.8Free Water MESO 08 2 A 1.3324 1.3319 ± 0.0028 500 ± 1.3 1.3327 1.3322 ± 0.0028 0.6 ± 7.8 7.8Free Water MESO 09 1 A 1.3252 1.3247 ± 0.0028 500 ± 1.3 1.3261 1.3256 ± 0.0028 1.8 ± 7.8 4.1 ± 4.7 ok 7.8LCS P109507 A 1.3331 1.3326 ± 0.0028 100 ± 0.4 1.3361 1.3356 ± 0.0028 30 ± 39 94 ± 122 32.0 ok 39Free Water MESO 09 2 A 1.3297 1.3292 ± 0.0028 500 ± 1.3 1.3327 1.3322 ± 0.0028 6.0 ± 7.8 ok 7.8Free Water MESO 09 2 B 1.3330 1.3325 ± 0.0028 425 ± 1.3 1.3350 1.3345 ± 0.0028 4.7 ± 9.2 9.2Free Water MESO 10 1 A 1.3326 1.3321 ± 0.0028 500 ± 1.3 1.3326 1.3321 ± 0.0028 0.0 ± 7.8 ok 7.8Free Water MESO 10 2 A 1.3247 1.3242 ± 0.0028 500 ± 1.3 1.3250 1.3245 ± 0.0028 0.6 ± 7.8 7.8Free Water MESO 11 1 A 1.3320 1.3315 ± 0.0028 500 ± 1.3 1.3335 1.3330 ± 0.0028 3.0 ± 7.8 ok 7.8Free Water MESO 11 2 A 1.3253 1.3248 ± 0.0028 500 ± 1.3 1.3267 1.3262 ± 0.0028 2.8 ± 7.8 7.8Free Water MESO 12 1 A 1.3295 1.3290 ± 0.0028 425 ± 1.3 1.3301 1.3296 ± 0.0028 1.4 ± 9.2 ok 9.2Free Water MESO 12 2 A 1.3453 1.3448 ± 0.0028 500 ± 1.3 1.3457 1.3452 ± 0.0028 0.8 ± 7.8 7.8LCS P109507 1.3329 1.3324 ± 0.0028 100 ± 0.4 1.3362 1.3357 ± 0.0028 33 ± 39 103 ± 122 32.0 ok 39LCS P109507 1.3282 1.3277 ± 0.0028 100 ± 0.4 1.3316 1.3311 ± 0.0028 34 ± 39 106 ± 122 32.0 ok 39
±5.5
5.5±0.3
5.9±1.1
5.5±2.9
1.1
6.0
7.5
1.4
1.5 5.5
5.5±0.7
5.5±
± 5.5
5.5±2.2
1.8
MDL
5.5±
14±
5.5±
±
Gross WeightSubsample
TSS(mg/L)
Sample Weighted Average
TSS (mg/L)
17
LCS Recovery
(%)
SampleVolume
(mL)Source
Sam
ple
Sub
sam
ple Tare weight (g) LCS
TrueValue(mg/L)
Souce Weighted
average TSS (mg/L)
TM ˆTM GM ˆ
GM
Every batch includes blank. No blank showed TSS greater than uncertaintyEvery batch includes LCS. No LCS outside limitsMDL estimated based on volume and ±0.0001 g mass change

42 EPA Bioretention Research May 29, 2008
TSS feed water samples
Blank 1.3501 1.3498 ± 0.0028 1000 ± 2.5 1.3500 1.3497 ± 0.0028 -0.1 ± 3.9 3.9LCS P109507 1.3428 1.3425 ± 0.0028 100 ± 0.4 1.3457 1.3454 ± 0.0028 29 ± 39 91 ± 122 32.0 39Feed MESO 01 1 A 1.3360 1.3357 ± 0.0028 200 ± 0.8 1.3781 1.3778 ± 0.0028 210 ± 20 20Feed MESO 01 2 A 1.3298 1.3295 ± 0.0028 200 ± 0.8 1.3772 1.3769 ± 0.0028 237 ± 20 20Feed MESO 01 2 B 1.3466 1.3463 ± 0.0028 200 ± 0.8 1.3848 1.3845 ± 0.0028 191 ± 20 20Feed MESO 02 1 A 1.3207 1.3204 ± 0.0028 200 ± 0.8 1.3360 1.3357 ± 0.0028 76 ± 20 20Feed MESO 02 2 A 1.3312 1.3309 ± 0.0028 200 ± 0.8 1.3455 1.3452 ± 0.0028 71 ± 20 19.5Feed MESO 03 1 A 1.3464 1.3461 ± 0.0028 500 ± 1.3 1.3621 1.3618 ± 0.0028 31.4 ± 7.9 7.8Feed MESO 03 2 A 1.3384 1.3381 ± 0.0028 500 ± 1.3 1.3526 1.3523 ± 0.0028 28.4 ± 7.9 7.8Feed MESO 04 1 A 1.3295 1.3292 ± 0.0028 500 ± 1.3 1.3435 1.3432 ± 0.0028 28.0 ± 7.9 7.8Feed MESO 04 2 A 1.3314 1.3311 ± 0.0028 500 ± 1.3 1.3440 1.3437 ± 0.0028 25.2 ± 7.9 7.8Feed MESO 05 1 A 1.3334 1.3331 ± 0.0028 500 ± 1.3 1.3463 1.3460 ± 0.0028 25.8 ± 7.9 7.8Feed MESO 05 2 A 1.3200 1.3197 ± 0.0028 500 ± 1.3 1.3328 1.3325 ± 0.0028 25.6 ± 7.9 7.8LCS P109507 1.3461 1.3458 ± 0.0028 100 ± 0.4 1.3493 1.3490 ± 0.0028 32 ± 39 100 ± 122 32.0 39Feed MESO 06 1 A 1.3312 1.3309 ± 0.0028 500 ± 1.3 1.345 1.3448 ± 0.0028 27.8 ± 7.9 7.8Feed MESO 06 2 A 1.3289 1.3286 ± 0.0028 500 ± 1.3 1.342 1.3418 ± 0.0028 26.4 ± 7.9 7.8Feed MESO 07 1 A 1.3359 1.3356 ± 0.0028 500 ± 1.3 1.3490 1.3487 ± 0.0028 26.2 ± 7.9 7.8Feed MESO 07 2 A 1.3392 1.3389 ± 0.0028 500 ± 1.3 1.3530 1.3527 ± 0.0028 27.6 ± 7.9 7.8Feed MESO 08 1 A 1.3377 1.3374 ± 0.0028 500 ± 1.3 1.351 1.3510 ± 0.0028 27.2 ± 7.9 7.8Feed MESO 08 2 A 1.3328 1.3325 ± 0.0028 500 ± 1.3 1.3460 1.3457 ± 0.0028 26.4 ± 7.9 7.8Feed MESO 09 1 A 1.3324 1.3321 ± 0.0028 500 ± 1.3 1.346 1.3456 ± 0.0028 27.0 ± 7.9 7.8Feed MESO 09 2 A 1.3400 1.3397 ± 0.0028 500 ± 1.3 1.353 1.3529 ± 0.0028 26.4 ± 7.9 7.8Feed MESO 10 1 A 1.3379 1.3376 ± 0.0028 500 ± 1.3 1.352 1.3513 ± 0.0028 27.4 ± 7.9 7.8Feed MESO 10 2 A 1.3282 1.3279 ± 0.0028 500 ± 1.3 1.342 1.3413 ± 0.0028 26.8 ± 7.9 7.8LCS P109507 1.3255 1.3252 ± 0.0028 100 ± 0.4 1.329 1.3283 ± 0.0028 31 ± 39 97 ± 122 32.0 39Feed MESO 11 1 A 1.3240 1.3237 ± 0.0028 500 ± 1.3 1.337 1.3370 ± 0.0028 26.6 ± 7.9 7.8Feed MESO 11 2 A 1.3419 1.3416 ± 0.0028 500 ± 1.3 1.355 1.3550 ± 0.0028 26.8 ± 7.9 7.8Feed MESO 12 1 A 1.3391 1.3388 ± 0.0028 500 ± 1.3 1.352 1.3520 ± 0.0028 26.4 ± 7.9 7.8Feed MESO 12 2 A 1.3288 1.3285 ± 0.0028 500 ± 1.3 1.342 1.3419 ± 0.0028 26.8 ± 7.9 7.8Feed CONTROL 1 A 1.3377 1.3374 ± 0.0028 500 ± 1.3 1.35 1.3501 ± 0.0028 25.4 ± 7.9 7.8Feed CONTROL 2 A 1.3437 1.3434 ± 0.0028 500 ± 1.3 1.357 1.3566 ± 0.0028 26.4 ± 7.9 7.8LCS P109507 1.3304 1.3301 ± 0.0028 100 ± 0.4 1.333 1.3331 ± 0.0028 30 ± 39 94 ± 122 32.0 39LCS P109507 1.3380 1.3377 ± 0.0028 100 ± 0.4 1.341 1.3408 ± 0.0028 31 ± 39 97 ± 122 32.0 39Blank 1.3307 1.3304 ± 0.0028 1000 ± 2.5 1.331 1.3303 ± 0.0028 -0.1 ± 3.9 3.9
LCS Recovery
(%)MDL
Sample Volume (mL)
Gross Weight ^
Sample TSS (mg/L)
Subsample Weighted
Average TSS (mg/L)
Source
Sam
ple
Sub
sam
ple Tare weight (g)
±29.9
14±74
14±21412±213
±25.7
5.6±26.6
±26.7
5.6±26.8
±26.9
5.6±27.1
5.6±25.9
5.6±26.6
±26.7
5.6±27.1
5.6
5.6
5.6
5.6
5.6
LCS True
Value(mg/L)
Souce Weighted average TSS
(mg/L)TM ˆTM GM ˆ
GM
Caution flag if difference grater than expected
Example of volume effect on uncertainty

43 EPA Bioretention Research May 29, 2008
TSS composite effluent data
Blank 1.3313 1.3310 ± 0.0028 1000 ± 2.5 1.3312 1.3309 ± 0.0028 -0.1 ± 3.9 ok 3.9LCS P109507 1.3361 1.3356 ± 0.0028 100 ± 0.4 1.3391 1.3388 ± 0.0028 32 ± 39 32.0 ok 101 ± 122 39Coposite Meso 01 1 A 1.3302 1.3297 ± 0.0028 150 ± 0.8 1.3326 1.3323 ± 0.0028 18 ± 26 ok 26Coposite Meso 01 2 A 1.3347 1.3342 ± 0.0028 150 ± 0.8 1.3372 1.3369 ± 0.0028 18 ± 26 ok 26Coposite Meso 01 2 B 1.3301 1.3296 ± 0.0028 150 ± 0.8 1.3325 1.3322 ± 0.0028 18 ± 26 26Coposite Meso 02 1 A 1.3381 1.3376 ± 0.0028 500 ± 1.3 1.3395 1.3392 ± 0.0028 3.3 ± 7.8 ok 7.8Coposite Meso 02 2 A 1.3446 1.3441 ± 0.0028 500 ± 1.3 1.3461 1.3458 ± 0.0028 3.5 ± 7.8 7.8Coposite Meso 03 1 A 1.3400 1.3395 ± 0.0028 500 ± 1.3 1.3440 1.3437 ± 0.0028 8.5 ± 7.8 ok 7.8Coposite Meso 03 2 A 1.3404 1.3399 ± 0.0028 500 ± 1.3 1.3439 1.3436 ± 0.0028 7.5 ± 7.8 7.8Coposite Meso 04 1 A 1.3398 1.3393 ± 0.0028 500 ± 1.3 1.3446 1.3443 ± 0.0028 10.1 ± 7.8 ok 7.8Coposite Meso 04 2 A 1.3434 1.3429 ± 0.0028 500 ± 1.3 1.3481 1.3478 ± 0.0028 9.9 ± 7.8 7.8Coposite Meso 05 1 A 1.3387 1.3382 ± 0.0028 500 ± 1.3 1.3412 1.3409 ± 0.0028 5.5 ± 7.8 ok 7.8Coposite Meso 05 2 A 1.3203 1.3198 ± 0.0028 500 ± 1.3 1.3229 1.3226 ± 0.0028 5.7 ± 7.8 7.8LCS P109507 1.3507 1.3502 ± 0.0028 100 ± 0.4 1.3539 1.3536 ± 0.0028 34 ± 39 32.0 ok 108 ± 122 39Coposite Meso 06 1 A 1.3350 1.3345 ± 0.0028 500 ± 1.3 1.3377 1.3374 ± 0.0028 5.9 ± 7.8 ok 7.8Coposite Meso 06 2 A 1.3434 1.3429 ± 0.0028 500 ± 1.3 1.3462 1.3459 ± 0.0028 6.1 ± 7.8 7.8Coposite Meso 07 1 A 1.3482 1.3477 ± 0.0028 500 ± 1.3 1.3511 1.3508 ± 0.0028 6.3 ± 7.8 ok 7.8Coposite Meso 07 2 A 1.3403 1.3398 ± 0.0028 500 ± 1.3 1.3430 1.3427 ± 0.0028 5.9 ± 7.8 7.8Coposite Meso 08 1 A 1.3536 1.3531 ± 0.0028 500 ± 1.3 1.3572 1.3569 ± 0.0028 7.7 ± 7.8 ok 7.8Coposite Meso 08 2 A 1.3358 1.3353 ± 0.0028 500 ± 1.3 1.3395 1.3392 ± 0.0028 7.9 ± 7.8 7.8Coposite Meso 09 1 A 1.3469 1.3464 ± 0.0028 500 ± 1.3 1.3513 1.3510 ± 0.0028 9.3 ± 7.8 ok 7.8Coposite Meso 09 2 A 1.3337 1.3332 ± 0.0028 500 ± 1.3 1.3382 1.3379 ± 0.0028 9.5 ± 7.8 7.8Coposite Meso 10 1 A 1.3413 1.3408 ± 0.0028 500 ± 1.3 1.3419 1.3416 ± 0.0028 1.7 ± 7.8 ok 7.8Coposite Meso 10 2 A 1.3375 1.3370 ± 0.0028 500 ± 1.3 1.3380 1.3377 ± 0.0028 1.5 ± 7.8 7.8LCS P109507 1.3437 1.3432 ± 0.0028 100 ± 0.4 1.3470 1.3467 ± 0.0028 35 ± 39 32.0 ok 111 ± 122 39Coposite Meso 11 1 A 1.3385 1.3380 ± 0.0028 500 ± 1.3 1.3403 1.3400 ± 0.0028 4.1 ± 7.8 ok 7.8Coposite Meso 11 2 A 1.3463 1.3458 ± 0.0028 500 ± 1.3 1.3480 1.3477 ± 0.0028 3.9 ± 7.8 7.8Coposite Meso 12 1 A 1.3282 1.3277 ± 0.0028 500 ± 1.3 1.3311 1.3308 ± 0.0028 6.3 ± 7.8 ok 7.8Coposite Meso 12 2 A 1.3325 1.3320 ± 0.0028 500 ± 1.3 1.3354 1.3351 ± 0.0028 6.3 ± 7.8 ok 7.8Coposite Meso 12 2 B 1.3443 1.3438 ± 0.0028 500 ± 1.3 1.3471 1.3468 ± 0.0028 6.1 ± 7.8 7.8Coposite Control 1 A 1.3320 1.3315 ± 0.0028 500 ± 1.3 1.3437 1.3434 ± 0.0028 23.9 ± 7.9 ok 7.8Coposite Control 2 A 1.3294 1.3289 ± 0.0028 500 ± 1.3 1.3390 1.3387 ± 0.0028 19.7 ± 7.9 7.8LCS P109507 1.3305 1.3300 ± 0.0028 100 ± 0.4 1.3339 1.3336 ± 0.0028 36 ± 39 32.0 ok 114 ± 122 39LCS P109507 1.3445 1.3440 ± 0.0028 100 ± 0.4 1.3479 1.3476 ± 0.0028 36 ± 39 32.0 ok 114 ± 122 39Blank 1.3271 1.3266 ± 0.0028 1000 ± 2.5 1.3270 1.3267 ± 0.0028 0.1 ± 3.9 ok 3.9
±6.24.5±6.2
5.5±8.0
5.6±21.8
5.5
5.5±3.4
5.5±5.6
5.5±10.0
5.5±6.1
5.5±6.0
5.5±9.4
5.5±7.8
5.5±4.0
5.5±1.6
1818.5±17.9
LCS Recovery
(%)
MDL
15±
Subsample TSS (mg/L)
Sample Weighted Average
TSS (mg/L)
Source
Sam
ple
Sub
sam
ple
Tare weight (g) LCS True
Value (mg/L)
Souce Weighted
average TSS (mg/L)
Sample Volume
(mL)
Gross Weight
TM ˆTM GM ˆ
GM

44 EPA Bioretention Research May 29, 2008
Summary data TSS
1 17 ± 14 213 ± 12 18 ± 15 195 ± 19 92 ± 142 1.5 ± 5.5 74.0 ± 14 3.4 ± 5.5 71 ± 15 95 ± 383 1.4 ± 5.5 29.9 ± 5.6 8.0 ± 5.5 21.9 ± 7.8 73 ± 404 7.5 ± 5.5 26.6 ± 5.6 10.0 ± 5.5 16.6 ± 7.8 62 ± 435 1.1 ± 5.5 25.7 ± 5.6 5.6 ± 5.5 20.1 ± 7.8 78 ± 476 1.8 ± 5.5 27.1 ± 5.6 6.0 ± 5.5 21.1 ± 7.8 78 ± 457 2.2 ± 5.5 26.9 ± 5.6 6.1 ± 5.5 20.8 ± 7.8 77 ± 458 0.7 ± 5.5 26.8 ± 5.6 7.8 ± 5.5 19.0 ± 7.8 71 ± 449 4.1 ± 4.7 26.7 ± 5.6 9.4 ± 5.5 17.3 ± 7.8 65 ± 43
10 0.3 ± 5.5 27.1 ± 5.6 1.6 ± 5.5 25.5 ± 7.8 94 ± 4811 2.9 ± 5.5 26.7 ± 5.6 4.0 ± 5.5 22.7 ± 7.8 85 ± 4712 1.1 ± 5.9 26.6 ± 5.6 6.2 ± 4.5 20.4 ± 7.2 77 ± 43
Control 25.9 ± 5.6 21.8 ± 5.6 4.1 ± 7.9 16 ± 34
Meso(mg/L)
Reduction(%)
#N/A
Freewater Feed Composite
Visually, algae growth

45 EPA Bioretention Research May 29, 2008
Combined effectsReduction (mg/L) =(0.629146)+((0.9901)-(0.00111)*(rise (mm)))*C inf
300 250 200 150 100 50
Model is: Reduction=ao+(a1+a2*(Vro/A))*Cinf Dep. Var. : Reduction (mg/L)Level of confidence: 95.0% ( alpha=0.050)Estimate Standard
errort-valuedf = 102
p-level Lo. ConfLimit
Up. ConfLimit
abc
0.629146 1.811535 0.34730 0.729081 -2.96402 4.2223170.990100 0.019362 51.13609 0.000000 0.95170 1.028505
-0.001107 0.000162 -6.81793 0.000000 -0.00143 -0.000785
( )roin out in
VC C a b c CA
⎡ ⎤− = + +⎢ ⎥
⎢ ⎥⎣ ⎦Implications: • Irreducible concentration < 5 mg/L (a)• Increasing runoff volume
or decreasing area decrease reductions (c)• Nearly all (99±4%) reducible influent
concentration is removable (b)
46 EPA Bioretention Research May 29, 2008
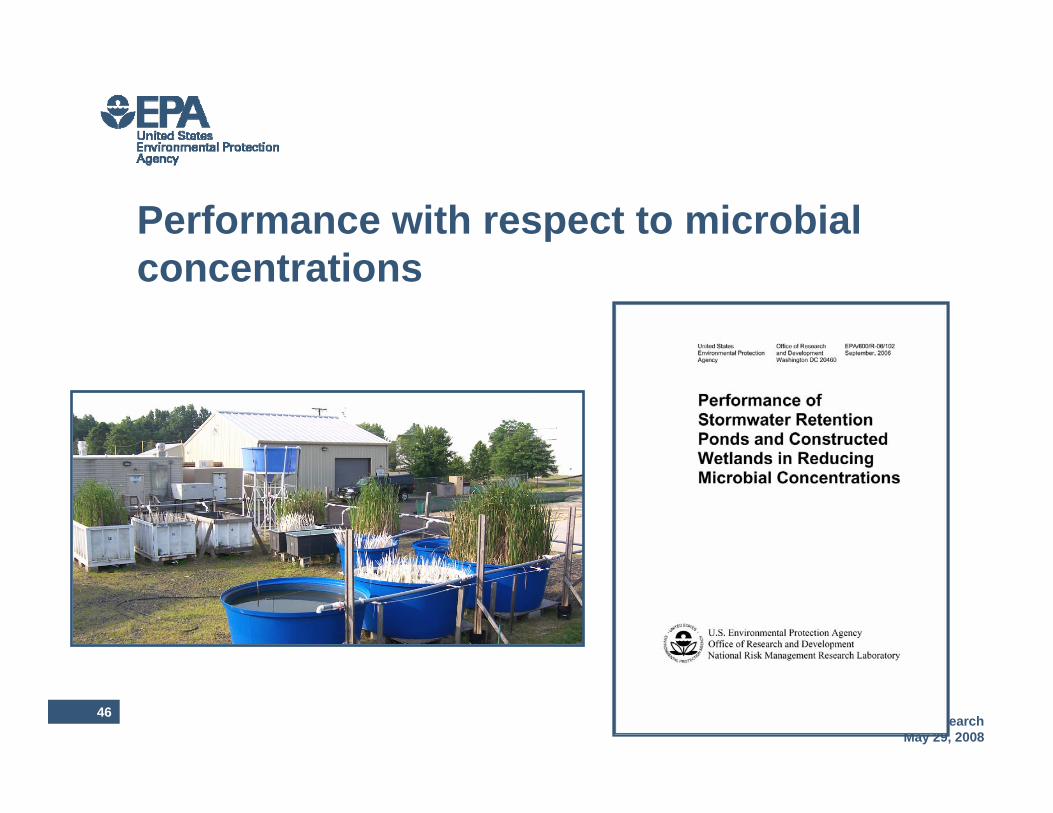
Performance with respect to microbial concentrations
47 EPA Bioretention Research May 29, 2008
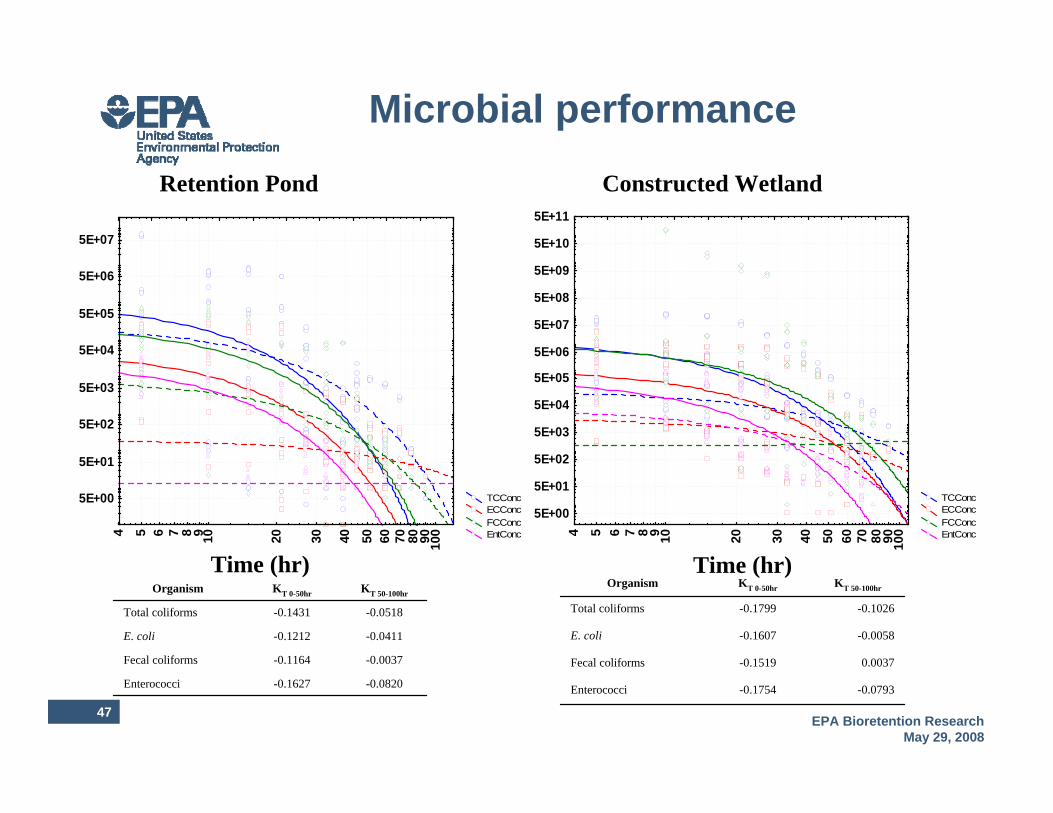
Microbial performance
-0.0820-0.1627Enterococci
-0.0037-0.1164Fecal coliforms
-0.0411-0.1212E. coli
-0.0518-0.1431Total coliforms
KT 50-100hrKT 0-50hrOrganism
TCConc ECConc FCConc EntConc4 5 6 7 8 9 10 20 30 40 50 60 70 80 90 10
0
5E+00
5E+01
5E+02
5E+03
5E+04
5E+05
5E+06
5E+07
5E+08
5E+09
5E+10
5E+11
TCConc ECConc FCConc EntConc4 5 6 7 8 9 10 20 30 40 50 60 70 80 90 10
0
5E+00
5E+01
5E+02
5E+03
5E+04
5E+05
5E+06
5E+07
Retention Pond Constructed Wetland
-0.0793-0.1754Enterococci
0.0037-0.1519Fecal coliforms
-0.0058-0.1607E. coli
-0.1026-0.1799Total coliforms
KT 50-100hrKT 0-50hrOrganismTime (hr) Time (hr)

48 EPA Bioretention Research May 29, 2008
Observations• Decay rates are temperature dependant• Decay rates are light dependant (less important but covariant)
• Wetland plants provide shade• All other factors being equal, greater reductions observed in ponds than constructed wetlands
• Not uniformly first-order decay

49 EPA Bioretention Research May 29, 2008
Metal concentrationsin fluent
Eventco nc . mg/l
e ffl. co nc . mg/l
conc . redn . mg/l
remo va l e ffic ienc y (% )
e ffl. conc . mg/l
co nc . redn. mg/l
removal e ffic iency (% )
A pr A l 0 .6 84 0 .1 13 0 .60 9 8 9 .88 N D 0 .68 4 10 0 .0C u 0 .0 18 0 .0 07 67 0 .01 5 7 .2 0 .00 6 0 .01 2 66 .6F e 1 .6 9 0 .3 86 1 .31 7 6 .95 0 .37 8 1 .32 77 .4 2M n 0 .2 98 0 .1 07 0 .19 6 3 .9 0 .14 8 0 .15 0 50 .3Zn 0 .0 68 0 .0 5 0 .01 83 2 6 .91 0 .05 43 0 .01 4 20 .4 8
June A l 2 .1 8 0 .2 54 1 .93 8 8 .36 0 .13 0 2 .12 97 .1 9C u 0 .0 31 3 0 .0 05 73 0 .02 56 8 1 .67 0 .00 32 0 .02 81 89 .8 1F e 6 .0 6 1 .1 8 4 .88 8 0 .53 1 .38 4 .68 77 .2M n 0 .7 26 0 .4 69 0 .25 7 3 5 .45 0 .52 6 0 .20 0 27 .6Zn 0 .2 33 0 .0 72 8 0 .16 6 8 .7 0 .06 92 0 .16 3 70 .2
A ug A l 2 .8 5 0 .3 4 2 .51 8 7 .98 N D N A 10 0C u 0 .0 38 0 .0 1 0 .02 8 7 4 .61 0 .00 3 0 .03 5 91 .5 5F e 1 7 .1 1 .7 15 .4 8 9 .97 0 .80 4 1 6 .3 95 .2 9M n 0 .3 43 0 .1 44 0 .2 5 8 .12 0 .23 1 0 .11 2 32 .6Zn 0 .3 16 0 .0 91 0 .22 5 7 1 .24 0 .03 4 0 .28 2 89 .3
re tentio n po nd ca tta il w e tland

50 EPA Bioretention Research May 29, 2008
Swales• Three swales• Imbedded instrumentation• Trapezoidal cross section with 4:1 side lopes
• 0.5% to 5% slope• Variable infiltration media• 40-m long in 10-m segments

51 EPA Bioretention Research May 29, 2008
Operational detour

52 EPA Bioretention Research May 29, 2008
Measured flow from electric sump sump
9:07 9:36 10:04 10:33 11:02 11:31 12:00 12:28 12:57
Local time
0
5
10
15
20
25
30
35
40
Flow
rate
(gpm
)
53 EPA Bioretention Research May 29, 2008
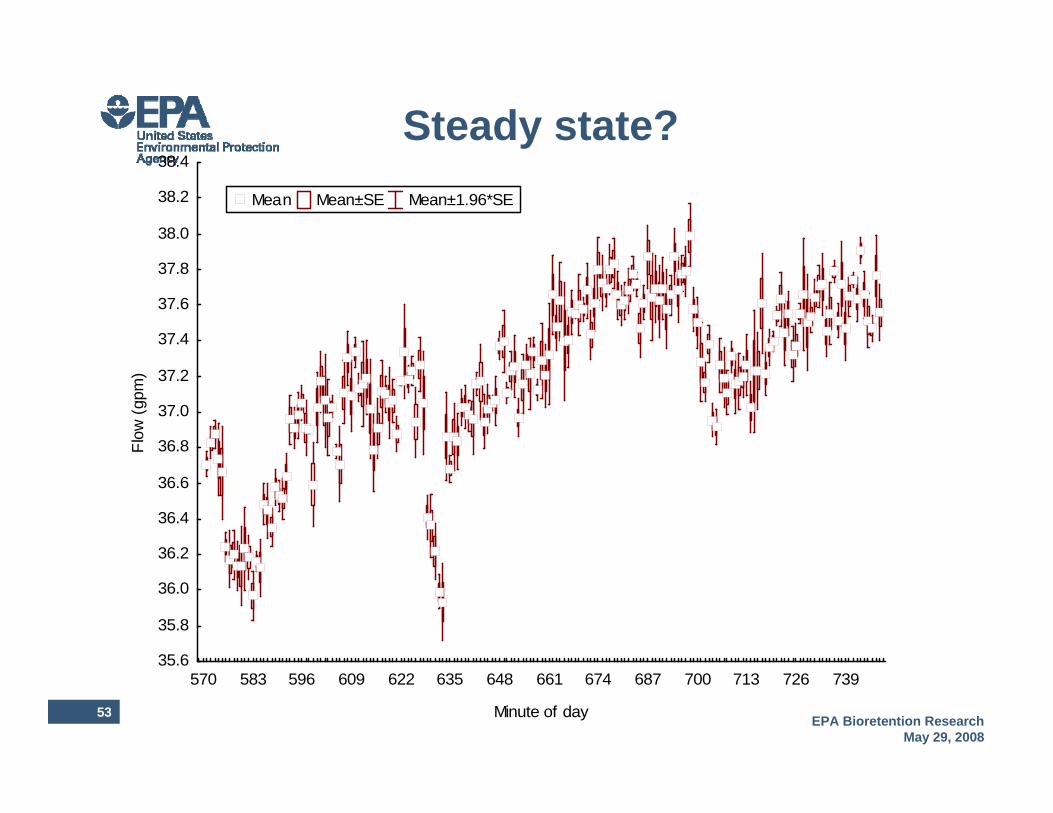
Steady state?
570 583 596 609 622 635 648 661 674 687 700 713 726 739
Minute of day
35.6
35.8
36.0
36.2
36.4
36.6
36.8
37.0
37.2
37.4
37.6
37.8
38.0
38.2
38.4Fl
ow (g
pm)
Mean Mean±SE Mean±1.96*SE
54 EPA Bioretention Research May 29, 2008
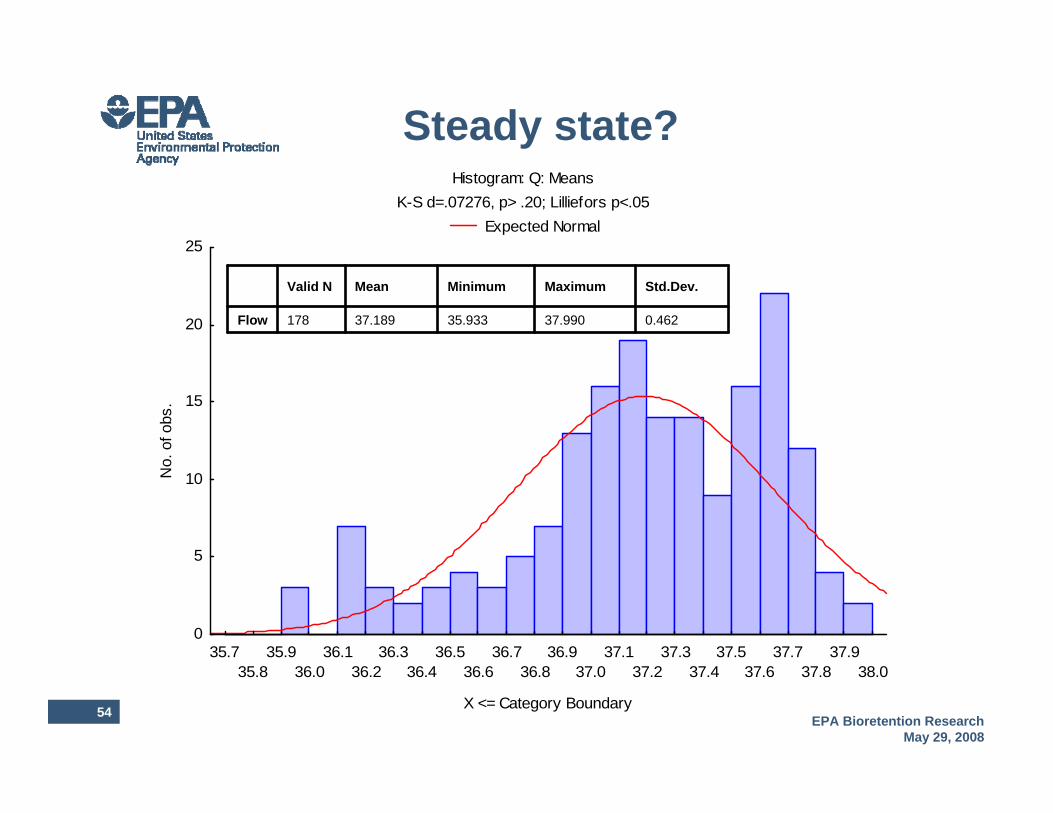
Histogram: Q: MeansK-S d=.07276, p> .20; Lilliefors p<.05
Expected Normal
35.735.8
35.936.0
36.136.2
36.336.4
36.536.6
36.736.8
36.937.0
37.137.2
37.337.4
37.537.6
37.737.8
37.938.0
X <= Category Boundary
0
5
10
15
20
25
No.
of o
bs.
Steady state?
0.46237.99035.93337.189178Flow
Std.Dev.MaximumMinimumMeanValid N

55 EPA Bioretention Research May 29, 2008
R1; LS MeansCurrent effect: F(1, 543)=74241., p=0.0000
Effective hypothesis decompos itionVertical bars denote 0.95 confidence intervals
Q1 Q 2
R1
21.2
21.4
21.6
21.8
22.0
22.2
22.4
22.6
22.8
23.0
23.2
DV_
1 (g
pm)
Feed raterepeated measures ANOVA
22.96 gpm
21.52 gpm
Average 22.24 gpmDifference 1.44 gpm
6.5% RPD

56 EPA Bioretention Research May 29, 2008
R1; LS MeansCurrent effect: F(1, 534)=16170., p=0.0000
Effective hypothesis decompos itionVertical bars denote 0.95 confidence intervals
Q1 Q2
R1
315
316
317
318
319
320
321
322
323
324
DV_
1 (g
pm)
323.0 gpm
316.0 gpm
Average 319.5 gpmDifference 7 gpm
2.2% RPD
Feed raterepeated measures ANOVA

57 EPA Bioretention Research May 29, 2008
Flow depth
8:09 8:38 9:07 9:36 10:04 10:33 11:02 11:31 12:00 12:28 12:57 13:26 13:55
Local Time
30
32
34
36
38
40
42
44
Mea
sure
d D
epth
(cm
)
-4
-2
0
2
4
6
8
10
12
Cha
nge
in d
epth
(cm
)

58 EPA Bioretention Research May 29, 2008
572 584 596 608 620 632 644 656 668 680 692 704 716 728 740
Minute value
6.5
6.6
6.7
6.8
6.9
7.0
7.1
7.2
7.3
Cha
nge
in d
epth
(cm
)
Mean Mean±SD Mean±1.96*SD
0.007.1694620.005465193610.580830.0391831756.857079d3-d3f
pFMSdfSSMSdfSS
Analysis of Variance

59 EPA Bioretention Research May 29, 2008
K-S d=.14586, p<.01 ; Lilliefors p<.01 Expected Normal
6.72 6.74 6.76 6.78 6.80 6.82 6.84 6.86 6.88 6.90 6.92 6.94 6.96 6.98 7.00 7.02 7.04
X <= Category Boundary
0
5
10
15
20
25
30
35
40
45
50
No.
of o
bs. 0.0571437.0304776.7554776.911774176d3-d3f
Std.Dev.MaximumMinimumMeanValid N

60 EPA Bioretention Research May 29, 2008
Repeated Measures Minute value; LS Means
Current effect: F(175, 1936)=8.6745, p=0.0000Effective hypothesis decompos ition
Vertical bars denote 0.95 confidence intervals
572 584 596 608 620 632 644 656 668 680 692 704 716 728 740
Minute value
6.80
6.85
6.90
6.95
7.00
7.05
7.10
7.15
dd3
- dd4
(cm
)
Histogram: DV_1: MeanK-S d=.11466, p<.05 ; Lilliefors p<.01
Expected Normal
6.856.86
6.876.88
6.896.90
6.916.92
6.936.94
6.956.96
6.976.98
6.997.00
7.017.02
7.037.04
7.057.06
7.077.08
X <= Category Boundary
0
5
10
15
20
25
30
No.
of o
bs.
0.0444177.0727086.8727086.998939176DV_1
Std.Dev.MaximumMinimumMeanValid N

61 EPA Bioretention Research May 29, 2008
R1; Unw eighted MeansCurrent effect: F(1, 2618)=.65600, p=.41805
Effective hypothesis decompos itionVertical bars denote 0.95 confidence intervals
dd3 dd4
R1
8.75
8.80
8.85
8.90
8.95
9.00
9.05
9.10
9.15
DV_
1 (c
m)
8.82 cm 8.80 cm
R1; LS MeansCurrent effect: F(1, 2618)=17.093, p=.00004
Effective hypothesis decompos itionVertical bars denote 0.95 confidence intervals
dd1 dd2
R1
8.75
8.80
8.85
8.90
8.95
9.00
9.05
9.10
9.15
DV_
1 (c
m)
8.88 cm
9.04 cm
Upstream Downstream

62 EPA Bioretention Research May 29, 2008
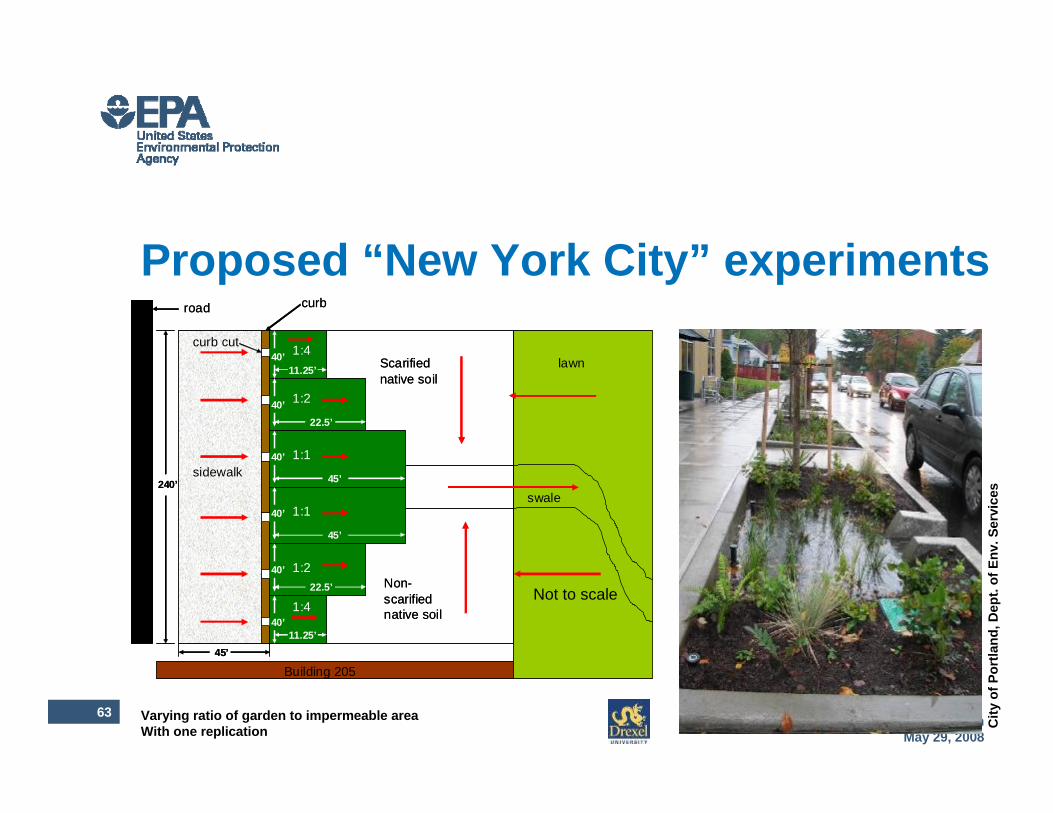
Rain Gardens• Variables
–Vegetation type (grass v. herbaceous)–Organic carbon content of media
(newspaper?)–Hydraulic loading (Q/A)–Induced anoxic zones
• Eight gardens, 8-ft diameter• Underdrain collection
63 EPA Bioretention Research May 29, 2008
City
of P
ortla
nd, D
ept.
of E
nv. S
ervi
ces
Building 205
1:4
1:2
1:1
1:1
1:2
1:4
sidewalk
curb
swale
road
lawnScarified native soil
Non-scarified native soil
240’
45’
curb cut40’
40’
40’
40’
40’
40’
45’
45’
22.5’
22.5’
11.25’
11.25’
Building 205
1:4
1:2
1:1
1:1
1:2
1:4
sidewalk
curb
swale
road
lawnScarified native soil
Non-scarified native soil
240’
45’
curb cut40’
40’
40’
40’
40’
40’
45’
45’
22.5’
22.5’
11.25’
11.25’
Proposed “New York City” experiments
Not to scale
Park
ing
lot
Varying ratio of garden to impermeable areaWith one replication

64 EPA Bioretention Research May 29, 2008
Visit the posters!
Emilie Stander
Amy Rowe

65 EPA Bioretention Research May 29, 2008
• About 1 acre total area• Three permeable surfaces • Impermeable traffic lanes• Some liner & underdrain • About 110 spaces total• Anticipate full use
Permeable pavement
Phase 3 Conceptual Pilot
BH
&A

66 EPA Bioretention Research May 29, 2008
0
10
20
30
40
50
60
70
80
90
100
1 4 7 10 13 16 19 22 25 28 31 34 37 40 43 46 49Time (Days)
TSS
Rem
oval
(Per
cent
Lined #1Lined #2Unlined #1Unlined #2
0.0
0.2
0.4
0.6
0.8
1.0
1.2
1.4
1.6
0 20 40 60 80
Time (Minutes)
Flow
Rat
e (c
m/m
in)
LinedUnlinedInfluent
TSS Removal
Flow Rates
Preliminary data on permeable surfaces

67 EPA Bioretention Research May 29, 2008
Green roof• Builds from existing NRMRL work
–Region 3 & PSU–Region 8 EPA building
• On site –About 15,000 ft² on existing building–Instrumented
• Approached to participate Green Wall demonstration

68 EPA Bioretention Research May 29, 2008
Planned green roof
• Roughly 15,000 ft² flat roof area• Currently in external engineering
review for building structural considerations Paired study with other part of building roof
• Runoff loads (quantity and quality) • Energy use (?)
Goo
gle
Eart
h 20
08

69 EPA Bioretention Research May 29, 2008
Smaller-scale support
Permeable pavement Media comparisonFlume hydraulics

70 EPA Bioretention Research May 29, 2008
On-site lab support• Improves reliability • QA / QC• Holding time!

71 EPA Bioretention Research May 29, 2008
Infiltration Through Disturbed Urban Soils and Compost-amended Soil Effects on Runoff Quality and Quantity
EPA 600/R-00/020, (NTIS PB2000-102012)http://www.epa.gov/ednnrmrl/reports/SR00016/index.html

72 EPA Bioretention Research May 29, 2008
Sandy soilClayey soils
Infiltration Through Disturbed Urban Soils and Compost-amended Soil Effects on Runoff Quality and Quantity
EPA 600/R-00/020, (NTIS PB2000-102012)http://www.epa.gov/ednnrmrl/reports/SR00016/index.html

Office of Research and DevelopmentNational Risk Management Research LaboratoryWater Supply and Water Resources Division
Photo image area measures 2” H x 6.93” W and can be masked by a collage strip of one, two or three images.
The photo image area is located 3.19” from left and 3.81” from top of page.
Each image used in collage should be reduced or cropped to a maximum of 2” high, stroked with a 1.5 pt white frame and positioned edge-to-edge with accompanying images.
Contact information
http://www.epa.gov/ednnrmrl/