Embed Size (px)
Citation preview

Current Practices in Manufacturing of
Ceramic Pot Filters for Water Treatment
by Justine Rayner
A research project report submitted in partial fulfilment of the requirements for the award of the
degree of Master of Science of Loughborough University
August 2009
Advisor: Brian Skinner, BSc, MSc, CEng, MICE
Co-Advisor: Daniele Lantagne, PE
Water, Engineering and Development Centre
Department of Civil and Building Engineering

ii
Dedication
Dedicated to Ron Rivera

iii
Acknowledgements
Thank you, Brian Skinner, advisor extraordinaire and Daniele Lantange, co-advisor extraordinaire,
for all of your support and encouragement. I would like to thank all of the ceramic manufacturers
who participated in this project, for without their enthusiasm, this project would not have been
possible. The members of the Ceramic Filter Manufacturing Working Group have provided input
and encouragement and have made this project fun. Thank you to fellow WEDC students for their
moral and technical support. My friends and family are so good for putting up with me! And of
course, thank you Ron Rivera whose words of encouragement ring in my head “keep doing what
you’re doing, girl”.
iv
Certificate of Authorship
I certify that:
(i) I am responsible for the work submitted in this project report, and that the original work is my
own except as specified below.
(ii) I have not submitted this work to any other institution for the award of a degree
(iii) All work has been carried out by me with no outside assistance except as noted below.
(iv) All information (including diagrams and tables) or other information which is copied from, or
based on, the work of others has its source clearly acknowledged in the text in the place where it
appears.
The Ceramic Filter Manufacturing Working Group held bimonthly phone calls during which topics
regarding filter manufacturing were discussed. Some ideas presented in this report have been
developed from comments made by participants in these discussions.
Signed: _________________________
Date: _________________________

v
Individual Project Access Form
Location: WEDC Resources Centre, Loughborough University
Author: Justine Rayner
Title: Current Practices in Manufacturing of Ceramic Pot Filters for Water Treatment
Status of Access: OPEN
Author’s declaration:
I agree to the following conditions:
This project report shall be made available within the WEDC Resource Centre and may be
borrowed by WEDC staff and students. Pages may be copied, subject to copyright regulations. It
may also be copied by the British Library for supply to requesting libraries and individuals, subject
to a written assurance that it will not be published in part or full.
Author’s signature: _____________________________ Date: ___________________
Conditions of access approved by: ________Brian H. Skinner_______________
Supervisor’s signature: ____________________________________

vi
Table of Contents
Dedication.......................................................................................................................................... ii
Acknowledgements .......................................................................................................................... iii
Certificate of Authorship .................................................................................................................. iv
Individual Project Access Form.......................................................................................................... v
Table of Contents.............................................................................................................................. vi
List of Figures.................................................................................................................................... xi
List of Tables ..................................................................................................................................... xi
List of Photos ................................................................................................................................... xii
Acronyms .........................................................................................................................................xiv
1 Introduction ..............................................................................................................................1
1.1 Global Need for Access to Safe Water .............................................................................1
1.2 Water Quantity.................................................................................................................2
1.3 Water Quality ...................................................................................................................3
1.4 Assessing Water Quality...................................................................................................3
1.5 Drinking Water Quality Guidelines...................................................................................4
1.6 Household Water Treatment and Safe Storage ...............................................................5
1.7 Ceramic Filters..................................................................................................................6
1.8 Background to this Project ...............................................................................................6
1.9 Aim ...................................................................................................................................7
1.10 Research Questions..........................................................................................................7
1.11 Structure of this Report....................................................................................................7
2 Background ...............................................................................................................................9
2.1 History of the Pot Filter ....................................................................................................9
2.1.1 How Pot Filters are Made ..........................................................................................10
2.1.2 The Evolution of the Pot Filter ...................................................................................12
2.2 Variables in Manufacturing ............................................................................................13
3 Literature Review....................................................................................................................15
3.1 Introduction....................................................................................................................15
3.2 Methodology ..................................................................................................................15
3.3 Field Studies ...................................................................................................................15
3.3.1 Introduction ...............................................................................................................15
3.3.2 Microbiological Effectiveness ....................................................................................16

vii
3.3.3 Filter Life Span............................................................................................................17
3.3.4 Diarrhoeal Reduction .................................................................................................17
3.3.5 Filter Disuse................................................................................................................18
3.4 Comparison of Production Procedures ..........................................................................19
3.4.1 Introduction ...............................................................................................................19
3.4.2 Clay.............................................................................................................................19
3.4.3 Burn-out Material ......................................................................................................20
3.4.4 Mixing.........................................................................................................................20
3.4.5 Pressing, Touching-up & Drying.................................................................................21
3.4.6 Firing...........................................................................................................................22
3.4.7 Flow Rate Tests ..........................................................................................................24
3.4.8 Silver Application .......................................................................................................25
3.4.9 Additional Quality Control .........................................................................................26
3.4.10 Packaging ...................................................................................................................26
3.5 How Ceramic Pot Filters Work .......................................................................................27
3.5.1 Introduction ...............................................................................................................27
3.5.2 Physical Characteristics and Mechanisms..................................................................27
3.5.3 Flow Rate....................................................................................................................29
3.6 Silver ...............................................................................................................................32
3.6.1 Introduction ...............................................................................................................32
3.6.2 Application Methods..................................................................................................33
3.7 Virus Removal.................................................................................................................34
3.8 Metallic Compounds ......................................................................................................34
3.9 Summary ........................................................................................................................34
4 Methodology...........................................................................................................................36
4.1 Introduction....................................................................................................................36
4.2 Sample Group.................................................................................................................36
4.3 Data Collection Methodology ........................................................................................36
4.4 Survey Design .................................................................................................................37
4.5 Survey Implementation..................................................................................................38
4.6 Limitations......................................................................................................................38
4.7 Data Analysis ..................................................................................................................39
5 Results.....................................................................................................................................41
5.1 Introduction....................................................................................................................41

viii
5.2 Survey Distribution.........................................................................................................41
5.3 Study Participants and General Characteristics .............................................................42
5.4 Factory Set-Up................................................................................................................44
5.4.1 Equipment..................................................................................................................44
5.4.2 Water .........................................................................................................................45
5.4.3 Electricity....................................................................................................................46
5.5 Materials.........................................................................................................................46
5.5.1 Clay.............................................................................................................................46
5.5.2 Burn-out Material ......................................................................................................47
5.5.3 Additional Materials...................................................................................................48
5.6 Mixing.............................................................................................................................48
5.7 Forming Filter Elements .................................................................................................51
5.7.1 Presses .......................................................................................................................51
5.7.2 Moulds .......................................................................................................................52
5.8 Trimming ........................................................................................................................54
5.9 Drying .............................................................................................................................54
5.10 Firing...............................................................................................................................55
5.10.1 Kilns ............................................................................................................................55
5.10.2 Fuel.............................................................................................................................56
5.10.3 Measuring Temperature ............................................................................................57
5.11 Silver ...............................................................................................................................59
5.11.1 Silver Types ................................................................................................................59
5.11.2 Water Quality.............................................................................................................59
5.11.3 Silver Application Methods and Concentrations .......................................................60
5.11.4 Silver Sensitivities.......................................................................................................61
5.12 Quality Control ...............................................................................................................61
5.12.1 Visual Inspections.......................................................................................................61
5.12.2 Auditory Inspections ..................................................................................................62
5.12.3 Pressure (Crack) Tests ................................................................................................62
5.12.4 Flow Rate Testing.......................................................................................................62
5.12.5 Bacteriological Testing ...............................................................................................64
5.12.6 Failed Filters ...............................................................................................................65
5.12.7 Filter Logs ...................................................................................................................66
5.12.8 Failure Rates...............................................................................................................67

ix
5.13 Materials & Packaging....................................................................................................68
5.13.1 Receptacles ................................................................................................................68
5.13.2 Packaging ...................................................................................................................69
5.13.3 Operation and Maintenance......................................................................................70
5.14 Health and Safety ...........................................................................................................71
5.14.1 Materials Processing ..................................................................................................71
5.14.2 Mixing and Pressing ...................................................................................................72
5.14.3 Firing...........................................................................................................................72
5.14.4 Silver...........................................................................................................................72
6 Analysis and Discussion...........................................................................................................73
6.1 Introduction....................................................................................................................73
6.2 Methodology ..................................................................................................................74
6.2.1 Survey.........................................................................................................................74
6.2.2 Reliability of Data.......................................................................................................74
6.3 Discussion of Results ......................................................................................................75
6.3.1 Materials and Processing ...........................................................................................75
6.3.2 Pressing and Drying....................................................................................................78
6.3.3 Kilns and Firing ...........................................................................................................79
6.3.4 Silver...........................................................................................................................80
6.3.5 Quality Control...........................................................................................................81
6.3.6 Microbiological Testing ..............................................................................................82
6.3.7 Filter Logs and Failure Rates ......................................................................................83
6.3.8 Health and Safety.......................................................................................................84
6.4 Lessons Learned, Recommendations and Further Research .........................................84
6.4.1 Introduction ...............................................................................................................84
6.4.2 Lessons Learned.........................................................................................................85
6.4.3 Recommendations .....................................................................................................86
6.4.4 Recommended Research ...........................................................................................88
7 Conclusions and Recommendations .......................................................................................90
8 Glossary...................................................................................................................................94
9 References ..............................................................................................................................96
10 Appendices............................................................................................................................100
Appendix 1 Ceramics Filter Manufacturing Working Group .........................................................100
Appendix 2 Filter Factories Contacted and Participating Factories...............................................101

x
Appendix 3 Tyler Mesh Equivalent ................................................................................................102
Appendix 4 Temperature Chart .....................................................................................................103
Appendix 5 Survey .........................................................................................................................104
Appendix 6 Survey Data.................................................................................................................105

xi
List of Figures
Figure 2-1 Ceramic Pot Filter ...........................................................................................................10
Figure 2-2 Filter Production Flow Chart...........................................................................................11
Figure 2-3: Illustrations of Filter Shapes ..........................................................................................12
Figure 2-4 Production Variables ......................................................................................................14
Figure 3-1 Example of Heat Flow in a Down-draft Kiln....................................................................24
Figure 3-2 Example of Heat Flow in an Up-draft Kiln ......................................................................24
Figure 3-3 Pressure "Crack" Test .....................................................................................................26
Figure 3-4 Variation in Flow Rate ....................................................................................................30
Figure 5-1 Filter Factory Locations ..................................................................................................41
Figure 5-2 Monthly Filter Production ..............................................................................................43
Figure 5-3 CWF Retail Prices ............................................................................................................44
Figure 5-4 Clay Mesh Sizes...............................................................................................................47
Figure 5-5 Burn-out Mesh Sizes.......................................................................................................47
Figure 5-6 Drying Time Ranges ........................................................................................................54
Figure 5-7 Drying Times ...................................................................................................................55
Figure 5-8 Filters Cracked per Kiln-load (%).....................................................................................59
Figure 5-9 Flow Rate Ranges............................................................................................................63
List of Tables
Table 1-1 Drinking Water Requirements ...........................................................................................2
Table 1-2 Water Quality Risk Levels ..................................................................................................4
Table 3-1 Filter Mixture Ratios ........................................................................................................20
Table 5-1 Participating Factories .....................................................................................................42
Table 5-2 Factory Equipment...........................................................................................................45
Table 5-3 Clay-Rice Husk Mixture ....................................................................................................48
Table 5-4 Clay-Sawdust Mixture......................................................................................................49
Table 5-5 Mixing Times (all manual)................................................................................................50
Table 5-6 Mixing Times (all electric) ................................................................................................50
Table 5-7 Mixing Times (manual/electric) .......................................................................................50
Table 5-8 Mould and Filter Sizes......................................................................................................53
Table 5-9 Kilns..................................................................................................................................56

xii
Table 5-10 Firing Practices...............................................................................................................58
Table 5-11 Colloidal Silver Applied by Painting ...............................................................................60
Table 5-12 Colloidal Silver Applied by Dipping ................................................................................60
Table 5-13 Filter Effluent Testing.....................................................................................................65
Table 5-14 Filter Log Details ............................................................................................................67
Table 5-15 Filter Log Items ..............................................................................................................67
Table 5-16 Failure Rates ..................................................................................................................68
List of Photos
Photo 1-1 Ceramic Pot Filter..............................................................................................................6
Photo 2-1 Filter Press.......................................................................................................................10
Photo 2-2 Example of Carbon Line in Filter Walls ...........................................................................13
Photo 3-1 Wedging Filter Mixture ...................................................................................................21
Photo 3-2 Filters Drying ...................................................................................................................22
Photo 3-3 Stacked Kiln.....................................................................................................................22
Photo 3-4 Cone Block.......................................................................................................................23
Photo 3-5 Calibrated "T" Device ......................................................................................................24
Photo 5-1 Pug Mill ...........................................................................................................................44
Photo 5-2 Mixing Dry Materials in a Drum Mixer, Myanmar ..........................................................50
Photo 5-3 Mixing in a Mortar Mixer, Nicaragua..............................................................................50
Photo 5-4 Manual Mixing, adding water to filter mixture, Colombia .............................................50
Photo 5-5 Filter Press with aluminium mould, Indo-2.....................................................................52
Photo 5-6 Filter Press with cast-iron mould, Cam-1........................................................................52
Photo 5-7 Filter Press with wood mould, Myanmar........................................................................52
Photo 5-8 Filter Press with cement mould, DR................................................................................52
Photo 5-9 Mani Kiln .........................................................................................................................55
Photo 5-10 Filters Stacked for Firing, Myanmar..............................................................................56
Photo 5-11 Kiln being Fired, Cam-1 .................................................................................................56
Photo 5-12 Kiln and Fired Filters, Yemen ........................................................................................56
Photo 5-13 Experimenting with Alternative Fuel Sources, Colombia .............................................57
Photo 5-14 Soaking Filters ...............................................................................................................62
Photo 5-15 Packaged Filters, Myanmar...........................................................................................69
Photo 5-16 Packaging Filters, Nicaragua .........................................................................................69
Photo 5-17 Packaging Filters, Honduras..........................................................................................69

xiii
Photo 5-18 Cleaning Instructions, Colombia ...................................................................................71
Photo 6-1 Filters, DR-1.....................................................................................................................73
Photo 6-2 Filter, Myanmar...............................................................................................................73
Photo 6-3 Filter, Indo-2....................................................................................................................73
Photo 6-4 Clay Mine in the Rainy Season ........................................................................................75
xiv
Acronyms
ARC American Red Cross
AFA Asociación Guatemalteca para la Familia de las Américas
(Families of the Americas Foundation)
Cfu Coliform Forming Units
CS Colloidal Silver
CWF Ceramic Water Filter
HWTS Household Water Treatment and Safe Storage
ICAITI Instituto Centroamericano de Investigación y Tecnología
(Central American Institute of Research and Technology)
IDE International Development Enterprises
INGO International Non-governmental Organisation
LRV Log Reduction Value
NGO Non-governmental Organisation
PFP Potters for Peace
POU Point of Use Water Treatment
PPM Parts per Million
RADWQ Rapid Assessment of Drinking Water Quality
RDI – C Resource Development International - Cambodia
SODIS Solar Water Disinfection
TC Total Coliform
TTC Thermo-tolerant Coliform
UN United Nations
UNICEF United Nations Children’s Fund
(formerly United Nations International Children’s Emergency Fund)
UV Ultra Violet
VIP Vocational Incentive Program
WEDC Water, Engineering and Development Centre
WHO World Health Organization

1
Current Practices in Manufacturing of Ceramic Pot Filters for Water Treatment
1 Introduction
1.1 Global Need for Access to Safe Water
There are an estimated 4 billion cases of diarrhoea annually (WHO 2009c). Despite being largely
preventable and treatable, every year 1.8 million people die from diarrhoeal diseases (WHO
2009b). Eighty-eight percent (88%) of these deaths are attributed to unsafe water supply,
inadequate sanitation and poor hygiene (WHO 2009b). Diarrhoea accounts for an estimated 4.1%
of the total Disability Adjusted Life Years (DALYs)1 global burden of disease (WHO 2009a). The
many secondary effects can include poor nutrient absorption, contributing to malnutrition and
impaired physical growth and cognitive development, decreased schooling, missed work days and
increased medical expenses.
The Millennium Development Goals (MDGs) were established to focus efforts and track progress
towards the United Nations Millennium Declaration to eradicate extreme poverty. Eight goals, 21
targets and 60 indicators were established to measure progress towards this aim (UN 2009a). Goal
7, target C is to “halve, by 2015, the proportion of people without sustainable access to safe
drinking water and basic sanitation”. The indicator used to measure sustainable access to safe
drinking water is the “proportion of population using an improved drinking water source” (UNICEF
2009). It has been estimated that access to improved water supply can reduce diarrhoea morbidity
by 21% (WHO 2009b). For a water source to be considered ‘improved’, it must provide at least 20
litres of water per person per day and be located within 1 kilometre of the user’s home. It can
include a household connection, public standpipe, borehole, protected well, spring or rainwater
harvesting system.
Although progress monitoring suggests that the world is on the way to meeting the goal for access
to safe drinking water (UN 2009b), what is being measured is improved water supply. Although
having access to an improved water supply is important and provides many health and non-health
benefits, it is not necessarily indicative of having access to safe water. Many piped water supplies
in urban areas of developing countries are intermittent, and along with breaks in the system, can
introduce microbiological and other contaminants into the water being distributed. Other
1 DALYs are used to evaluate and prioritise public health concerns. They represent a sum of the number of
years lost by premature mortality and the number of years of healthy life lost due to less than full health or
disability.

2
Current Practices in Manufacturing of Ceramic Pot Filters for Water Treatment
improved water sources such as protected springs or wells can also become faecally
contaminated. A Rapid Assessment of Drinking Water Quality report (RADWQ 2006) found that
31% of water samples taken from boreholes in six pilot countries exceeded both WHO guideline
values and the national drinking water standards in those countries for faecal contamination
(UNICEF 2008). In addition, contamination of water during collection and storage is well
documented. A systematic meta-analysis of 57 studies which measured bacteria both at the
source and in water stored in the home found that in over half the studies there was significant
contamination after collection and the decline in water quality stored in the home was greater
where the source water was largely uncontaminated (Wright et al. 2004). A comparison of 30 trials
to assess the effectiveness of interventions to improve water quality, found that household
interventions were more effective than source interventions at preventing diarrhoea (Clasen et al.
2006).
1.2 Water Quantity
Basic domestic water quantity needs can be divided into categories including water for drinking,
cooking, hygiene, and other domestic purposes, including productive uses. Availability of sufficient
water quantity close to the home is important for health, hygiene and quality of life; however,
water quality is of primary importance when discussing drinking water. Drinking water needs can
vary according to the water content of food consumed, manual labour performed and climatic
conditions. In addition, men, children and women have varying needs. Even among women, needs
vary when pregnant or lactating. In Table 1-1 suggested daily water requirements for hydration
are presented. Since diets vary it is difficult to estimate the amount of fluid obtained from food.
The following estimates are for hydration requirements, including fluid obtained from food.
Table 1-1 Drinking Water Requirements
Average
Conditions
(litres)
Manual labour or
in high
temperatures
Pregnant or
Lactating
Adult Female 2.2 4.5 4.5 or 5.5
Adult Male 2.9 4.5
Children 1.0 4.5
(adapted from: (Howard and Bartram 2003: 7))

3
Current Practices in Manufacturing of Ceramic Pot Filters for Water Treatment
1.3 Water Quality
Water can be contaminated both chemically and microbiologically. Of primary concern in efforts
to reduce mortality and morbidity caused by infectious disease is the microbiological quality of
water. Pathogens transmitted through contaminated drinking water include pathogenic bacteria
(ranging about 0.5-3.0 microns in size), viruses (0.02-0.1 micron), protozoa (3.0-30 microns) and
helminths (ova are about 45 microns). Although diarrhoeal disease can be transmitted through
drinking water, it can also be transmitted via other faecal-oral routes. Transmission pathways
include consumption of contaminated food or drinks, poor sanitation and poor personal hygiene.
Since water quality alone may not interrupt transmission of diarrhoea, interventions often include
increased water quantity, improved water quality, improved sanitation and the promotion of
health and hygiene practices.
1.4 Assessing Water Quality
Due to the difficulty of monitoring water for specific contaminants, water is examined for the
presence of indicator organisms associated with faecal contamination. Commonly used indicator
organisms (organisms used to measure treatment effectiveness) include total coliforms (TC),
thermo-tolerant coliforms or faecal coliforms (TTC) and E. coli. Criteria for indicator bacteria as
outlined by the World Health Organisation (WHO) (2006: 142) are that they should be:
• universally present in high numbers in human or other warm-blooded animal faeces
• readily detectable by simple methods
• should not grow in natural water
Some coliforms can grow and survive in water and are often present in the absence of faecal
contamination. Therefore, the ‘total’ coliform count is not useful as an index of faecal
contamination, however, it can be useful as an indicator of treatment effectiveness (WHO 2006:
283). Thermo-tolerant coliforms are those of the total coliform group which are able to ferment
lactose at 44-45°C. E. coli is often the predominant thermo-tolerant organism and is rarely found
in the absence of faecal contamination. For this reason, E. coli is slightly more reliable as an
indicator bacteria, however, other thermo-tolerant coliforms are also acceptable (WHO 2006:
284).
Although E. coli has been established as the most suitable indicator by the WHO, it is also noted
that the absence of E. coli does not ensure water safety since some pathogens are more resistant
to some disinfectants. Therefore “verification may require analysis of a range of organisms, such

4
Current Practices in Manufacturing of Ceramic Pot Filters for Water Treatment
as intestinal enterococci, (spores of) Clostridium perfringens and bacteriophages” (WHO 2006:
142).
In contrast to E. coli which are gram-negative bacteria, intestinal enterococci are gram-positive,
which have a thicker cell wall. Intestinal enterococci are primarily of faecal origin and can be used
as an index of faecal contamination. Clostridium perfringens are also gram-positive and resistant to
UV irradiation, temperature, pH extremes and disinfection processes (WHO 2006: 288). Due to
their long survival times, they are not recommended for routine monitoring; however, they may
be useful indicators for filtration effectiveness. C. perfringens should be removed by filtration
processes designed to remove enteric viruses or protozoa (WHO 2006: 289). Bacteriophages
(phages) are viruses which use bacteria as hosts and share many characteristics with enteric
viruses. They are useful models to assess behaviour, sensitivity to treatment and disinfection,
however, they are not necessarily reliable as an index for faecal contamination since viruses have
been found in water which tested negative for phages. There are two main types of phages:
Somatic and F-RNA, the latter is better both as an index of faecal contamination and indicator for
virus behaviour (WHO 2006: 289-291).
1.5 Drinking Water Quality Guidelines
Since different exposure levels might affect populations differently, the probability of infection is
difficult to estimate based on water quality. The WHO guideline is that E. coli or thermo-tolerant
coliform bacteria should not be detectable in any 100-ml sample of drinking water (WHO 2006:
143), however risk levels can be evaluated using a classification system for the microbiological
quality of water presented in Table 1-2 (WHO 1997: 78).
Table 1-2 Water Quality Risk Levels
Number of Thermotolerant (faecal) coliforms or
E. coli per 100 ml water sample
0 Conforms to WHO guidelines
1-10 Low Risk
10-100 Intermediate Risk
100-1000 High Risk
1000+ Very High Risk

5
Current Practices in Manufacturing of Ceramic Pot Filters for Water Treatment
1.6 Household Water Treatment and Safe Storage
Household water treatment and safe storage systems (HWTS) are increasingly being promoted in
both development and emergency contexts to improve the quality of drinking water and reduce
exposure to water-borne pathogens. HWTS have been found to reduce the number of diarrhoeal
episodes by 45% (WHO 2009b). Although for some the current evidence does not support the
health benefits claimed and is not sufficient to justify the widespread promotion of HWTS
(Schmidt and Cairncross 2009), others suggest that there is “conclusive evidence that simple,
acceptable, low-cost interventions at the household and community level are capable of
dramatically improving the microbial quality of household stored water and reducing the
attendant risks of diarrhoeal disease and death” (Sobsey 2002: 2-3). In 2003, sponsored by the
World Health Organization, an International Network to Promote Household Water Treatment and
Safe Storage was formed with the aims of accelerating reliable access to safe drinking water by
promoting advocacy, communication, research and implementation of HWTS systems. The
network now has a membership of over 100 organisations and is moving into phase two, the
scaling-up of HWTS implementation (HWTSNetwork 2009).
A comprehensive review of household water storage and treatment options identified ceramic
filtration, chlorination with improved storage, solar disinfection, thermal disinfection and
combination systems using chemical coagulation-flocculation, sedimentation, filtration and
chlorination as the most promising, accessible and effective means of improving the
microbiological quality of water (Sobsey 2002).
In a critical examination of five of the most effective and widely promoted technologies,
(chlorination with safe storage, combined coagulant-chlorine disinfection systems, SODIS2, ceramic
filter and the bio-sand filter), household ceramic and bio-sand water filters were identified as
having the greatest potential as effective, affordable and sustainable ways of improving drinking
water quality (Sobsey et al. 2008). The ranking system and assigning of scores in this analysis have
been criticised, and attention has been called to the omission of important sustainability criteria
such as consumer preference, economic considerations, cultural practices and variations in water
quality (Lantagne, Meierhofer et al. 2009). However, in an analysis of 30 trials, filtration also
appeared to offer the most consistent and effective results among household interventions
(Clasen et al. 2006).
2 SODIS, Solar Water Disinfection, uses solar UV-A radiation and temperature to inactivate pathogens. Plastic
PET bottles are filled with water and placed in the sun for a number of hours.

6
Current Practices in Manufacturing of Ceramic Pot Filters for Water Treatment
Although ceramic filtration has shown promising results, no single HWTS will be appropriate in all
situations, therefore interventions need to be evaluated relative to specific circumstances. An
appropriate HWTS technology ought to have certain technical characteristics including the ability
to improve and maintain the microbiological quality of water, to treat a variety of water sources
(or a specific water source) and to treat sufficient water to meet a family’s drinking water needs.
In addition, it should be both culturally and socially acceptable, relatively easy to use, affordable,
have a reliable supply chain and not negatively affect the taste of the water.
1.7 Ceramic Filters
Ceramic filtration is a common form of household water treatment in many parts of the world.
Several types of both industrially made and locally-produced ceramic filters are currently available
on the market and being promoted. Industrially produced ‘candle’ filters include brand names
such as: Katadyn, Stephani, Pozzani, and Doulton. Candle filters are also produced locally in Africa
and Cambodia, among other places. Disc filters currently being produced include the TERAFIL
(India) and Thimi (Nepal). One of the most widely available
locally-produced ceramic water filters, the subject of this study,
is the colloidal silver enhanced ceramic ‘pot’ filter promoted by
Potters for Peace (PFP). This low-tech, low-cost technology is
currently being manufactured in at least 18 countries by local
artisans using primarily locally available materials and local skills
and labour. Despite being a recommended form of HWTS,
“further efforts are needed to define and implement
appropriate manufacturing procedures and product
performance characteristics of these filters in order to achieve
products of acceptable quality that are capable of adequate
microbe reductions from water” (Sobsey 2002: 33).
1.8 Background to this Project
In February of 2009, 76 people attended the first International Conference on Ceramic Pot Filters
in Atlanta, GA, USA. Responding to recommendations that minimum standards in filter production
be established, the Ceramics Filter Manufacturing Working Group was formed including members
of government, academia, non-governmental organisations and filter manufacturers (for a
complete list, see Appendix 1). The goal of this working group is to “provide guidance to assist
Photo 1-1 Ceramic Pot Filter
(PottersforPeace 2009)

7
Current Practices in Manufacturing of Ceramic Pot Filters for Water Treatment
filter factories in producing the lowest-cost, most-effective ceramic filters possible” by
summarizing existing knowledge on ceramic filter production, the effects of production variables,
identifying lessons learned from existing filter factories, making recommendations on how to
produce the lowest-cost, most-effective filters, and identifying needs for further research
(CFMWG 2009). The main output objective is a document which outlines minimum recommended
standards in the production of ceramic pot filters. The report from the Ceramics Filter
Manufacturing Working Group will describe the variation in filter manufacturing and evaluate and
make best practice recommendations to minimize production variables which impact filter efficacy
without adversely influencing aspects such as production cost, breakage, environmental impact,
end-user requirements and health and safety standards.
1.9 Aim
The aim of this project was to identify the various filter factories worldwide and to survey and
document existing production practices to provide data that will help the Ceramics Filter
Manufacturing Working Group make appropriate manufacturing recommendations, which are
expected to help filter factories improve the quality of filters being produced.
1.10 Research Questions
1. What are the current production procedures at the various ceramic water filter factories?
2. What are some of the lessons learned and where are recommendations needed in the
production process?
3. What is known about some of the manufacturing variables which affect the microbiological
efficacy of the filters?
4. What further research is needed in order to make recommendations for standardisation or
best practice?
1.11 Structure of this Report
This report is divided into nine sections. In the Introduction (1) the global need for access to safe
water, HWTS and ceramic filters are introduced and the background to this project, including the
aim and research questions are presented. In Section 2, Background, the history and evolution of
the pot filter, an overview of the manufacturing process of ceramic water filters and some
manufacturing variables which affect the filter are discussed. In the Literature Review (3),
literature on field studies which have been carried out on the filters, a comparison of filter
production procedures from available production manuals or guidelines, and lastly the physical

8
Current Practices in Manufacturing of Ceramic Pot Filters for Water Treatment
characteristics and mechanisms by which the filter works are reviewed. The methods used in
carrying out this project, including the development and implementation of the survey, are
detailed in Section 4, Methodology. Results from the survey are detailed in Section 5. In Section 6,
the results of both the literature review and survey are discussed, lessons learned presented and
recommendations and further research needs are outlined. In Section 7, Conclusions and
Recommendations, a summary and review of this project and recommendations for future
research work are presented. There is a Glossary at the end of the report. Several Appendices
follow, including a copy of the survey and the data collected from participating factories.

9
Current Practices in Manufacturing of Ceramic Pot Filters for Water Treatment
2 Background
2.1 History of the Pot Filter
The colloidal silver ceramic pot water filter was developed in Guatemala by Dr. Fernando
Mazariegos during a study financed by the World Bank/Inter American Bank, to evaluate ten
models of low-cost domestic water filters (ICAITI 1980). The ten models were evaluated on the
following criteria:
• Filtration flow
• Bacteriological efficiency
• Ease of manufacture
• Availability of materials
• Final cost
• Contribution to artisan activity
• Ease of distribution
Prototypes of two filter models which met the above criteria, a clay filter with feldspar, sand and
colloidal silver and a clay filter with sand, sawdust, and colloidal silver, were made and evaluated
for tolerance of the filters to vary in proportions of ingredients, types of wood, colloidal silver
application methods and the influence of colloidal silver on the bacteriological removal efficiency.
The criteria for evaluation were microbiological efficacy and filtration rate. The design used today
has evolved from the clay, sand, sawdust and colloidal silver impregnated ceramic water filter
‘thrown’ on a potter’s wheel.
In 1999, in response to the devastating effects of Hurricane Mitch, Potters for Peace (PFP)
established a ceramic water filter factory in Nicaragua. In an effort to increase standardisation and
ease of production, Potters for Peace designed a press with a mould, based on the filter designed
by Dr. Mazariegos, to press filters rather than ‘throwing’ them on a potter’s wheel. Since then,
Potters for Peace has been providing technical assistance with the establishment of filter factories
and the manufacturing of ceramic water filters around the world.

10
Current Practices in Manufacturing of Ceramic Pot Filters for Water Treatment
2.1.1 How Pot Filters are Made
The Potters for Peace colloidal silver-enhanced ceramic pot water
filter is a slightly conical shaped pot with a rim and a flat-bottom. It
rests on the rim of a receptacle or bucket fitted with a tap for
dispensing filtered water. Source water is poured into the filtering
element and filters through at a rate of 1-3 litres an hour. If the
source water is especially turbid, it is recommended that water be
strained through a pre-filter or cloth. A lid is placed on top as a cover.
Filter elements are made by mixing a pre-established ratio of clay
and burn-out material, which can be sawdust, rice husks or other
agricultural waste. Both the clay and the burn-out material are milled
and sifted to ensure quality and consistency of particle size. Dry
materials are mixed before water is added. Once mixed, clay balls or cubes are formed, placed in a
mould, and pressed into the filter shape using a hydraulic car jack.
The pressed filter is stamped with a serial number which is used to
trace the filter throughout the manufacturing process and
eventually to its final destination. The filtering element is dried
slowly to prevent cracking and then fired in a kiln. After the filter
has been fired and cooled the flow rate of each filter is tested.
Filters are first soaked to ensure they are fully saturated, then filled
with water. The amount of water which filters through the filter in
the first hour is the ‘flow rate’. The low end of the flow rate range
of one litre per hour is to ensure the filter can treat enough water
to meet a family’s drinking water needs. Filters which flow beyond
the maximum flow rate might have larger pores or internal cracks
which may allow pathogens to pass through. The fast flow rate will also reduce contact time with
colloidal silver which is thought to be important for the deactivation of bacteria. Filters also pass
visual and auditory inspections for cracks, deformities or other defects. Filters which do not pass
flow rate tests or inspection are considered unsuitable or unsafe and are therefore broken and
discarded to prevent future use. Filters which pass both the flow rate test and inspections are
dried and coated with colloidal silver. Once dry, they are packaged for sale with a lidded
receptacle, a tap, and an instructional sticker. General filter production process is outlined in the
Filter Production Flow Chart in Figure 2-2.
Figure 2-1 Ceramic Pot Filter
(PottersforPeace 2009)
Photo 2-1 Filter Press
(Rayner 2006)

11
Current Practices in Manufacturing of Ceramic Pot Filters for Water Treatment
Figure 2-2 Filter Production Flow Chart
Filter Production Flow Chart
Key:
Delay Terminator Process Decision Alternate
Process
Prepare clay:
mill and sieve
Prepare burn-out
material: mill if
necessary and sieve
Mix dry
Ingredients
Add water
gradually
Mix further
Form cubes and wedge
mixture for pressing
Press filter
Allow filter to air
dry a little
Trim filter: remove bag lines,
roughen or smooth sides, stamp
filter
Allow filter to air dry
slowly and thoroughly
Visual
Inspection
Prepare any
additional
ingredients
Destroy filters
that don’t pass
Stack filters in kiln
and fire kiln
Allow kiln and
filters to cool
Soak filters
Test flow
rate
Allow filter to
dry fully
Prepare silver
solution and apply to
each filter
Allow filter to
dry
Package filter
for sale
Visual
inspection
Auditory
inspection
Destroy filters that
don’t pass

12
Current Practices in Manufacturing of Ceramic Pot Filters for Water Treatment
2.1.2 The Evolution of the Pot Filter
One of the primary advantages of this technology is that it is made from locally available raw
materials and its ease of manufacture makes it easily transferable to places with a source of clay
and a tradition of pottery. Currently there are more than 30 filter factories world-wide, producing
filters in countries in Central and South America, the Caribbean, Africa and Asia.
Each of the filter factories world-wide has adapted the manufacturing process to some extent to
meet local conditions, using local knowledge, materials and experience. Because of this, there are
variances from factory to factory including mould size, burn-out material, types of silver and
application methods, materials processing, firing temperatures and quality control measures. In
addition to the PFP mould shape, other filter shapes have been designed and some manufacturing
processes modified.
In 2003, a semi-spherical mould was designed by the NGO Thirst-Aid (then known as the
Vocational Incentive Program or VIP) to address issues such as secondary contamination from
placing the flat-bottomed filter on potentially contaminated surfaces, increasing filter capacity,
programme development costs and ease of manufacture. Over 10,000 of these filters were
produced in Thailand supported by VIP. Thirst-Aid is now working in Myanmar as Quality
Assurance Monitors for eight filter factories which produce a variation of this semi-spherical filter.
Silver nitrate is used instead of colloidal silver (Thirst-Aid 2009a).
Potters for Peace Thirst Aid3 Filter Pure
Figure 2-3: Illustrations of Filter Shapes
(Hernandez 2009)
3 This filter is slightly more parabolic than depicted in the illustration. It is designed to have both the correct
diameter to fit locally made receptacles and a 10 litre capacity.

13
Current Practices in Manufacturing of Ceramic Pot Filters for Water Treatment
Another filter shape, an oblong, round-bottomed filter and
a new press were designed by Manny Hernandez and
implemented at factories in the Dominican Republic in
2006 and Tanzania in 2008. Filter Pure, the exclusive buyer
of these filters, has implemented other changes to the
filter making process including firing colloidal silver into
the filters and leaving a carbon residual within the walls of
the filters (Ballantine and Hawkins 2009).
In addition to the existing PFP, Thirst-Aid and Filter Pure factories, factories have just been set up
or feasibility studies are underway in at least six countries (PottersforPeace 2009). With the scaling
up of decentralised ceramic pot filter factories underway, it is important that variables in
production which affect the quality of the filter are defined and evaluated.
2.2 Variables in Manufacturing
The flow rate (see Section 2.1.1) of each filtering element is used as a primary form of quality
control once a filter mixture formula has been established and effectiveness confirmed with
microbiological testing. There are many variables in the manufacturing process which are
considered to influence the flow rate and/or effectiveness of the filtering element including the
type of clay (particle size, distribution, sand content and plasticity), the burn-out material (type
and size, humidity of burn-out material), the clay to burn-out ratio, the amount of water added to
the mixture, the manufacturing method (moulded by hand, pressed, wheel thrown), drying time
and conditions, firing temperature, time and location in kiln, size of the filtering element, capacity
and the thickness of the filter. The many variables in the manufacturing of ceramic pot filters are
presented in the mind-map in Figure 2-4. They are organised into six sections: Materials, Silver,
Filter Production, Firing & Kilns, Quality Control, and Delivery. These topics will serve as chapters
in the working group’s report. In addition, six cross-cutting themes are presented: microbiological
efficacy, end-user considerations, breakage, cost, health and safety and environmental impact.
The development of the mind-map is further discussed in Section 4.4.
Photo 2-66 Example of Carbon Line in
Filter Walls
(Source: Unknown)

14
Current Practices in Manufacturing of Ceramic Pot Filters for Water Treatment
Figure 2-4 Production Variables

15
Current Practices in Manufacturing of Ceramic Pot Filters for Water Treatment
3 Literature Review
3.1 Introduction
As mentioned in Section 2, there are more than 30 filter factories world-wide. Although based on
the same principles and methods, manufacturing processes have been adapted to meet local
circumstances. With the promotion of this technology, it is important that local variations do not
adversely affect filter performance. This literature review is divided into three sections: 1) findings
from field studies; 2) comparison of production manuals; and, 3) the physical characteristics of the
filter and how it works, as well as some of the studied effects of variables on the filter. Additional
findings on production procedures were obtained from the interviews and questionnaires, and are
presented and discussed in Section 5 and Section 6.
3.2 Methodology
Literature pertaining to ceramic water filter production and filter effectiveness was collected from
a variety of sources and reviewed. Searches were carried out on Loughborough University’s
MetaLib database using key words including: “ceramic water filter”, “potters for peace”, “point of
use water treatment”, “household water treatment”, “water quality”, and “appropriate
technology”. In addition, searches were carried out both on Google and Google Scholar using
similar keywords. The Water, Engineering and Development Centre (WEDC) database of
conference papers was also searched. References from other reports and studies were reviewed
and searches were carried out for specific articles of interest. Various filter manufacturers’
websites were checked for additional information and reports pertaining to the subject. Articles
were solicited and shared among various members of the Ceramic Filter Manufacturing Working
Group. Literature was also reviewed in the process of establishing appropriate methods to carry
out this research.
3.3 Field Studies
3.3.1 Introduction
In this section findings from field studies carried out in Nicaragua, Ghana, Guatemala and three
studies in Cambodia are presented. These field trials have shown the effectiveness of ceramic pot
filters at improving water quality in the field, regardless of manufacturing location and variables.
Virus removal is discussed in Section 3.7. In addition, several studies suggest that ceramic filters
16
Current Practices in Manufacturing of Ceramic Pot Filters for Water Treatment
have an impact on reducing diarrhoea in users versus non-users and that they are acceptable to
users. Primary reasons for disuse are breakage of the element or tap.
3.3.2 Microbiological Effectiveness
Several field trials carried out in different countries have found ceramic pot filters to be effective
at improving the quality of drinking water and in reducing diarrhoea. A study carried out in three
regions of Guatemala reported that ninety-one percent (91%) of the filtered water tested was free
of faecal coliforms (AFA 1995). In Nicaragua, water quality analysis was performed on 24 filters in
seven communities. Of 15 homes that had E. coli in their source drinking water, eight (53%) tested
negative for E. coli after filtration (Lantagne 2001b). In Cambodia, water quality tests were carried
out after 1,000 ceramic filter pots were distributed (Roberts 2004) and results showed that after
up to one year in use, 99% of the filters produced water falling into a ‘low-risk’ range of fewer than
10 E. coli per 100mL (see Section 1.5 on Water Quality Guidelines). It was also concluded that the
source water quality did not seem to affect the efficacy of the filter. Another field trial in
Cambodia (Brown and Sobsey 2006), with 80 test and 80 control households, found that filters in
the field reduced E. coli by a mean of 98% and as much as 99.99%. Filters in this trial were in use
for up to four years. Yet another field study in Cambodia (Brown et al. 2008) with 120 test and 60
control households, found that the filters reduced E. coli by a mean of 96%, with 60% falling within
the low risk range of fewer than 10 E. coli/100 ml. In comparison, 85% of control households had
greater than 101 cfu/100ml in their drinking water (high risk). In Ghana, household surveys and
water quality analyses were carried out in over 60 traditional households in 2006 and 2007
(Johnson et al. 2008). Filters in Ghana were found to reduce E. coli by 99.7%. Average E. coli
detected were fewer than 10 cfu/100ml, falling within the ‘low risk’ range.
Suggestions have been made as to why several of the field trials found filtered water with
increased amounts of E. coli in comparison to the source water. In Nicaragua, seven homes (out of
24) had increased total coliforms in filtered water and some had increased E. coli (Lantagne
2001b). In Cambodia, 5% had greater concentrations of E. coli in treated than in stored water
(Brown et al. 2008). Another study in Cambodia, 46 of 79 filters (58%) had negative log reduction
values and 11% of those were confirmed on multiple visits (Brown and Sobsey 2006). Researchers
have suggested that contamination of the receptacle or filtering element occurred during cleaning.
This is a reasonable explanation since post contamination has been documented as a widespread
occurrence (Wright et al. 2004). Lantange (2001b) observed that the homes where filtered water
tested positive for E. coli were less clean than the other homes in the study. In the Cambodia trial,

17
Current Practices in Manufacturing of Ceramic Pot Filters for Water Treatment
both boiled and filtered water had similar declines in water quality after treatment. In addition,
users reported cleaning filtering elements with cloths and 29% reported cleaning the receptacle
with raw (untreated) water. Brown and Sobsey (2006) also suggested that the stored water might
not be from the same source as the filtered water, or it could have been stored under conditions
which improved its microbiological characteristics.
3.3.3 Filter Life Span
Filter replacement has been typically recommended at 1-2 years since little research has been
carried out to indicate otherwise. A field study in Cambodia did not find a relationship between
time in use and microbiological effectiveness, suggesting that filters can remain effective for up to
four years and possibly longer (Brown and Sobsey 2006). Roberts (2004) found that after nearly
one year in use fewer filters removed all E. coli, yet they still produced water of ‘low risk’ quality or
better. Campbell (2005) found that filters collected from the field after five years of use when
tested in a laboratory were successful at removing 100% of E. coli.
A recent laboratory study (Bielefeldt et al. 2009) two approximately four year old filters from the
field were tested alongside filters with limited laboratory use and found that while filters achieved
a 3-4 log reduction for the first batch of E. coli spiked water (10⁶ CFU/ml) regardless of their
history, removal efficiency reduced with each spiked batch. In addition, when filled with clean
water, indicator bacteria not only re-suspended in the filtering element, but passed through into
the effluent water. A re-application of colloidal silver reduced this; however, the field filters’
removal efficiency was not sustained, indicating that perhaps the colloidal silver did not adhere as
well to the ceramic after years of field use. This study in conjunction with reported increased E.
coli in effluent water in the field is worrying. When compared with the drinking water of control
groups in the field, however, the quality of filtered drinking water is significantly better (Brown
and Sobsey 2006; Brown et al. 2008).
3.3.4 Diarrhoeal Reduction
Field studies on the ceramic water filter have also reported significant reduction in diarrhoea.
Roberts (2004) found that 17-20% more households reported no diarrhoea in test groups than
control groups. Also, there were half as many cases of diarrhoea per person, filter owners had
one-half to one-third of treatment expenses and 4-5 times fewer work/school days missed than
non-filter users. In Cambodia, filter users reported a 49% reduction in diarrhoea versus non-filter
users in one study (Brown et al. 2008) and a 46% reduction in another (Brown and Sobsey 2006).

18
Current Practices in Manufacturing of Ceramic Pot Filters for Water Treatment
In Guatemala, 50% fewer cases of diarrhoea were reported in children under five years of age (AFA
1995). In Ghana, filter users in traditional households were 70% less likely to have diarrhoea
(Johnson et al. 2008). There are several transmission routes for diarrhoea causing pathogens,
therefore awareness and health and hygiene education might also play a role in reducing the
number of diarrhoeal episodes in filter users. The reliability of self reported diarrhoea as an
indicator has been called into question, however, as it is a subjective outcome measure and may
be misleading (Schmidt and Cairncross 2009).
3.3.5 Filter Disuse
Regardless of any technology’s ability to improve water quality, it must also be acceptable to the
user as compliance is important for health gains. There are many factors which can contribute to
the disuse of any intervention, but with the ceramic pot filters, breakage seems to be a primary
cause. In a Cambodian field trial where filters were distributed for free, 20% disuse was reported
for filters up to one year post implementation. Of those who reported not using the filter
anymore, 71% was due to the tap breaking and 20% due to the element (pot) breaking. In this
case, replacement elements were not available, so replacing the filter was not an option. Other
reasons for discontinued use included: preferring boiled water, too busy or unwilling to clean the
filter, belief that their water does not need to be treated, or that the filter did not treat sufficient
water (Roberts 2004). Interestingly, more than 1/3 of the households reported having enough
water for additional uses. In Nicaragua (Lantagne 2001b), the flow rate in 14 of the 24 households
was inadequate to provide sufficient drinking water for the family. The recommendation was
made to scrub the filters to regenerate the flow rate (Lantagne 2001b), which has since been
incorporated into general operation and maintenance instructions. The reader is referred to
Section 3.5.3 for further discussion on flow rates.
Another Cambodian field trial (Brown and Sobsey 2006) documented a 2% per month disuse rate.
Of this 2%, 65% of disuse was due to breakage of the element, container or tap. An additional 5%
stopped using the filter because it was too slow and didn’t meet their drinking water needs. Five
percent (5%) stopped using the filter because it had exceeded its recommended useful life.
Continued use was associated with, most importantly, time since implementation but also user
investment, water source, access to sanitation and water, and sanitation and hygiene awareness.
High user compliance is suggested by a field trial in Cambodia (Brown et al. 2008) where 100% of
respondents reported that they used filtered water for all of their drinking water needs and 86%

19
Current Practices in Manufacturing of Ceramic Pot Filters for Water Treatment
reported using filtered water for drinking water only. In another field trial in Cambodia (Roberts
2004), 95% of users reported that they were satisfied with the filters, that the filtered water tasted
good, the filter was easy to maintain and was important to the family because of health benefits
and eliminating the need to boil water. In Ghana (Johnson et al. 2008), users reported that filters
worked well, were easy to use and that they would recommend them to others, in addition, non-
users surveyed were interested in using filters.
3.4 Comparison of Production Procedures
3.4.1 Introduction
During this research the author tried to locate all published and unpublished production manuals.
Production manuals have been published for two filter factories in Cambodia, Resource
Development International - Cambodia (RDI-C) (Hagan et al. 2009), and International Development
Enterprises (IDE) (IDE 2008). In addition, a manual was written for the set-up of a factory in Iraq
(Nardo 2005), for the Nicaragua facility (Rayner 2006), and a general manual was drafted by Ron
Rivera (Rivera 2006). The following sub-sections compare the manufacturing procedures described
in each of these documents. Information collected on production practices at other factories
during this research is presented and discussed in Sections 5 and 6.
3.4.2 Clay
Clay suitable for other pottery production should be suitable for making filters (Hagan et al. 2009),
however, plasticity is particularly important as 50-60% non-plastic (burn-out) material is added to
the clay (Rivera 2006). Clay should have an acceptable level of plasticity, rate of dry shrinkage, and
after firing, acceptable rates of total shrinkage and absorption (Nardo 2005). RDI-C gets its clay
from a local brick factory in the form of air-dried, unfired, extruded bricks. In the RDI-C, IDE,
Nicaragua and Iraq manuals, dry clay is first crushed by hand and then milled in a hammer mill. At
IDE the hammer mill screen has 1 mm openings, equivalent to 16 mesh4 (see Appendix 3 for a
chart on Tyler Mesh Equivalents). RDI-C does not indicate a screen size, but notes that grinding
clay to a powder is sufficient. Rivera’s manual, the Nicaragua manual and the Iraq manual suggest
sieving the milled clay through a 30 mesh (about 0.55mm opening, see Appendix 3) kitchen sieve
to ensure the removal of non-clay particles, including sand and organic matter, to ensure the
4 The mesh number represents how many openings there are per linear inch in a screen or sieve using the
Tyler Mesh Equivalent.

20
Current Practices in Manufacturing of Ceramic Pot Filters for Water Treatment
purity of the clay. Clay which does not pass through the sieve the first time can be re-milled and
re-sieved (Rayner 2006).
3.4.3 Burn-out Material
Burn-out material, such as sawdust, rice husks, or other agricultural by-product is added to the
clay to create the required porosity of the fired element, which affects the flow rate of the filters.
The material can vary depending on local availability (Rivera 2006). Both of the Cambodia factories
use rice husks which have a high silica content. At IDE the rice husks are sifted with a 16 mesh
sieve. The manual notes that there is no control of particle sizes smaller than 1 mm. At RDI-C, rice
husks from the supplier are approximately 1 mm in size; however, the formula is adjusted
according to the estimated particle size, using less rice husk by weight if they appear larger. Rivera
(2006) recommends sifting burn-out material to a 30 mesh, however both the Nicaragua and Iraq
manuals describe using a standard wire mosquito netting which is about an 8 mesh (about 2.4 mm
openings).
3.4.4 Mixing
The proportion of clay to burn-out material and water varies depending on the local clay and is
adjusted until the appropriate filtration rate in the fired elements is reached (Rivera 2006).
Nicaragua, IDE and Iraq use only clay, water, and a burn-out material in their mix. At RDI-C,
laterite5 is an optional addition which is thought to add viral binding sites to the filter aiding in
virus removal (Hagan et al. 2009). Since the laterite increases porosity, the amount of rice husk in
the formula is reduced (Hagan et al. 2009). Filter mixture formulae are detailed in Table 3-1.
Table 3-1 Filter Mixture Ratios
Factory Clay Burn-out Type Water Laterite
RDI-C 30 kg 8.2 kg Rice husk 12.5 2 kg
30 kg 9.5 kg Rice husk 12.5 L
IDE 26 kg 8 kg Rice husk 10 L
Nicaragua 24 kg 2.5 kg Sawdust 10 L
Iraq 60 (vol) 40 (vol) Rice husk 30% (weight)
Dry materials are mixed at IDE for eight minutes. Water is added in two amounts with four
minutes mixing time after each addition. At RDI-C clay and burn-out material are measured by
5 Laterite is a soil layer consisting of several minerals including goethite, an iron-oxide. Laterite and goethite
are used interchangeably in this document.

21
Current Practices in Manufacturing of Ceramic Pot Filters for Water Treatment
weight and water by volume. Mixing is for ten minutes dry and ten minutes wet. Water is added
gradually using an automated mixing system. At the Nicaragua facility, clay and burn-out are
measured by weight and water is measured by volume. Dry ingredients are mixed for ten minutes.
Water is added gradually and mixed for an additional ten minutes to ensure a homogenous
mixture. In Iraq, thorough mixing of dry materials, measured by volume, is recommended before
adding water, measured by weight, to the mix.
3.4.5 Pressing, Touching-up & Drying
Clay is removed from the mixer and formed into balls
or cubes the appropriate size for the specific mould
(Rayner 2006). This process includes wedging6 the clay
to remove any air bubbles and ensure a homogenous
mixture (Nardo 2005). IDE has both a screw press and a
hydraulic press, each require a different amount of clay
due to the amount of pressure applied and the amount
of clay ejected. The screw press uses 8.8 kg of mixture
and the hydraulic press requires 9.5 kg of mixture. RDI-
C uses 8-8.2 kg per filter, Nicaragua about 8 kg.
Although the Nicaragua manual recommends that prepared mixture be pressed the same day, at
RDI-C the mixture is routinely covered and left in the mixer overnight to reduce start up time the
following day. IDE wraps the measured clay in plastic until pressed so that the surface does not dry
out.
All four manuals mention the use of plastic bags as a mould release (to prevent the clay from
sticking to the mould). RDI-C has tried using oil, but reported that it did not work as a mould
release. At IDE, filters are left to dry for 30 minutes before smoothing and touching-up the filter,
and two hours before stamping. At RDI-C, rims and plastic bag marks are touched-up immediately
and the rim is checked for circularity using a plastic bowl. Filters are left to dry for 3-4 hours or
overnight before the sides and insides are touched up and stamped and the outsides are
roughened (with an old hack-saw blade) to open the pores. In Nicaragua, the filters are gently
cleaned and stamped immediately upon removal from the press, but allowed to dry for two days
before trimming. Rivera (2006) recommends waiting one day before stamping the filter.
6 Wedging is a pottery term for working clay; it can be compared to kneading bread dough.
Photo 3-1 Wedging Filter Mixture
(Rayner 2006)

22
Current Practices in Manufacturing of Ceramic Pot Filters for Water Treatment
Drying is very important as rushed or uneven drying, especially
initially, can cause cracking. Filters will dry faster in hot, dry and
windy conditions and slower in cold, damp and still air (Rayner
2006). Therefore, depending on the conditions, freshly pressed pots
may need to be protected from drying too quickly and can be stored
either in a damp room or covered with plastic, gradually reducing
coverage for slow drying to avoid deformation and cracking (Rayner
2006). In Nicaragua, filters are covered with a plastic bag for the first
three days. The Iraq manual warns against placing the freshly
pressed element in the direct sunlight especially during the hot
summer months. At IDE, filters take about 5-7 days to dry in the dry season or 7-10 days in the wet
season. At RDI-C, filters dry in 7-15 days in the dry season or 15-18 days in the wet season. Rivera
(2006) suggests allowing filters to dry for seven and 21 days in the dry and wet seasons
respectively.
3.4.6 Firing
It is important to ensure filters are sufficiently dry before firing. Since the burn-out material
retains moisture, the filtering elements will take longer to dry than typical pottery (Rivera 2006). If
filter elements are not dry enough prior to firing it will increase the chances of them exploding or
cracking during the firing (Nardo 2005). Rivera (2006) suggests weighing the elements to get an
idea of the water loss during drying. RDI-C notes that over 3 kg of water will be lost between
pressing and the completion of the firing process. When ready for firing, the filtering element
should make a “leathery sound” when flicked with a finger (Hagan et
al. 2009). By moving filters which are almost ready for firing to near
the kiln, the warmth from the kiln can aid in drying (IDE 2008).
Filters can be stacked in kilns mouth to mouth, bottom to bottom or
alternating. If stacked directly on top of each other a slight carbon
mark may remain on the filters, however, this should not affect the
functioning of the filter (Rivera 2006). To avoid this, however, and to
allow for complete circulation of heat and air during firing both IDE
and RDI-C use small pieces of clay as spacers between filters.
Photo 3-2 Filters Drying
(Rayner 2006)
Photo 3-3 Stacked Kiln
(Rayner 2006)

23
Current Practices in Manufacturing of Ceramic Pot Filters for Water Treatment
Temperature can be monitored with the aid of a pyrometer and/or pyrometric cones. A pyrometer
measures the ambient temperature inside the kiln whereas pyrometric cones7 indicate the
temperature the clay has reached (Rayner 2006). At the Nicaragua factory, a pyrometer with two
additional thermocouples is used along with three pyrometric cones. The first cone (guide cone)
serves as a warning that the kiln has nearly reached the desired temperature, the second cone
(firing cone) melts when the desired temperature has been reached and the third cone serves as
the control (guard cone). If the guard cone melts, the
desired temperature has been exceeded. Cone blocks (sets
of three) can be placed in different locations in the kiln to
check for temperature variation within the kiln (Rayner
2006). At IDE, one 014 cone is used (830°C). A pyrometer is
not used, but rather, the experience of the kiln master is
relied upon. At RDI-C a pyrometer and two cones
(numbers 014 and 012 for 830°C and 866°C respectively)
are used to measure the temperature.
Although the ‘maturing’ temperature will vary for each clay type (Rivera 2006), the firing process is
similar but may vary depending on the size and type of kiln, fuel used, and other factors. The
temperature should be increased slowly until reaching 100°C so that moisture remaining in the
clay has the chance to escape before reaching boiling temperature (Nardo 2005). It is
recommended that if filters are being fired in a downdraft kiln8, the temperature increase during
the first three hours should not exceed 50°C per half-hour. Subsequently the temperature can be
raised gradually by 100°C per hour (Rivera 2006). RDI-C heats the kiln to 100°C and maintains that
temperature for two hours to dry off any excess water in the filters. IDE has an initial heating stage
which lasts 5-6 hours after which, by monitoring the change in the smoke output (from black to
white), the heat is increased and the kiln is fired for an additional five hours. At the Nicaragua
factory the kiln temperature is raised by 50°C per half hour until reaching 200°C, then 100°C per
hour until reaching 400°C. The temperature is then raised 60°C per half hour for the following five
hours until the pyrometer reads 840°C. The peephole is then carefully opened for cone
observation to monitor the temperature. Only cones 012 and 010 should be allowed to melt, the
7 Pyrometric cones are made of specific formulae of refractory and fluxing materials to measure the effects
of both time and temperature, known as ‘heat-work’. Different numbered cones are designed to bend, or
deform at specific temperatures. See www.ortonceramic.com for more information. 8 A downdraft kiln does not have an opening in the roof of the kiln, therefore the heat when reaching the
roof is directed downwards, into an opening in the kiln floor which directs it to the chimney.
Photo 3-4 Cone Block
(Rayner 2006)

24
Current Practices in Manufacturing of Ceramic Pot Filters for Water Treatment
latter should fall at about 887°C. Upon completion of firing, stoke holes are covered to avoid cold
drafts from cracking or warping filters near the flame port.
Figure 3-1 Example of Heat Flow
in a Down-draft Kiln
Figure 3-2 Example of Heat Flow
in an Up-draft Kiln
(Peterson 2009)
IDE, RDIC-C and the Nicaragua factories all fire with wood. However, propane fired kilns can also
be used (Nardo 2005). At IDE, after firing is completed, kilns are cooled for 12-24 hours depending
on the kiln size and weather conditions. At RDI-C total firing time is about 8-9 hours and the kiln is
cooled for an additional 24 hours, and as at IDE, firing time varies depending on the weather
conditions and kiln design (Hagan et al. 2009). The Nicaragua factory fires for 8-9 hours and allows
the kiln to cool over-night before gradually opening the kiln door.
3.4.7 Flow Rate Tests
It is important to soak fired, cooled filters and ensure
they are saturated prior to testing their flow rate
(Lantagne 2001a). Nederstigt and Lam found that filters
soaked for 24 hours prior to testing flow rate have
consistent discharge rates. Filters, having been soaked
for less time, have inconsistent and slower flow rates
(van Halem 2006: A-10). At the factories, filters are
soaked for different amounts of time: a minimum of
four hours (Rayner 2006), overnight (Rivera 2006),
thoroughly (Nardo 2005), 12 hours (IDE 2008), or overnight with a minimum of five hours (Hagan
et al. 2009). Flow tests at IDE are carried out by filling the filters with water and measuring the
amount of water remaining in the filtering element after one hour, using a “calibrated volume-
measuring dipstick” (or T-device). IDE’s acceptable flow rate is between 2.0-3.0 litres per hour.
RDI-C also uses a T-device to measure the water level after one hour; the acceptable flow rate at
Photo 3-5 Calibrated "T" Device
(Source unknown)

25
Current Practices in Manufacturing of Ceramic Pot Filters for Water Treatment
RDI-C is 1.5 – 3.0 litres per hour. The Iraq manual suggests timing how long it takes for a measured
amount of water to filter through the element or measuring how much water filters out after 15
minutes and multiplying it by four. Their acceptable flow rate is 1.0-2.0 litres per hour. Nicaragua’s
acceptable flow rate is 1.0-2.5 litres in the first hour and is calculated either by measuring the
amount of water which filters through the filter in the first hour or using a T-device to measure the
water level in the element after the first hour (Rayner 2006).
3.4.8 Silver Application
As further discussed in Section 3.6, silver is added to improve the microbiological effectiveness of
filters. Colloidal silver, a suspension of silver nanoparticles, acts as a disinfectant. Although at a
few factories it is added to the filter mix, usually filters are coated with colloidal silver after firing.
Silver nitrate is applied to filters instead of colloidal silver at some factories.
Reviewed manuals recommend filters be absolutely dry before colloidal silver application to
ensure maximum absorption. Both the inside and outside of the filters should be coated with
colloidal silver for increased effectiveness (Lantagne 2001a). At IDE, silver is diluted in 10-20 litres
of water and 300 ml of this solution is applied to each filter. The dilution is equivalent to 1 ml of
3.2% colloidal silver solution per 300 ml, 50% of which is applied to the inside and 50% to the
outside of the filter. The rim of the filter is not painted.
In Nicaragua, 2 ml of 3.2% colloidal silver is diluted with 300 ml of clean water. Liquid silver is
diluted per filter and used immediately to coat first the inside, then the outside of the filter
including the bottom. It is also suggested that mixing enough to dip filters rather than painting
them might be quicker and more effective if production levels are high (Rayner 2006).
The Iraq manual also recommends painting a dilution of 2ml of 3.2% colloidal silver per 300 ml
water. In addition, it suggests that when working with powdered silver a concentrated solution
can be mixed by adding 33 grams of silver to 1 litre of water and then 2 ml of this concentrated
solution to 300 ml of water per filter for application to the filter element. If dipping, mixing a 220
mg/L strength solution in a large container is recommended.
Rather than using colloidal silver, RDI-C uses 99.8% silver nitrate powder. As tests have found that
30% of the silver nitrate leeches out when first used, it is recommended that users discard water
from the first three fillings of the filter (Hagan et al. 2009). A concentrate of 1.5 L of deionised

26
Current Practices in Manufacturing of Ceramic Pot Filters for Water Treatment
water with 100 grams of silver crystals is mixed and further diluted using 100ml of the concentrate
per 18 litres of filtered water. In order to protect the diluted silver from oxidation it is stored in
sealed 20 litre pots. At RDI-C more silver is applied to the inside (200 ml/47 mg) of the filter than
the outside (100 ml/ 23 mg). RDI-C explains that filters are not dipped because of the silver loss
due to oxidation, the varying requirements for the inside and outside of the filtering element, and
increased drying time. Spraying has also been considered as an application method but has not
been implemented due to concern for worker safety and because airborne silver would be wasted
(Hagan et al. 2009). Currently, colloidal silver is also being added to the filter mixture and fired into
filters in the Dominican Republic and Tanzania (Ballantine and Hawkins 2009).
3.4.9 Additional Quality Control
In addition to flow rate testing, the
reviewed manuals recommend
frequent visual inspections for
cracks and deformation. IDE also
recommends performing a sound
resonance test whereby the filter is
tapped and depending on the
sound it makes, an experienced
potter can tell if it is under-fired
and possibly detect internal cracks. A new recommendation by Potters for Peace is a pressure test
to detect internal cracks. In this test, the filtering element is submerged in water up to its rim
without letting water flow into the filter. If water seeps through the walls of the filter after being
submerged for 10 seconds it is an indication of internal cracks and the filtering element should be
discarded (Pillars and Diaz 2009).
3.4.10 Packaging
Although there are various ways of packaging filters, it has been recommended that all filtering
elements be dried thoroughly and placed in plastic bags to protect them from getting dirty (Rayner
2006). In Nicaragua, filters are placed in a plastic bag and packaged in a cardboard box protected
with newspaper. Taps are placed loose inside the plastic receptacle and instruction and logo
stickers are stuck to the outside. IDE packages the filtering element in a box with an instructional
booklet and brush included. Prior to packaging, IDE performs a leak test on all taps using a
compressed air source, submerging the taps and looking for bubbles. RDI-C has receptacles
Figure 3-3 Pressure "Crack" Test
(Pillars and Diaz 2009)

27
Current Practices in Manufacturing of Ceramic Pot Filters for Water Treatment
custom made from food-grade PET. Included in their filter package are a cleaning brush, plastic tap
and instruction pamphlet. A fitting ring, which is placed between the plastic receptacle and
filtering element to ensure a tight fit, is also included. RDI-C also sells a replacement pack which
consists of a filter element, fitting ring, plastic tap, brush, and instruction brochure. These are
placed in a cardboard box (with polystyrene on bottom and top) or a carrying basket.
3.5 How Ceramic Pot Filters Work
3.5.1 Introduction
As described in the previous section, each of the filter factories has adapted the general filter
making process according to locally available materials and conditions. This local adaptation is one
of the advantages which allows this technology to be transferable. In order to understand how
variables affect the characteristics and efficacy of the filtering element it is important to
understand how the filter works. In this section the literature on physical characteristics of the
filtering elements and how some production variables may affect the filters is reviewed, taking
into consideration both microbiological effectiveness and user needs.
3.5.2 Physical Characteristics and Mechanisms
During firing, the combustible (burn-out material) added to the filter mix burns out leaving small
pores which increase the porosity and hydraulic conductivity of the filtering elements. The pore
size is determined by the size and amount of burn-out added to the mixture (Lantagne 2001a),
however it has also been linked to the clay content (Oyanedel-Craver and Smith 2007). The pore
shape and diameter act as a physical barrier to pathogens, other organic material and turbidity in
the influent water. Pore sizes were measured in the lip of a filter from Nicaragua, where saw-dust
is used as burn-out material, using a Scanning Electron Microscope (SEM) and were found to range
from 0.6 microns to approximately three microns (Lantagne 2001a). The pore sizes of the filters,
therefore, were found to be within range of the 1.0 micron goal to screen out E. coli. There were
also cracks and spaces which measured up to 150 microns and 500 microns respectively, which
could be of concern if interconnected; however, this would also likely increase the flow rate
beyond the acceptable limit (Lantagne 2001a). Microbiological testing found that three of the four
filters tested removed all E. coli which suggests the pore size is small enough to screen out E. coli
in the majority of the filters (Lantagne 2001a). With the application of colloidal silver, all filters
removed 100% of the total and thermo-tolerant coliforms (Lantagne 2001a).
28
Current Practices in Manufacturing of Ceramic Pot Filters for Water Treatment
The pore sizes were measured on the lip of the filter which was assumed to be the worst-case
scenario since it receives the least amount of pressure during the pressing of the filters. A later
study, using mercury intrusion porosimetry test, found that pore size distributions and porosities
did not vary significantly between the bottom, middle and lip of filters and therefore the
manufacturing method should not affect variations in pore sizes (van Halem 2006). The total pore
area, which might contribute to increased adsorptive capabilities, has however, been found to
vary widely per cm³ of material (van Halem 2006).
Although average pore size diameter was calculated at 40 microns, filters were successful at
removing micro-organisms smaller than the pores (van Halem 2006). Therefore, it was suggested
that filters work by additional mechanisms to mechanical screening including sedimentation,
diffusion, inertia, turbulence and adsorption. In addition, tortuosity9 increases total surface area
and can encourage these processes (van Halem 2006). Although other mechanisms aid the
effectiveness of the filters in removing microbiological contamination, size exclusion has been
found to be significant as there is a correlation between pore size and bacteria removal. Filters
with smaller pores have a higher removal rate of bacteria (Oyanedel-Craver and Smith 2007).
A correlation has also been found between clay content, pore size and flow rate. In a comparison
study of model filters made from different clays, porosities were found to be the same yet the
median pore diameter correlated with the clay content and it was found that samples with
“relatively uniform and fine-grained particle-size distributions will likely produce filters with better
bacteria-removal efficiency, smaller pores, and lower dispersion than comparatively coarse-
grained, heterogeneous soils” (Oyanedel-Craver and Smith 2007: 931). The hydraulic
conductivity10 and porosity11 might also be influenced by predominant clay minerals as the filter
model which measured highest in these parameters also had a high kaolinite (a clay mineral)
content in the clay (Oyanedel-Craver and Smith 2007).
Filters manufactured in different countries have been found to vary both in porosity and pore size.
Measured with mercury intrusion porosimetry, filters from Cambodia had porosity measuring
43%, Ghana 39% and Nicaragua 37%. Pore sizes were measured at: Cambodia 25 microns, Ghana
22 microns, Nicaragua 17 microns (van Halem 2006). The manufacturing details, however, were
9 The more tortuous (winding or twisting with bends and turns) the filter material is, the longer the path the
water must pass through to exit the filter. 10
Hydraulic conductivity relates to the rate water can move through the filter. 11
Porosity relates to the volume of void spaces in the filter.

29
Current Practices in Manufacturing of Ceramic Pot Filters for Water Treatment
not available for the filters tested. The application of silver also affected the pores by reducing the
effective pore size (van Halem 2006). Upon comparing the tortuosity of filters from Cambodia,
Ghana and Nicaragua it was found that the filter material from Nicaragua is more tortuous (van
Halem 2006). Since tortuosity reflects the actual path the water takes through the filter, it can
influence the various mechanisms at work including screening, sedimentation and adsorption. This
was supported by evidence of higher removal of Clostridium spores and E. coli by the Nicaraguan
filters (van Halem 2006).
3.5.3 Flow Rate
The flow rate of a filter is used as a form of quality control as discussed in Section 2.2. Flow rate is
an important consideration in filter usefulness since filters need to treat enough drinking water
daily for a family at a rate that is convenient for an appropriate pattern of use. In practice, a given
flow rate will vary depending upon:
1. the quality of the influent water;
2. the depth of the water in the filtering element (which affects the wetted area and defines
the maximum pressure pushing the water through the filter pot);
3. the size of the receptacle in relation to the filtering element;
4. the shape and size of the filtering element;
5. the consistency of the porosity of the filtering element;
6. the pattern of use including the frequency with which the filtering element is filled and the
amount of water which is withdrawn (the latter will also be influenced by the height of the
tap);
The graph in Figure 3-4 was created from calculations using measurements provided by van Halem
for filter geometry and mean discharge rates for the Cambodian filters used in her study (van
Halem 2006: pgs. A-13, A-15, Appendix II, Tables 1.5 and 1.9) and the dimensions of a standard 20
litre receptacle (r=15 cm, h=30 cm, vol=21.21 litre); however, receptacle sizes sold with filtering
elements vary. The Cambodian filter in this example had a capacity of 9.84 litres and a flow rate of
1 litre in the first hour if filled to the top. The amount of water which can be collected before
reaching the bottom of the filtering element is about four litres, at which point the flow rate will
reduce if water is not withdrawn from the receptacle. Although the receptacle capacity is about 8
litres taking into account displacement by the filter, the flow will stop at just over six litres with a
single filling of the filtering element. The following graph (Figure 3-4) shows the cumulative
volume of water that can be filtered with the same filtering element using four possible scenarios.

30
Current Practices in Manufacturing of Ceramic Pot Filters for Water Treatment
Variation in Flow Rate
0
2
4
6
8
10
12
14
16
18
0.00 4.00 8.00 12.00 16.00 20.00 24.00
Time (hours)
Vo
lum
e o
f W
ate
r F
ilte
red
(L
itre
s)
1. Filled 5 times perday
2. Filled every 12hours
3. Filled once, nowater withdrawn
4. Filled once, waterlevel doesn't reachbottom of filter
Figure 3-4 Variation in Flow Rate
Scenario 1: The orange line represents the filter being filled, left to filter for 8 hours before being
refilled every four hours for the remainder of a 24 hour period. This scenario could represent the
situation where the filter is filled last thing in the evening and then four times the subsequent day,
with filtered water being withdrawn throughout the day. With this scenario, the filter can produce
about 17 litres of drinking water per 24 hours, enough to provide a family of five with an average
of three litres of water per person. So this, or a similar pattern of use, is important to obtain the
largest amount of drinking water from the filter.
Scenario 2: The purple line represents the filter being filled and left to filter for 12 hours before it
is filled again and allowed to filter for another 12 hours. It is assumed that water is withdrawn
during the day. This scenario allows 11.5 litres to be treated per day.
Scenario 3: The blue line represents how much water could be filtered if the filtering element is
filled and left for 24 hours with no water withdrawn from the receptacle. If water is withdrawn,
the flow rate will vary depending on the time and amount of water withdrawn. This scenario
allows only 6 litres to be filtered over the 24 hours.
Scenario 4: The green line represents the flow rate if the filtering element is filled and left to filter
for 24 hours in a situation where the water level in the receptacle never reaches the bottom of the
filter (either due to a larger receptacle or water being withdrawn). This example shows the change

31
Current Practices in Manufacturing of Ceramic Pot Filters for Water Treatment
in flow rate over time based on the change in water level in the filtering element, without the
influence of the water level in the receptacle. In this case, the filter will be capable of treating just
over eight litres of water in 24 hours. The average flow rate, if the water level in the filter is kept
between 13 and 23 cm is about 0.7 litres per hour.
The flow rate will also vary depending on the quality of the influent water and has been found to
reduce considerably due to clogging both in the laboratory (Lantagne 2001a; Fahlin 2003; van
Halem 2006) and the field (Lantagne 2001b). Scrubbing of the filtering elements has been found to
rejuvenate the flow rate in filters (Lantagne 2001a) and has been incorporated into operation and
maintenance instructions for filter use. Van Halem (2006) found that after 12 weeks of use in the
laboratory, filters had flow rates of less than 0.5 litres per hour, which would not be sufficient to
meet a family’s drinking water needs. Although scrubbing temporarily increased flow rates, filters
did not return to their original flow rate and even with scrubbing, flow rates continually
diminished (van Halem 2006). Fahlin (2003) found that clogging impeded his research into the
hydraulic conductivity of filters. However, in some field investigations users have reported that
filters provided enough water for additional uses (Roberts 2004) and only 5% of filter disuse was
attributed to unsatisfactory flow rates (Brown and Sobsey 2006).
In a study to see if flow rate could be increased without sacrificing the bacteriological removal
efficacy of filters, filters were made with either increased burn-out material (rice husk) or
increased laterite (thought to be effective against viruses). Flow rates were successfully increased
to up to 10 l/hr and 8 l/hr respectively. During the six month testing period no significant
difference was measured in E. coli removal between the filters with higher flow rates and lower
flow rates. Filters with and without silver nitrate impregnation did differ significantly in their ability
to remove E. coli, however. Filters with silver had nearly twice as high mean log reduction value
(LRV)12 of E. coli. This study concluded that although future research is necessary to investigate
long-term effects, increasing the flow rate does not affect the micro-biological efficacy of the
filters (Bloem et al. 2009).
In contrast, another study where filters were manufactured with increased flow rates by a)
increasing burn-out material and b) altering the type of burn-out material, found that beyond a
flow rate of approximately 1.7 l/hr, consistent total coliform reduction begins to drop below 99%
12 Log reduction value (LRV) represents the microbial removal efficiency, where LRV of 4, expressed as a
percentage would be 99.99%.

32
Current Practices in Manufacturing of Ceramic Pot Filters for Water Treatment
(Klarman 2009). These filters were made at a factory which aims to leave a carbon residual within
the walls of the filter, which differs from the filters used in other studies. This could have an
impact on the results and appeared to have an influence on both the flow rates of the filters and
the turbidity of the effluent water, the latter was considerably higher during the first week of the
study and the flow rates of several of the filters in this study actually doubled during the five week
testing period (Klarman 2009).
Filters manufactured using a larger screen size to sieve the sawdust showed no significant
difference in flow rates (Klarman 2009). At the RDI-C factory, however, filter mix ratios are
adjusted to achieve acceptable flow rate ranges according to the particle size of the rice husks
received, adding more rice husk to the mixture if it is observed to be smaller (Hagan et al. 2009)
indicating a relationship between burn-out particle size and flow rate. In addition, using different
burn-out materials, even when sifted to the same screen size, can increase the flow rate but also
reduces total coliform removal efficiency. This emphasises the need to develop a new ratio when
changing the burn-out material (Klarman 2009).
3.6 Silver
3.6.1 Introduction
Lantange (2001a) provides an overview of silver and its historical and present day use in other
fields as well as in ceramic water filters and concludes that although the mechanisms of bacterial
inactivation are complicated, silver application does improve the effectiveness of the filters. The
amount of silver measured in effluent water was below USEPA (United States Environmental
Protection Agency) and WHO guideline values for silver (0.1mg/L), and therefore does not pose a
risk to human health (Lantagne 2001a; Lantagne 2001b). In agreement with this, other studies
have found that silver contributes to the microbiological removal effectiveness (van Halem 2006;
Oyanedel-Craver and Smith 2007) and the amount of silver in the effluent water does not exceed
WHO guidelines (Oyanedel-Craver and Smith 2007). In addition it has been observed that the
silver inhibits biological growth from forming on the filters and in the receptacles (van Halem
2006; Bloem et al. 2009). It has been concluded that the mechanism by which silver improves filter
performance is by disinfection (Oyanedel-Craver and Smith 2007).
Investigations into the hydraulic properties of pot filters have been inconclusive (Fahlin 2003).
However, using a bromide tracer breakthrough test, it was estimated that water remains in the

33
Current Practices in Manufacturing of Ceramic Pot Filters for Water Treatment
pores of filters for 50 minutes, which, depending on the thickness of the silver layer, should
provide sufficient contact time to inactivate bacteria (Fahlin 2003). It remains unknown how
deeply silver penetrates into the filter walls and it has been suggested that biological growth can
occur and result in clogging and reduced flow rate if some pores remain un-lined with silver (Fahlin
2003).
3.6.2 Application Methods
As mentioned in Section 3.4.8, silver is currently being applied by three different methods and two
types of silver are being used. A colloidal silver solution is either painted on, elements are dipped
in a silver solution, or colloidal silver is integrated into the filter mix prior to pressing and firing the
filters. Some factories paint a silver nitrate solution on the filters instead of colloidal silver.
Investigations into the effectiveness of different colloidal silver application methods have found
that colloidal silver should be applied to both the inside and outside of the filter for effective
microbiological reduction (Lantagne 2001a). Although it has been recommended that filters be
dipped rather than painted with colloidal silver to ensure the full path of water flow through the
filter is coated (Fahlin 2003), it has since been concluded that the quantity of colloidal silver
applied is more important than the application method (Oyanedel-Craver and Smith 2007).
Although it has been suggested that silver could reduce total pore area and adsorptive surface
area (van Halem 2006), tracer experiments post-colloidal silver application did not suggest this
(Oyanedel-Craver and Smith 2007).
Microbiological efficacy of filters in the field with silver nitrate painted on were found to be
comparable to filters with no silver nitrate applied (Brown 2007). Filters produced with a high flow
rate, however, found that microbiological efficacy improved after the application of silver nitrate
(Bloem et al. 2009). Filters produced with colloidal silver fired into the filters have been found to
be effective at removing E. coli and total coliforms (Lantagne, Klarman et al. 2009).
The choice of indicator bacteria should be considered when testing for microbiological efficacy as
many tests are carried out using E. coli and one study found no difference between filters with and
without colloidal silver application at removing Clostridium spores (van Halem 2006). Clostridium
spores are a gram positive bacteria, and are not sensitive to colloidal silver.

34
Current Practices in Manufacturing of Ceramic Pot Filters for Water Treatment
3.7 Virus Removal
Virus removal remains a challenge with ceramic filters due to the small sizes of viruses and
because silver is not effective against viruses. It has also been found that the LRV of MS2
bacteriophages is slightly reduced in filters with colloidal silver and therefore it has been
suggested that colloidal silver application does not have a positive effect on virus removal.
However, filters have not been found to be effective at removing MS2 bacteriophages in filters
with or without colloidal silver (van Halem 2006).
RDI-C adds laterite, an iron-oxide rich compound, to their filter mix as it is thought to provide
additional viral binding sites (Hagan et al. 2009), however, although a 1-2 log10 reduction (90-99%)
in MS2 was documented, no significant difference was found between filters with or without
laterite (Brown 2007). Likewise, in a recent study (Bloem et al. 2009) filters made with increased
laterite (which also increased the flow rate) did not show improved removal efficiencies, as the
mean LRV was less than 0.5 for all of the filters tested, with or without laterite. Filters with laterite
were also heavier and more porous (Bloem et al. 2009), which might affect breakage and user
acceptability.
3.8 Metallic Compounds
Some metallic compounds have been found to leech from filters. Both aluminium and silver were
below WHO guidelines as well as barium, copper, manganese and silicon. Filters were found to
retain zinc (van Halem 2006). Arsenic was found in the effluent water above the provisional WHO
guideline of 10 μg/L. The amount is worrying, but decreased from 200 μg/L to a mean of 17 μg/L
after 12 weeks.
3.9 Summary
Ceramic filters have shown to be effective in both the field and laboratory at improving water
quality. Although filtered water in the field does not always meet WHO drinking water quality
guidelines of 0 E. coli per 100/ml sample, water quality is significantly improved. Post
contamination is a possible explanation for why in some cases effluent water has a negative LRV.
Filters seem to work well after several years in use; however there might be a decline in
effectiveness with time. In the laboratory, five-year old filters from the field were found to reduce
in effectiveness after several batches of heavily spiked E. coli were passed through the filters and
some E. coli passed through the filter. In addition, with time, filters appear to loose their ability to
retain colloidal silver (Bielefeldt et al. 2009).

35
Current Practices in Manufacturing of Ceramic Pot Filters for Water Treatment
Although self-reported diarrhoea is considered by some a subjective and unreliable indicator
(Schmidt and Cairncross 2009), filter users report significantly fewer cases of diarrhoea and
additional benefits from other health related advantages. Drinking water is not the only
transmission route for diarrhoea causing pathogens and filter users might also have a higher
degree of health and hygiene awareness. Although the primary association with continued use
was the amount of time in the field, it is also correlated with user investment, health and hygiene
awareness and other aspects (Brown and Sobsey 2006).
Production procedures vary from country to country, as do the filters. Filters from different
countries vary in porosity, pore size, tortuosity and other characteristics (van Halem 2006);
however, production details have not been available for the filters studied in order to compare
and speculate on the influences. Clay content has been found to influence both the flow rate and
porosity (Oyanedel-Craver and Smith 2007).
Although in the field, filter users do not cite insufficient water as being a primary cause for disuse,
flow rates measured in the laboratory would not provide sufficient drinking water for a family.
Efforts to increase the flow rate without sacrificing the microbiological removal efficiency have
had different findings, with one study concluding that flow rates could be successfully raised to 8-
10 l/hr while maintaining microbiological efficacy (Bloem et al. 2009), and another that beyond 1.7
l/hr total coliform reduction begins to drop to below 99% (Klarman 2009).

36
Current Practices in Manufacturing of Ceramic Pot Filters for Water Treatment
4 Methodology
4.1 Introduction
The aim of this project was to identify the various filter factories worldwide and to survey and
document existing production practices to provide data that will help the Ceramics Filter
Manufacturing Working Group make appropriate manufacturing recommendations, which are
expected to help filter factories improve the quality of filters being produced. In order to achieve
this aim and answer the research questions listed in Section 1.10, a list of filter factories was
compiled, a survey was prepared and results were analysed as described below. A literature
review was carried out on field studies, documented production processes and investigations into
the physical properties of ceramic pot filters. In addition, the Ceramics Filter Manufacturing
Working Group held bi-monthly conference calls during which different aspects of filter
production were discussed. In Section 6.2, how the methodology was followed is discussed.
4.2 Sample Group
The selection criterion for participating in this study was that factories must be currently
producing filters on a full-time, part-time or per-order basis. Contact information was collected
from representatives of Potters for Peace, Potters without Borders, Filter Pure, and others who
have worked with various filter projects including members of the Ceramics Filter Manufacturing
Working Group for all known, currently producing filter factories. All filter factories meeting the
criterion with contact information available were contacted with an initial e-mail introducing them
to the objectives of this project and inviting them to participate. The invitation e-mail was
translated into Spanish by the author and proof-read by a native Spanish speaker. The invitation
included a request to provide updated contact information if no longer involved with the factory
or in filter production.
4.3 Data Collection Methodology
It has been recommended that in choosing a data collection method both the nature of the
investigation and the characteristics of the study population should be taken into consideration
(Kumar 1999). In order to obtain information on current practices in ceramic water filter
production both questionnaires and interviews were considered. Because of the geographical
dispersion of filter factories it was logistically not possible within the timeframe of this project to
37
Current Practices in Manufacturing of Ceramic Pot Filters for Water Treatment
visit each one; however this did not exclude the possibility of carrying out telephone interviews. In
contrast to interviews, some of the disadvantages of questionnaires, as Kumar (1999) highlights,
are that they typically have a low response rate, do not allow for clarification of questions and
cannot be supplemented with additional information (i.e. observation). Conversely, they also
allow the recipient time to think about the answers and allow for the possibility of consulting
others. In this study, these were considered advantages because they could lead to providing
more complete information. Since the advantages of interviews and both the advantages and
disadvantages of questionnaires were deemed important to the author, it was decided that both
questionnaires and interviews should be carried out despite the time-consuming nature of
interviews (Kumar 1999). Furthermore, the extent to which participants in the study would have
reliable access to a computer and the internet or be available for a telephone interview was
unknown. Additional barriers, such as language, were also recognised as a possibility. In addition,
the author wanted to ensure that as many questions as possible were understood and that as
many questions as possible were answered. Interviews also allowed the author to invite the
participant to expand upon interesting or different manufacturing practices.
After receiving a positive response to the initial invitation, representatives were sent a
questionnaire by e-mail and given the option to complete and return it and schedule a follow-up
call to review the questionnaire, or to simply review it for its content and participate in a
telephone interview in which the author would fill out the questionnaire during the call. The
survey was sent to those who expressed interest in participating and follow-up e-mails were sent
to those who did not reply.
4.4 Survey Design
An outline ‘mind-map’ (see Figure 2-4) was prepared detailing ceramic water filter production
procedures including known variables in the manufacturing process. Several production manuals
were reviewed and compared to the outline to include all known variables. It was reviewed by
members of the Ceramics Filter Manufacturing Working Group and feedback was incorporated
into the outline.
The survey was developed based on this ‘mind-map’ (Figure 2-4). Questions which addressed each
of the variables were formulated. A selection of both quantitative and qualitative questions was
used in order to not only capture quantitative details of filter production, but also to develop an
understanding of the experiences of each of the factories. Quantitative questions addressed

38
Current Practices in Manufacturing of Ceramic Pot Filters for Water Treatment
typical manufacturing procedures. Qualitative questions of each phase of production encouraged
participants to discuss past and current challenges, successes and dead-ends, as well as to allow
them to discuss aspects of production in their facility which might not have been addressed in the
questionnaire.
The survey was reviewed and modified according to suggestions and feedback from members of
the Ceramics Filter Manufacturing Working Group and Potters for Peace. A pilot interview with a
filter factory representative was carried out to check timing, flow and appropriateness of
questions. Recommended modifications were made to the survey where appropriate. The survey
was translated into Spanish by the author and reviewed by a native Spanish speaker. Corrections
to Spanish grammar and vocabulary were incorporated where appropriate.
4.5 Survey Implementation
Structured interviews guided by the questionnaire were carried out in either Spanish or English.
Interviews lasted between 1-2 hours. Not all participants were available or willing to participate in
a telephone interview. In these cases, participants filled out the questionnaire and returned it by
e-mail. In some cases, where a factory representative either temporarily or regularly did not have
access to e-mail, a phone line, or there was a language barrier, an intermediary brought the
questionnaire to the factory for the representative to complete, transferred the data to the
computer and forwarded it to the author.
4.6 Limitations
Several areas for bias existed. Firstly, self-selecting bias may have influenced who responded to
the invitation. Those who filled out the survey after saying they would respond might have had
certain characteristics in common which may indicate a ‘self-selecting bias’ (Kumar 1999). Those
characteristics might relate to the amount of time the factory has been running, their ability to fill
out the survey well, the amount of contact they have had with other organizations and projects,
the relative success of the factory, current challenges or current circumstances.
Secondly, ‘social desirability’ responding, whereby the respondent’s answer is biased to show the
respondent in a desirable light (Sapsford and Jupp 1996), may have occurred. In addition, there is
often a discrepancy between what people say they do, think they should do and actually do. These
will be of concern in any self-reporting research method. In addition, it must also be
acknowledged that what actually happens in the factory might be different from what owners or

39
Current Practices in Manufacturing of Ceramic Pot Filters for Water Treatment
managers see. Although quality control of a health tool is of utmost importance, comparing what
people think they should be doing with recommended practices is valuable in itself, especially
where de-centralised production does not always ensure that new developments regarding best
practice have been communicated to all facilities.
Thirdly, where interviews were carried out, interviewer bias is also a risk. Although prompting was
essential, it may have introduced bias (Sapsford and Jupp 1996). However, this might be balanced
with the advantage of ensuring that participants answer as many questions as possible,
understand the questions and also provided the opportunity to request elaboration on novel
production methods.
Lastly, although an attempt was made to interview production managers, this was not always
possible due to language barriers, organizational structures or other reasons. Participants available
for interview had different roles in relation to the filter enterprises and some representatives were
not intimately involved in production. Participants included production managers, owners,
directors, exclusive distributors, etc. with varying levels of involvement in the details of production
(see section 5.3). As a result, despite combining both interview and questionnaire data collection
methods, not all questions were answered by all participants. In some cases this was because
some factories wished their production details to remain confidential, but also because some
participants did not know the answer to every question. Although it was suggested that such
information be researched and provided at a later date, and subsequently solicited via e-mail. In
many cases, it was not supplied within the timeframe of this project. This resulted in some
questions remaining unanswered and may have also resulted in some misinformation regarding
actual procedures in the factory which complicates cross-survey comparison. Although where
possible and within permissible timeframes, an attempt was made to acquire missing information
or confirm suspect information. Where information was missing, it was noted in the appropriate
section. The lack of knowledge is in itself significant within the context of this research and is
discussed in Section 6.
4.7 Data Analysis
Information from each of the questionnaires was translated where necessary, and transferred to a
master Microsoft Excel spreadsheet per participant (as opposed to against each variable) for
analysis. In this way, any perceived discrepancies in the answers from one factory could be
identified and checked for accuracy. Once all data had been transferred to the spreadsheet,

40
Current Practices in Manufacturing of Ceramic Pot Filters for Water Treatment
quantitative data was reviewed. A close reading of the qualitative data was carried out to identify
patterns, similarities and differences and to establish categories. General categories of interest
were established and data pertaining to each category was grouped and analysed for presentation
in the results section of this report.

41
Current Practices in Manufacturing of Ceramic Pot Filters for Water Treatment
5 Results
5.1 Introduction
In this section results from the survey are presented. A total of 35 operational filter factories were
identified in 18 countries, 25 of which participated in the survey (71%). Eight of the factories are in
Myanmar and supported by one organisation. Since many of their production procedures are
standardised, they were often counted as one factory. Where their characteristics or practices
vary, they were counted individually. In the following sections (n=) refers to the number of
respondents who answered a particular question; when underlined (n=) indicates that the
Myanmar factories were counted as individual factories rather than as one. Results are cross-
referenced to the corresponding questions in the survey (Appendix 5) and answers in the data
sheets (Appendix 6) according to the following codes: Background Information: QBG 1-29,
Materials and Processing: QMP 1-72, Filter Production: QFP 1-80, Quality Control: QQC 1-34, and
Delivery: QD 1-21. Filter factories are referred to according to the codes displayed in Table 5-1.
Figure 5-1 Filter Factory Locations
(Source: Google Maps)
5.2 Survey Distribution
A list of 31 filter factories (counting Myanmar as one) was generated in conjunction with the
Ceramics Filter Manufacturing Working Group. Thirty-one factories in 20 countries thought to be
currently producing filters on a full-time, part-time or on a per-order basis were sent an e-mail
describing the project and inviting them to participate (see Appendix 2). Twenty-seven factory
representatives (n=31, 87%) responded positively to the initial e-mail, two (6%) did not respond
(Iraq, a different Myanmar factory), one (3%) declined participation (Ghana), and one (3%) did not
meet the criteria as they are no longer producing filters (Senegal). After willingness to participate

42
Current Practices in Manufacturing of Ceramic Pot Filters for Water Treatment
was confirmed, the questionnaire was e-mailed (see Appendix 5) along with a request to set a date
and time for an interview.
5.3 Study Participants and General Characteristics
Of the 27 factories who agreed to participate, nine (33%) did not respond to the survey. Of the 18
participants (n=27, 67%), six respondents (n=18, 33%) filled out the questionnaire and returned it
via e-mail, eight (44%) were filled out by the author during a telephone interview and four (22%)
both participated in an interview and completed the questionnaire. No respondents were
excluded from the survey. However, as mentioned earlier, often the eight Myanmar factories were
counted as one.
Of the 25 total participants (n=25, QBG11-12), nine (36%) factories were set up with technical
assistance from Potters for Peace, two (8%) Potters without Borders, two (8%) Filter Pure, one
(4%) AFA Guatemala, eight (32%) Thirst Aid, one (4%) American Red Cross, and one (4%) RDI-C &
Potters for Peace. Participating factories have been producing filters since 2001, 16 of which
(n=24, 67%) have been set up since 2007 (QBG13-14). Table 5-1 includes details of participating
factories, reference codes, the organisation which provided technical assistance, the year
production started and the level of production.
Table 5-1 Participating Factories
Code Country Organization
Year
Started Production
Benin Benin Potters without Borders 2007 Part TimeCam-1 Cambodia-IDE Potters for Peace 2001 Full Time
Cam-2 Cambodia-RDI RDI-C 2003 Full Time
Colombia Colombia Potters for Peace 2007 Full Time
DR Dominican Republic Filter Pure 2006 Part Time
Guate-1 Guatemala- Antigua AFA Guatemala 2004 Full TimeGuate-2 Guatemala- San Mateo Potters for Peace 2005 Part Time
Indo-1 Indonesia- Bali Potters for Peace 2007 On Order
Indo-2 Indonesia- Bandung RDIC & Potters for Peace 2005 Full Time
MM-1 Myanmar- Twante Thirst-Aid 2008 Full Time
MM-2 Myanmar- Twante Thirst-Aid 2007 Full Time
MM-3 Myanmar- Twante Thirst-Aid 2009 Full TimeMM-4 Myanmar- Twante Thirst-Aid 2009 Full Time
MM-5 Myanmar-Yangon Thirst-Aid 2008 Full Time
MM-6 Myanmar- Pathein Thirst-Aid 2008 Full Time
MM-7 Myanmar- Yangon Thirst-Aid 2006 Full Time
MM-8 Myanmar- Sagaing Thirst-Aid 2009 Part TimeNica-1 Nicaragua- San Marcos Potters for Peace 1998 Full Time
Nica-2 Nicaragua-Ciudad Sandino Potters for Peace xx Part Time
Nigeria Nigeria Potters for Peace 2008 Full Time
SL-1 Sri Lanka- Kelanya Potters for Peace 2007 Full Time
SL-2 Sri Lanka- Matara American Red Cross 2008 Full Time
Tanz-1 Tanzania- Arusha Filter Pure 2009 Full TimeTanz-2 Tanzania- Tabora Potters for Peace 2007 On Order
Yemen Yemen Potters without Borders 2008 Full Time

43
Current Practices in Manufacturing of Ceramic Pot Filters for Water Treatment
Of 25 participants (n=21, QBG-3), seven surveys (33%) were completed by directors/general
managers, eight (38%) by owners, three (14%) by supervisors/production managers, two (10%) by
administrators and one (5%) by a legal representative. Information for SL-1 was provided by a
representative of a formerly supporting organisation since the current factory contact person was
not available.
Monthly production (QBG18) ranges from 45 filters per month to 4480 filters per month,
averaging 1500 filters per month (n=25). Figure 5-2 details the current level of production at each
factory.
Monthly Filter Production
250
30002880
1200
200
2800
100
600450
2800
4480
2100
2800
1300
28082600
400
1200
660450
1800
500
20045
2100
0
500
1000
1500
2000
2500
3000
3500
4000
4500
5000
Benin
Cam
-1
Cam
-2
Colo
mbia
DR
Guate
-1
Guate
-2
Indo-1
Indo-2
MM
-1
MM
-2
MM
-3
MM
-4
MM
-5
MM
-6
MM
-7
MM
-8
Nic
a-1
Nic
a-2
Nig
eria
SL-1
SL-2
Tanz-1
Tanz-2
Yem
en
Filter Factory
Fil
ters
Pro
du
ce
d
Figure 5-2 Monthly Filter Production
Total production for all participating filter factories is over 37,700 filters per month. Nine factories
(36%) produce 500 filters or fewer per month, two factories (8%) produce between 500 and 1,000
filters per month, four factories (16%) produce between 1,000 and 2,000 filters per month, nine
factories (36%) produce 2,000-3,000 filters per month and one factory (4%) produces more than
3,000 filters per month.
Complete filter units are sold for (n=24, QBG21-22) an average wholesale price of U$15.71 ranging
from U$7.50-35.00. Average retail price is U$16.68 (n=23), ranging from U$8.00-35.00. For just
the replacement element, wholesale prices average U$7.78 and range from U$3.00-25.00; retail
prices average U$8.60 and range from U$4.00-25.00. See Figure 5-3 for retail price details per
factory.

44
Current Practices in Manufacturing of Ceramic Pot Filters for Water Treatment
CWF Retail Prices
$0.00
$5.00
$10.00
$15.00
$20.00
$25.00
$30.00
$35.00
$40.00
Benin
Cam
-1
Cam
-2
Colo
mbia
DR
Guate
-1
Guate
-2
Indo-1
Indo-2
MM
-1
MM
-2
MM
-3
MM
-4
MM
-5
MM
-6
MM
-7
MM
-8
Nic
a-1
Nic
a-2
Nig
eria
Tanz-1
Tanz-2
Yem
en
Filter Factory
Filte
r P
rice (
US
$)
Complete Unit Retail Element Retail
Figure 5-3 CWF Retail Prices
Fifteen factories (n=24, 62%) sell more than 50% of their filters to non-governmental organisations
(NGOs) or international non-governmental organisations (INGOs). Six factories (25%) sell 50-100%
of their filters to the public. One factory (MM-8) sells 90% of their filters to the government. Filters
manufactured at SL-2 are sold exclusively to the Sri Lankan Red Cross (QBG23-24).
5.4 Factory Set-Up
5.4.1 Equipment
Equipment (QMP1) varies per factory. Only the Yemen factory (n=25,
4%) does not have an electric mill and therefore pulverises clay
manually. Fifteen factories (60%) have mortar mixers. Thirteen factories
(52%) have pug-mills including the eight Myanmar factories, Colombia,
DR, Nica-1 and both of the Sri Lanka (SL-1, SL-2) factories. Three
factories (12%) have manual presses while 24 (96%) have hydraulic
presses (numbers add to more than 100% because some have both).
Only three factories (12%) have air compressors and seven (28%) have
pottery wheels. Not all equipment at the factories is used for filter
production, however. In Table 5-2, type and number of equipment in
each factory are displayed.
Photo 5-1 Pug Mill
(Thirst-Aid 2009b)

45
Current Practices in Manufacturing of Ceramic Pot Filters for Water Treatment
Table 5-2 Factory Equipment
Country
Hammer
Mill
Mortar
mixer
Pug
Mill
Manual
Press
Hydraulic
Press
Air
Compressor
Pottery
Wheel Kilns
Benin 1 1 0 0 1 0 0 1
Cam-1 2 2 0 1 2 1 0 7
Cam-2 1 2 0 0 1 0 3 5
Colombia 1 0 1 0 1 0 0 1
DR 2 1 1 0 1 0 3 3
Guate-1 1 1 0 0 1 1 1 2
Guate-2 0 1 0 0 1 0 0 1
Indo-1 1 0 0 0 1 2 1 2
Indo-2 2 1 0 2 0 0 2 1
MM-1 1 1 1 0 1 0 0 3
MM-2 1 1 1 0 2 0 0 5
MM-3 1 1 1 0 1 0 0 3
MM-4 1 1 1 0 1 0 0 3
MM-5 1 0 1 0 2 0 0 3
MM-6 1 0 1 0 2 0 0 4
MM-7 1 1 1 0 3 0 0 2
MM-8 1 0 1 0 1 0 0 2
Nica-1 2 0 1 1 1 0 0 6
Nica-2 1 0 0 0 1 0 0 1
Nigeria 1 0 0 0 1 0 0 1
SL-1 1 2 1 0 1 0 0 1
SL-2 1 3 3 0 2 0 0 5
Tanz-1 1 1 0 0 1 0 2 3
Tanz-2 1 0 0 0 1 0 1 1
Yemen 0 0 0 0 1 0 0 1
None 2 10 12 22 1 22 18 0
One 19 11 12 2 18 2 3 9
Two 4 3 0 1 5 1 2 4
Three 0 1 1 0 1 0 2 6
Number of factories that have:
5.4.2 Water
Source water (QMP31-37) is used in filter production and for flow rate testing. Fourteen factories
(n=18, 78%) consider their water source reliable, one factory (6%) considers it somewhat reliable
and three facilities (17%) do not, two of which have intermittent piped supply and one which has
their water trucked in. Eight factories (n=18, 44%) have 24-hr piped municipal supply, others rely
upon intermittent supply (1, 6%), water being trucked in (2, 12%), or alternative sources including
ground or rainwater (3, 17%). Four factories use a combination of sources (22%).
Source water has been tested for arsenic at three factories (n=16, 19%). No arsenic was detected
at any of the eight Myanmar factories, 0 ppb in the groundwater at Cam-1, and “not much” at
Tanz-2. The eight Myanmar factories are currently testing source water for heavy metals, however
results are not yet available. SL-2 has tested for faecal coliform, total coliform and ferrous
compounds, the latter, is present in the dry season. Cam-2, Guate-2 and Indo-2 have had their

46
Current Practices in Manufacturing of Ceramic Pot Filters for Water Treatment
source water tested, but details were not available. Tanz-2 has also tested for sodium and fluoride.
The remaining 10 factories (63%) have not tested their source water or do not know if it has been
tested.
5.4.3 Electricity
Eight factories (n=24, 33%) get 100% of their electrical supply from the grid. Three (13%) do not
use electricity in production (Indo-2, Guate-1 and Yemen). Six factories (25%) rely upon a
generator (Cam-2, MM-1, MM-2, MM-3, MM-4 and MM-6) and the rest (7, 30%) rely upon both
the grid and a generator for their power supply (QMP2). Energy is a big expense in Nigeria, so
effort is made to do most things manually.
5.5 Materials
5.5.1 Clay
Clay sources (n=17, QMP7) are those typically used by local potters (6, 35%). Reported criteria for
selecting clay are quality (6, 35%), plasticity (5, 30%), proximity of the mine (4, 24%), and the
colour of the clay (1, 6%). Three factories (18%) reported exploring various mines before finding a
clay that worked. Five factories (30%) mentioned having identified reliable clay sources, however,
the Yemen factory finds getting clay of a consistent quality challenging because there is no clay
mine per se, as clay is collected from excavations at construction sites and this leads to
inconsistencies. The Colombia factory reported that if clay is not chosen carefully, it can result in a
failure rate of over 20%. Three factories (18%) mentioned experimenting with clay. At Cam-1 and
Indo-2, clay is tested for plasticity and prototypes are test fired and evaluated for cracking,
breaking, firing temperature and filtration rates. In Nigeria, university students evaluate suitability
in a laboratory by testing for shrinkage, ease of use, firing temperature, filtration and materials
composition. Seventeen factories (n=18, QMP8-14) receive their clay directly from the mine and
process it themselves (94%). Cam-2 receives their clay pre-formed into bricks. Two factories (Benin
and SL-2, 11%) blend three clays with different characteristics.
Sixteen factories (n=17, 94%) mill their clay and 15 factories (n=18, 83%), sieve their clay. The clay
sieve sizes (n=11) range from 9 to 80 mesh using Tyler Equivalent13 (see Appendix 3 for Tyler Mesh
chart). Four factories (n=11, 36%) use between 9-16 mesh, three factories (27%) use between 21-
13 Tyler mesh size can be determined by counting the number of openings per linear inch which controls the
particle size of material passed through the sieve

47
Current Practices in Manufacturing of Ceramic Pot Filters for Water Treatment
30 mesh and four factories (36%) report using between 60-80 mesh sieves. Figure 5-4 below
shows the clay mesh sizes being used.
Clay Mesh Sizes
0
1
2
3
4
5
9-16 21-30 60-80
Mesh Size
Nu
mb
er
of
Facto
ries
Burn-out Mesh Sizes
0
1
2
3
4
5
6
7
8
8-18 21-48 60-80
Mesh Size
Nu
mb
er
of
Facto
ries
Figure 5-4 Clay Mesh Sizes Figure 5-5 Burn-out Mesh Sizes
5.5.2 Burn-out Material
Seven factories (n=18, 39%, QMP 19-26) use rice husks and 10 use sawdust (56%). The Benin
factory (5%) uses a combination of sawdust and peanut shells in their mixture. Of those using
sawdust (n=10), three (30%) always use pine, one (10%) always uses guanacaste (Nica-2), one
(10%) always uses pine and gravellea (Tanz-1), one (10%) predominantly uses oak (Nigeria), and
four (40%) use what is available. One factory (DR) found that when using sawdust from oak in their
filter mixture it left an oily residue and resulted in a reduced flow rate.
Seven factories (n=18, 39%) mill their own burn-out materials and 15 (n= 17, 88%) sieve it. Mesh
sizes for sieving combustible material (n=12) range from 8-18 mesh (7, 58%), 21-48 mesh (3, 25%),
and 60-80 mesh (2, 17%). Indo-2 uses two sieve sizes to eliminate both the larger and finer
particles. Cam-1 and Indo-2 use different mills for clay and burn-out material. Burn-out sieve size
ranges are detailed above in Figure 5-5 above.
Hammer mill or grinder blades are sharpened (n=11, QMP27) monthly, every two months (3, 27%)
every 6 months to a year (3, 27%), every 2,000 kilos of clay (1, 9%) or as needed or don’t know (4,
36%). The Dominican Republic (DR) factory reported that sharpening the hammer mill blades helps
achieve a finer particle size of burn-out material. The Nigeria factory has successfully used a
kitchen blender to increase yield from sawdust and as an alternative, SL-2 uses a chilli grinder for
milling rice husks.

48
Current Practices in Manufacturing of Ceramic Pot Filters for Water Treatment
The Myanmar factories had difficulties working with rice husks initially since the high silica content
in the outer rice husks tended to block the pores; however, they have had success using only the
inner rice husks. Indo-2 found that using sawdust as a burn-out material increased shrinkage too
much yet Cam-1 expressed a preference for sawdust if it were more readily available since the
filters would be smoother and nicer looking.
5.5.3 Additional Materials
Two factories, DR and Tanz-1 (n=18, 11%, QMP62-67), add colloidal silver diluted in water to their
dry mix. Cam-2 adds laterite14 and others include grog15 (Indo-2) or sand (Guate-1) in their regular
formulae. Guate-2 sometimes adds grog from bricks which did not fire well. SL-2 has experimented
with adding grog, however, they found that it reduced shrinkage to the extent the filter elements
would not fit in the receptacles.
5.6 Mixing
Where rice husks are used (n=7, QFP1-8), six factories (n=6, 100%) report measuring materials by
weight. Ratios vary between 76:24 to 90:10, clay to rice husk. Table 5-3 lists filter mixture ratios
where rice husks are used.
Table 5-3 Clay-Rice Husk Mixture
Cam-1 n/a 16 Rice Husk Weight 76 24
Cam-2 don't
know
don't
know
Rice Husk Weight 75 20 5 Laterite
Indo-1 12 12 Rice Husk Weight 90 10
Indo-2 n/a don’t
know
Rice Husk Weight 84.5 10 5.5 Grog/failed
filters
MM-All 30 16 Rice Husk Weight 88 12
SL-1 80 60* Rice Husk blank blank blank
SL-2 80 18 Rice Husk Weight 87 13
Ratio Clay
(%)
Ratio
Burnable
(%)
Ratio
Other (%)
Other
material
Country Clay Mesh Burn-out
Mesh
Measured
by
Burn-out
type
*this might be an error
14 Laterite is thought to provide additional viral binding sites.
15 Grog is ground up fired clay
49
Current Practices in Manufacturing of Ceramic Pot Filters for Water Treatment
Clay to sawdust ratios (n=10), when mixed by weight (n=6, 60%) range between 75:25 to 95:5, clay
to sawdust. When mixed by volume (n=4, 40%), however, the ratio ranges from 53:47 to 50:50
clay to sawdust. The Benin factory includes both sawdust and peanut husks in their filter mix. In
Table 5-4 mixture ratios where sawdust is used are presented.
Table 5-4 Clay-Sawdust Mixture
Country Clay Mesh Burn-out
Mesh
Burn-out Measured
by:
Ratio Clay
(%)
Ratio Burn-
out (%)
Ratio
Other (%)
Other
Colombia 21 21 Saw dust Weight 84.4 15.6
Guate-1 10 10 Saw dust Weight Private Private Private Sand
Nica-1 n/a 8 Saw dust Weight 93.8 6.25
Nica-2 80 80* Saw dust Weight 85.7 14.3
Tanz-2 Mosq. net Mosq. net Saw dust Weight 75 25
Yemen 9 or 16 9 or 16 Saw dust Weight 95 5
DR 60 48 Saw dust Volume 53 47 Private Silver
Guate-2 don’t
know
don't
know
Saw dust Volume blank blank
Nigeria blank don't
know
Saw dust Volume 50 50
Tanz-1 25 30 Saw dust Volume 53 47 Private Silver
Benin 16 don't
know
Saw dust Both 63.6 19.2 16.16 Peanut
*this might be an error, 8 mesh is more likely.
Mixing times (QFP9, 10) vary greatly with dry mixing (n=20) lasting for between five minutes and
one hour (avg=13, stdev=12). Wet mixing times (n=21) range between 5 and 45 minutes (avg=15,
stdev=9). Mixing times are detailed in Table 5-5, Table 5-7 and Table 5-6.

50
Current Practices in Manufacturing of Ceramic Pot Filters for Water Treatment
Table 5-5 Mixing Times (all manual) Table 5-6 Mixing Times (all electric)
Filter
Factory
Time Dry
(min)
Time Wet
(min)
MM-2 10 20
MM-5 5 5
MM-6 20 15
MM-8 10 15
Nica-2 10 10
Tanz-2 15 15
Non electric mixer or by hand
Table 5-7 Mixing Times (manual/electric)
Filter
Factory
Time Dry
(min)
Time Wet
(min)
Guate-1 blank 30
Indo-2 60 15
MM-1 10 20
MM-3 20 20
MM-4 10 15
MM7 10 15
Non-electric dry and electric wet
Filter
Factory
Time Dry
(min)
Time Wet
(min)
Benin 10 10
Cam-1 8 8
Cam-2 10 10
Colombia 10 10
DR 5 10
Indo-1 10 10
Nica-1 0 45*
SL-1 5 6
SL-2 8 as needed
Tanz-1 5 10
Electric Mixer - Both
* due to the type of mixer, clay and
burn-out material are not mixed
prior to adding water.
At Indo-2, dry materials are mixed for one hour manually as they have found that when mixed for
less than 50 minutes, flow rates become inconsistent. In Nigeria, the mixing process takes half a
day, where ingredients are mixed manually on the ground and then pounded in a mortar and
pestle. At Nica-2, because of the type of mixer, dry ingredients are not mixed in advance of adding
water.
Photo 5-2 Mixing Dry Materials
in a Drum Mixer, Myanmar
(Thirst-Aid 2009b)
Photo 5-3 Mixing in a Mortar Mixer,
Nicaragua
(Rayner 2006)
Photo 5-4 Manual Mixing, adding
water to filter mixture, Colombia
(Asopafin 2009)
Fifteen factories (n=18, 83%, QFP11,12) wedge the clay before pressing. The Nigeria factory also
pounds the mixture using a mortar and pestle. Only the Myanmar factories use pug mills. They

51
Current Practices in Manufacturing of Ceramic Pot Filters for Water Treatment
started using non de-airing pug mills in all of the Myanmar factories after finding that their use
resulted in much stronger filters.
Eight factories (n=16, QFP14,15) always press filters the same day the mix is made and do not
reprocess dried mixture (Guate-1, Guate-2, Indo-1, Indo-2, MM-all, Nica-1, Nigeria, Tanz-2). Three
factories (19%) sometimes or normally leave the mixture overnight, but do not reprocess dried
mixture (Benin, Cam-1, Cam-2). One factory (6%) presses the same day but will also reprocess
dried mixture (Yemen). Four factories (25%) use mixture prepared the day before and will
reprocess dried mixture (Nica-2, SL-2, Tanz-1, DR). Two of these factories (DR and Tanz-1) include
silver in the mixture which makes it expensive to waste.
Three factories (n=16, 19%, QFP5-8) do not adjust their formula (Benin, Cam-1, Nica-2). Guate-2
(6%) adjusts their formula regularly, and twelve (75%) adjust their formula as needed. Reasons
given for adjusting the formula include clay quality (31%, Guate-1, Nigeria, Tanz-2, Yemen, DR),
flow rate (13%, Cam-2, DR), variation in rice husk (6%, MM-all), the weather (13%, Tanz-2, Indo-2),
or a quality control issue (6%, DR). At Indo-2 three distinct mixes are prepared daily to make filters
suited to different heights in the kiln and small adjustments are made to the formula after every
firing.
5.7 Forming Filter Elements
In Rabinal, Guatemala, filters are still being made on the potter’s wheel and sold through AFA
Guatemala (Guate-1). Otherwise, all factories (n=18), including Guate-1, press filters using a press
with moulds.
5.7.1 Presses
Seventeen factories (n=18, 94%) use a hydraulic press (QFP19-20). At Indo-2, the non-hydraulic
press works with a system of weights and pulleys. All presses were made locally except for one
imported from Cambodia (SL-2), one from Holland (Indo-1), one from Nicaragua (Guate-2) and one
portable press from Nicaragua (Nigeria). Photo 5-5, Photo 5-6, Photo 5-7, and Photo 5-8 show
different presses with moulds made from different materials.

52
Current Practices in Manufacturing of Ceramic Pot Filters for Water Treatment
Photo 5-5 Filter Press with aluminium mould, Indo-2
(Pelita 2009)
Photo 5-6 Filter Press with cast-iron mould,
Cam-1
(IDECambodia 2009)
Photo 5-7 Filter Press with wood mould, Myanmar
(Thirst-Aid 2009b)
Photo 5-8 Filter Press with cement mould, DR
(FilterPure 2009)
5.7.2 Moulds
Three mould designs are currently being used (n=25, QFP25-27). Fifteen (60%) factories use flat-
bottomed moulds based on the original hand-thrown design. The eight (32%) Myanmar factories
use a semi-circle round bottomed mould and the two Filter Pure factories (8%, DR, Tanz-1) use an
oblong, round-bottomed mould. Flat bottomed moulds are made out of aluminium (12, 80%) or
cast iron (3, 20%). Both of the Filter Pure (100%) moulds are made out of cement. In Myanmar,
moulds are made out of cast iron, steel, aluminium or are carved from teak wood. Table 5-8 shows
where moulds were made, mould material, filter dimensions, filter capacity and clay quantity.
Reported filter wall thickness ranges from 1-3 cm. Filter dimensions should be considered
approximate as shrinkage and firing time will affect the final filter size. Although the survey
requested finished filter size, some participants may have provided mould dimensions. In addition,

53
Current Practices in Manufacturing of Ceramic Pot Filters for Water Treatment
filter capacities for the five factories whose moulds were made in Nicaragua range from seven to
nine litres. This difference might be more than can be accounted for by shrinkage.
Table 5-8 Mould and Filter Sizes
Country Made in: Material:
Filter
Height
(cm)
Filter
Diam.
(cm)
Walls
Thick
(cm)
Capacity
(litres)
Quantity
in press
(kg)
Benin blank Aluminium 24 32 0.1* 8 8
Cam-1 Cambodia Cast-iron 24 33.5 1.7 10 9
Cam-2 Cambodia Aluminium blank blank blank 11 8
Colombia blank Aluminium blank blank blank blank 8
DR
Dominican
Republic Cement 28 28 1.6 6 5.4
Guate-1 Guatemala Aluminium 23 32 blank 7
don't
know
Guate-2 blank Aluminium 28** 30.5** 2 11** blank
Indo-1 Nicaragua Aluminium 25 32 1.5 9 8.4
Indo-2 Indonesia Aluminium blank blank 1.8 8 5.7
MM-All Myanmar
Cast iron, Carved teak,
Steel or Aluminium blank blank 1.4 10 7
Nica-1 Managua Aluminium 23.5 32 1 8 7.3
Nica-2 Nicaragua Aluminium 22.5 31 blank 7 5
Nigeria Nicaragua Aluminium blank blank blank blank blank
SL-1 Cambodia Cast Iron 14* blank 3 10 10.5
SL-2 Cambodia Cast Iron 23 32 2.5 8 10
Tanz-1 Tanzania Cement 29 33 2.1 8 8
Tanz-2 Nicaragua Aluminium blank blank 0.5* 7 3*
Yemen Nicaragua Aluminium blank blank blank 7 9
**calcualated from answers provided in inches and US gallons.
*this information does not appear to be accurate
All of the filter factories (n=17, QFP36-38) expressed satisfaction with their mould release.
Thirteen factories (n=18, 72%) use plastic bags to prevent the clay from sticking to the mould. The
Myanmar factories brush vegetable oil on plastic bags to prevent the clay from sticking to the
plastic bags. Four other factories use lubricant including coconut oil (3, 17%: SL-1, SL-2, Indo-2) and
palm oil (6%, Colombia). Cam-1 is testing different oils to replace plastic bags to reduce the need
to smooth crease lines caused by the plastic bags when pressing. They are currently experimenting
with coconut, vegetable and fish oil, but have found that vegetable oil did not work because the
mould is not polished. Cam-2 reported having experimented with oils, but did not find it as
effective as plastic bags. SL-2 mentioned that coconut oil did not work with the aluminium mould;
however after switching to a cast iron mould it worked. DR reported that thin plastic bags last for
50 pressings; however Nigeria reported that plastic bags are not an insignificant expense. Nica-1
doubles the bags for pressing.

54
Current Practices in Manufacturing of Ceramic Pot Filters for Water Treatment
5.8 Trimming
All factories (n=18, 100%, QFP32-34,43-44) stamp their filters with a lot number and eight (n=16,
50%) also stamp them with a logo. All but SL-1 and Tanz-2 (n=18, 89%) touch up or trim filters
after pressing. SL-2, Benin, Yemen, MM-all, Guate-2, and Tanz-1 only touch up the lip of the filters
and do not touch the inside or outside of the filter. Of those that trim their filters (n=10), eight
trim the bottom of the filter, all smooth the sides and two roughen the sides as necessary (Guate-
1, Nica-1).
5.9 Drying
Drying times vary depending on the season and weather conditions (humidity, sun, wind). Drying
times (n=24, QFP45-48) average seven days in the dry season (min 3, max 21) and 13 in the wet
season (min 4, max 45). Figure 5-6 shows drying time ranges.
Drying Time Ranges
0
2
4
6
8
10
12
14
16
3 to 6 days 7 to 13 14 plus
Number of Days
Nu
mb
er
of
Fa
cto
rie
s
Dry Seson
Wet Season
Figure 5-6 Drying Time Ranges
Cam-1, Cam-2, Colombia, DR, Guate-2, Indo-2, Nigeria and SL-2 mentioned drying time as a
challenge (n=18, 44%). Mould, which can develop on wet clay, was reported as a problem since
the mould marks do not fire out (Cam-1), in response, production during the wet season is
decreased by 15% and increased in the dry season. Indo-2 dries filters on rolling racks and
relocates them to near the kiln so the warmth accelerates the drying process. Myanmar factories
have increased storage space for the filters to dry during the rainy season. Two factories (11%)
sometimes artificially dry their filters. In Nigeria, locally made convection ovens can dry filters in
two hours; however filters are usually left to dry naturally. SL-2 has converted a large kiln into a
drying room and warms it to 45°C for two days using leftover charcoal from previous firings. Nica-1
and Nica-2 resolve the problem of insects burrowing into the clay (beetles) by covering filters with

55
Current Practices in Manufacturing of Ceramic Pot Filters for Water Treatment
plastic bags. Figure 5-7 illustrates drying times during the wet and dry seasons at each of the filter
factories.
Drying Times
0
5
10
15
20
25
30
35
40
45
50
Be
nin
Cam
-1
Cam
-2
Co
lom
bia
DR
Gu
ate
-1
Gu
ate
-2
Ind
o-1
Ind
o-2
MM
-1
MM
-2
MM
-3
MM
-4
MM
-5
MM
-6
MM
-7
MM
-8
Nic
a-1
Nic
a-2
Nig
eri
a
SL
-1
SL
-2
Ta
nz-1
Ta
nz-2
Ye
me
n
Filter Factory
Da
ys
dry season
wet season
Figure 5-7 Drying Times
5.10 Firing
5.10.1 Kilns
Factories (n=24, QMP1, QFP56-7) have between one and seven
kilns with an average of 2.75 kilns. Kiln capacity used in production
(n=18) ranges from 40 to 200 filters with an average of 86 filters
per kiln. Kiln types vary between factories. Eight factories (n=18,
44%) have Mani Kilns (downdraft), which hold 50 filters. In
addition, Cam-2, DR and the Myanmar factories (17%) have Mani
Arch Top kilns which hold between 70-200 filters. Six factories
have updraft kilns (33%) with capacities ranging from 40 to 150
filters, SL-2 has another type of downdraft kiln which holds 100
filters and Yemen has a propane fired kiln with a 98 filter capacity
(see Figure 3-1 and Figure 3-2 for diagrams of heat-flow in down-
draft and up-draft kilns). Six factories (n=18, 33%, QFP58) stack filters directly on top of each other
and twelve (67%) use clay spacers to avoid carbon marks on the filters. Both Tanz-1 and DR
factories (n=16, 13%) aim to leave a carbon residual inside the filter walls, whereas the others (14,
88%) do not. For five factories (28%), production is limited by the number of kilns and the amount
Photo 5-9 Mani Kiln
(Hernandez 2006)

56
Current Practices in Manufacturing of Ceramic Pot Filters for Water Treatment
of time it takes to fire and cool the kilns (Cam-2, Guate-2, Indo-1, Indo-2 and Nigeria). Kiln details
are presented in Table 5-9.
Table 5-9 Kilns
Country #Kilns Sizes Type Capacity Fuel
Benin blank blank Updraft 150 Oil
Cam-1 7 1.9 m³ Mani 50 Wood
Cam-2 5 90 filters Mani, Mani Arch,
Other DD
90 Wood
Colombia 1 2.5x2.5x3.0m Updraft 125 Wood
DR 3 5x3x4H ft? Mani Arch 200 Wood
Guate-1 2 100 filters each Updraft 100 Wood
Guate-2 1 45 filters Updraft 40 Wood
Indo-1 2 75 filters each Mani 75 Wood
Indo-2 1 150 filters Updraft 150 Wood
MM-all 2 to 5 blank Mani & Mani Arch 54/72 Wood
Nica-1 6 1.4 m³ Mani 50 Wood
Nica-2 1 50 filters Mani 50 Wood
Nigeria 1 standard Mani Mani 50 Wood
SL-1 1 80 filters Updraft 80 Wood
SL-2 5 Some are huge for
tile making
Other Down draft 100 Wood
Tanz-1 3 1 m³ & 1.5 m³ Mani & others 50, 30, 5 Wood, Propane
Tanz-2 1 50 filters blank 50 Wood
Yemen 1 4.5 m³ Other 98 Propane
5.10.2 Fuel
Fifteen factories fire with wood (n=18, 83%, QFP61). Tanz-1 fires to 600°C with wood, then
switches to propane for the last two hours. The Yemen factory fires exclusively with propane and
the Benin factory fires with oil.
Photo 5-10 Filters Stacked for
Firing, Myanmar
(Thirst-Aid 2009b)
Photo 5-11 Kiln being Fired,
Cam-1
(IDECambodia 2009)
Photo 5-12 Kiln and Fired Filters, Yemen
(SilverFilterCompany 2009)

57
Current Practices in Manufacturing of Ceramic Pot Filters for Water Treatment
Several factories have experimented with different fuel sources. Cam-1 tested with rice husks and
a blower system. Although it worked, kilns are fired with wood since it is available. Cam-2 reported
that the cost of experimenting with alternative fuel sources is high. They tried injecting rice husks
but they didn’t burn properly, produced a lot of ash and the cost of electricity made it too
expensive. They also tried firing with compressed fuel logs but the machines weren’t durable
enough. Myanmar did not have success firing with rice husks. They did however fire with oil
successfully but it was too expensive.
Photo 5-13 Experimenting with Alternative Fuel Sources, Colombia
(sawdust and coffee husks)
(Rivera 2008)
The Nigeria factory commented that normal firewood does not reach peak temperatures, and
therefore dense wood must be used. The quantity of wood required for a firing will vary
depending on the type and dryness of the wood and the kiln efficiency and size. The Colombia
factory reported using an average 600 kg of wood to fire a 125 filter capacity updraft kiln for 5-6
hours. In Nicaragua, an estimated 200 kg of wood is used to fire a 50 filter Mani Kiln for 8-9 hours
(Rayner 2006). When using propane, using several smaller canisters helps maintain pressure, as
reported by the Yemen factory.
5.10.3 Measuring Temperature
Target temperatures range from 700°C to 980°C and average 870°C (QFP62-66). Temperature is
monitored visually and measured with pyrometers and/or pyrometric cones. Thirteen factories
(n=18, 72%) use pyrometers to measure the temperature in the kilns and nine factories (50%) use
cones (see Section 3.4.6 for more information on pyrometric cones). Four factories (n=18, 22%)
use both. In addition, six factories (33%) report estimating temperature visually (see Section 3.4.6
and Appendix 4), however at the Nigeria factory, estimating temperature visually did not work.

58
Current Practices in Manufacturing of Ceramic Pot Filters for Water Treatment
Of those that use cones (n=9), three use only one cone (Cam-1, Guate-1 and Nica-2), two use three
cones of the same number in different places in the kiln (Nigeria, Tanz-1), three (Cam-2, MM-all,
Guate-2) use two cones of different numbers and one (Nica-1) uses three cones of different
numbers. At Indo-1, temperature is measured with a pyrometer at six different locations in the
kiln. Some have reported difficulties acquiring pyrometers or cones in country (Indo-2, SL-2). With
that being said, factories (n=17) feel they always (8, 44%), almost always (7, 41%) or usually (2,
12%), follow their firing schedule, meeting desired temperature grades and soak times (FPQ65). At
least three factories (17%) mentioned that successful firings lie in the skill and experience of the
kiln master. In Table 5-10, details on firing practices are presented including firing times (QFP67)
which range from six to 14 hours. Kiln cooling times (QFP68) range from 12-24 hours.
Table 5-10 Firing Practices
Country Fuel
Pyro-
meter Cones Visual
Number
of Cones
Cone
numbers
Target
Temp °C
Frequency
Achieved
Fire
Time
(hrs)
Cam-2 Wood x x 2 012, 014 866 Always 10 to 12
MM-all Wood x x x 2 09, 010 900 Almost Always 6 to 7
Nigeria Wood x x 3 06 900 Almost Always 10 to 12
Tanz-1
Wood &
Propane x x x 3 012 880-900 Always 8
Cam-1 Wood x 1 014 830 Always 12
Guate-1 Wood x x varies 012 private blank private
Guate-2 Wood x 2 014, 012 847 Almost Always 11
Nica-1 Wood x 3 010,012,014 886 Always 8
Nica-2 Wood x x 1 012 830 Almost Always 8
Benin Oil x n/a n/a 900 Almost Always 12
Colombia Wood x n/a n/a 900 Usually 6
DR Wood x x n/a n/a 980 Always 12
Indo-1 Wood x n/a n/a 900 Always 8.5
Indo-2 Wood x x n/a n/a 832 Always 10 to 14
SL-1 Wood x n/a n/a 800 Almost Always 15
SL-2 Wood x n/a n/a 800 Almost Always 10 to 11
Tanz-2 Wood x n/a n/a 700-920 Usually 6 to 8
Yemen Propane x n/a n/a 880 Always 11
Figure 5-8 shows the percentage of filters which crack per kiln-load at each of the factories. All of
the factories reported that these rates are consistent except for Benin, Guate-2, Nica-1, Nica-2, SL-
2 and Tanz-1. SL-1 does not know if these rates are consistent.

59
Current Practices in Manufacturing of Ceramic Pot Filters for Water Treatment
Filters Cracked per Kiln-load (%)
3%
8%4%
8%
1% 0%
25%
1%4%
0%
6% 6% 6%4%
15%
6%
32%
0%0%
5%
10%
15%
20%
25%
30%
35%
Benin
Cam
-1
Cam
-2
Colom
bia
DR
Gua
te-1
Gua
te-2
Indo
-1
Indo
-2
MM
-all
Nica-
1
Nica-
2
Niger
iaSL-
1SL-
2
Tanz-
1
Tanz-
2
Yemen
Filter Factory
Filte
rs c
rac
ke
d p
er
firi
ng
(%
)
Figure 5-8 Filters Cracked per Kiln-load (%)
5.11 Silver
5.11.1 Silver Types
Two forms of silver are currently being used (n=18, QMP38-58), colloidal silver (15, 83%) and silver
nitrate (3, 17%). MM-all is included in both sums, since they currently use both. Tanz-2 does not
use either, but rather Katadyn tablets made of a sodium silver chloride complex with 0.1% silver
ions and 2.5% Sodium dichloroisocyanurante. Colloidal silver is being used in liquid (n=15, 7, 47%)
and powdered (10, 67%) form, Guate-2 and Benin use both. Silver nitrate is used in powdered
form (n=3, 100%). Filters are either dipped in (n=18, 10, 56%) or painted with a silver solution (6,
33%) or silver is added to the filter mixture and fired into the filter pots (2, 11%).
Silver Nitrate, used at Cam-2, MM-all and Indo-2, is purchased in country imported from either
China or Germany. Colloidal silver is imported from Germany (Reickerman - Spraylat) or Spain
(Argenol Labs – Collargol or Argenyl) in both powdered and liquid forms. In addition, Guate-2 is
using silver from USA and one factory wished to keep the information confidential. None of the
factories make their own colloidal silver. Indo-2 purchases silver nitrate in small packets from a
local reseller; the source and ppm therefore, are not confirmed.
5.11.2 Water Quality
Silver is diluted using a variety of water qualities (n=15) including water purified by reverse
osmosis (1, 7%), groundwater (3, 20%), filtered groundwater (1, 7%), municipal water (3, 20%),
municipal water without chlorine (1, 7%), deionised water (2, 13%), distilled water (1, 7%) potable

60
Current Practices in Manufacturing of Ceramic Pot Filters for Water Treatment
water (2, 13%) and untreated surface water (1, 7%). The factories which use silver nitrate, which
are included in the above counts, use water purified by reverse osmosis (MM-all), and deionised
water (Indo-2, Cam-2).
5.11.3 Silver Application Methods and Concentrations
Silver (n=18) is dipped (10, 56%), painted on (6, 33%) or fired into the filters (2, 11%). Cam-1 does
not paint the rim of the filters with silver. Table 5-11 details the concentration and dilution of
colloidal silver when applied by painting.
Table 5-11 Colloidal Silver Applied by Painting
Country
Silver
from: Company Form
Concen-tration
(%) PPM
Silver Solution
(ml)
Water
(ml)
Diluted Solution
(PPM)
Amount in
Filter (mg)
Cam-1 Spain Argenol Labs Liquid 3.2 32000 1 300 107 32
SL-1 Spain Argenol Labs Liquid 3.2 32000 2 300 213 64
SL-2 Spain Argenol Labs Liquid 3.2 32000 2 300 213 64Nica-1 Spain Argenol Labs Powder 3.2* 32000 2 300 213 64*
MM-all Germany
Reickerman- Spraylat Liquid 3.2 32000 3 333 288 96
Colloidal Silver Applied by Painting
*Reports using powdered silver, Argenol Labs only sells powdered silver to the filter factories of concentrations
between 70-75%, therefore, it is likely Nica-1 prepares a silver concentrate which is further diluted according to
the above specifications.
Table 5-12 details the concentration and amount of colloidal silver applied by dipping.
Table 5-12 Colloidal Silver Applied by Dipping
Country
Silver
from: Company Form
Concen-tration
(%) PPM
Silver
(grams)
water
(ml)
Silver solution
(PPM)
Benin Spain Argenol Labs Liquid/Powder 4 40000 14 40000 14*
Colombia Spain Argenol Labs Powder 75 750000 70 250000 210
Indo-1 Spain Argenol Labs Powder 75 750000 20 1000** 1500Yemen Spain Argenol Labs Powder 75 750000 14 40000 263
** This might be a typographical error. Confirmation was not possible.
Colloidal Silver Applied by Dipping
* If silver is purchased from Argenol Labs in powder form as reported, then it is between 70-75%. Using 75% silver
would result in the diluted solution being 263 PPM. If these figures are for the 3.2% solution from Argenol Labs, then
the PPM of the diluted solution would be 11.
Tanz-2 dips filters in a solution made from dissolving five tablets of Katadyn Micropur Forte, a
sodium silver chloride complex with 0.1% silver ions and 2.5% Sodium dichloroisocyanurante in
seven litres of water. Guate-1 paints their filters with a dilution of liquid colloidal silver mixed with
distilled water, but wished to maintain the quantity and dilution private. Guate-2 uses liquid
colloidal silver from USA, of an unknown concentration, diluted with tap water and applied by
painting it on. Tanz-1 and DR fire colloidal silver into their filters, however, the amount used is
confidential. They also paint colloidal silver onto fired filters to prevent post-contamination.
61
Current Practices in Manufacturing of Ceramic Pot Filters for Water Treatment
The Myanmar factories, Indo-2 and Cam-2 paint a silver nitrate solution on each filter. Myanmar
mixes 50 grams of silver nitrate per litre of water, which makes a 32,000 parts per million (ppm)
solution. This is provided to each factory for a week’s supply of concentrated solution. At the
factory, this concentrated solution is further diluted to make a 250 ppm solution for application to
the filters, the same dilution as used with colloidal silver. Cam-2 adds 100 grams of 99.8% silver
nitrate to 1500 ml of water to make a concentrate; 100 ml of this concentrate is then mixed with
18 litres of water which is enough to coat 60 filtering elements. Each element is coated with 300
ml, 200 ml on the inside and 100 ml on the outside. At Indo-2, 0.5 grams (ppm unknown) is added
to 400 ml of water which is painted onto each filter.
5.11.4 Silver Sensitivities
Silver is affected both by UV exposure and oxidation. Eight factories (n=14, 57%) mention storing
silver in conditions protecting it from UV light and/or in a black or dark container. Five (36%) store
it in the original or a sealed plastic container. Diluted silver is used immediately at eight factories
(n=11, 73%). Cam-1 and SL-1 (18%) mentioned storing diluted silver for one to two months, both
of which dip their filters. MM-all (9%) store a concentrated solution of silver nitrate (for dilution at
the factory) for one week.
5.12 Quality Control
Quality control takes place throughout the filter production process. It can be categorised into
inspection (visual, auditory and crack test), flow rate, and bacteriological testing. In Myanmar, 3rd
party inspections are performed on a random selection of 5% of all filters sold to NGOs. If any
filters fail inspection, the entire shipment is held up until the issue is resolved.
5.12.1 Visual Inspections
Visual Inspections (QQC17-18) take place throughout the production process at all factories (n=17,
100%). Eight factories (n=15, 53%) perform visual inspections before firing, flow rate testing, silver
application and packaging. Others, inspect filters visually before and during flow rate testing and
before silver application (Cam-1), before firing and before packaging (DR), after firing (Guate-1),
before packaging (Guate-2), before firing and before the flow test (Nica-1), before firing and
before silver application (Nigeria), before firing and after firing (Tanz-1), and before firing (Tanz-2).
Workers look for cracks (n=16, 15, 94%), deformity (9, 56%), defects or irregularities (8, 50%), and
uniformity of colour (3, 19%). Numbers add up to more than 100% due to multiple answers.

62
Current Practices in Manufacturing of Ceramic Pot Filters for Water Treatment
At the Indo-2 factory, two people are dedicated to quality control inspections. A magnifying glass
is used to find defects which are marked with chalk. Defective filters are then compared and
analysed to see if causes can be diagnosed. These procedures have been implemented to
emphasise and reinforce the importance of filter inspection and quality control.
5.12.2 Auditory Inspections
The sound a fired filter makes when knocked or tapped can indicate complete firing and
sometimes internal cracks. Auditory inspections are always performed (n=15, 47%, QQC20) at
seven factories including MM-all, DR, Guate-1, Nica-2, Nica-2, Benin and Nigeria factories, usually
at four factories (27%) including Colombia, Indo-1, Indo-2, Yemen, and sometimes at three
factories (20%) including Cam-2, SR-2, Tanz-1. At Cam-1, auditory inspections are performed on
ten filters per month.
5.12.3 Pressure (Crack) Tests
Pressure “crack” tests consist of submerging a filtering element in water only up to its rim and
holding it for about 10 seconds to see if any water appears on the inside of the element indicating
a crack (see Section 3.4.9). They are performed (n=15, QQC19) always at Benin, Cam-2, Indo-1,
Nica-1 and Nica-2 and MM-all factories. DR and Nigeria sometimes perform crack tests; however
seven factories (47%) do not perform crack tests. MM-all performs crack tests on all filters,
however they submerge the filters rim down and look for air bubbles in the water, an indication of
large pores, spaces or cracks.
5.12.4 Flow Rate Testing
All filter factories but two perform flow rate tests on 100% of their filters
(n=18, 89%, QQC1-9). DR performs flow tests on 8% of their filters and
Tanz-1 on 4%. Likewise, all factories but three soak their filters (83%, DR,
Tanz-1, Guate-2). Five factories soak their filters for 24 hours prior to
testing the flow rate (Benin, Indo-1, Nigeria, SL-1, SL-2, 28%). MM-all and
Nica-2 soak their filters for 12 hours (11%), Cam-1 for 6-12 hrs (6%),
Guate-1 soaks filters “until saturated” (6%) and the rest (6 factories, 33%)
soak filters for two to eight hours.
Eight factories (n=18, 44%) test the flow rate by placing the filtering
Photo 5-14 Soaking
Filters
(Rayner 2006)

63
Current Practices in Manufacturing of Ceramic Pot Filters for Water Treatment
element in a bucket and measuring the amount of water which filters through after an hour. Tanz-
1 measures the amount of water which passes through the filter after half an hour. Eight factories
use a T-device to measure the water level in the filtering element after an hour (44%). SL-1 has a
different method to measure the flow rate, but did not describe it.
Factory established acceptable flow rates range from 1.0 to 3.0 litres minimum and 2.0 to 5.0 litres
maximum, in the first hour. The Myanmar factories report that filters (10 L capacity) with a
maximum flow rate of 4.5 litres in the first hour consistently pass microbiological tests. Figure 5-9
shows the flow rate range each factory has established and the capacity (L) of their filtering
elements.
Filter Flow Rates
0
1
2
3
4
5
6
Benin
Ca
m-1
Ca
m-2
Colo
mbia
DR
Guate
-1
Guate
-2
Ind
o-1
Ind
o-2
MM
-All
Nic
a-1
Nic
a-2
Nig
eria
SL-1
SL-2
Ta
nz-1
Ta
nz-2
Yem
en
8 10 11 xx 6 7.1 11 9 8 10 8 7 xx 10 8 8 7 7.1
Country and Filter Capacity (litres)
Flo
w R
ate
(li
tres)
Figure 5-9 Flow Rate Ranges
Water used for soaking and flow rate testing (n=14, QQC10) is mostly disposed of on the ground
(8, 57%). At four factories the water is continuously reused (Indo-1, Nica-1, Cam-2 and Colombia).
At the Myanmar factories and Indo-2 the flow test water is re-used but the water used to soak the
filters is discarded. Guate-1 is located on an ecological coffee plantation and follow established
water disposal regulations. At SL-2 the water must be disposed of daily due to the threat of
mosquitoes. Other factories (Cam-1, Guate-1, Indo-2, Tanz-2) also dispose of water used for
soaking filters every day (36%). Nigeria, Nica-2 and Indo-1 change the water between every 10
days and two months depending on the condition of the water (21%). At Cam-2 there is no set
protocol.

64
Current Practices in Manufacturing of Ceramic Pot Filters for Water Treatment
5.12.5 Bacteriological Testing
Thirteen factories report carrying out bacteriological testing regularly (n=18, 72%, QQC12-16). The
quantity of filters that are regularly tested ranges from 0.2-15% (n=8). In addition, four factories
(22%) also reported having carried out microbiological tests on filters (Nica-1, Nica-2, SL-1,
Yemen). Nine factories (50%) test their filters at the factory, 14 factories (78%) use laboratories
and six factories (33%) use both. These numbers add up to more than 100% due to multiple
answers. None of the respondents provided the data set regarding acceptable ranges for test
results. In DR, no changes in production procedures are allowed without first being confirmed by
microbiological testing. Information on microbiological testing is presented in Table 5-13.

65
Current Practices in Manufacturing of Ceramic Pot Filters for Water Treatment
Table 5-13 Filter Effluent Testing
Country
Regula
r
Testin
g
Quantit
y (%
)
Fact
ory
Lab
Turbid
ity
pH
TC TTC F
luorid
e
Silv
er
Arsenic
Com
ments
Guate-1 yes blank x x F/L F/L F/L F/L F/L F/L F/L
Based on quality control
manuals.
Indo-1 yes 15% x F F F
Indo-2 yes 2% x L L L L L L
Two filters per week chosen
randomly. Monthly: effluent
water from 5-10 filters in the
field is tested.
Benin yes blank x L L L L L L blank
DR yes 8% x L L
Effluent water is also tested
from two filters in use every two
months.
Cam-1 yes 0.2% x x L F
Microbiological tests carried out
in lab. Field kit is used to
confirm silver application.
MM-All yes 1% x L
Tanz-1 yes 4% x x F/L
4% from each firing tested at
factory, 4% from every other
firing tested in lab.
Cam-2 yes blank x
Water quality index and primary
chemical contaminants are
tested for on a random sample
monthly.
Guate-2 yes blank x
Nigeria yes 10% x x
Hach tests in factory. Two or
three samples (in nine months)
tested in lab for E. coli and
chemical analysis.
SL-2 yes 2% x x
Presence/Absence Hydrogen
Sulfide kit in factory and some
samples to lab.
Tanz-2 yes blank x
Nica-1 no blank x L L
Also tests for streptococcus & E.
coli.
SL-1 no blank x x F/L F/L F/L F/L
Yemen no blank x F
Hach tests from time to time.
Clients conduct complete tests.
Colombia no blank Others have tested the filters.
Nica-2 no blank x
Key: F= in factory testing, L= laboratory testing
5.12.6 Failed Filters
Ten factories (n=15, 67%) reported that they do not reprocess greenware (dried but not yet fired)
filters which do not pass quality control (QFP15). They are destroyed and thrown away (MM-all,
Cam-2, Colombia, Guate-1, Nica-1, Nigeria), soaked and used to close the kiln door (Cam-1), or
used as road fill (Indo-2). Five factories reported reprocessing greenware (QFP15, DR, Nica-2, SL-2,

66
Current Practices in Manufacturing of Ceramic Pot Filters for Water Treatment
Tanz-1, and Yemen). When asked what is done with greenware which fails quality control
(QQC24), Tanz-2 also reported reprocessing it (n=15, 40%). Four factories mentioned re-milling the
dried filter mixture prior to re-hydrating it (Nica-2, SL-2, Tanz-1, and Tanz-2).
When asked if factories would patch a filter before firing (n=13, QQC22), one factory (8%) said
sometimes and 12 factories (92%) said no. Two answers from written surveys in Spanish were
omitted from the results because, upon reflection, the question was worded in such a way that it
could have been interpreted as referring to trimming the filter rather than patching a dried-and-
ready-to-fire filter.
Six factories do not ever re-fire filters (n=16, 38%, QQC23). Of the ten that do (63%), seven (n=10,
70%) do so to increase the flow rate, one if it is under fired (which can result in a low flow rate),
one rarely re-fires filters, and DR will re-fire a filter only if there is concern that it has been
exposed to contamination. Indo-2 has an 80% success rate at increasing the flow rate when re-
firing filters. However, if filters have a 1.2-1.3 litre per hour flow rate, a second firing will increase
the flow rate beyond their maximum allowable flow rate.
When fired filters do not pass quality control (n=16, QQC25) they are stored (SL-2), not used (Nica-
2), used as flower pots by the owner (Nica-1), or destroyed (12, 75%). MM-all drill a hole in the
bottom or break them to use for road-fill. At Indo-2, they are ground and added to mortar mix to
repair kilns with, ground to use in filter mixture, or used to fill in cracks in the road. At DR, where
silver is fired into the filter, broken pieces of filters are placed in the recipient to provide residual
protection in filtered water. At Tanz-1, filters are occasionally milled and added to filter mixture.
At Cam-2, destroyed filters are collected by local people and used to fill potholes.
5.12.7 Filter Logs
All factories keep filter logs (n=18, 100%, QQC29,30). Thirteen keep them always (72%), Benin,
Colombia and DR, usually (17%) and Nica-2 and Cam-2 keep them sometimes (11%). Sixteen
factories provided details regarding which information is recorded on their filter logs which is
presented in Table 5-14.

67
Current Practices in Manufacturing of Ceramic Pot Filters for Water Treatment
Table 5-14 Filter Log Details
Country
Date m
ade
Filte
r #
Lot #
Flow
rate
Discard
date
Discar
d reaso
n
Date so
ld
Buyer I
nfo.
Other
Cam-1 x x x x
monthly account of number of filters
sold
Guate-1 x x x x x x
operator, conditions,
materials/where from
Guate-2 x
Indo-1 x x x x x x x x
filter weight, drying time, kiln temp,
visual faults
Indo-2 x x x x x x x x payments
MM-All x x x x x x
Nica-1 x x x x
dates cs applied, packaged, time and
date of firing
Nigeria x x x x x x
SL-1 x x x x x
SL-2 x x x x x x* formula for batch
Tanz-1 x x x
number of filters fired, micro bio test
results
Tanz-2 x x x x x x x
Yemen x x x x
Benin x
Colombia x x x
DR x x x* x Bacteria testing results
*information is sometimes recorded
Indo-1 has implemented Statistical Process Control (SPC) procedures whereby all process
parameters such as filter weight, drying time, kiln temperatures (6 positions), visual faults and
filtration rates are documented. Firing curves, filtration rate distributions, and diagrams are
created for data analysis.
Table 5-15 shows how many factories log which information throughout the production process.
In addition, seven factories log additional information which is presented in Table 5-14 above.
Table 5-15 Filter Log Items
Information
recorded:
Date
made
Filter
#
Lot
#
Flow
rate
Date
discard
Reason
discard
Date
sold
Buyer
info.
n=16 13
(81%)
13
(81%)
12
(75%)
14
(88%)
5
(31%)
5
(31%)
7
(44%)
7
(44%)
5.12.8 Failure Rates
The average total failure rate (n=15, QQC31) is 12% (range 2-27%, stdev 8). Table 5-16 shows
failure rate percentages for each of the factories. Cam-2 reported a less than 10% failure rate.

68
Current Practices in Manufacturing of Ceramic Pot Filters for Water Treatment
Failure Rate
3%
16%
10%
20%
2%
8%
13%
27%
15%
10% 10%
5%
17%
4%
27%
0%5%
10%15%20%25%30%
Benin
Cam-1
Cam-2
Colom
bia
DR
Gua
te-1
Indo
-1
Indo
-2
MM
-All
Nica-
1
Niger
iaSL-
1SL-
2
Tanz-
1
Tanz-
2
Filter Factory
% D
isc
ard
ed
Table 5-16 Failure Rates
Ten factories (n=10) provided failure rate percentages per phase of production. Factories reported
between 0-5% do not pass visual inspections, between 0-2% do not pass auditory inspections and
between 0-17% do not pass flow rate tests (average 6%, stdev 5.3). Between 0-7% of filters are
damaged during firing (average 2%, stdev 2.4), 0-1% from accidents and 0-1% during drying. The
average failure rate for these ten factories is 9%, ranging from 2-20% (stdev 6.2). Flow rate testing
is the primary reason for filters not passing quality control for seven of these 10 factories. Only
Benin, DR and Tanz-1 have higher discard rates for other reasons. It should be noted that DR and
Tanz-1 do not perform flow rate tests on all of their filters.
Some factories did not provide percentages associated with discard rates, but rather, indicated at
which stages more losses occur. Cam-2 discards most filters due to them not passing visual
inspection, flow rate testing and from firing. Indo-2 looses some to visual and auditory inspections,
more to flow rate testing, and about 5% to firing. Both Tanz-2 and SL-2 loose most filters to flow
rate and firing. At least 7% of the filters fail flow rate testing at the Yemen factory, but their total
failure rate varies depending on the quality of their clay. The Nigeria factory reported that initially
failure rate was as high as 50%, mainly at the pressing and firing stages, however they have now
managed to reduce it to 10%.
5.13 Materials & Packaging
5.13.1 Receptacles
All factories (n=18, 100%, QD1-9) sell filtering elements with plastic receptacles, in addition, the
Myanmar factories, Nica-2 and Guate-1 (n=18, 17%) also sell clay receptacles. SL-2 is

69
Current Practices in Manufacturing of Ceramic Pot Filters for Water Treatment
experimenting with clay receptacles. Clay receptacles supplied by the Myanmar factories are
coated with colloidal silver. According to Thirst-Aid, men really like the clay receptacles because
they keep the water cool, women, however, find them heavy and difficult to clean. Nine factories
(n=15, 60%) commission the manufacture of plastic receptacles. All of the factories package their
filters with a plastic tap; five (n=9, 56%) sell filters with the tap attached. Cam-1 reported that
metal taps had a higher failure rate than plastic ones. No factories include an extra tap or cloth
pre-filters. All factories provide cleaning instructions (n=18, 100%), 16 (89%) include a brochure or
sticker and two (11%) have instructions printed directly on the receptacle (DR, Nigeria). Five
factories include a cleaning brush (MM-all, SL-1, SL-2, Yemen, Cam-2). In addition, Cam-2 provides
a fitting ring which is placed between the receptacle and filtering element and helps to protect the
filtering element against damage.
5.13.2 Packaging
Eight factories (n=17, 47%, QD10-13) regularly package the filtering element in a plastic bag. Eight
factories (47%) package the filter elements individually in cardboard boxes, three with newspaper
(Nica-1, Nica-2, SL-1), one with Styrofoam (Indo-1), one with shredded paper (SL-2), one with
waste rubber and straw (MM-7) and two with no padding (Cam-1, Guate-1). Three sell them in the
receptacle (Indo-2, Nigeria, Tanz-2). Five vary the packaging depending on whether filters are
being sold individually or in bulk. Benin, Cam-2 and seven Myanmar factories also package
elements in locally made baskets. One of the Myanmar factories recently switched to cardboard
boxes (MM-7) and although NGO’s think they look nicer and are easier to stack, they are not as
practical as they get soggy when wet and don’t get re-used like the baskets do.
Photo 5-15 Packaged Filters, Myanmar
(Thirst-Aid 2009b)
Photo 5-16 Packaging
Filters, Nicaragua
(Rayner 2006)
Photo 5-17 Packaging Filters,
Honduras
(Hernandez 2009)
70
Current Practices in Manufacturing of Ceramic Pot Filters for Water Treatment
Four factories (n=18, 22%) stack filters when transporting multiple units. Indo-1 stacks them two
high with Styrofoam padding and a maximum of six per crate, MM-all stack six together with straw
or waste rubber between them and DR and Tanz-1 stack five filters with cardboard separators
between them.
Factories have varying success with packaging for transport. The Myanmar factories ship an extra
5% to compensate for possible breakage; however they have found that fewer than 2% break.
They manufacture semi-circle shaped filters and package them stacked with straw and rubber
padding in crates. Tanz-1 reported that all filters distributed nationally reach their destination
without breaking. Yemen has not had problems with breakages. Cam-1 reported that by buying
cardboard boxes the same size as the filter element, the element does not move and therefore
doesn’t break. For export; however, larger boxes are used and filters are paded with Styrofoam.
In contrast, three factories reported having issues with breakage during transportation. Tanz-2
reported that as many as 15 of 35 (42%) have broken during transport. Indo-2 have found that
even when packaging with newspaper and bubble wrap in a crate, that during transport they get
lots of breakages due to the condition of the roads. For the DR, breakage rates are high when
shipping by air or UPS (United Parcel Service).
5.13.3 Operation and Maintenance
Cleaning frequency (n=16, QD15-17) is recommended weekly (4, 25%), every two weeks (3, 19%),
monthly (6, 38%), every three months (1, 6%), or as needed based on water quality or filter
performance (7, 44%), numbers add up to greater than 100% due to multiple answers. Two
recommend washing hands first (Colombia & SL-2, 13%). Cleaning procedures recommend using
filtered, boiled or chlorinated water (5, 31%) scrubbing with a brush (9, 56%) or wiping with a cloth
or sponge (3, 19%). Five recommend using soap on the receptacle but not the element itself
(31%). One says to not use bleach or cleaning products (Nigeria, 6%). Four specify to not touch the
outside of the filtering element (25%). Cam-2 recommends air-drying the filter completely before
re-filling it. The DR factory, where silver is fired into the filters, recommends using 1-2 tablespoons
of chlorine bleach to wash the receptacle and element every 1-2 weeks, and an intensive cleaning
every three months whereby the element should be boiled for five minutes at a rolling boil.

71
Current Practices in Manufacturing of Ceramic Pot Filters for Water Treatment
Photo 5-18 Cleaning Instructions, Colombia
(Asopafin 2009)
Replacement recommendations range from 1 to 5 years (n=15). Eight factories (53%) recommend
replacement every 1-2 years. Four factories (27%) recommend replacement every 2-4 years. Two
factories (13%) recommend replacement every five years, unless it breaks before then (DR, Tanz-
1). The Myanmar factories recommend replacement when the element cracks or breaks.
5.14 Health and Safety
5.14.1 Materials Processing
When processing clay (n=16, 100%, QMP16-17), factory workers use dust masks or some sort of
nose and mouth covering. Eight (50%) use them always six (38%) use them almost always and two
(13%) usually. In addition, six (38%) wear gloves, five (31%) use goggles or glasses, one requires
that workers wear closed toe shoes, one uses ear protection and at Cam-2, a fan is used to blow
the clay dust away. For processing burn-out material (n=15, QMP28-29), 14 (93%) use face masks,
four (27%) use goggles, two (13%) use ear protection and two (13%) wear gloves. One factory
reported that no health and safety precautions are taken while processing burn-out material due
to a lack of industrial health and safety guidelines. Ten (67%) reported that the health and safety
measures reported above are always carried out while processing burn-out material, four (27%)
almost always and one (7%) usually.

72
Current Practices in Manufacturing of Ceramic Pot Filters for Water Treatment
5.14.2 Mixing and Pressing
While mixing filter mixture and pressing filters (n=12, QFP28-29), eight factories (67%) report
wearing masks, three (25%) wear goggles, three (25%) wear gloves and three (25%) reported
taking very few or no health and safety precautions. In addition, at SL-2, helmets are worn while
mixing. At Cam-1, the press has an automatic stop system and the mixer has a pulley system
installed to prevent injuries. At Cam-2, shoes are required, fans blow and the press is located at a
distance from other factory movements. Eight (67%) reported always taking these precautions,
two (17%) almost always and two (17%) usually. Four factories (n=14, 29%) reported minor
accidents, three of which specified hand or finger injuries.
5.14.3 Firing
Six (n=14, 43%, FP75-76) factories use gloves, five (36%) use face masks, three (21%) reported
using goggles or glasses and three (21%) do not have specified health and safely precautions. At
Cam-1 workers found that gloves didn’t work and therefore use a cloth instead. At Indo-2 they
also wear headbands and a wet t-shirt. Two (14%) recommend not touching hot stuff. Participants
reported that recommended health and safety precautions are always (7, 50%), almost always (3,
21%) or usually (1, 7%) carried out. In Nigeria, supplements and vitamins are provided for the kiln
masters and firing days are rotated to allow workers to recover between firings.
5.14.4 Silver
Of the 15 factories that work with powdered silver (n=11, QMP59-60), all use gloves (100%), four
(36%) wear face masks and four (36%) use eye protection. Seven (64%) reported always taking
these health and safety measures, three (27%) almost always and one (9%) usually.
Of the seven factories working with liquid silver (n=5, numbers do not add up to 100% because
three factories work with both liquid and powdered silver) three (60%) wear gloves, two (40%)
wear face masks one (20%) wears aprons and one (20%) does not take any health and safety
precautions. At one factory the workers did not like wearing gloves and so they no longer do.
Three (60%) reported that they always, one (20%) almost always and one (20%) never, take health
and safety precautions when working with liquid silver.

73
Current Practices in Manufacturing of Ceramic Pot Filters for Water Treatment
6 Analysis and Discussion
6.1 Introduction
The aim of this project was to identify the various filter factories worldwide and to survey and
document existing production practices to provide data that will help the Ceramics Filter
Manufacturing Working Group make appropriate manufacturing recommendations, which are
expected to help filter factories improve the quality of filters being produced. In order to do this,
filter factories were contacted and participating factories either filled out a questionnaire, were
interviewed, or both. In addition, a literature review was carried out to learn about the
effectiveness of filters in the field and to compare variation between current production
procedure manuals. Also, published findings from laboratory studies which have evaluated filter
characteristics and their effects on the efficacy of the filters were reviewed. In this section the
findings from these results are discussed and lessons learned, recommendations where
production guidelines are needed, and suggestions for future research are presented.
Photo 6-1 Filters, DR-1
(FilterPure 2009)
Photo 6-2 Filter, Myanmar
(Thirst-Aid 2009b)
Photo 6-3 Filter, Indo-2
(Pelita 2009)
One of the challenges of comparing production procedures and standardising the production
process is bridging the art of working with clay with the manufacturing of a health tool. In many
cases quantitative information was not available and even when available, not always comparable
due the relationships between variables. Variations in production are inevitable not only between
factories in different countries, but also depending upon the season, at the same factory. Although
this might pose a challenge in establishing best practice guidelines, there are areas where
guidelines for ranges can be promoted and areas where diversion from protocol should be
avoided.

74
Current Practices in Manufacturing of Ceramic Pot Filters for Water Treatment
6.2 Methodology
6.2.1 Survey
Although the author had hoped to carry out telephone interviews with each participating factory,
some preferred to submit a completed survey electronically. The distribution of the survey
provided participants with this option. In addition, it allowed for consultation and the collection of
additional information as needed.
Few participants returned information on costing and some declined to share this information.
Therefore costing was dropped from the results. Factories have different methods of calculating
costs and therefore it was perhaps a burdensome aspect of the questionnaire. In addition, the
costing information was requested on a different excel worksheet which might have been
overlooked by some.
Although the usefulness of this project relied upon comprehensive production procedures being
collected, and many did not seem to mind the length, the questionnaire for some participants
might have been too long. The questionnaire was designed with the intention of drawing out as
many characteristics as possible and therefore contained many questions which in retrospect
could have been omitted. It was unknown at the time; however, which questions would be
superfluous. There were also topics for which additional questions could have been added or more
specific.
6.2.2 Reliability of Data
Due to the comprehensive nature of the questionnaire and that the participants in this study
varied in their roles at each factory, it is not surprising that every participant was not able to
answer every question. The accuracy of the data provided, as a result, was sometimes
questionable. Answers which in the author’s opinion were not likely were either omitted from the
results or it was noted that their accuracy was questionable. The majority were mentioned in the
results, however, because there is value in knowing which questions were more difficult to
answer. Self-reporting bias probably occurred, however in the author’s opinion, participants
answered questions honestly within the scope of their knowledge.
The production of ceramic pot filters has typically been promoted as an “open source” technology;
however some factories chose to withhold proprietary information which complicates the

75
Current Practices in Manufacturing of Ceramic Pot Filters for Water Treatment
comparison of results. Data withheld included the amount and concentration of silver, costing
information, and filter mixture formula.
6.3 Discussion of Results
In the following sections research questions one and two are addressed. Research question one
was answered with data collected from the survey, and research question three was answered
with findings from the literature review. The following section compares findings from both the
survey and the literature review.
Research question 1: What are the current production procedures at the various ceramic water
filter factories?
Research question 3: What is known about some of the manufacturing variables which affect the
microbiological efficacy of the filters?
6.3.1 Materials and Processing
6.3.1.1 Clay
Clay plays an important role in filter quality. A
correlation has been found between clay content, flow
rate and pore size (Oyanedel-Craver and Smith 2007).
Although at least five factories (n= 17, 30%) mentioned
having identified reliable clay sources, both the Yemen
and Colombia factories mentioned the effects and
challenges of inconsistent clay qualities on filter
production.
Experienced potters choose appropriate clay to meet their outcome objectives which include a
workable clay body with appropriate plasticity, shrinkage rate, and that will fire at the desired
temperature. There are however, other characteristics which cannot be identified by sight and
feel, such as the materials composition. The mineral composition of clay might play an important
role in the hydraulic conductivity and porosity of filters (Oyanedel-Craver and Smith 2007).
Although the source of arsenic is unknown, it has been has been found in effluent water from
filters made in Ghana, Cambodia and Nicaragua (van Halem 2006).
Photo 6-4 Clay Mine in the Rainy Season
(IDECambodia 2009)

76
Current Practices in Manufacturing of Ceramic Pot Filters for Water Treatment
Clay is milled and sieved to remove impurities, such as sand or organic material. Sixteen factories
mill their clay (n=17, 94%) and 15 factories (n=18, 83%) sieve their clay, however three do not
sieve their clay. Sieve sizes for clay vary between 9 and 80 mesh (see Appendix 3 for mesh sizing
chart). Although the mesh size used will be somewhat dependent upon the availability of sieves
sizes in each country, it is recommended that guidelines be established to indicate an appropriate
range for sieve sizes and that filter factories follow these guidelines. The option for wet processing
of clay should also be explored and promoted where sufficient water supply is available to reduce
health risks associated with working with dry clay. In addition, methods for improving clay quality
would be helpful for some factories.
6.3.1.2 Burn-out Material
The effects of different burn-out types have not been evaluated. The DR factory reported a lack of
success with oak as it not only left an oily residue on the fired filter, but also resulted in a reduced
flow rate. Ten factories use sawdust (n=18, 56%) from different woods including pine, guanacaste,
gravella, oak, a mixture, or depending on availability. Although some factories use sawdust of a
specific type, using sawdust from a variety of wood types will likely affect the consistency of the
filters being made. Seven factories (39%) use rice husks and one uses a combination of sawdust
and peanut shells. MM-all reported a large variation in rice husk qualities which can affect the
outcome of the filters. Although filters made with either sawdust or rice husk have been evaluated
in the field and the laboratory for microbiological efficacy, the effects of different burn-out
materials, including sawdust varieties, on filters has not been evaluated.
The burn-out material is thought to play a significant role in creating the pores within the filter;
therefore both particle size and consistency of particle size are likely to be important. Although 15
(n=16) factories sieve their burn-out material, only 12 (80%) indicated the mesh size. Although the
60 and 80 mesh sizes reported by two participants are likely to be mistakes, even when eliminated
from the results, the remaining mesh range of 8-48 is wide. Only one factory sieves with two
screens to separate out both the finer and larger particles. At RDI-C (Cam-2), the amount of burn-
out added to the mixture varies depending on the size of the rice husk to achieve the desired flow
rate (Hagan et al. 2009). However, in an attempt to make faster flowing filters, sawdust screened
to a larger particle size showed no significant difference in flow rate (Klarman 2009). Factories use
flow rate as an indicator of filter efficacy and although the relationships between burn-out size,
pore size, hydraulic conductivity and microbiological efficacy require further investigation,
guidelines can be established with regards to burn-out material processing.

77
Current Practices in Manufacturing of Ceramic Pot Filters for Water Treatment
6.3.1.3 Source Water
The influence of source water quality (both microbiological and chemical) which is used in
production and for flow rate testing has not been investigated. Ten factories (n=16, 62%) either
have not tested or do not know if their source water has been tested.
6.3.1.4 Formula
Filter mixture ratios are established by trial and error until the desired flow rate is reached.
Prototypes are then tested for microbiological removal efficacy. The plasticity of the clay (Rivera
2006) and the size of the burn-out material (Hagan et al. 2009) will influence the quantity of burn-
out material added to achieve the desired flow rate. Mix ratios are calculated either by weight or
volume. Where rice husks are used, formula is measured by weight (n=6, 100%) and the
percentage of rice husks added to the mixture ranges from 10 to 24%. Where sawdust is used
(n=10), 60% measure by weight, and 40% by volume. Percentage of sawdust ranges from 5-15.6%
by weight or 47-53% by volume. Where both sawdust and peanut shells are used (n=1),
ingredients were reported to be measured by both weight and volume and they make up 35% of
the mixture (see Section 5.6). Thirst-Aid (Myanmar) pointed out that humidity can affect the
weight of rice husks enough that the filter mixture must sometimes be adjusted accordingly.
Settling and particle size might also affect precise measuring when burn-out material is measured
by volume.
The only study comparing burn-out types found that using the same screen size but different burn-
out materials affected both the flow rate and microbiological efficacy (Klarman 2009), therefore
different mix ratios will apply depending on burnout type. The relationships between type of burn-
out, amount of burn-out material, clay characteristics, particle size and burn-out type require
further evaluation relative to pore size, structure, porosity, tortuosity and hydraulic conductivity.
Once a formula has been established, the rigidity to which it is adhered to also varies. Nineteen
percent (n=16) do not adjust their formula, however 6% adjust it regularly and 75% as needed. At
the DR factory, no adjustments to the formula are allowed without being supported by
bacteriological testing. However, at the Myanmar factory that produces the best quality filters and
has the lowest failure rate of the Myanmar factories, minor modifications to the formula are made
regularly depending on the quality and humidity of the rice husks. Thirty-one percent (31%) of the
factories surveyed modify their formula depending on the quality of the clay. In uncontrolled
environments, where climatic control is not an option, small adjustments to the mix might not

78
Current Practices in Manufacturing of Ceramic Pot Filters for Water Treatment
have major impacts on filter quality. Two of the problems with uncontrolled modifications to the
filter mixture formula are that 1) if not accompanied by regular bacteriological testing, flow rate
will be used as a sole indicator of filter efficacy 2) it can result in the output being only as good as
the operator and different operators might adjust the formula differently, thereby affecting the
consistency of the product. Prohibiting formula modification might be unrealistic, however, and
could adversely affect filter quality and inhibit the accurate documentation of daily production
procedures which can aid in troubleshooting and filter evaluations.
Mixing times vary between 5-20 minutes dry - except for Indo-2 where dry ingredients are hand
mixed for 60 minutes in order to achieve specified flow rates and in Nigeria, where the mixing
process takes half a day. Wet mixing times range from 6-30 minutes. Mixing, particularly dry
mixing, is considered important to achieve an even distribution of burn-out material which
possibly affects pore distribution (Lantagne 2001a).
Eighty-three percent (n=18) of the factories work the clay by wedging (like kneading dough),
thumping or thrusting the clay mixture onto a hard surface before adding it to the press. This aids
in removing air-bubbles and in homogenising the mixture. In Nigeria it is pounded in a mortar and
pestle and all of the Myanmar factories use pug-mills because they have found that it resulted in
stronger filters. Investigation into the advantages of working or pounding the clay and/or using a
pug-mill on the filter mixture prior to pressing is recommended in Section 6.4.3.
Although discouraged by Potters for Peace, eight factories (n=16, 50%) leave filter mixture
overnight before pressing and/or reprocess dried mixture, however the effects of either on filter
quality have not been evaluated. Ten factories (n=25) do not have mixers and two do not have
hammer mills and few have air compressors. Three factories do not use electricity in production
and the cost of energy might also be prohibitive in some areas (Nigeria, Cambodia). These are
important considerations when making recommendations. Section 5.4.1 has a chart of filter
factories and their equipment.
6.3.2 Pressing and Drying
Mould designs and sizes vary. Filter capacity ranges from six to 11 litres and wall thickness ranges
from one to three centimetres. There are three mould shapes including the flat-bottomed original
design (n=25, 60%), 32% use a semi-circle round-bottomed mould and 8% use an oblong, round-
bottomed mould. All factories press their filters, although in Rabinal, Guatemala, filters are still

79
Current Practices in Manufacturing of Ceramic Pot Filters for Water Treatment
made on the potter’s wheel and sold through Guate-1. Filter design, including wall thickness, filter
capacity and surface area are likely to have an effect on filter functionality. In addition, round
bottomed filters have an extra advantage that they cannot be placed on a dirty countertop
possibly preventing one pathway of contamination. In addition, they might be stronger.
All participants (n=17, 100%) expressed satisfaction with their mould release. Plastic bags are used
by 72% (n=18) and 23% are successfully using lubricant (e.g. coconut or palm oil) in place of plastic
bags. An evaluation of the effects of using different lubricants as a mould release is recommended
since if adverse effects are not found, replacing plastic bags would be environmentally friendly,
cost effective and reduce or eliminate trimming and touching up filtering elements. In addition, it
would reduce the handling of freshly pressed filters which might disrupt internal pore structures.
The mould material might, however, influence the suitability of using certain oils as one factory
commented that they had success with coconut oil only after switching from an aluminium to a
cast iron mould.
Drying times in the wet season pose a problem for at least eight factories (n=18, 39%) and
although some have modified production levels or increased shelving to allow for longer storage
during the wet season, others have introduced quick drying methods (see Section 5.9). Whereas
exceptionally quick or uneven drying will lead to obvious deformation and cracking, the possibility
also exists of internal and invisible cracks forming in the absence of obvious deformation. The
initial drying phase is particularly important; therefore suggestions for artificial drying methods
and guidelines including methods to quantitatively measure sufficient dryness prior to using
artificial drying methods are recommended.
6.3.3 Kilns and Firing
Firing is an important part of the filter making process and can affect the consistency and quality
of the filters produced. A kiln which is heated or cooled too quickly can cause cracking and
deformation. Uneven heat distribution within the kiln might lead to some filters from the same
kiln load being over-fired while others are under-fired. Under-firing or over-firing will affect the
quality and often, the filtration rate of the filter.
Kiln capacities range from 40-200 filters and 83% (n=18) fire with wood. Kiln size and other
characteristics influence fuel efficiency. In Colombia, about 600 kg of wood is used to fire 125
filters. This survey did not include a question about the source of wood, however at least one

80
Current Practices in Manufacturing of Ceramic Pot Filters for Water Treatment
factory commented that it might not be from legal cutting. Although alternative fuel sources have
been experimented with, and successful in some cases, apart from the Benin factory which fires
their kiln with oil, none of the factories are currently firing with alternative fuels (see Section
5.10.1). This calls attention to the need to not only encourage the use of alternative sources, but
also evaluate optimal kiln size and design for maximum efficiency to reduce the amount of fuel
required for firing.
All factories (n=18, 100%) use either a pyrometer or cones as temperature guides while firing.
Orton16 recommends using a three-cone system (a guide cone, firing cone and guard cone), the
first cone will fall when reaching close to the temperature, the second when the temperature has
been achieved and the last if the desired temperature has been exceeded, only one factory
reported using this three cone method. Three factories use two cone numbers and five factories
use one cone number. Temperatures can vary within a kiln and therefore it is also recommended
that cone packs (of three cones) be placed at varying heights in the kiln. Only one factory does
this, but with only one cone number. At Indo-1, temperature is monitored with a pyrometer at six
different locations in the kiln. At Indo-2, the temperature in the kiln varies enough that not only
are different formulae used for filters to be placed at different heights in the kiln, but also “place-
holder” filters often occupy the bottom row in the kiln.
Experienced potters can interpret the temperature of the clay during firing by its colour (see
Appendix 4) and at least three factories (17%) mentioned that successful firing is dependent upon
the kiln master’s experience and 85% (n=17) feel that they always or almost always follow their
temperature grades and soak (hold) times and most factories (11, 61%, n=18) report consistent
firing results. The use of pyrometric cones and pyrometers can aid in measuring temperature at
various locations in the kiln and in troubleshooting. The acquisition of cones and pyrometers is
difficult in some countries, however.
6.3.4 Silver
Respondents found it difficult to answer questions pertaining to the strength and dilution of
colloidal silver applied to filters. Information was provided by nine factories that use colloidal
silver (n=15, 60%). The silver concentration in diluted solutions ranges from 14- 1500 ppm. Should
the two extremes be excluded as errors, silver concentrations still range from 107 to 288 ppm.
Filters are either dipped or painted with silver, although each has its advantages and
16 See http://www.ortonceramic.com/pyrometrics/industrial/cones.shtml for more information.

81
Current Practices in Manufacturing of Ceramic Pot Filters for Water Treatment
disadvantages, the quantity of silver applied has been found to be more important than the
application method (Oyanedel-Craver and Smith 2007).
Although colloidal silver has been found to improve the microbiological effectiveness of filters
(Lantagne 2001a; van Halem 2006; Oyanedel-Craver and Smith 2007), silver nitrate is also being
used by three factories. Filters with and without the application of silver nitrate were found to be
comparable in their microbiological removal efficiency in the field (Brown 2007), however filters
made with high flow rates did improve in effectiveness after the application of silver nitrate in the
laboratory (Bloem et al. 2009). Little is known about the amount of time silver nitrate will remain
in the filter, leeching and the effects of influent water on the effectiveness.
One factory dilutes and dips filters in a Katadyn water disinfection product (see Section 5.11.3). No
indication of evaluation of the application of this product to ceramic filters was provided. It is not
recommended that alternative products be used with out prior evaluation.
6.3.5 Quality Control
All factories (n=17) carry out visual inspections at varying times in the production process and one
uses a magnifying glass. Auditory inspections (see Section 5.12.2) are always performed at only
47% of the factories. Although qualitative, this is an important check to check if the filter has been
properly fired and can indicate the presence of internal cracks. Promotion of the pressure “crack”
test is recent (see Section 5.12.3) and therefore it is not surprising that 47% do not perform this
test. Many participants had not heard of this test. This shows a need for communication amongst
the decentralised production facilities. Two factories aim to leave a carbon residual in the walls of
the filters; the effect of this has not been evaluated.
Since bacteriological testing can be expensive and in many places access to a laboratory is limited,
it is not regularly carried out by all factories (see Section 5.12.5). Instead, along with regular visual
inspections, flow rate testing is used as a primary indicator of filter quality. Flow rate can be an
indicator of internal cracks or defects, potential contact time with silver and the ability of the filter
to produce sufficient water quantity. Filters discarded due to unacceptable flow rates range from
0-17% (average 6%, stdev 5.3). Flow rate tests are carried out by all factories; however, only 89%
carry them out on all filters. In addition, soaking filters prior to flow rate testing is important for
reliable results (Lantagne 2001a), although the amount of time required to ensure saturation
might vary per factory, Nederstigt and Lam (2005) found that after 24 hours of soaking time

82
Current Practices in Manufacturing of Ceramic Pot Filters for Water Treatment
filtration rates became constant. If soaked for less than 24 hours, filters had lower flow rates (van
Halem 2006: A-10). Only five factories (n=18, 28%) soak their filters in water for 24 hours prior to
flow rate testing. One factory reported soaking their filters until saturated, however, it was not
explained how saturation is determined.
Maximum flow rate ranges vary from 1 litre to 5 litres per hour. Flow rate has been found to
diminish with use both in the laboratory (Lantagne 2001a; Fahlin 2003; van Halem 2006) and in
the field (Lantagne 2001b) due to clogging of the pores. In addition, the hydraulic head influences
the flow rate; therefore the flow rate will slow as the filter empties. Although a minimum flow rate
of one litre in the first hour should provide enough drinking water for a family of five if filled four
to five times a day, clogging might slow the filtration rate beyond acceptable limits. In addition the
size of the receptacle in relation to the filter size and shape and pattern of use will affect how
much and how quickly water can be collected as once the water level in the receptacle reaches the
bottom of the filter, the flow rate will be affected (see section 3.5.3).
Studies have been carried out to measure the effectiveness of filters with increased flow rates.
One concluded that effectiveness of microbiological removal began to decrease below 99% after
1.7 l/hr (Klarman 2009); the other found there was no significant difference in microbiological
efficacy between filters reaching a flow rate of up to an 8-10 l/hr and slower filters (Bloem et al.
2009). Filters in these two studies were produced in the Dominican Republic and Cambodia
respectively, and therefore mould shape and size and production methods varied.
6.3.6 Microbiological Testing
Respondents had difficulty answering questions regarding which microbiological tests are carried
out on their filters. Thirteen factories (n=18, 72%) responded that microbiological tests are carried
out regularly on between 0.2-15% (average 5%) of their filters. No factories provided information
on acceptable ranges and few provided bacteriological test results. Microbiological testing can be
expensive and confusing. Not all factories have access to a local, certified laboratory. There is a
need for guidance on field kits available, how they work, the variety of indicator organisms,
frequency and percentage of filters that should be tested either at the factory and/or at an
independent, qualified laboratory.

83
Current Practices in Manufacturing of Ceramic Pot Filters for Water Treatment
6.3.7 Filter Logs and Failure Rates
Filter logs that are used to hold records of all filters are filled out ‘always’ or ‘usually’ by 16
factories (89%). Between 12-14 factories (57-88%) record the date made, filter number, lot
number and flow rate. One factory reported recording the operator, conditions, and origin of
materials and one factory collects information including filter weight, drying time, kiln
temperature, visual faults and filtration rates. Firing curves, filtration rate distributions and
diagrams are created with this data for analysis. Maintenance of production logs can aid factories
in increasing efficiency and troubleshooting and can useful for researchers investigating filter
characteristics, especially in the absence of strict adherence to production protocol.
Failure rates vary widely between 2% and 27% with five factories (n=15, 33%) having a failure rate
of greater than 15%. Tanz-2 reported that 32% of their filters consistently crack during firing,
which is inconsistent with their overall failure rate of 24-30%. More consistent manufacturing
practices should lead to a more consistent product including using materials of consistent quality,
having good manufacturing methods and consistent manufacturing practices. In addition, which
quality control tests are carried out and the rejection criteria might affect the failure rate. For
example, auditory inspections are carried out by only 47% of the factories and only 40% always
carry out pressure “crack” tests (6, n=15). In addition, some rejection criteria can be subjective, for
example filter discolouration and deformation.
Although only four factories record the reason for rejection on a log, 14 factories document flow
rates. Flow rate is the number one reason for rejecting filters at 7 of the 10 factories who reported
percent loss per quality control criterion. Two of the three factories who reported other reasons
do not perform flow rate tests on 100% of their filters. Interestingly, the third factory, Benin,
performs flow rate testing on 100% of their filters and has the smallest flow rate range of all the
factories, accepting only filters which filter between 2 and 2.5 litres in the first hour. They usually
keep a filter log but record only the date made.
Since many variables can influence a filter failing a given quality control inspection, the phase in
production which led to a defective filter can sometimes be difficult to determine. For example, a
filter could crack during firing; however, although the cause could be from heating or cooling the
kiln too quickly it could also be due to a number of other causes including but not limited to
materials characteristics, or the filter drying too quickly or unevenly.

84
Current Practices in Manufacturing of Ceramic Pot Filters for Water Treatment
6.3.8 Health and Safety
Health and safety risks can include both injury and long-term health risks. Four factories reported
minor injuries to hands and fingers. Although no factories reported back injuries, the use of proper
lifting techniques and ergonomic work conditions are important to minimise such risks. Proper
safety goggles (for example welders goggles) should be used to protect eyes from damage which
can be caused from looking into the kiln at hot temperatures to check cones or the colour of the
clay.
Silicosis is a long term health risk associated with the inhalation of crystalline silica dust found in
clay. It is an irreversible lung disease and can progress even when exposure has stopped. It is
therefore important that health and safety measures while processing clay are strictly enforced
and wet processing of clay should be adopted where possible. Because airborne particles can
travel, even nearby workers not directly involved in clay processing may be exposed to the silica
dust. Although face masks are part of the health and safety guidelines while processing clay for all
factories who responded to this question (n=16), only 50% reported that they are always used.
Other measures can be taken, including careful selection of equipment location and properly
securing collection bags to hammer mills to minimise dust output. Appropriate health and safety
precautions in other areas, including the handling of powdered silver and processing burn-out
material should be reviewed and strictly enforced. Preventative measures should be taken not
only while processing these materials but also during cleaning, since dry brushing can cause
settled particles to become airborne, water should be used while cleaning.
6.4 Lessons Learned, Recommendations and Further Research
6.4.1 Introduction
The analysis of the literature review and survey results suggests seven key lessons learned which
contribute towards answering research question two and provide the basis for the
recommendations in Section 6.4.3 and recommendations for future research (Question 4) in
Section 6.4.4. Research questions two and four are presented below, followed by the key lessons
learned.
Research question 2: What are some of the lessons learned and where are recommendations
needed in the production process?

85
Current Practices in Manufacturing of Ceramic Pot Filters for Water Treatment
Research question 4: Where is further research needed in order to make recommendations for
standardisation or best practice?
6.4.2 Lessons Learned
Little is known about how the many variables in filter production influence filter quality.
There are a lot of variables in filter production (see Figure 2-4) and there are few studies
characterising the effects of these variables. Additional research is needed in many areas in order
to refine recommendations for best practice (see 6.4.4).
Production practices are not consistent and are not well documented.
There is variation in filter production both within and between factories. Filters produced in
different factories have been found to have different characteristics. Although some variation in
daily production might be inevitable, the documentation and analysis of daily production practices
can aid in increasing production efficiency and troubleshooting. In addition, investigations into
filter characteristics and effectiveness could benefit from having production details available.
Guidelines for diluting silver are needed.
Respondents found it difficult to answer questions regarding the amount and concentration of
silver applied to filters. Based on the information reported, silver application is not consistent.
Although further research is still needed regarding the effects of different types of silver,
application methods, and concentration on the efficacy of the filters, clear information about
silver concentrations and corresponding dilution formulae need to be made available to the
factories.
Microbiological testing guidelines are needed.
Factories provided little information regarding what tests are carried out and acceptable water
quality parameters. Microbiological testing of filters is inconsistent between factories. Eight
factories reported testing 0.2-15% of their filters regularly. Guidelines for the percentage of filters
which should be tested, frequency of testing, and what should be tested for are not available.
Although the availability of a local, certified laboratory may vary depending on the factory
location, with training, in-house testing could be implemented to complement laboratory testing.
Flow rate testing procedures are not standardised.
Flow rate testing is used as a primary indicator of filter efficacy; however factories do not follow a
standard procedure. Lantange (2001a) noted that it is important to soak filters until they are

86
Current Practices in Manufacturing of Ceramic Pot Filters for Water Treatment
saturated prior to flow rate testing to obtain consistent results. Nederstigt and Lam found that the
flow rate of filters became consistent after a 24 hour soaking period (van Halem 2006). Only five
filter factories soak their filters for 24 hours prior to flow rate testing and three factories do not
soak their filters prior to testing flow rates. Although the soaking time required to achieve
saturation may vary from factory to factory, it is important that filters are saturated prior to flow
rate testing to ensure consistent flow rate measurements.
Health and Safety precautions are not strictly adhered to.
Although all factories reported using dust masks or some sort of nose and mouth covering while
processing raw materials, these precautions are not strictly adhered to or enforced as only eight
factories reported always using face masks. While mixing materials, only eight factories report
using face masks. In order to reduce occupational health risks, appropriate preventative measures
need to be outlined and enforced for various aspects of production, but particularly when working
with clay, burn-out material and powdered silver.
Factories could benefit from sharing experiences.
This survey was to gain overall understanding of the production practices in each factory. Factories
were asked about current and previous challenges, solutions and what they have tried in the past
but did not work. Although many participants provided valuable information which is reported
throughout Section 5 and Section 6, the length of the survey likely influenced the amount of detail
some participants provided. What works at one factory might not work for another, however;
many participants expressed interest in sharing their experiences and learning from others.
6.4.3 Recommendations
6.4.3.1 Materials
• Although potters are competent in identifying appropriate clay sources, guidelines for
the identification of and simple methods for evaluating clay characteristics and
improving the quality of clay would be useful for factories.
• When possible, clay should be analysed for characteristics and materials composition
both when using a different source and when clay quality changes.
• Recommendations on an appropriate mesh size range for clay processing should be
made and adopted, although this might be limited by availability of sieve sizes in each
country.

87
Current Practices in Manufacturing of Ceramic Pot Filters for Water Treatment
• Wet processing techniques and guidelines should be developed and implemented where
there is sufficient water for this process as wet processing can reduce adverse health
impacts on workers compared with dry processing.
• Recommendations for appropriate burn-out mesh size ranges, per burn-out type, should
be made and adopted. Availability of sieve sizes in each country may vary.
6.4.3.2 Production
• A list of recommended production variables for factories to document which will aid in
troubleshooting and filter research needs to be developed. Sample logs could be
distributed along with guidelines for the analysis of data collected. Documentation of
production procedures should be adopted into regular practice.
• Acceptable ranges of divergence from an established formula and guidelines for
appropriate microbiological testing to support changes in formula need to be
developed.
• Further investigation into the advantages of processing filter mixture through pug-mills,
along with alternative methods of achieving similar results should be considered as this
may lead to improved filter quality and durability.
• Guidelines which describe options for artificial drying methods and methods to
quantitatively measure sufficient dryness prior to using artificial drying techniques
should be developed.
• Further experimentation with alternative fuel sources should be promoted. The sharing
of experiences between factories might aid in developing successful techniques.
• Kiln designs should be evaluated for efficiency, including optimal kiln size. This can
reduce fuel consumption and aid in more evenly fired and consistent filtering elements.
Options will need to consider different production levels.
• The use of pyrometers and pyrometric cones for monitoring firing temperatures should
be promoted.
• Clear guidelines on silver concentrations, dilution formulae and application methods
need to be developed.
88
Current Practices in Manufacturing of Ceramic Pot Filters for Water Treatment
6.4.3.3 Quality Control
• A simple test to check the soaking time required to achieve saturation prior to flow rate
testing should be developed and adopted. This would also give an indication of the
porosity of the filter elements.
• There is a need for guidance on low-cost, user-friendly field kits available for water
testing and instructions on their use. In addition, recommended frequency and
percentage of filters that should be tested both at the factory and at independent
laboratories is needed.
6.4.4 Recommended Research
• Evaluation of clay bodies, the effects of materials composition and pore structures on
fired filter strength and microbiological efficacy.
• The effects of chemicals, heavy metals and other inorganic contaminants in production
water and/or clay on effluent water from fired filtering elements and how they might be
influenced by different firing temperatures.
• The effects of different burn-out materials, quantity, particle size and consistency of
particle size on filter pore size and structure, total pore area, porosity, hydraulic
conductivity and microbiological effectiveness including the strength of the filter and the
quality of the effluent water.
• Determine the effects of leaving filter mix for extended periods of time prior to pressing
and the effects of re-processing dry mixture.
• Determine if using oils as a mould release influences firing, leaves a residual on the fired
filter or effects the absorption of silver.
• Evaluation of the variables which can be modified to increase flow rates without
jeopardising the microbiological efficacy of filters (with and without silver application)
and how the pore structure, microbiological efficacy and durability of filters are
affected.
• Determine the influence of filter design including shape, diameter, depth, height,
capacity and wall thickness on microbiological effectiveness and end-user considerations
such as flow-rate, post-contamination and durability of the filter.

89
Current Practices in Manufacturing of Ceramic Pot Filters for Water Treatment
• Evaluate the effects of leaving a carbon residual within the walls of the filtering
elements on microbiological effectiveness, total pore area, pore structure, and effluent
water quality.
• Evaluate the effectiveness of different silver types (colloidal and nitrate) on microbial
deactivation, the amount found in effluent water and the length of time it lasts in the
filter. Determine optimum quantity, concentration, and application methods for each.
• Evaluate the effects of influent water characteristics and time on the leaching of silver
from the filter and filter effectiveness and whether it varies for colloidal silver versus
silver nitrate.
• Investigations into the wearing away of filter walls during the life span of a filter and
how it affects the filter’s microbiological efficacy, silver retention ability and useful life.
Determine evidence-based recommended replacement guidelines.

90
Current Practices in Manufacturing of Ceramic Pot Filters for Water Treatment
7 Conclusions and Recommendations
Household water treatment and safe storage systems (HWTS) are gaining attention as affordable
and effective means of improving water quality in the home resulting in reduced mortality and
morbidity from infectious diarrhoea. Locally produced ceramic water filters are one form of HWTS
which have shown promising results at improving the microbiological quality of water in the home.
They are affordable, easy to use and acceptable to users. Currently, there are at least 35 filter
factories operating in 18 countries, and several more are being established. One of the advantages
of this technology is that it is transferable; however maintaining quality control in decentralised
production remains unaddressed. This project is an important first step in addressing this need.
The aim of this project was to identify the various filter factories worldwide and to survey and
document existing production practices to provide data that will help the Ceramics Filter
Manufacturing Working Group make appropriate manufacturing recommendations, which are
expected to help filter factories improve the quality of filters being produced. Research questions
addressed were:
1) What are the current production procedures at the various ceramic water filter factories?
2) What are some of the lessons learned and where are recommendations needed in the
production process?
3) What is known about some of the manufacturing variables which affect the
microbiological efficacy of the filters?
4) Where is further research needed in order to make recommendations for standardisation
or best practice?
These questions were addressed by carrying out a literature review (Section 3) on relevant
published and unpublished documents (Question 3), developing a list of filter factories currently in
operation and designing, distributing and carrying out a survey of production practices at all
participating filter factories, the results of which are presented in Section 5 (answering Question
1). The analysis of the information compiled addressed questions two and four and are discussed
in Section 6.
One of the limitations of this study was that participants were not always familiar with the
intricacies of production. This led to many questions being left unanswered and some may have
been answered incorrectly, even though the distribution of the survey allowed participants the

91
Current Practices in Manufacturing of Ceramic Pot Filters for Water Treatment
opportunity to gather missing information. The survey was long, however, and this may have
influenced their attention to detail.
One of the challenges of comparing production procedures and making recommendations for best
practice is bridging the art of working with clay with the manufacturing of a health tool. Filters are
not made in controlled environments, and materials of consistent quality are not always available.
The weather can affect the humidity of materials. Clay coming from different sources, or even
from different levels of the same mine, will vary in characteristics. Ceramic Filter Pot technology
was designed for filters to be produced by local artisans and therefore, with a certain level of
tolerance for variation. The challenge is in identifying where and how much variance is acceptable
in the production of a locally-produced, cost-effective, microbiologically-effective, and user-
friendly HWTS. The analysis of the findings in Section 6 led to the recommendations and further
research needs presented in Sections 6.4.3 and 6.4.4, which are summarised below.
Recommendations for the development and implementation of guidelines for production are
summarised below:
• Identification and evaluation of clay characteristics and methods for improving clay
quality.
• Appropriate mesh size ranges for sieving both clay and burn-out materials.
• Techniques for the wet processing of clay as an alternative to dry processing.
• Acceptable ranges of divergence from an established formula, beyond which
microbiological testing of filters should confirm efficacy.
• Acceptable quick drying options and guidelines for appropriate use.
• The use of pyrometers and pyrometric cones in monitoring kiln temperature.
• Silver types, concentrations and dilution guidelines.
• How to measure the time required to achieve saturation of filtering elements prior to
testing the flow rate.
• Minimum and ideal frequencies and percentages of filters that should be tested for
microbiological effectiveness in the factory and/or in the laboratory and which field kits
are available and how they work.
Additional recommendations include:

92
Current Practices in Manufacturing of Ceramic Pot Filters for Water Treatment
• Developing a list of important production variables to be recorded throughout the
production process that will aid both factories and researchers, the creation of sample
templates, and the adoption of production documentation by factories.
• Further experimentation and evaluation of the effects of using pug-mills on filter
durability and quality.
• Further experimentation with alternative fuel sources.
• Continuing evaluation of kiln design, efficiency, including optimal kiln size.
Further research is needed in the following areas:
• Evaluation of clay bodies for materials compositions and effects of pore structures on
fired filter strength, breakage rates and microbiological efficacy.
• The effects of chemicals, heavy metals and other inorganic contaminants in water
and/or clay on effluent water from filter elements and effects of different firing
temperatures.
• The effects of different burn-out materials with regards to quantity and particle size on
filter pore size and structure, total pore area, porosity, hydraulic conductivity and
microbiological effectiveness including the strength of the filter and the quality of the
effluent water.
• Determine the effects of leaving filter mix for extended periods of time prior to pressing
and the effects of re-processing dry mixture.
• The influence of oils as a mould release on firing and possible residual effects on the
filter, or on the absorption of silver.
• Identification of which variables can be modified to increase flow rates without
jeopardising the microbiological efficacy and how the pore structures, microbiological
effectiveness and durability of the filter are affected.
• The influences of filter design including shape, diameter, depth, height, capacity and
wall thickness on the microbiological effectiveness and durability, including end-user
considerations such as flow-rate and post-contamination.
• The effects of leaving a carbon residual within the walls of the filtering elements on
microbiological effectiveness, total pore area, pore structure, and effluent water quality.

93
Current Practices in Manufacturing of Ceramic Pot Filters for Water Treatment
• The effectiveness of different silver types (colloidal and nitrate), concentration/dilutions,
and application methods on microbial deactivation, amounts in effluent water and the
length of time it lasts in the filter.
• How water influent quality affects silver leaching from the filter, filter effectiveness and
lifespan of the filter whether it is different for colloidal silver versus silver nitrate
• The change in wall thickness during the life span of a filter, and how it affects
microbiological efficacy, silver retention and useful life. Determine evidence-based
recommended replacement guidelines.

94
Current Practices in Manufacturing of Ceramic Pot Filters for Water Treatment
8 Glossary
Daily Adjusted Life Years (DALYs): are used to evaluate and prioritise public health concerns.
They represent a sum of the number of years lost by premature mortality and the number of years
of healthy life lost due to less than full health or disability.
Greenware: refers to wares which are dry and ready to fire, therefore dry filter pots which have
not yet been fired.
Goethite: see Laterite.
Grog: ground up fired clay. It is often added to clay to reduce plasticity.
Hydraulic conductivity: the rate water can move through a medium, in this case a filter.
Laterite: a soil layer consisting of several minerals including goethite, an iron-oxide. Laterite and
goethite are used interchangeably in this document. Laterite is thought to provide additional viral
binding sites. It also increases the flow rate and the weight of the filters.
Log Reduction Value (LRV): represents the microbial removal efficiency, where LRV of 4, expressed
as a percentage, would be 99.99%.
Mani Kiln: a down-draft kiln designed by Manny Hernandez, based on the Minnesota Flat-top kiln.
A down-draft Kiln does not have an opening in the roof of the kiln, therefore the heat when
reaching the roof is directed downwards, into an opening in the kiln floor which directs it to the
chimney.
Mesh size: represents how many openings there are per linear inch in a screen or sieve using the
Tyler Mesh Equivalent. This controls the particle size of material passed through a sieve.
Porosity: relates to the volume of void spaces in the filter.
95
Current Practices in Manufacturing of Ceramic Pot Filters for Water Treatment
Pug mill: a machine typically used in pottery to mix and extrude wet clay. It helps to create a
homogenous mixture and reduce air bubbles; reducing the need for wedging.
Pyrometric cones: are made of specific formulae of refractory and fluxing materials to measure
the effects of both time and temperature, known as ‘heat-work’. Different numbered cones are
designed to bend, or deform at specific temperatures. See www.ortonceramic.com for more
information.
SODIS: Solar Water Disinfection. A process whereby plastic PET bottles are filled with water and
placed in the sun for a number of hours. Solar UV-A radiation and temperature inactivate
pathogens.
Tortuosity: describes the path water takes through the filter walls. A more tortuous filter material
will have a more winding or twisting path with bends and turns, increasing the distance water
must travel to exit the filter.
Tyler Equivalent or Tyler Mesh size: see Mesh size.
Wedge: a pottery term for working clay to homogenise the material and remove air bubbles; it can
be compared to kneading bread dough.

96
Current Practices in Manufacturing of Ceramic Pot Filters for Water Treatment
9 References
AFA (1995) Contra la morbilidad infantil: Filtros artesanales y educación. Instituto de
Investigaciones Económicas y sociales (IDIES): Guatemala.
Asopafin (2009). Colombia: Photograph provided by Asopafin, Colombia in response to
questionnaire.
Ballantine, L. and Hawkins, T. (2009) FilterPure Employs New Standards for Fabricating and
Distributing CWF. International Ceramic Pot Filter Workshop. Atlanta, GA, USA.
Bielefeldt, A.R., Kowalski, K. and Summers, R.S. (2009) (In Press) Bacterial treatment effectiveness
of point-of-use ceramic water filters. Water Research (2009). doi:
10,1016/j.w.watres.2009.04.047.
Bloem, S.C., van Halem, D., Sampson, M.L., Huoy, L.S. and Heijman, B. (2009) Silver Impregnated
Ceramic Pot Filter: Flow Rate versus the Removal Efficiency of Pathogens. International
Ceramic Pot Filter Workshop. Atlanta, GA, USA.
Brown, J. (2007) Effectiveness of ceramic filtration for drinking water treatment in Cambodia.
Unpublished Thesis, University of North Carolina.
Brown, J. and Sobsey, M. (2006) Independent Appraisal of Ceramic Water Filtration Interventions
in Cambodia. Submitted to UNICEF:
Brown, J., Sobsey, M.D. and Loomis, D. (2008) Local Drinking Water FIlters Reduce Diarrheal
Disease in Cambodia: A Randomized, Controlled Trial of the Ceramic Water Purifier. Am. J.
Trop. Med. Hyg. 79(3): 394-400.
Campbell, E. (2005) Study on Life Span of Ceramic Filter Colloidal Silver Pot Shaped (CSP) Model.
Managua, Nicaragua.
CFMWG (2009) Minimum Standards for Local Manufacturing of Ceramic Filters for Water
Treatment. The Ceramics Filter Manufacturing Working Group: Atlanta, GA, USA.
Clasen, T., Robert, I., Rabie, T., Schmidt, W. and Cairncross, S. (2006) Interventions to improve
water quality for preventing diarrhoea. Cochrane Database of Systematic Reviews 2006. 3:
104.
Fahlin, C.J. (2003) Hydraulic Properties Investigation of the Potters For Peace Colloidal Silver
Impregnated, Ceramic Filter. Unpublished Thesis, University of Colorado at Boulder,
Boulder, CO, USA.
FilterPure (2009). Dominican Republic: Photograph provided by FilterPure in response to
questionnaire.

97
Current Practices in Manufacturing of Ceramic Pot Filters for Water Treatment
Hagan, J.M., Harley, N., Pointing, D., Sampson, M., Smith, K. and Soam, V. (2009) Resource
Development International - Cambodia Ceramic Water Filter Handbook-, Version 1.1.
Phnom Penh, Cambodia.
Hernandez, M. (2006) Kiln Building. ETHOS Conference Presentation. Kirkland, WA, USA.
Hernandez, M. (2009). Professor of Art. Northern Illinois University: Illustrations and photgraphs
provided by Manny Hernandez.
Howard, G. and Bartram, J. (2003) Domestic Water Quantity, Service Level and Health. World
Health Organization: Geneva.
HWTSNetwork (2009) Network Bulletin. The International Network to Promote Household Water
Treatment and Safe Storage, World Health Organization. Issue 3.
ICAITI (1980) Identification and Evaluation of Design Alternatives for a Low Cost Domestic Filter for
Drinking Water. Central American Institute of Industrial Technology (ICAITI): Guatemala.
IDE (2008) IDE Ceramic Water Purifier Production Manual. International Development Enterprises
(IDE): Cambodia.
IDECambodia (2009): Photographs provided by IDE Cambodia in response to the questionnaire.
Johnson, S.M., Peletz, R.L. and Murcott, S. (2008) Results from household ceramic filter evaluation
in northern Ghana. Access to Sanitation and Safe Water: Global Partnerships and Local
Actions. 33rd WEDC International Conference, Accra, Ghana.
Klarman, M. (2009) Investigation of Ceramic Pot Filter Design Variables. Unpublished Thesis,
Emory University, Rollins School of Public Health, USA.
Kumar, R. (1999) Research methodology: A step-by-step guide for beginners. Sage.
Lantagne, D., Klarman, M., Mayer, A., Preston, K., Napotnik, J. and Jellison, K. (2009) Effect of
production variables on microbiological removal in locally-produced ceramic filters for
household water treatment. International Journal of Environmental Health Research.
Lantagne, D., Meierhofer, R., Allgood, G., McGuigan, K.G. and Quick, R. (2009) Comment on "Point
of Use Household Drinking Water Filtration: A Practical, Effective Solution for Providing
Sustained Access to Safe Drinking Water in the Developing World". Environ. Sci. Technol.
43(3): 968-969.
Lantagne, D.S. (2001a) Investigation of the Potters for Peace Colloidal Silver Impregnated Ceramic
Filter Report 1: Intrinsic Effectiveness. Alethia Environmental: Allston, MA, USA.
Lantagne, D.S. (2001b) Investigation of the Potters for Peace Colloidal Silver Impregnated Ceramic
Filter Report 2: Field Investigations. Alethia Environmental: Allston, MA, USA.

98
Current Practices in Manufacturing of Ceramic Pot Filters for Water Treatment
Nardo, R. (2005) Factory Startup Manual: For the Production of Ceramic Water Filters.
Unpublished
Oyanedel-Craver, V. and Smith, J. (2007) Sustainable colloidal-silver-impregnated ceramic filter for
point-of-use water treatment. Environmental science & technology 42(3): 927-933.
Pelita (2009). Indonesia (Indo-2): Photograph provided by Pelita Indonesia in response to
questionnaire.
Peterson, B.E. (2009) Kiln Types by Construction.About.com:Pottery.
http://pottery.about.com/od/potterykilns/tp/typkilncons.htm. (Accessed 2009).
Pillars, B. and Diaz, R.T. (2009) Factory Overview; Addressing Recontamination. International
Ceramic Pot Filter Workshop, WEF Disinfection. Atlanta, GA, USA.
PottersforPeace (2009) http://pottersforpeace.org. (Accessed 2009).
Rayner, J. (2006) Potters for Peace Ceramic Filter Production Manual. Unpublished
Rivera, R. (2006) Production of Ceramic/Colloidal Silver (CCS) Water Filters. Unpublished
Roberts, M. (2004) Field Test of a Silver-Impregnated Ceramic Water Filter. People-Centred
Approaches to Water and Environmental Sanitation. 30th WEDC International Conference,
Vientiane, Lao PDR.
Sapsford, R. and Jupp, V. (1996) Data collection and analysis. Sage.
Schmidt, W.P. and Cairncross, S. (2009) Household Water Treatment in Poor Populations: Is There
Enough Evidence for Scaling up Now? Environmental science & technology 43(4): 986-992.
SilverFilterCompany (2009). Yemen: Photographs provided by the Silver Filter Company, Yemen in
response to the questionnaire.
Sobsey, M.D. (2002) Managing water in the home: accelerated health gains from improved water
supply. World Health Organization: Geneva.
Sobsey, M.D., Stauber, C.E., Casanova, L.M., Brown, J.M. and Elliott, M.A. (2008) Point of use
household drinking water filtration: A practical, effective solution for providing sustained
access to safe drinking water in the developing world. Environmental science & technology
42(12): 4261-4267.
Thirst-Aid (2009a) Personal Communication (e-mail correspondence).
Thirst-Aid (2009b): Photograph provided by Thirst-Aid in response to questionnaire.

99
Current Practices in Manufacturing of Ceramic Pot Filters for Water Treatment
UN (2009a) Millenium Development Goals Indicators.United Nations Statistics Division.
http://millenniumindicators.un.org/unsd/mdg/Host.aspx?Content=Indicators/OfficialList.h
tm. (Accessed July 2009).
UN (2009b) The Millenium Development Goals Report 2009. United Nations Department of
Economic and Social Affairs (DESA): New York.
UNICEF (2008) Promotion of Household Water Treatment and Safe Storage in UNICEF WASH
Programmes. United Nations Children's Fund (UNICEF):
UNICEF (2009) UNICEF - Statistics and monitoring - Millennium Development Goals (MDG)
monitoring. http://www.unicef.org/statistics/index_24304.html. (Accessed June 2009).
van Halem, D. (2006) Ceramic silver impregnated pot filters for household drinking water
treatment in developing countries. Unpublished Thesis, Delft University of Technology,
Netherlands.
WHO (1997) Guidelines for drinking-water quality, 2nd edition. World Health Organization:
Geneva.
WHO (2006) Guidelines for drinking-water quality: first addendum to third edition. World Health
Organization:
WHO (2009a) Burden of disease and cost-effectiveness estimates.
http://www.who.int/water_sanitation_health/diseases/burden/en/index.html. (Accessed
August 2009).
WHO (2009b) Facts and figures: Water, sanitation and hygiene links to health.WHO.
http://www.who.int/water_sanitation_health/publications/factsfigures04/en/. (Accessed
June 2009).
WHO (2009c) Water-related diseases.
http://www.who.int/water_sanitation_health/diseases/diarrhoea/en/. (Accessed 2009).
Wright, J., Gundry, S. and Conroy, R. (2004) Household drinking water in developing countries: a
systematic review of microbiological contamination between source and point-of-use.
Tropical Medicine & International Health 9(1): 106.
100
Current Practices in Manufacturing of Ceramic Pot Filters for Water Treatment
10 Appendices
Appendix 1 Ceramics Filter Manufacturing Working Group
Daniele Lantagne, PE Centers for Disease Control and Prevention
Lisa Ballantine FilterPure
Joe Brown, PhD University of Alabama
Vinka Craver, PhD University of Rhode Island
Burt Cohen Potters without Borders
Terry Foecke
Tracy Hawkins FilterPure
Manny Hernandez University of Northern Illinois
Stephanie Hooker National Institute of Standards and Technology
Susan Murcott Massachusetts Institute of Technology
Robert Pillers Potters for Peace
Justine Rayner Loughborough University
Mike Stewart University of Colorado

101
Current Practices in Manufacturing of Ceramic Pot Filters for Water Treatment
Appendix 2 Filter Factories Contacted and Participating Factories
Filter Factories Contacted and Response Rates
Country
CodeLo
catio
n
Org
anisa
tion
Response
to
initi
al e
-mai
l
Fille
d out
questio
nnaire
Inte
rvie
wed
BothNeith
er
1 Benin Benin Porto Novo Songhai Centre Yes x
2 Cambodia Cam-1 Kampong IDE Cambodia Yes x
3 Cambodia Prey Veng Red Cross Yes x
4 Cambodia Cam-2 Kandal RDI Yes x
5 Colombia Colombia Ocana ASOPAFIN Yes x
6 Colombia Pasto Private Yes x
7 Cuba Camaguey Government Yes x
8
Dominican
Republic DR Jarabacoa AguaPure Yes x
9
Dominican
Republic Santo Domingo IDEAC Yes x
10 El Salvador
Tecoluca, San
Vincente CORDES Yes x
11 Ghana Accra, Ghana Ceramica No x
12 Guatemala Guate-1 Antigua AFA Yes x
13 Guatemala Guate-2
San Mateo
Ixtatan Fundacion Ixtatan Yes x
14 Honduras Sabana Grande Private Owner Yes x
15 Indonesia Indo-1 Tabanan, Bali BFDW Yes x
16 Indonesia Indo-2 Bandung, Java Pelita Indonesia Yes x
17 Iraq Unknown US Gov't No Reply x
18 Kenya Limuru Private Owner Yes x
19 Myanmar MM-All Eight locations Thirst-Aid Yes x
20 Myanmar Unknown Unknown No Reply x
21 Nicaragua Nica-1 San Marcos Private Owner Yes x
22 Nicaragua Nica-2 Ciudad Sandino Private Owner Yes x
23 Nigeria Nigeria Abeoku Private Owner Yes x
24 Peru Chorillos, Lima Merinsa Yes x
25 Peru Urubamba ProPeru Yes x
26 Senegal Ourssogui Matam
Senegal Gov't/
KOICA
No longer
producing x
27 Sri Lanka SL-1 Kelanya SLRCS Yes x
28 Sri Lanka SL-2 Matara Private Owner Yes x
29 Tanzania Tanz-1 Arusha
Safe Water
Ceramics East
Africa (SWCEA) Yes x
30 Tanzania Tanz-2 Tabora Simba Clay Yes x
31 Yemen Yemen Hadda Private Owner Yes x
Totals: n=31 27 6 8 4 13
n=27 87% 22% 30% 15% 48%

102
Current Practices in Manufacturing of Ceramic Pot Filters for Water Treatment
Appendix 3 Tyler Mesh Equivalent
Source: Primary author: AZoM.com, http://www.azom.com/details.asp?ArticleID=1417
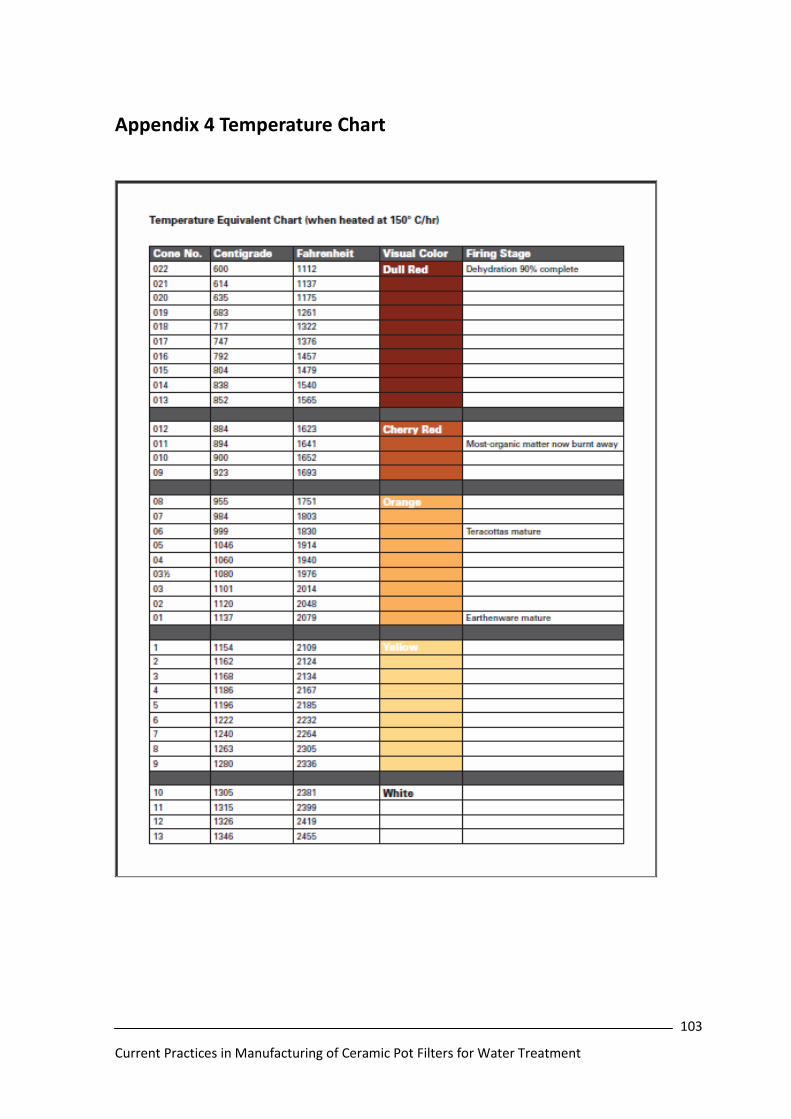
103
Current Practices in Manufacturing of Ceramic Pot Filters for Water Treatment
Appendix 4 Temperature Chart

104
Current Practices in Manufacturing of Ceramic Pot Filters for Water Treatment
Appendix 5 Survey
A copy of the survey in Spanish is available by contacting the author.
The survey was developed from the ‘mind map’ in Figure 2-4. Each question on the survey is
labelled according to the following codes: Background Information: QBG 1-29, Materials and
Processing: QMP 1-72, Filter Production: QFP 1-80, Quality Control: QQC 1-34, and Delivery: QD 1-
21. Answers from each of the participating factories are presented in the data sheets in (Appendix
6). The question codes are in the top two rows of the data sheets.

105
Current Practices in Manufacturing of Ceramic Pot Filters for Water Treatment
Appendix 6 Survey Data
The survey is presented in (Appendix 5). Each question is labelled according to the following codes:
Background Information: QBG 1-29, Materials and Processing: QMP 1-72, Filter Production: QFP 1-
80, Quality Control: QQC 1-34, and Delivery: QD 1-21. Answers from each of the participating
factories are presented in the following data sheets, the question codes can be found in the top
two rows. In some cases, where no factories provided information, the columns were deleted
from the data sheets (for example, no factories make their own colloidal silver and no participants
provided acceptable ranges for microbiological testing results).
Answers to multiple choice and Yes/No questions were recorded using numerical codes. The
answer options are abbreviated in parentheses next to the question in the question row (third row
from the top). For example question 15 in the Background Information section (QBG15) shows:
“Do you produce filters (FT/PT/ORD)”, where FT=Full Time, PT=Part Time and ORD=On Order, the
answers are recorded as 1, 2, and 3 respectively. Likewise, for Yes/No questions (Y/N), Yes=1 and
No=2. Where “blank” or “xx” appears in the answer, the participant did not answer this question.