Embed Size (px)
Citation preview

IC CENTRE FOR GOVERNANCE3, Palam Marg, 3rd Floor, Vasant Vihar, New Delhi-110057
Tele : 91-11-40809939E-mail: [email protected] • Website: www.iccfg.net
ThE JO
uRN
Al OF G
OVERN
ANCE
Volume 24 January 2022
ContributorsAbhijit Das * Ajay Vir Jakhar * Atul Chaturvedi
Bharat Sharma * Carmel Cahill * Gautam Kumar Dasharish Damodaran * Jugal Kishore Mohapatra * Kriti Khurana
Pratap S. Birthal * Sachin Kumar Sharma * Seema BathlaShalini Bhutani * Shweta Saini * Shyma Jose
Siraj Chaudhry * Vishnu Saksena
Volume 24
January 2022
SPECIAL ISSUE ON AGRICULTURE
IC Centre for GovernanceN e w D e l h I
The Journal of GovernanceIC Centre for Governance3, Palam Marg, 3rd Floor, Vasant Vihar, New Delhi-110057
IC Centre for Governance
Justice M. N. Venkatachaliah – ChairmanFormer Chief Justice of India
D.V. KapurFormer Chairman, Reliance Power limited
Fali S. NarimanFormer Member of Parliamen, Rajya Sabha
J C lutherFormer Deputy Governor , Reserve Bank of India
K. KasturiranganMember of Parliament Rajya Sabha
K.l. ThaparDirector, Asian Institute of Transport Development
Mahesh KapoorFormer Advisor, Planning Commission
Mukund B. KaushalFormer Secretary, Internal Security, Ministry of home Affairs
Nalini SinghCMD, TV live India Pvt. ltd
Prabhat KumarFormer Cabinet Secretary
Pratap NarayanFormer Director General, Fertiliser Association of India
R.A. MashelkarFormer Director General CSIR
R.D. MathurTrustee MRA
Rajmohan GandhiFormer President, Initiatives of Change
Sarosh J. GhandyFormer MD, Tel-con Construction Company
Shanti NarainFormer Member Traffic Railway Board
Surendra SinghFormer Cabinet Secretary
Syed Shahid MahdiFormer Vice Chancellor, Jamia Millia Slamia
T.S. KrishnamurthyFormer Chief Election Commissioner of India
Yogendra NarainFormer Secretary General Rajya Sabha
The IC Centre for Governance has been set up with the objective of collective thinking and acting on important issues of governance. It believes that public governance is too serious a matter to be left entirely to the state and that the involvement of civil society is not only desirable but also essential. The Centre seeks to strengthen the capacity of civil society and government for ensuring good governance.
Editorial Board
V K Agnihotri
Mahesh Kapoor
R A Mashelkar
Anil Tyagi
Prabhat Kumar – Editor
Siraj hussain – Guest Editor

The Journal of
Vol. 24 January 2022
IC Centre for GovernanceNew Delhi
governance
SPECIAL ISSUE ON AGRICULTURE

Opinions expressed in various articles in this issue of the Journal are exclusively those of authors and not of any other individual or institution, including IC Centre for Governance. The Journal is carrying the articles in good faith with the hope that they will enrich the debate on Indian Agriculture.
The Journal of Governance is printed and published by Mahesh Kapoor on behalf of the IC Centre for Governance, New Delhi-100057
Publication Coordinator - Nandita Sinha
Printed at Rakmo Press Pvt. Ltd. C-59, Okhla Industrial Area,Phase I, New Delhi-110020
Please address all correspondence to IC Centre for Governanceat 3, Palam Marg, 3rd Floor, Vasant Vihar, New Delhi - 110057e-mail:[email protected]

AAP Applied Administered Price AC Agriculture Census AHH Agricultural Household AHIDF Animal Husbandry Infrastructure Development
Fund AI Artificial IntelligenceAIBP Accelerated Irrigation Benefit Program AIDIS All India Debt and Investment Survey AMS Aggregate Measurement of Support AoA Agreement on Agriculture APEDA Agricultural and Processed Food Products Export
Development AuthorityAPMC Agricultural Produce Market Committee APSA Asia & Pacific Seed Association ASCM Agreement on Subsidies and Countervailing
Measures BAU Business as Usual BCM Billion Cubic MetresBMI Body Mass IndexBRICS Brazil, Russia, India, China, and South AfricaBULOG Badan Urusan Logistik Indonesia Logistics
BureauCAD Canal Command Area Development CADCAG Comptroller and Auditor General of IndiaCAGR Compound Annual Growth Rate CCT Conditional Cash Transfer CGIAR Consultative Group on International Agricultural
Research CGWB Central Ground Water Board
LIST OF ABBREVIATIONS

CM Collateral Management / Collateral Management Agency
CO2eq Carbon Dioxide EquivalentCoA Committees on Agriculture CPCB Central Pollution Control Board of India CPDOs Central Poultry Development Organisations CPI-Al Consumer Price Index for Agricultural Labourers CSO Common Stock Outstanding / Common Shares
OutstandingCSS Centrally Sponsored SchemesCWMI Composite Water Management Index D2C Direct to Consumer DAP Di-ammonium Phosphate DBT Direct Benefit Transfers DBT-F Direct Benefit Transfer in FertiliserDCR Dalwai Committee Report DCT Direct Cash Transfer DDA Doha Development AgendaDPT Diphtheria-Pertussis-TetanusDSB Dispute Settlement BodyEC Act 1955 The Essential Commodities Act 1955ERP External Reference Price EU European UnionFAO Food and Agricultural Organisation FAPAFS Act 2020
The Farmers (Empowerment and Protection) Agreement on Price Assurance and Farm Services Act
FAQs Frequently Asked QuestionsFCI Food Corporation of India FCO Fertiliser Control Order FERP Fixed External Reference Price FICCI Federation of Indian Chambers of Commerce &
Industry
FIDF Fisheries and Aquaculture Infrastructure Development Fund
FMD Foot and Mouth Disease FPCs Farmer Producer Companies FPOs Farmer Producer Organisations FPTC Act 2020
Farmers’ Produce Trade and Commerce (Promotion and Facilitation) Act, 2020
FRA Food Reserve Agency (in Zambia)FSII Federation of Seed Industry in India FV Farmers’ VarietyFY Financial YearGASC General Authority for Supply of Commodities (in
Egypt)GATT General Agreement on Tariffs and Trade GDP Gross Domestic ProduceGFR Gross Fertiliser Recommendations GHI Global Hunger Index GoAP Government of Andhra PradeshGoI Government of IndiaGVA Gross Value AddedGWP Global Water Partnership ha per hectare HH Household ICAR Indian Council of Agricultural Research ICDS Integrated Child Development Services ICRIER Indian Council for Research on International
Economic Relations.ICT Information and Communications TechnologyIFAD International Fund for Agricultural Development IHD Institute for Human Development IIPS International Institute for Population SciencesINAPH Information Network for Animal Production and
Health

INR Indian RupeeIoT Internet of Things IP Intellectual Property IPPP Innovative Poultry Productivity Project IPRs Intellectual Property Rights ISF International Seed Federation ITPGRFA International Treaty on Plant Genetic Resources
for Food and Agriculture IVF In Vitro Fertilisation IWP Irrigation Water Productivity JICA Japan International Cooperation Agency JJM Jal Jeevan MissionK Potassic fertiliserskg Kilogram KLPD Kilo-litres Per Day LLPD Lakh Litres Per DayLPG Liquefied Petroleum Gasm Metrem3 Cubic MetresMCO Movement Control Order MDM Midday Meal Scheme MEIS Merchandise Export from India Scheme MGNREGA Mahatma Gandhi National Rural Employment
Guarantee Act ML Machine Learning MMT Million Metric TonnnesMOP Muriate of Potash MoSPI Ministry of Statistics and Program ImplementationMPS Market Price Support MSC Microsave Consultancy MSP Minimum Support PriceMT/mt Metric TonneMW Megawatts

MWCD Ministry of Women and Child Development N Nitrogenous fertiliserNAAS National Academy of Agricultural SciencesNABARD National Bank for Agriculture and Rural
Development NAFIS NABARD All India Rural Financial Inclusion
SurveyNAIP Nationwide Artificial Insemination ProgrammeNAMA Non-agriculture Market Access NAS National Accounts Statistics NBFC Agricultural Non-Banking Finance CompanyNBS Nutrient-Based Subsidy NCIWRD National Commission on Integrated Water
Resources Development NCPB National Cereals and Produce Board (in Kenya)NFDB National Fisheries Development Board NFHS National Family Health SurveyNFSA National Food Security ActNiti Aayog National Institution for Transforming IndiaNLM National Livestock Mission NMCG National Mission for Clean Ganga NPDD National Programme for Dairy Development NPS Non-product Specific NSO National Statistical Office NSS National Sample SurveyNSSO National Sample Survey Office (earlier National
Sample Survey Organisation)NWP National Water Policy NWR Negotiable Warehousing Receipts OECD Organisation for Economic Co-operation and
DevelopmentOMCs Oil Marketing Companies P Phosphatic Fertilisers

PAN Permanent Account NumberPASSCO Pakistan Agricultural Storage & Services
Corporation Ltd. PAU Punjab Agriculture UniversityPBRs Plant Breeder Rights PDS Public Distribution System PIH PepsiCo India Holdings Private Limited PLC Price Loss Coverage programme PLFS Periodic Labour Force Survey PM-KISAN Pradhan Mantri Kisan Samman Nidhi PMKSY Pradhan Mantri Krishi Sinchayee YojanaPMMSY Pradhan Mantri Matsya Sampada Yojana PoS Point-of-Sale POSHAN Prime Minister’s Overarching Scheme for Holistic
Nourishment PPP Purchasing Power Parity PPV&FRA Protection of Plant Varieties and Farmers’ Rights
AuthorityPPV&FR Act Protection of Plant Varieties and Farmers’ Rights
ActPSS Product-specific Support PVC Plant Variety Certificate PVP Plant Variety Protection RCEP Regional Comprehensive Economic Partnership RGM Rashtriya Gokul Mission RKVY-RAFTAAR
Rashtriya Krishi Vikas Yojana - Remunerative Approaches for Agriculture and Allied Sectors Rejuvenation
RO Reverse OsmosisRRR Resource Recovery and Reuse S&DT Special and Differential Treatment SAS Situation Assessment Survey SAUs State Agricultural Universities

SDG Sustainable Development Goal SMF Small and Marginal FarmersSNPs Single Nucleotide Polymorphisms SSG Special Agricultural Safeguard SSM Special Safeguard Mechanism SWW Sustainable Water World tcd tonnes of cane per day TFS Total Fermentable SugarsTMO Turkish Grain Board (in Turkey)TPDS Targeted Public Distribution System TRIPS Trade-Related Aspects of Intellectual Property
Rights U.S.A United States of AmericaUN United NationsUNCTAD United Nations Conference on Trade and
DevelopmentUNDROP United Nations Declaration on the Rights of
Peasants and Other People Working in Rural Areas
UNICEF United Nations Children’s FundUNO United Nations OrganisationUP Uttar PradeshUPOV International Union for the Protection of New
Varieties of Plants UR Uruguay Round URAA Uruguay Round Agreement on Agriculture USD United States Dollar UT Union TerritoryVADPs Value Added Dairy ProductsVIP Ventilated Improved PitVoP Value of Production W&S Wages and SalariesWASH Water, Sanitation and Hygiene
WDRA Warehousing Development and Regulatory Authority
WFP World Food Programme WHO World Health OrganisationWRD Water Resources Development (Government of
Maharashtra)WSP Water and Sanitation ProgrammeWTO World Trade Organisation WUA Water User AssociationWUE Water Use Efficiency

C o n t e n t s
Editorial 1 SIRAJ HUSSAIN
Indian Farmer Incomes 11 Trends, Challenges and Opportunities SHWETA SAINI
Complexity of Crop Diversification in Punjab 31 AJAY VIR JAKHAR
Unlocking Ganna Pradesh’s Potential 39 HARISH DAMODARAN
Synchronizing Public Investment in 51 Agriculture with Capital Requirements of Farmers SEEMA BATHLA and GAUTAM KUMAR DAS
A Pragmatic Water Vision for India 69 Balancing Water for Food and for Growth BHARAT SHARMA
Indian Agriculture under the WTO Regime 105 Key Issues SACHIN KUMAR SHARMA, PRATAP S. BIRTHAL and ABHIJIT DAS
India and the WTO Negotiations on Agriculture 125 What strategy to adopt? CARMEL CAHILL
Intellectual Property Governance, Plant Variety 137 Protection and Public InterestSHALINI BHUTANI
The Deteriorating Child Nutritional Status in India 147 Evidence from NFHS 2019-20SHYMA JOSE and KRITI KHURANA
Biting the Bullet: Direct Benefit Transfer of Fertiliser Subsidy 171 Challenges and OptionsJUGAL KISHORE MOHAPATRA

Collateral Management 181 Challenges and the Way Forward SIRAJ CHAUDHRY
India’s Livestock, Dairy and Fisheries Sector 185 Trends and Opportunities ATUL CHATURVEDI
BooK ReVIeW
oUR ContRIBUtoRs
oUR ContRIBUtoRs 201
Prabhat Kumar’s ‘Public Service Ethics – 197 A Quest for Naitik Bharat’VISHNU SAKSENA

The Journal of Governance – January 2022 / 1
Editorial
This issue of The Journal of Governance is focused on agriculture. For policy makers and administrators on the ground,
it is necessary to understand the complexity of issues in agriculture and allied sectors. This special issue aims to provide a perspective of various dimensions which confront various layers of government.
Never in the past has agriculture received as much media attention as it has in 2020 and 2021. The credit for attracting this attention goes to farmers, predominantly from Punjab, Haryana, Uttar Pradesh and Rajasthan who, confident about the justness of their demands, sat on the borders of Delhi, for more than one year. Perhaps for the first time, the middle classes also became aware of the issues confronting India’s agriculture sector.
Agriculture is a vast ocean on which about 45.6 per cent of our population (PLFS 2019-20) depends for livelihood. In fact, COVID-19 pandemic took its toll causing the employment in agriculture going up from 42.5 per cent in 2018-19.
Agriculture provides food security to India. Farmers grow cereals, pulses, fruits, vegetables and several other products like mushrooms, honey etc. Agriculture provides many raw materials to industry. Farmers also produce milk and poultry. Fisheries sector provides livelihoods to about 16 million fishers and fish farmers at the primary level and almost twice the number along the value chain.
COVID-19 pandemic hit the Indian economy very hard even though the economy was slowing even before the pandemic reached India. Every subsequent quarter reported a lower growth.
The growth of GDP has been slowing down since quarter 1 of FY 2018-19, when it was 7.1 per cent. By quarter 4 of FY 2019-20, it had fallen to 3 per cent. The first quarter of financial year 2020-21 was impacted by the sudden nationwide lockdown due to early

2 / Editorial
reports of Covid-19. The growth plunged to minus 24.4 per cent in quarter 1 of FY 2020-21. It was in negative territory (-7.4 per cent) in quarter 2 also. Quarter 3 and 4 experienced GDP growth of just 0.5 per cent and 1.6 per cent respectively. We ended the financial year 2020-21 with negative growth of 7.3 per cent. The first advance estimates of GDP show that the Indian economy would expand by 9.2 per cent in 2021-22. Real growth over the previous FY 2021 may be just about 1.3 per cent.
It was the agriculture sector which brought some cheer to the economy in this period. During the pandemic hit year of 2020-21, GVA of agriculture grew by 3.6 per cent. In 2021-22 also, the agriculture sector is likely to witness growth of 3.9 per cent. Not only that, agriculture provided subsistence to millions of migrants who had no option but to travel back to their villages when the lock down was announced in March 2020.
It is therefore not surprising that the share of GVA of Agriculture and Allied sector to total economy has increased from 17.6 per cent in 2018-19 to 20.2 per cent in 2020-21. This is the reverse of what was happening to the Indian economy for two decades.
In this special issue of The Journal of Governance, we had requested scholars who have studied aspects of agriculture for several years. There are twelve articles in this issue but we have still not been able to cover several facets which are important for the sector. These include the role of chemicals in farming, horticulture, agricultural exports, natural farming, excessive procurement of wheat and rice, plantation and the impact of climate change on India’s agriculture.
Since the promulgation of three path breaking ordinances in June 2020, the attention of the country remained focused on the reform process. In September 2020, the parliament passed The Farmers’ Produce Trade and Commerce (Promotion and Facilitation) Act, 2020; Farmers (Empowerment and Protection) Agreement of Price Assurance and Farm Services Act, 2020 and Essential Commodities (Amendment) Act, 2020. The idea behind these legislations was to free up the agriculture sector from the tight regulatory framework

The Journal of Governance – January 2022 / 3
in which the sector has been functioning. On 12th January 2021, the Supreme Court stayed the
implementation of the farm laws.There has been a broad consensus that investment in warehousing
and supply chain of agricultural produce is hampered due to harsh provisions of the EC Act. The Essential Commodities (Amendment) Act, 2020 was also based on the premise that the country is now producing permanent surpluses in most crops and the days of shortages and scarcity are over. Within days of its enactment, the Government banned the export of onions due to rising prices. This ban was imposed even though the retail price was less than the average in the previous twelve months. It was also lower than the average price in the previous five years. Thus, the ban went against the grain of the laws enacted by the Government. It is clear that the Government was mindful of the fact that the surplus in onion production varied from year to year and it anticipated a rise in prices.
Going further against the spirit of reformatory laws, on 2nd July 2021, the Centre issued the Removal of Licensing Requirements, Stock Limits and Movement Restrictions on Specified Foodstuffs (Amendment) Order, 2021. Stock limits were imposed on all pulses except moong until 31st October 2021. The stock limit was fixed at 200 MT (provided there should not be more than 100 MT of one variety) for wholesalers and 5 MT for retailers. For the millers it was to be equal to the last 3 months of production or 25% of annual installed capacity, whichever is higher.
The Government used the stay granted by the Supreme Court against the three laws and invoked the EC Act as an ‘effective’ tool to check food inflation. The Economic Survey of 2019-20 had an entire chapter titled ‘Undermining Markets: When Government Intervention Hurts More Than It Helps’. It mentioned that the EC Act is “anachronistic as it was passed in 1955 in an India worried about famines and shortages; it is irrelevant in today's India and must be jettisoned”. Clearly, the Government disagreed with the

4 / Editorial
argument made in the Economic Survey regarding ineffectiveness of EC Act.
The second law enacted by the Union Government, The Farmers’ Produce Trade and Commerce (Promotion and Facilitation) Act, 2020 (FPTC), sought to create a ‘trade area’ outside the physical boundary of APMCs. Anyone with a PAN card could start the business of purchase and sale of agricultural produce in the trade area. No licence was required for starting such a business in the trade area. The transactions in trade area were not subject to market fee and other charges levied on transactions in APMCs. These charges ranged from 1 per cent to 6 per cent in different states. Punjab had the highest rate of six per cent.
The farmers in Punjab and Haryana opposed FPTC law more than anything else. They feared that differential taxation between trade areas and APMCs would result in the slow death of APMCs. They also thought that it would be the beginning of end of public procurement of crops at MSP. The recommendation of Shanta Kumar Committee (2015) was the argument advanced by agitating farmers unions about the dilution of coverage under National Food Security Act 2013 from 67 per cent to 40 per cent of the population.
Contrary to popular understanding, the farmers were never barred from selling their produce outside APMCs. However, the purchasers needed a licence from APMCs and they were required to pay applicable market fees and other charges. Now that FPTC has been repealed, a new consensus is needed to bring down the market fee and other charges to about 2 per cent in all the states across India. The Union Government needs to take initiative in this regard so that the momentum of agricultural reforms is not lost.
In the past there have been instances of state governments banning or restricting movement of agricultural produce outside the state boundaries. On January 2, 2022 the newspapers reported that Telangana is not permitting movement of potato from UP. It is clear that agricultural markets continue to remain fragmented, causing loss to farmers. A Central law is therefore urgently required

The Journal of Governance – January 2022 / 5
to regulate interstate trade in agricultural produce. For this, the Union Government needs to take initiative and start consultations with the state governments.
The third law enacted in September 2020 was the Farmers (Empowerment and Protection) Agreement on Price Assurance and Farm Services Act (FAPAFS). It sought to create a uniform framework for contract farming through an agreement between a farmer and a buyer of his produce. In 2013, the Akali Dal government of Punjab had also enacted the Punjab Contract Farming Act 2013 but its rules were never notified. In 2018, the Union Government also circulated a model law to regulate contract farming. This was called the State/UT Agricultural Produce & Livestock Contract Farming and Services (Promotion & Facilitation) Act, 2018. It is clear that as late as 2018, the understanding in the Government was that a law on contract farming is in the domain of the state governments.
It is not that farmers are completely unaware about the contractual arrangement of production. A substantial quantity of seeds is produced by farmers under contract with seed companies. Similarly, about sixty per cent of poultry meat and eggs are produced under contractual arrangements. The poultry producers under contract earn less than non-contract producers but they are shielded from fluctuation of prices. Therefore, poultry farmers produce contract production of poultry.
In many states contract farming is regulated through the APMC Act. The contracts are to be registered with the APMCs. After the repeal of FAPAFS 2020, the state governments have to continue the dialogue with stakeholders and provide a sound legal framework for contract farming which can shield the farmers from fluctuations in price. The success stories of contract farming need to be documented and widely disseminated so that the farmers and producers of other agricultural and livestock produce are reassured that contractual arrangements will bring stability to their income.
It is not only the three laws, now repealed, which need to be the central focus of discussion on Indian agriculture. Economists
6 / Editorial
have long argued that India is spending too much on subsidies like fertiliser, electricity, irrigation and food and too little on investment. The PM Kisan Samman Nidhi was announced on 24th February 2019, just about two months before the parliamentary elections from 11th April to 19th May 2019. About half of the budget of the department of agriculture is now allocated to PM Kisan. After the farmers' agitation and repeal of three laws, the Government will have to go back to the drawing board to map the road ahead for subsidies. The biggest hurdle in any direct benefit transfer of subsidies is the problem of tenant farmers. Since they are not recorded in land documents, they do not gain from direct benefit transfer (DBT) of various subsidies. An example is PM Kisan where Rs. 6,000 goes to the landholders in three instalments. Odisha has made some progress in identifying the tenants and the landless for receiving benefit under Kalia scheme. An amount of Rs. 12,500 is provided to landless agricultural households for allied activities like goat rearing, poultry, duckery, mushroom cultivation and bee-keeping and fishery kits for fisherman. At present there is no nationwide roadmap to record tenancy. The recommendations of the Haque Committee on land leasing (2016), set up by Niti Ayog, remain unimplemented by most states.
In this issue, experts have written on various dimensions of India’s agriculture sector. Shweta Saini analyses the recently released report titled Situation Assessment of Agricultural Households and Land and Livestock Holdings of Households in Rural India, 2019.
Even though the three farm laws enacted in September 2020 did not specifically address the issue of diversification, the underlying theme was that open and efficient markets will provide an incentive to farmers to diversify from wheat and rice to other crops. Ajay Jakhar in his article examines the issue of diversification from the perspective of governance. As Chairman of Punjab Farmers’ Commission, he has closely observed the political challenges of policy making.
Indian agriculture has benefited enormously from the investment made by the Government in research. A new variety of sugarcane,

The Journal of Governance – January 2022 / 7
Co-0238, developed by Dr Bakshi Ram, former director of the Indian Council of Agricultural Research’s Sugarcane Breeding Institute at Coimbatore has transformed the sugarcane scene in Uttar Pradesh. Harish Damodaran provides an overview of this transformation which has been helped by the Government’s policy to promote manufacture of ethanol from sugarcane. His article on ‘ganna’ cultivation of Uttar Pradesh provides new insights about opportunities for cultivation of sugarcane in the state.
Professor Seema Bathla and Gautam Kumar Das examine the need for investing more in agriculture rather than spending huge amounts on agricultural subsidies.
Only about 48 per cent of arable land in India is irrigated and several regions of the country face droughts from time to time. Even in irrigated areas, the water table has been falling. In Punjab and Haryana, the cultivation of paddy is not sustainable. Bharat Sharma provides a perspective on the emerging scenario and the policies required to meet the challenge of water scarcity for agriculture.
The agricultural policies of the Government are also impacted by the commitment made by India at the World Trade Organisation. In December 2021, the panel set up by the Dispute Settlement Body (DSB) of the World Trade Organisation (WTO) ruled against the subsidies provided to the sugar sector. Australia, Brazil and Guatemala had challenged the support provided by India to its sugarcane farmers and the sugar mills. The export subsidies were also challenged. In 2018, USA had questioned India’s support to wheat and rice in the form of MSP for procurement, bonuses announced by the state governments and currency used by India (US dollars) in its notifications to WTO. In December 2021, a WTO panel has ruled that India’s policies on sugar cane were not consistent with WTO rules.
There are two articles on how India is impacted by its commitments at WTO. Carmel Cahill and Sachin Kumar Sharma provide two different perspectives on this important issue.
In December 2021, the Protection of Plant Varieties and

8 / Editorial
Farmers Rights’ Authority (PPV&FRA) revoked the registration given to PepsiCo for the FL-2027 variety of potato. PepsiCo had taken nine farmers of Gujarat to court for infringement of its intellectual property right (IPR). Kavitha Kuruganti of the Alliance for Sustainable and Holistic Agriculture had filed the application for revocation of plant variety protection certificate on June 11, 2019. The Authority took almost two and half years to make a decision. Shalini Bhutani in her article provides a background to the dispute and how India’s small holders need to be protected.
Concern Worldwide and Welthungerhilfe released the Global Hunger Index in October 2021 in which India was ranked at 101 out of 116. On 24th November the Government released the second instalment of National Family Health Survey-5. Several indicators of nutrition have shown only minor improvement since NFHS-4 conducted in 2015-16. Child stunting has declined from 38.4 (NFHS-4) to 35.5 (NFHS-5) and the percentage of underweight children also reported a 3.7 per cent drop. Yet the situation in several states continues to be a cause of concern. Shyma Jose and Kriti Khurana provide a perspective to the entire scenario of undernutrition and what is the way forward to address this challenge for an otherwise food secure India.
The reform of fertiliser subsidies has been on the agenda for several years. Economists have been arguing for direct benefit transfer of fertiliser subsidy to farmers on the basis of their land holdings. Jugal Kishore Mohapatra examines various dimensions of this important issue.
Post-harvest storage and availability of credit for farmers’ produce is a major challenge in many parts of India. Over the last two decades a new business has emerged in the form of Collateral Management Services whose services are taken by banks to secure their loans against stocks stored in warehouses. In the warehouses registered with Warehousing Development and Regulatory Authority (WDRA), it provides a guarantee for quality and quantity of stocks. Such warehouses can issue electronic negotiable warehousing receipt which is transferable electronically. But registration of warehouses
The Journal of Governance – January 2022 / 9
with the WDRA continues to be optional. The Warehousing (Development and Regulation) Act was enacted in 2007 but only about 2000 warehouses are registered with WDRA. Most financing against the stocks is in unregistered warehouses. Siraj Chaudhry provides a perspective on how pledge finance in such warehouses can be made more efficient.
Animal husbandry, dairy and fisheries sector is also as important to India’s economy and employment opportunities as agriculture and horticulture. But they receive less attention in our media. Atul Chaturvedi provides a perspective to the importance of the sector and the vision of the Government for attracting private investment in milk processing and allied sectors.
While announcing the decision of the Government to repeal the three farm laws (19th November 2021), it was also said that the Government will set up a committee of scientists, economists and representatives of farmers to advise the Government about making MSP more effective and transparent. It will also be mandated to suggest ways to promote zero budgeting based-agriculture. Though the precise terms of reference are not known, due to complexity of issues involved and diversity to situation across the agro-ecological zones and the states, we can expect that the Committee will take at least a year to submit its report. The terms of reference and the constitution of the expert committee is yet to be announced.
The National Commission on Farmers, chaired by Prof. M. S. Swaminathan, submitted five reports to the Government between December 2004 – October 2006. The Committee on Doubling Farmers’ Income headed by Mr. Ashok Dalwai submitted its report in 14 volumes. The final report was submitted in 2017. One of its important observations for increasing income of farmers was that there is a need to shift agricultural workforce to the non-farm sector. It is hoped that the expert committee will suggest a path for finding employment opportunities outside agriculture sector so that excess labour employed in agriculture can find gainful employment elsewhere.

10 / Editorial
In the last two years, there has been lot of polemics about the agriculture sector. Its regional and ecological complexity has been largely ignored and political preferences have clouded the judgement of even the well-informed.
It is hoped that this special issue of the Journal will prepare its readers to engage with the diversity and depth of sector in a more meaningful manner.
Siraj Hussain
The Journal of Governance – January 2022 / 11
AbstractMore than half of the income of an average Indian farmer (as
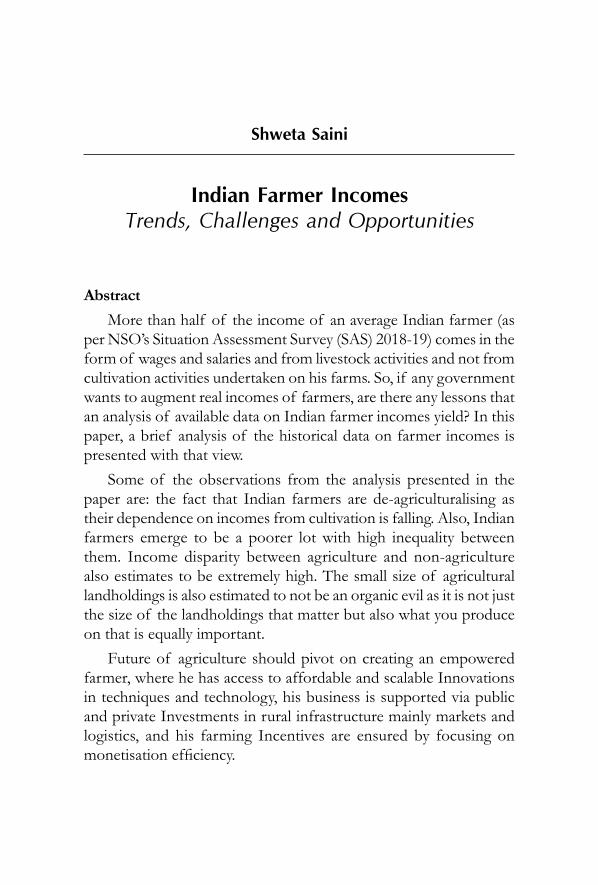
per NSO’s Situation Assessment Survey (SAS) 2018-19) comes in the form of wages and salaries and from livestock activities and not from cultivation activities undertaken on his farms. So, if any government wants to augment real incomes of farmers, are there any lessons that an analysis of available data on Indian farmer incomes yield? In this paper, a brief analysis of the historical data on farmer incomes is presented with that view.
Some of the observations from the analysis presented in the paper are: the fact that Indian farmers are de-agriculturalising as their dependence on incomes from cultivation is falling. Also, Indian farmers emerge to be a poorer lot with high inequality between them. Income disparity between agriculture and non-agriculture also estimates to be extremely high. The small size of agricultural landholdings is also estimated to not be an organic evil as it is not just the size of the landholdings that matter but also what you produce on that is equally important.
Future of agriculture should pivot on creating an empowered farmer, where he has access to affordable and scalable Innovations in techniques and technology, his business is supported via public and private Investments in rural infrastructure mainly markets and logistics, and his farming Incentives are ensured by focusing on monetisation efficiency.
Shweta Saini
indian Farmer incomesTrends, Challenges and Opportunities

12 / Indian Farmer Incomes — Trends, Challenges and Opportunities
IntroductionThere is abundant literature available today on Indian farmer
incomes that analyses available data and identifies ways to enhance them. Interestingly, before February 2015 when in a farmers’ rally in Bareilly, UP, Prime Minister Modi first declared his dream of doubling real farmer incomes by 2022-23, not much literature was available on the topic. Since India has historically been a country fighting and surviving famines, droughts and flood, stabilizing agricultural production has always been the policy priority with negligible focus on incomes. It is only in the recent years, particularly since the Green Revolution of late 1960s and early 1970s (followed by other commodity-specific revolutions) that India – that has always had to import food to meet its food needs – became self-sufficient in major agri-commodities (at least in cereals, dairy and selected horticulture). More recently, India catapulted its agricultural production to the extent that there are surpluses in the markets for several agri-commodities and the policy makers – those have historically focused on stabilizing production mostly handling situations of deficits – feel ill-equipped to handle a market with near-consistent surpluses. Today the policy makers are at a cusp where there is a growing need felt to reorient policies and programs which now require focus on identifying (i) methods of sustaining production and (ii) delivering remunerative prices to the farmers and thus the focus on farmer incomes.
As per Census 2011 of India, about 55 per cent of India’s workforce is employed in the agriculture sector (as per PLFS, this per cent is about 45.6 per cent for 2019-20) and within them, about 55 per cent are agricultural labourers. These labourers are landless (or have very small landholdings) and work on other’s farms in return of wages paid to them in cash or in kind. Among the ones who are landowners, most are small and marginal farmers (SMF) i.e., their average landholding size is below 2 hectares. As per Agriculture Census 2015-16, there are about 145.6 million agricultural landholdings in India and about 86 per cent of these are SMF. These SMF operate on about 47 per cent of the country’s 157 million hectares of operated area. And over the years, area available for agriculture has been falling and due to fragmentation of land, the land size has been shrinking. Between

The Journal of Governance – January 2022 / 13
1970-71 and 2015-16, the number of agricultural landholdings grew from 70.5 million to about 146 million, while in the same period, the total area under agriculture reduced from 162.2 million hectares to 157.1 million hectares. The net impact of the two can be seen on the average landholding size that reduced from about 2.3 hectares to about 1.1 hectares.
As cultivation incomes from such small farms would not be enough to sustain families, a farmer inevitably has to diversify his/her sources of income to include livestock activities like dairy, or he may support his household by additionally working as labourers on other farms, or operate small business like a barber shop, for example.
This paper studies data on farmer incomes in detail. The focus will primarily be on:
1. The level of farmer incomes at the national and state level; and
2. The structure of farmer incomes and trends over time.The paper is divided into four Sections. In Section 1, an analysis
of farmer incomes is presented, and key trends are highlighted. In Section 2, some new insights from analysis of data on farmer incomes are presented. In Section 3, key insights are synthesized. Section 4 presents a way forward.
Section 1: Trends and Composition of Farmers’ IncomesAs of today, data on Indian farmer incomes are available as
survey-based estimates. There is no continuous time-series data and estimates are available for four years- 2002-03, 2012-13, 2015-16 and 2018-19. The 2002-03, 2012-13 and 2018-19 estimates are from surveys done by National Sample Survey Organisation (NSSO) (or National Sample Survey (NSS)) and the 2015-16 estimates are from NABARD’s All-India Rural Financial Inclusion Survey (NAFIS). All of these surveys have large sample sizes ranging from 35,000 to 51,000 farmer households. Overtime, the survey methodology has evolved. There is a particular difference in the NSSO and NABARD survey methodology, particularly in their definition of a ‘farmer’ and

14 / Indian Farmer Incomes — Trends, Challenges and Opportunities
the survey coverage 1, making the estimates of farmer incomes from the two sources not strictly comparable. Therefore, most analysis presented in this paper is based on the NSSO survey reports.
Largely there are four big sources of incomes for an average Indian farmer household: (i) incomes they earn from crops and cultivation; (ii) incomes from livestock activities; (iii) incomes earned in the form of wages and salaries; and (iv) incomes from non-farm activities. In the following sections, an analysis of the farmer income data is presented. Intuitively, farmers with larger landholding sizes will make greater income from cultivation activities, and those with smaller sizes will have greater dependence on the other three sources, and (2) states with larger landholding sizes will make more incomes compared to ones with smaller landholding sizes. We check these and more below.
Levels and Trends in Farmer IncomesAt the four points in times mentioned above, the monthly average
farmer incomes grew from Rs. 2,115 per month (2002-03) to Rs.6,427 (2012-13) to Rs. 8,931 (2015-16) and then to Rs. 10,084 in 2018-19 (Figure 1 ). In the 16 years (between 2002/03 and 2018/19), farmer incomes grew at a compound annual growth rate (CAGR) of 10.3 per cent. Figure 1 Level of Farmer Incomes
Source: NSSO (2002-03, 2012-13, 2018-19), NAFIS 2015-16 and Labour Bureau. Note: The farmer income estimate for 2018-19 does not include “income from leasing of land” in this figure.
1 There are two big differences: (i) They define “rural” differently. While NABARD studies Tier 3 (population between 20,000 and 50,000), Tier 4 (10,000 to 20,000), Tier 5 (5,000 to 10,000) and Tier 6 (less than 5000) areas, NSSO only considers Tier 6 areas; and (ii) NAFIS studies HHs who earned at least Rs.5,000 from agriculture and allied activities in the year and this threshold under NSSO 2018-19 it is Rs. 4,000
The Journal of Governance – January 2022 / 15
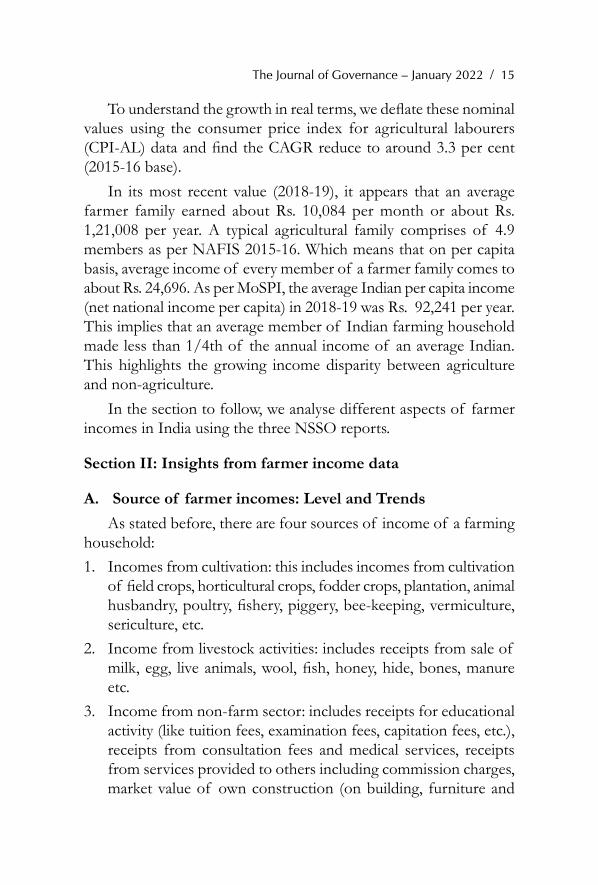
To understand the growth in real terms, we deflate these nominal values using the consumer price index for agricultural labourers (CPI-AL) data and find the CAGR reduce to around 3.3 per cent (2015-16 base).
In its most recent value (2018-19), it appears that an average farmer family earned about Rs. 10,084 per month or about Rs. 1,21,008 per year. A typical agricultural family comprises of 4.9 members as per NAFIS 2015-16. Which means that on per capita basis, average income of every member of a farmer family comes to about Rs. 24,696. As per MoSPI, the average Indian per capita income (net national income per capita) in 2018-19 was Rs. 92,241 per year. This implies that an average member of Indian farming household made less than 1/4th of the annual income of an average Indian. This highlights the growing income disparity between agriculture and non-agriculture.
In the section to follow, we analyse different aspects of farmer incomes in India using the three NSSO reports.
Section II: Insights from farmer income data
A. Source of farmer incomes: Level and TrendsAs stated before, there are four sources of income of a farming
household:1. Incomes from cultivation: this includes incomes from cultivation
of field crops, horticultural crops, fodder crops, plantation, animal husbandry, poultry, fishery, piggery, bee-keeping, vermiculture, sericulture, etc.
2. Income from livestock activities: includes receipts from sale of milk, egg, live animals, wool, fish, honey, hide, bones, manure etc.
3. Income from non-farm sector: includes receipts for educational activity (like tuition fees, examination fees, capitation fees, etc.), receipts from consultation fees and medical services, receipts from services provided to others including commission charges, market value of own construction (on building, furniture and

16 / Indian Farmer Incomes — Trends, Challenges and Opportunities
fixtures, etc.), among others; and4. Wages and salaries- incomes earned by members from working
in other’s farm or in other enterprises.We plot the various sources of incomes and how their contribution
has changed over time in Figure 2. Both nominal and real incomes are presented.
It appears that in 2018-19, a. An average farmer earned about Rs. 3,798 per month from
cultivation activities. This was about Rs. 45,576 per year. In real terms, this was little lower than Rs. 3,500 per month translating to a little lower than Rs. 42,000 per annum;
b. The most important source of income was wages and salaries and an average agricultural household (AHH) earned about Rs. 40,63 per month, i.e., about Rs. 48,756 per year. In real terms, this translates to about monthly Rs. 3,740 and annually about Rs. 44,882;
c. Incomes from livestock activities were little less than Rs.1,600 per month. They were about 16 per cent of the monthly income of AHH. Annually, they earned about Rs. 18,984 from livestock;
Figure 2 Composition of farmer incomes: nominal (INR/month), real (INR/month) and per cent share in total (%)
Source: NSSO (2002-03, 2012-13, 2018-19) and Labour Bureau
d. Non-farm incomes had the lowest contribution. About 6 per cent of monthly income, i.e., about Rs. 641 came from non-farm sector;

The Journal of Governance – January 2022 / 17
Overtime,a. Contribution of cultivation has been falling (from 46 per cent
in 2002-03 to 38 per cent in 2018-19) and that of wages and salaries has been rising, albeit marginally (from 39 per cent in 2002-03 to 40 per cent in 2018-19); and
b. Sharpest increase in incomes has come from livestock activities, whose contribution increased from 4 per cent in 2002-03 to 16 per cent in 2018-19;
c. In real terms, incomes from cultivation and non-farm sector have fallen. From Rs. 3,769 per month in 2012-13, the real incomes from cultivation fell to Rs. 3,496 per month. In case of the non-farm sector, real incomes in 2018-19 have fallen below their 2002-03 level too.
It appears, that Indian farmers are increasingly less dependent on cultivation activities to support their households.
B. Trends in Growth Rates of Farmer IncomesIn nominal terms, incomes from all sources have risen fast. But
incomes from livestock have grown the fastest across years and that from non-farm sector, the slowest. In real terms, as also shown in Figure 2, compound annual growth rate (CAGR) is negative for cultivation and non-farm incomes ( Figure 3). Even under real terms, livestock incomes grew the fastest. Figure 3 Growth rates of farmer incomes (% CAGR)
Source: NSSO (2002-03, 2012-13, 2018-19) and Labour Bureau. Note: CAGR is compound annual growth rate.
18 / Indian Farmer Incomes — Trends, Challenges and Opportunities
If one divided the period between 2002-03 and 2018-19 under three heads: (i) between 2002-03 and 2012-13 (grey line in Figure 3), (ii) between 2012-13 and 2018-19 (orange line in Figure 3); and (iii) overall period of 2002-03 to 2018-19, then we get three interesting results:I. Income growth rates decelerated for cultivation, non-farm sector
and livestock activities - CAGR was lower for all three activities in the period between 2012-13 and 2018-19 (orange line in Figure 3) than it was in the 10-year period between 2002-03 and 2012-13 (grey line in Figure 3);
II. Growth rate in (nominal) wages and salaries was higher in the recent period of 2012-13 and 2018-19 compared to what it was in the period between 2002-03 and 2012-13;
III. In overall income terms too, farmer incomes grew much faster in years between 2002-03 and 2012-13 than they did in subsequent 6 years, between 2012-13 and 2018-19.
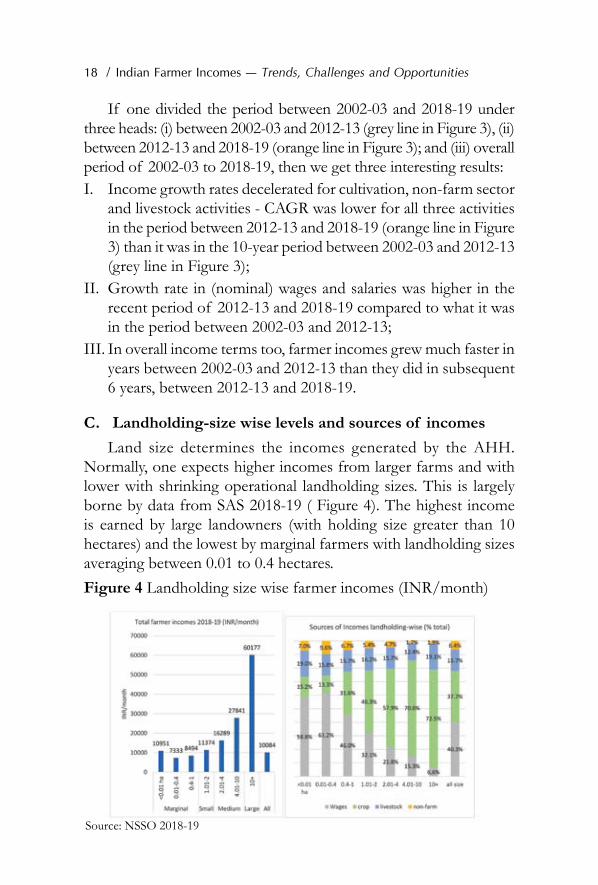
C. Landholding-size wise levels and sources of incomesLand size determines the incomes generated by the AHH.
Normally, one expects higher incomes from larger farms and with lower with shrinking operational landholding sizes. This is largely borne by data from SAS 2018-19 ( Figure 4). The highest income is earned by large landowners (with holding size greater than 10 hectares) and the lowest by marginal farmers with landholding sizes averaging between 0.01 to 0.4 hectares. Figure 4 Landholding size wise farmer incomes (INR/month)
Source: NSSO 2018-19

The Journal of Governance – January 2022 / 19
Interestingly, within the marginal farmer category (i.e., ones operating on less than 1 hectare of land), the landowners with the smallest landholding sizes (less than 0.01 hectares) earned the most. Among all landholding sizes, the highest incomes from wages and salaries were earned by these near-landless category of AHH. Among the small and marginal (SMF) categories, these lowest landholding AHH earned the highest incomes from livestock too. It is a surprise how other SMFs fail to earn as much from livestock.
D. State-wise average farmer incomes in 2018-19National averages hide the underneath variations between states.
A look at the state-wise data on farmer incomes, we find that there is a huge variation in incomes between states and in the pattern in data within states ( Figure 5). Figure 5 Farmers’ Average Monthly Incomes in major Indian states:
2018-19 (INR/month)
Source: Created using QGIS with data from NSSO 2018-19
Of the 30 states for which the farmer income data is available, monthly incomes in 10 states (Tripura, Nagaland, Chhattisgarh, Telangana, UP, MP, Bihar, WB, Odisha and Jharkhand) are lower than Rs. 10,000.

20 / Indian Farmer Incomes — Trends, Challenges and Opportunities
In Figure 5, the darker the green color gets, higher is the average level of income. In states with pale green color, farmers earn very low levels of incomes. Sadly, all pale green colors have a geographic proximity in the eastern side of India. States of Jharkhand, Odisha, West Bengal, Bihar and UP recorded the lowest farmer incomes. In fact, the sum total of incomes earned by farmers in the four states of Jharkhand, Odisha, WB and Bihar is lower than income of a Meghalaya or a Punjab farmer. As per Census 2011, states colored in pale green are home to about 46 per cent of Indian agricultural workforce.
E. State-wise sources of incomesAmong the four sources of income, cultivation was the most
significance source of income in Meghalaya where the farmers earned about 72 per cent of their monthly incomes from crops. Out of the Rs. 29,242 total household incomes, a Meghalaya farmer made about Rs. 21,060 from crop cultivation alone. In case of Punjab, about 52 per cent of monthly farmer incomes came from cultivation, (they earned about Rs. 12,597 from cultivation out of the total of Rs. 24,049). Overall, cultivation dependence of monthly incomes was greater than 50 per cent only in the case of five states (Meghalaya, Telangana, Punjab, MP and Karnataka) of the 30 for which the income data is given under SAS 2018-19. In eight states (WB, Jharkhand, TN, HP, Kerala, Nagaland and J&K), dependence on incomes from cultivation was lower than 25 per cent (Figure 6).
Contribution of wages and salaries (in total monthly incomes) ranged between 15 per cent (Arunachal Pradesh) and 65 per cent (J&K). 10 Indian states/UTs (J&K, Kerala, Jharkhand, WB, TN, HP, Assam, Odisha, Sikkim and Tripura) depended on wages and salaries for more than 50 per cent of their monthly incomes.
Largest contribution of livestock incomes was seen in the case of Nagaland and Gujarat where 38 per cent and 28 per cent, respectively, of the monthly incomes came from livestock activities. Livestock incomes in Punjab (Rs. 4,457) and Haryana (Rs.4,020) were higher than Gujarat (Rs.3,477).

The Journal of Governance – January 2022 / 21
Figure 6 State-wise source-wise level of farmer incomes (INR/month)
Source: NSSO 2018-19
If one added contributions of incomes from cultivation and livestock (representing agricultural activities), then for 12 of 30 states this share was still below half. These 12 states are: Rajasthan, Andhra, Sikkim, Assam, Jharkhand, TN, Tripura, Odisha, HP, WB, Kerala and J&K.
F. Farmer Income growth rates decelerated between 2012-13/ 2018-19
As shown in Figure 3 for country average, it appears, in most Indian states the CAGR slowed between the two surveys in 2012-13 and 2018-19 (Figure 7). The exception includes Uttarakhand, Bihar, West Bengal and Assam who registered a much higher growth rate between 2012-13 and 2018-19 than between 2002-03 and 2012-13.

22 / Indian Farmer Incomes — Trends, Challenges and Opportunities
Figure 7 Growth rates of nominal farmer incomes (%)
Source: MOSPI.
Farmers’ income in Odisha and Jharkhand had grown exceptionally fast between 2002-03 and 2012-13, but post 2012-13, they have registered the slowest growth (Figure 7). Incomes in Punjab and Madhya Pradesh, despite a high procurement of food grains at minimum support price (MSP) have registered a slower growth rate between 2012-13 and 2018-19. Chhattisgarh has however been able to maintain double-digit growth rates in both the periods.
In terms of sources of income, Bihar saw exceptional double-digit growth rates (between 2012-13 and 2018-19) in all three income sources: livestock activities (36 per cent CAGR), non-farm activities (12.2 per cent CAGR) and wages and salaries (11.2 per cent CAGR). Its income from cultivation also grew by about 8 per cent. In case of Odisha on the other hand, income from livestock activities, which grew the fastest (55 per cent CAGR) between 2002-03 (Rs.16) and 2012-13 (Rs.1314), fell by about 17.4 per cent CAGR between 2012-13 (Rs.1314) and 2018-19 (Rs.416). In fact, Odisha’s income from non-farm sources also contracted in the latter period. Its income from cultivation though grew marginally (at 1.8 per cent CAGR) in this period. The story of Jharkhand is similar, except that its income from cultivation too fell in the latter period.
G. Estimating incomes earned on a per hectare basisTo estimate per hectare incomes earned by Indian agricultural
households, we need two data points: an estimate of the total income

The Journal of Governance – January 2022 / 23
earned from cultivation activities and the size of the landholding on which that cultivation was undertaken. By dividing the two, we can get an assessment of the average income earned by the farming household on its every hectare (or acre). The data on farmer incomes is straight forward and can be easily taken from the recent most NSSO data. However, the data on average landholding size of agricultural households (AHHs) is a bit controversial and requires a deeper thought.
The SAS 2019 report gives us an estimate of both the incomes earned by the agricultural households and the size of their average landholdings. Logically, if we take data on incomes from this report, we should also take data on landholding size from it. But there is a problem in this case. And the problem is in data when we compare the landholding size data between SAS 2019 and the latest Agricultural Census (2015-16) (Figure 8).Figure 8 State-wise average size of operational landholdings of
AHHs (hectare)Source: SAS 2019 and Agriculture Census (AC) 2015-16
For all-India level, the average size of land holding is similar between the two sources, about 1 to 1.1 hectares. However, at the state-level, the difference is stark. One may argue that the difference may accrue due to the difference in the years of assessment (AC gives an assessment for year 2015-16 and SAS 2019 gives it for 2018-19). And yes, that does hold virtue. However, in case of some states like Punjab, the average holding size has gone down by about 60 per cent

24 / Indian Farmer Incomes — Trends, Challenges and Opportunities
(from 3.6 hectares in 2015-16 to about 1.5 hectares in 2018-19). In case of states like Bihar, Kerala, and Maharashtra, the average holding sizes appears to have grown.
The Agriculture Census (AC) is conducted every five years by GOI’s Ministry of Agriculture. It is an exhaustive exercise where most, if not all, agricultural operational holdings of the country are completely enumerated. NSSO’s SAS on the other hand is a sample survey with a much smaller sample size (about 45,714 agri-HHs were surveyed in 2018-19). It appears that AC is more representative and thus a more credible measure of the metric on landholding sizes.
Per hectare incomes from cultivationCombining the AC data on average landholding sizes with the
farmer income data from SAS 2019, we find (Figure 9) that at all-India level, an average AHH earned about Rs. 3,517 per month per hectare (income earned from cultivation was about Rs. 3,798 per month and the average landholding size was about 1.08 hectares).Figure 9 Per hectare income from cultivation (INR/month)
Source: SAS 2012-13, SAS 2018-19, AC 2010-11, AC 2015-16
On a per hectare basis, it appears that the Kerala farmer earns the highest at Rs. 20,211/month. Following him closely is the surprise booming state of Meghalaya where the farmers make about Rs. 16,326/month/hectare. Bihar, with an exceptionally low landholding size, appears to be making more money per hectare than many of the high performing agricultural states of Haryana, Punjab, Gujarat, and MP. States like Punjab, Gujarat, Himachal fare much below India average too.
The Journal of Governance – January 2022 / 25
Using farmer income data from the previous SAS (that gives an assessment for year 2012-13), and combining it with landholding size data from the earlier AC (2010-11) (we used earlier AC instead of the AC 2015-16 because of its proximity to assessment year 2012-13), we estimated per hectare incomes for year 2012-13 too (given in blue bars in Figure 9).
Comparing the estimates at two time points, we find that the per hectare income in Meghalaya has grown the fastest (CAGR 23 per cent), followed by West Bengal (CAGR 8.2 per cent), and Bihar (CAGR 8.1 per cent). In some states like Himachal, J&K, Assam, and Jharkhand, the per hectare incomes appear to have fallen in the six years.
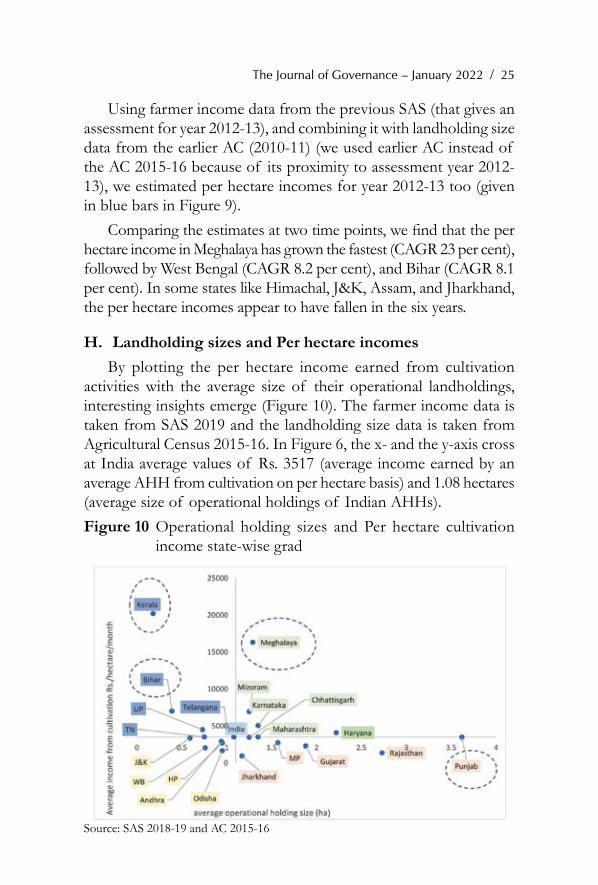
H. Landholding sizes and Per hectare incomesBy plotting the per hectare income earned from cultivation
activities with the average size of their operational landholdings, interesting insights emerge (Figure 10). The farmer income data is taken from SAS 2019 and the landholding size data is taken from Agricultural Census 2015-16. In Figure 6, the x- and the y-axis cross at India average values of Rs. 3517 (average income earned by an average AHH from cultivation on per hectare basis) and 1.08 hectares (average size of operational holdings of Indian AHHs).Figure 10 Operational holding sizes and Per hectare cultivation
income state-wise grad
Source: SAS 2018-19 and AC 2015-16

26 / Indian Farmer Incomes — Trends, Challenges and Opportunities
With India average values as the center, the Indian states can be seen to be divided into four quadrants:1. Green colored states: Compared to all India average, these states
had higher per hectare incomes and larger landholding sizes. These states include: Mizoram, Karnataka, Haryana, Maharashtra and Chhattisgarh;
2. Red colored states: This set of states earned lower incomes per hectare than India’s average, despite having a larger landholding size. These states were: Jharkhand, Madhya Pradesh, Gujarat, and Rajasthan 2. Punjab is at the borderline between green and red set of states, but as the income value is marginally lower than India-average, it has been counted in the red zone;
3. Yellow colored states: With smaller landholdings and lower per hectare incomes, these states are relatively under performers compared to India average. The states in this zone include: Jammu and Kashmir, West Bengal, Odisha, Himachal Pradesh and Andhra Pradesh;
4. Blue-colored states: Despite smaller landholding sizes, these states made more money than India average on its every hectare. These may be counted as outperformers. These states included: Kerala, Bihar, Uttar Pradesh, Tamil Nadu, and Telangana.
Section III: Learnings Some insights that follow from these state-level growth patterns
are: • Agricultural households are de-agriculturalising. In other
words, with falling dependence on incomes from cultivation, agricultural families are moving away from agriculture;
• Farmer income growth rates fell in six years between 2012-13 and 2018-19 compared to the 10-year period between 2002-03 and 2012-13;
2 It is, however, important to note that the higher landholding sizes in Rajasthan, MP and Gujarat may not necessarily be all cultivable and the actual tillable area may be a proportion of the recorded landholding. In absence of that data, we use this for our analysis.
The Journal of Governance – January 2022 / 27
• Farmers in India are poor with exceptionally low levels of incomes. Besides, we need to remember that the data analysed are state averages, many districts and blocks are likely to be earning much below the given state level too;
• There is high income disparity between agriculture and non-agriculture where an average member of Indian farming household made less than 1/4th of the annual income of an average Indian;
• There is geographic concentration of poor Indian farmers. Most of them are eastern states;
• Agricultural states vary in their economic progress. Some are much ahead of others. For example, the sum total of incomes earned by farmers in the four states of Jharkhand, Odisha, WB and Bihar is lower than income of a Meghalaya or a Punjab farmer;
• Small is not always bad as states like Kerala, with a very small landholding size generates much higher incomes than states with larger landholding sizes like Rajasthan, MP, etc.;
• Generating higher incomes is not equal to being more efficient. In terms of per hectare incomes, while Punjab’s average farmer earns much higher overall incomes, the Bihar farmers are able to generate a much higher level of incomes on its every hectare;
• In six years between 2012-13 and 2018-19, real incomes from cultivation fell;
• In these six years, the non-farm sector also could not support the farmer households, as those incomes too fell in real terms;
• The near-landless farmer (the smallest within the SMF category) is earning much more than the others within the SMF category.
Dilemma and Way ForwardThere is a stark policy dilemma that overwhelms the Indian
agricultural sector. Farmers, like in any other business, want higher

28 / Indian Farmer Incomes — Trends, Challenges and Opportunities
prices for their produce, and governments, on the other hand, walk a thin line of ensuring remunerative prices for farmers on one side and affordability of food for consumers on the other. More often than not, the governments prioritize consumers over farmers, which is reflected in the long history of farmer taxation and consumer bias in policies (OECD/ICRIER 2018). To rectify the bias, successive governments have announced higher minimum support prices (MSPs) and income support schemes like the PM - Kisan. They even announce to correct the consumer bias in policies by assuring stability of trade policies, for example. But despite a plethora of central and state government schemes, something is not working well as data on farmer incomes is testimony to the dire state an average Indian farmer is in. Particularly, the fact that incomes from cultivation have fallen in real terms is perplexing.
Each Indian state is different: in their factor endowment, climate vulnerability, consumption requirements, and, state of rural infrastructure, for example. How can one policy design address problems in all? Agriculture is rightly a state subject, and states have to act to support their farmers sooner.
We saw in the analysis that close to half of the Indian agricultural workforce lived in states with the lowest farmer incomes. These states have to be focused and prioritized. Investments in irrigation, roads, and quality power, will go a long way in empowering these farmers.
Individual farmer is too small in India and therefore the role of aggregating farmers rather than just production becomes important. In this regard, Farmer Producer Organisations (FPOs) or Farmer Producer Companies (FPCs) should be harnessed more effectively. The problem is that FPOs have been set up in several states but they have not yet risen to their full potential. There is a need to provide operational guidance and administrative and financial support to them to hand hold them to the various potential benefits they could realize from these aggregation efforts.
Governments have to find a mechanism to provide ‘monetisation efficiency’ to farmers. Borrowing the concept from the Dalwai Committee Report (DCR 2018) who defines it as “the ability of the system to enable the farmer to capture and accrue the best possible

The Journal of Governance – January 2022 / 29
value out of all that is produced, supported by both marketing and non-marketing sub-systems that operate at different stages of the integrated value chain.”, markets have to reach farmers. Besides the farmers should also be able to produce enough surpluses in a sustained manner to feed these markets. For that, access to quality inputs, updated research and techniques should be made available to farmers at right times at affordable prices. The technology could be in seeds, techniques of production, post-harvest management, logistics or even processing. Access to technology become even more critical in current times when the climate change challenges have made production volatile and farming risky. On the marketing side, policy support is required to create: (i) transparent and thriving marketing infrastructure that provides drying and affordable mandi-level storages; (ii) farm-level or FPO-level storages for the crops so that a farmer does not have to resort to distress sale upon harvest of his crop; (ii) stable trade policies where Governments retain an open trade policy so that farmers can gain from higher prices globally; and inter alia, (iii) a robust and thriving processing industry that can act as a shock-absorber in the system (real supply-absorber).
Increased value-addition at the farm level will also help augment farmer incomes. Farmers should be skilled to upgrade the services offered by them. By merely sorting, assaying and grading the produce, farmers can bring greater financial gains.
GoI should create a map of resource endowments in the Indian states which should give the current situation and an assessment for future years. Resources are scarce and cannot be taken for granted and therefore efficiency in production activities is critical and a focus point.
Centrality of farmer and farming will continue in India and it is about time we treated farming as a business activity and worked to empower a farmer as an entrepreneur.
ReferencesAgriculture Census (AC). (2011-12). All India Report on Number and Area of
Operational Holdings. Department of Agriculture, Co-Operation & Farmers Welfare Ministry of Agriculture & Farmers Welfare, Government of India.

30 / Indian Farmer Incomes — Trends, Challenges and Opportunities
Agriculture Census (AC). (2015-16). All India Report on Number and Area of Operational Holdings. Retrieved May 2019, from Agricultural Census: http://agcensus.nic.in/document/agcen1516/T1_ac_2015_16.pdf
DCR (2018). Dalwai Committee Report. Comprehensive Policy Recommendations. Volume 14. Ministry of Agriculture and Farmers Welfare, GOI
Labour Bureau (2016). Report on Fifth Annual Employment-Unemployment Survey 2015-16 Volume I. Ministry of Labour and Employment, Government of India. Chandigarh: Labour Bureau.
NAFIS/NABARD. (2018). NABARD All India Rural Financial Inclusion Survey (NAFIS) 2016-17. Mumbai: National Bank for Agriculture and Rural Development.
NSSO/ Government of India. 2005. "Some Aspects of Farming: NSS 59th Round (January–December 2003) Report No. 496(59/33/5)." National Sample Survey Organisation, Ministry of Statistics and Programme Implementation: New Delhi
NSSO-SAS/Government of India, 2014. “Key Indicators of Situation of Agricultural Households in India”. Ministry of Statistics and Programme Implementation. National Sample Survey Office.
NSS-SAS/Government of India. Report 587: Situation Assessment of Agricultural Households and Land and Livestock Holdings of Households in Rural India, 2019
OECD/ICRIER (2018), Agricultural Policies in India, OECD Food and Agricultural Reviews, OECD Publishing, Paris. Link:
https://www.oecd.org/officialdocuments/publicdisplaydocumentpdf/?cote=TAD/CA(2018)4/FINAL&docLanguage=En
*****

The Journal of Governance – January 2022 / 31
Dr S. S. Johl, the renowned Indian agriculture economist, presented two reports on the need for crop diversification in
Punjab in 1986 and 2002. After over three decades, overflowing cereal granaries & large budget deficits have finally compelled a serious policy rethink at the level of the Central Government on the open-ended public procurement system limited to two staple crops, paddy & wheat. Even as India habitually celebrates its “self-sufficiency” in food amidst continued massive malnutrition, the administrative failure to act on diversification of cropping systems is worrisome.
Wheat and paddy were the favored green revolution crops because with assured irrigation the yields are less prone to weather risks, can be cheaply stored for long periods of time, and are thus more suitable for food security purposes. Punjab provided the ideal conditions to grow these crops and was chosen as the green revolution state. For that moment, it was the right decision. But that moment passed in the last century. When India became independent, Punjab had a diversified agriculture landscape but it focused on specialization for over past five decades. Paddy in Punjab is the legacy of Central Government directives, policies and incentives to meet India’s food security during its most difficult decades.
Unarguably, a critical need for crop diversification is to address the depleting groundwater, arising out of continued paddy cultivation. Paddy-wheat monoculture has exacerbated the problem and is damaging farmland biodiversity. Loss of biodiversity at crop & at variety levels has emerged as a massive challenge with severe connotations, but the challenge is less understood and hardly acknowledged as an existential crisis, which it is. As per a report by Chatham House, in the process,
ajay Vir Jakhar
Complexity of Crop Diversification in Punjab

32 / Complexity of Crop Diversification in Punjab
since 1970, the population size of mammals, birds, amphibians and reptiles has declined by an estimated average of 68 per cent. With such alarming loss of biodiversity, the circle of life itself is slowly grinding to a halt. In essence, crop diversification is to be supplemented by the introduction of varietal biodiversity in each crop. The collateral damages of monoculture cropping of wheat and paddy cannot be underestimated because of its widespread impact.
There is a direct correlation between areas of monoculture cropping of paddy-wheat cycle and farmer suicides. The man-days of work created by the paddy-wheat cycle are possibly 130 days a year or less. Spending days without work in a state of unemployed “worklessness” leads to depression that is rampant in such communities. Creating diversity of rural occupation is just as important as creating off-farm jobs to reduce the stress on the land. It is critical to address the suicide rates and it can be achieved by shifting away from the dual cropping patterns of paddy and wheat. The lack of vision and foresight through the past decades has led Punjab to focus away from developing the service sector and laying emphasis to human resources. Consequently, it is resulting in mass migration of youngsters across villages desperate to escape the ground realities in Punjab, draining precious savings which families use to set up their children on foreign lands. This is even reflected in a study by Prof. Devesh Kapur on the diaspora in North America, where Punjabi speaking migrants are among those having the least incomes among all migrants in North America.
There is also the link between diversification and the vexed issue of crop burning. All measures whether ex-situ or in-situ will not account for much, if Punjab does not manage to achieve a reduction in paddy output. An agriculturally rich state like Punjab has ironically become a net importer of fruits and vegetables, the cultivation of which can provide round the year work, help the soil rejuvenate, save water and will improve diets by reducing the dependence of the rural population on markets for nutrition.
The majority of Indian policymakers and experts wallow in the satisfaction that India is food secure. This misperception crops up only because the majority of the people cannot afford nutritious meals. India has slipped to the 101st position in the Global Hunger Index 2021 of
The Journal of Governance – January 2022 / 33
116 countries, behind its neighbors Pakistan, Bangladesh and Nepal. It is also perfectly natural for consumption patterns to change as the economy grows, with people able to afford and demand more nutritious and diverse foods. Is India in a position to meet such expectations of its citizens? The answer is in the negative and the situation is made worse by climate change. Even as demand of diversified food increases, climate change will adversely impact food production targets, leading to spikes and shortfalls on a regular basis.
Farmers have been experiencing the subtle consistent shift in weather patterns for a few decades and this is now visible even to the academics as climate change. Travelling across India, one witnesses that the depleting ground water table is even making the availability of drinking water a challenge in tens of thousands of villages. This is precisely what should warn the policymakers of the precarious times ahead and for ameliorative methods to attain a higher level of nutrition security. In light of these challenges; Punjab is uniquely endowed with natural resources and is the key to helping attain India’s nutrition security.
The question may well be asked if crop diversification is so important, why has the state failed so miserably for decades. The answer is simple enough: irrespective of the noise, the Central Government has always been wary of diversifying cultivation from paddy and wheat in Punjab. Its priorities constantly get altered by international commodity prices and occasional droughts across the land. One major drought and the diversification conversation and agenda stalls for a decade as it did around 2008. Governments tend to be reactive; they are perpetually in a crises-solving mode and do not plan forward to obviate such crises. That is why, diversification has over time, remained only a clichéd word in speeches and presentations but has never been backed by a serious planned campaign.
Assured procurement of paddy and wheat at good prices from village market yards coupled with prompt payment by procurement agencies has created the scourge of the dual cropping system of wheat and paddy in Punjab. This situation is unique to Punjab in India and does not obtain anywhere else in the world. It is impossible to replace or replicate it for other cropping systems. The public procurement leads

34 / Complexity of Crop Diversification in Punjab
to an annual cash infusion of about Rs. 60,000 crores into Punjab’s economy. Punjab is a financially-strapped state since the decade of terrorism and in no position to offset the inflow and revenue to the state; it has therefore opted to maintain the status quo. However, problems began to foment, when leaders in Punjab forced a division of the state on linguistic lines. Punjab not only lost clout to influence Central Government policies but also became financially handicapped.
Globally, most trade across the world takes place with neighboring nations. This is evident from the north and central American experience or from the EU in Europe. In Punjab’s case, specifically, being far away from seaports, it is at a bigger disadvantage. Landlocked, with Pakistan as a neighbor, trade is stifled and it not only leads to loss of agriculture export opportunities but also occupation diversification from off-farm jobs. In the process, Punjab has lost export markets of Afghanistan and Pakistan, its traditional trading partners. It is also denied access to Central Asian markets that are closer to Punjab than Mumbai or Bangalore.
The third area of concern is research and development. The Punjab Agriculture University has an important role to play, but is not meeting expectations. It needs to be supported financially to deliver to its potential while instituting accountability and review mechanisms to measure outcomes. It not only suffers from inbreeding; it barely has money to pay salaries. Therefore, it is unable to attract the best talent. In a state where it makes political sense to regularize tens of thousands of contractual workers, ridiculously since 2015, assistant professors holding Ph. D. degree are recruited at the PAU at a basic salary of Rs 15,600 per month. I grow citrus, a diversification crop and can say with surety, that 99% of the area under citrus in Punjab is still of citrus varieties that were imported into India three generations ago. Generally, the agriculture research system has failed diversification. Further, funding of social-economic research is equally important to identify issues, develop an understanding of the gravity of the situation and subsequently finding ways to address the problems in time. Even research institutions in Punjab have stagnated to the point that, when the Punjab State Famers Commission commissioned a study of families of farmers suicide victims, many eminent researchers publicly questioned the rationale of

The Journal of Governance – January 2022 / 35
contracting the study to an institution outside the state. Many appallingly refused to cooperate. Such despondency and desperation can come from lack of resources for researches in the state.
Long ago, the late Dr G. S. Kalkat, former chairman of the Punjab State Farmers’ Commission, had reached a conclusion that small and marginal farmers will not adopt new crops to replace wheat and paddy unless they are assured of marketing of their produce. Without doubt, farmers do not produce on a whim but base their choice of crops on market demand and government policies. Public commentators and newspaper columnists have now suggested that a legal MSP will lead to diversification. To my mind, it may well have the opposite effect—probably a greater firming up of the paddy cultivation monoculture. First, replacement crops such as maize, groundnut, moong, cotton, bajra, arhar, soybean, sesame, guar and some such just do not yield comparative profits. Second, profit is not the only reason for farmers to choose to grow a particular crop. Weather-induced production risk and price risk are other factors that make paddy a favorable crop vis a vis growing alternate crops.
Governance issues are always critical but which, under the existing power structures, remain a daunting challenge for Punjab to resolve. In the draft Punjab State Farmers policy, the first chapter was on governance and some academics wrote newspaper opinions criticizing that governance issues had no place in a farmer’s policy. I am more convinced than before and it is obvious to the discerning Punjab farmer that this is the biggest challenge facing Punjab as it struggles to transform itself from a sinking, debt-ridden state to one of its past glory and eminence. Consider a simple example: bringing an end to the regimen of spurious milk sales can improve farmgate milk prices by Rs. 3 a litre, which can have a positive ripple effect for farmers, improve human health parameters and crop diversification. But there is no administrative receptivity for even such simple essentials. Also. Markfed, a state-controlled cooperative, was originally mandated to market farmers produce but over time got into the business of grain procurement for Food Corporation of India, where easy money can be made and inefficiencies can be passed on to the Central Government. The main challenge is not production but the marketing of farmers’

36 / Complexity of Crop Diversification in Punjab
produce. Supporting diversified production requires creation of regulated space for the private sector to operate in, helping farmer producer organisations become aggregators and simultaneously dismantling trader monopolies in APMC market yards. Lack of competitively functioning markets and private players will demotivate farmers from venturing into risky crops and compel farmers to stick to less risky cereals instead.
Take the case of Punjab dairy sector’s great appetite for maize. Maize, a diversification crop is predominantly consumed as a cattle feed and in Bihar sells at half the value of the MSP, and its arrival in Punjab subdues its farmgate prices. Central Government policies to promote food processing industry have failed because the policymakers sit and design policies with a clique of industry representatives and foreign consultancy firms. To continue with the citrus as an example: a major diversification crop in Punjab, only a small fraction of the citrus juice sold in India is sourced from within the country. It is either imported or just reconstituted in food parks, subsidized by the Government of India, driving down farmgate prices for Indian farmers. This is indicative of the fact that policies that are supposed to help diversification can turn detrimental for farmers, when designed by a clique of industry representatives and foreign consultancy firms. The failure hampers diversification.
A diversification that leads to sustainability of the environment and incomes is not easy but can be attempted if there is financial incentivisation and political will to reframe polices. Specifically for Punjab a successful diversification plan demands a certain amount of out of the box thinking and bureaucracies are rarely entrepreneurial. There were even no takers for the idea of imposing a minimum procurement price of milk only for the institutional sector buyers in Punjab. Like the MGNREGA, which created a floor price for labour wages in villages, this too can create a floor price for milk to improve farmer incomes. Punjab refuses to learn from success and failures elsewhere of states trying to improve livelihoods. There is the shining example of Amul, so successful because the state of Gujarat supports it not only financially but also by discouraging procurement of milk by competitors in Gujarat, allowing it to have monopoly on milk procurement. The future is great

The Journal of Governance – January 2022 / 37
and is limited only by the establishment’s intent and imagination. Indeed, there are a host of measures that can be planned and implemented, just as there are measures that are implementable but beyond Punjab’s control. These find mention in the Draft Punjab State Farmers’ Policy prepared by the Punjab State Farmers' and Farm Workers' Commission (https://www.psfc.org.in/english.pdf). This report was not accepted by Punjab but is being studied in Pakistan.
Punjab secured India's first fifty years of food security; the time is ripe for the Central Government to pick up the tab to fund a crop diversification in Punjab for securing the next fifty years of India’s nutrition security. What should work is for the Central Government to allocate Rs. 5,000 crore per year for a six-year period. This should be over and above the current resource allocation flowing into Punjab. It would be a pittance given the criticality of ensuring a nutritionally secure India and a worthwhile investment in a system that allocates lakhs of crores for government officers via Pay Commission dole-outs. Regretfully, the establishment in Punjab cannot be trusted to use the money for the intended purposes ensuring a just transformation and nor can the Central Government be expected to address the pain of diversification in perpetuity. To make the transition permanent, we have to go beyond than just bridging the profitability gap between paddy and other diversification crops. Therefore, a Niti Aayog headed "Transition Commission" should be constituted and be responsible for assessing the state’s plans and allocate resources conditionally.
Expecting a financially constrained Punjab to share the cost will be unrealistic and nor can one expect the state to show the political will to make difficult decisions. A diversification program becomes even more complicated when it seeks to address the crucial aspect of securing the livelihoods of those dependent on agriculture. Every transformation will create winners and losers. The initial period of transformation will be fraught with difficulties and may lead to more losers in the short term. The diversification package will also have to incorporate policy bottlenecks. The state’s free power for tube-wells adds to the problem and complexity. In face of leadership of farm unions unwillingness to bell the cat, the alternatives are too daunting for the administration to design and implement and a rather unpalatable bullet for the state

38 / Complexity of Crop Diversification in Punjab
politicians to bite. It would have helped, if they became what they ought to be; stewards ensuring the future of the generations to come. It is time for unions to rise up to a higher calling to seek a diversification package which allows to limit procurement of paddy & wheat in Punjab. It should be remembered, history unforgivingly records people’s heroes turning into villains faster than a blink of the eye.
Worse, the enactment of the three farm laws and the consequential developments have enhanced the trust deficit in the Central Government while also eroding the political capital of the Central Government to take bold measures. This will also hamper a proposed diversification program, not only in Punjab, but across India too.
The last few decades of India’s farming story is a history of unrealized potential and botched up programs. The program to stop crop burning is a telling recent example of poorly drafted policymaking and implementation. Even farmers unions opposed it in spite of knowing that crop burning was bad for the soil as well as for the health of people whose interest they espouse to represent. The point is that achieving a just transformation is not an easy task and just because something seems logical or even if money is made available, it does not mean that it will be easy to accomplish.
To exemplify the solution complexity, I want to retell a story; there were two very intelligent and well-intentioned persons; one was a nutrition scientist and the other was a marketing expert. Presume that they are representative of the central and the state governments. They decided to team up to make and sell the world’s best cattle feed. The nutritionist formulated the world’s most nutritious recipe and the marketing expert designed such a good marketing campaign, such that the first batch flew off the shelves. But there were no repeat customers. The cattle refused to eat the feed. The farmer is the cattle in the story. A similar botch up will occur if the state and the central government teams roll out a package to help farmers for diversification but do so without seeking what farmers require. The bottom line is to give farmers a chair at the policymaking table and not make them part of the menu.
*****

The Journal of Governance – January 2022 / 39
UP’s sugar industry has made tremendous strides in the last two decades. But it can do much more with forward-looking policy.
Sugarcane is grown on about 2.5 million hectares in Uttar Pradesh (UP). Taking an average one-hectare holding size, it translates into
25 lakh farmers. UP produces over 200 million tonnes (mt) of cane annually. A single labourer can harvest a maximum of one tonne daily. Assuming 150 workdays – after factoring in breaks during the crushing season that extends from November to April – harvesting the 200 mt would engage close to 15 lakh labourers. To this, one may add another 5 lakh that are employed in weighing, loading and transporting cane from the out centres (primary collection points) to sugar mills; in the mills, distilleries and indigenous sugar (gur and khandsari)-making units; and in transporting sugar, molasses and alcohol from the mills and distilleries.
All in all, then, there would be some 45 lakh families – farmers and workers – dependent on sugarcane in UP. Inclusive of their members (4-5 per family), it would add up to 2 crore persons. That works out to over 8% of UP’s total estimated 24 crore population – in other words, one in every 12 persons in the state!
It’s not difficult to see why sugarcane is so ubiquitous in UP. Virtually the whole of northern UP is a Ganna Pradesh. North encompasses North-West (Saharanpur, Shamli, Muzaffarnagar, Bijnor, Baghpat, Meerut, Ghaziabad, Hapur, Amroha, Moradabad,
Harish damodaran
Unlocking Ganna Pradesh’s Potential
40 / Unlocking Ganna Pradesh’s Potential
Bulandshahr, Sambhal and Badaun districts), North-Central (Rampur, Bareilly, Pilibhit, Shahjahanpur, Lakhimpur Kheri, Hardoi, Sitapur and Barabanki) and North-East (Bahraich, Balrampur, Gonda, Ayodhya, Ambedkar Nagar, Basti, Gorakhpur, Maharajganj, Kushinagar and Deoria) UP. Ganna Pradesh is essentially the northern half of UP, above Mathura-Aligarh, Lucknow, Amethi-Sultanpur and Azamgarh.
What is unique about Ganna Pradesh making it so suitable for sugarcane cultivation? Sugarcane, we know, is a water-guzzling crop. Cane is mostly grown in UP’s Upper Doab – the lands between its great south-flowing rivers. Thus, the North-West ganna belt covers the riverine plains between the Yamuna, Ganga and Ramganga; the North-Central Doab is between the Ramganga, Gomti and Sharda-Ghaghara; and the North-East between Sharda-Ghaghara, Rapti and Gandak extending to Bihar. The lands between these confluent rivers have extremely fertile alluvial soils, not to mention water, ideal for ganna. Unlike with Maharashtra, Karnataka or Tamil Nadu, water has never been a limiting factor in Ganna Pradesh!
Ganna Pradesh’s potential, however, wasn’t really exploited till around 2004, when the then Mulayam Singh Yadav government in UP came out with a Sugar Industry Promotion Policy. Under it, a host of incentives were offered for setting up new or expanding existing mills. These included a 10% capital subsidy on investment, remission of stamp duty and registration charges on land purchase, reimbursement of transport cost of sugar from the factory up to a distance of 600 km from the state borders, reimbursement of cane transport cost from the out-centres to the factory gate, remission/reimbursement of purchase tax on cane, reimbursement of cane society commission, and exemption of entry tax on sugar and trade tax on molasses. Although many of the sops never got delivered, the policy induced large-scale investments in both greenfield and brownfield capacities. Till 2003-04, the total crushing capacity of UP’s mills was below 400,000 tonnes of cane per day (tcd). Today, the state has 120 mills with aggregate capacity of 787,275 tcd (see table 1 below).

The Journal of Governance – January 2022 / 41
Table 1: Region-wise capacity of sugar mills (tcd)
North-West UP 371250Saharanpur 42750Shamli 23500Muzaffarnagar 61700Bijnor 68000Baghpat 15500Meerut 48800Hapur* 18500Amroha 16900Moradabad 25100Bulandshahr** 17750Sambhal 21000Badaun*** 11750North-Central UP 242625Rampur 15000Bareilly 25950Pilibhit 25250Shahjahanpur 25925Hardoi@ 28750Lakhimpur Kheri 80500Sitapur 36250Barabanki 5000North-East UP 173400Bahraich 15850Balrampur 31000Gonda 26200Ayodhya@@ 18750Ambedkar Nagar 7500

42 / Unlocking Ganna Pradesh’s Potential
Basti 22000Gorakhpur@@@ 11000Maharajganj 7000Kushinagar 28100Deoria 6000TOTAL UP 787275
*Includes one 5,000 tcd mill in Ghaziabad; **Includes one 1,250 mill in Aligarh;
***Includes one 3,500 tcd mill in Kasganj; @Includes one 1,250 tcd mill in Farrukhabad; @@Includes one 1,250 tcd mill in Sultanpur; @@@Includes one 3,500 tcd mill in Azamgarh and one 2,500 tcd mill in Mau.
Wonder varietyThe second major breakthrough happened with the blockbuster
variety, Co-0238, developed by Dr. Bakshi Ram, former director of the Indian Council of Agricultural Research’s Sugarcane Breeding Institute at Coimbatore. Till 2012-13, this variety, officially released for commercial cultivation in 2009, was being grown only in select farmers’ fields under evaluation trials conducted by the Indian Sugar Mills Association. In the 2013-14 sugar year (October - September), Co-0238 was cultivated on a large scale on 72,628 hectares across UP. From virtually nothing, its share in UP’s total sugarcane area rose to 3.09% in 2013-14, 8.3% in 2014-15, 19.64% in 2015-16, 35.49% in 2016-17 and 52.55% in 2017-18, and further to 69.02% in 2018-19, 82.21% in 2019-20 and 86.7% in 2020-21.Co-0238 had two game-changing characteristics.
The first was it being an early-maturing variety. “Early-maturity” referred not to the crop’s duration per se, but to sucrose accumulation. UP farmers mostly plant sugarcane during February-April, which is ready for crushing in 11 to 12 months. From this harvested plant-cane, there is also a 9-11 months “ratoon” crop that sprouts automatically from its stubbles. The ratoon cane is what mills first crush from November onwards. Harvesting of the plant-cane happens only after mid-January. The advantage with early-maturing varieties is that sucrose accumulation reaches 14-15% levels in the ratoon cane by November itself and by mid-January for the plant crop. This isn’t

The Journal of Governance – January 2022 / 43
so with “general” varieties, where the same peak sucrose levels are obtained only after mid-December in the ratoon and from March for the plant-cane. Early-maturing varieties basically enable mills to achieve higher sugar recovery right from November all through the crushing season till April-end.
Table 2 shows how average sugar recovery from cane crushed by mills in UP has gone up – from just over 9% to 11.5%-plus over the last 10 years. This is entirely courtesy of Co-0238. UP has, since 2016-17, also overtaken Maharashtra as India’s top sugar producer. Moreover, the average recovery rate recorded by its mills is today higher than that of Maharashtra (not all of the sucrose in cane is recovered/extracted as sugar; the unrecovered part goes into molasses used by distilleries). Table 2: The Big-Two: UP versus Maharashtra
Year (Oct-Sep)
Sugar production (lakh tonnes)
Sugar recovery (% of cane)
UP Maharashtra UP Maharashtra
2011-12 69.74 89.96 9.07 11.67
2012-13 74.85 79.87 9.18 11.41
2013-14 64.95 77.12 9.26 11.41
2014-15 71.01 105.14 9.54 11.30
2015-16 68.55 84.15 10.62 11.33
2016-17 87.73 42.00 10.61 11.26
2017-18 120.50 107.10 10.84 11.24
2018-19 118.22 107.21 11.49* 11.26
2019-20 126.37 61.61 11.73* 11.30
2020-21 110.59 106.30 11.46* 10.50
* Sugar recovery is lower at 11.46% in 2018-19, 11.30% in 2019-20 and 10.76% after accounting for diversion to B-molasses. Maharashtra’s recovery rates shown factor in such diversion.

44 / Unlocking Ganna Pradesh’s Potential
But it isn’t only the mills that have benefitted from Co-0238, which links up with its second significant transformative impact. Prior to Co-0238, all cane varieties grown in northern India were “medium-thin”, with the average diameter of their sticks at 2-2.25 cm each. Co-0238 was “medium-thick”. Its individual cane sticks had a diameter of 2.5-2.75 cm. Although increased thickness conferred greater yields, it could also result in lower sugar recovery. Breaking this negative correlation was a major breeding challenge. The need was for a medium-thick variety that gave higher yields to growers and simultaneously accumulated more sucrose for mills to recover early in the crushing season and through the winter.
That was where Dr. Ram’s variety made all the difference (table 3). While water was not a limiting factor for cane in UP, the winters were always so. This stemmed from the traditional understanding that cane is a tropical crop requiring water as well as sunshine for both yields and sugar recovery. However, average cane yields in UP have risen from below 60 tonnes to over 80 tonnes per hectare over the past 10 years. The extra 20 tonnes/hectare yield, thanks to Co-0238, would have considerably offset the effects of only a marginal cane price hike – from Rs. 315/quintal to Rs. 350/quintal since 2016-17 – and steep jump in diesel, electricity, fertiliser and crop protection chemical costs. For mills, the extra 2 kg sugar produced from every quintal of cane has been an unequivocal blessing. On the 110 mt of cane crushed annually by them and at Rs 30/kg average realization, the additional revenue from 2.2 mt of extra sugar comes to Rs 6,600 crore! Table 3: Average cane yield in UP (tonnes per hectare)
(lakh tonnes) 59.35
2012-13 61.63
2013-14 62.74
2014-15 65.15
2015-16 66.47

The Journal of Governance – January 2022 / 45
2016-17 72.38
2017-18 79.19
2018-19 80.50
2019-20 81.10
2020-21 81.50
Biofuel bonanza
A more recent boost to the sugar industry has come from the Narendra Modi government’s National Policy on Biofuels unveiled in May 2018 and, more significantly, the institution of a differential pricing regime in ethanol used for blending with petrol. Since 2018-19, mills are being paid higher rates for the ethanol that they produce from ‘B-heavy’ molasses and cane juice, than through the conventional ‘C’ molasses route.
Mills typically crush cane with 13.5-14% total fermentable sugars (TFS) content. From every tonne of cane, they recover around 115 kg (11.5%) sugar. The un-crystallized, non-recoverable TFS (2-2.5%) goes into ‘C’ molasses that yield about 10.67 litres of ethanol on fermentation. Alternatively, they can extract, say, 10% sugar and divert the 1.5% extra TFS into an earlier ‘B-heavy’ stage molasses yielding some 19.42 litres of ethanol. A third option is not to make any sugar and ferment the entire 13.4-14% TFS to produce roughly 76 litres of ethanol.
By fixing higher prices for ethanol derived from fermentation of whole sugarcane juice/syrup and the intermediate ‘B-heavy’ stage molasses than from ‘C’ molasses (see table 4), mills have an added incentive now to invest in new distillery capacities. Producing more ethanol from the first two routes has also reduced their dependence on revenues from sugar. In 2019-20 and 2020-21, mills grossed Rs 7,823 crore and Rs 13,598 crore from sale of ethanol to oil marketing companies (OMCs). Further, it enabled them to divert an estimated 0.8 mt and 2 mt of sugar in these two years.

46 / Unlocking Ganna Pradesh’s Potential
Table 4: Ex-mill price of ethanol in Rs per litre*2016-17 2017-18 2018-19 2019-20 2020-21 2021-22
‘C’ molasses 39.00 40.85 43.46 43.75 45.69 46.66
‘B’ heavy - - 52.43 54.27 57.61 59.08
Cane juice/syrup
- - 59.19 59.48 62.65 63.45
Ethanol supply by sugar mills (in crore litres)
66.5 150.5 179.1 157.09 275 400**
*Ethanol supply year is from December to November; **Projected.
The adoption of differential pricing has led to supply of ethanol by mills to OMCs rising, from a mere 38 crore litres in 2013-14 and 66.5 crore litres in 2016-17 to 275 crore litres in 2020-21. In 2021-22, it is expected to cross 400 crore litres, while diverting up to 3.5 mt of sugar towards ethanol produced from ‘B-heavy’ molasses and cane juice. The ethanol-blending target of 10% also looks achievable in 2021-22, as against the all-India average of 8.1% in 2020-21, 5% in 2018-19, 2.07% in 2016-17 and 1.53% in 2013-14. The Modi government is aiming at diversion of 6 mt sugar annually by 2025, as part of its ambitious 20% blending plan. That should further bring down the industry’s reliance on sugar sales, improving the capacity of mills to make timely payments to cane growers.
The National Policy on Biofuels has triggered huge investments in ethanol production capacities by UP’s leading sugar companies, reminiscent of the boom in the early 2000s. That one, of course, involved creation of milling capacity, as opposed to distillery capacities, following the UP’s government’s 2004 Sugar Industry Promotion Policy.
Balrampur Chini Mills, in January 2020, commissioned a 160 kilo-litres per day (KLPD) distillery at Gularia (Lakhimpur Kheri), taking its total capacity to 520 KLPD. Subsequently, it announced expansion of both its Balrampur and Gularia distilleries (by 170 KLPD and 40 KLPD, respectively) plus a greenfield 320 KLPD distillery at Maizapur (Gonda) to produce ethanol directly from cane juice/syrup during the crushing season (November-April) and from

The Journal of Governance – January 2022 / 47
grains (broken/damaged rice and maize) in the off-season. All these projects, more than doubling its capacity to 1,050 KLPD, are slated for completion by November 2022. DCM Shriram Ltd, likewise, commissioned a 200 KLPD distillery at Ajbapur (Lakhimpur) in December 2019, adding to its existing 150 KLPD facility at Hariawan (Hardoi). Next on the anvil is a 120 KLPD distillery at Ajbapur that can use grain as feedstock, taking the unit’s total capacity to 320 KLPD. Triveni Engineering & Industries, too, doubled its ethanol capacity to 320 KLPD through a 160-KLPD distillery at Sabitgarh (Bulandshahr) in April 2019. Two more – a 160 KLPD molasses/cane juice distillery at Milak Narayanpur (Rampur) and another 40 KLPD grain-based at Muzaffarnagar – are to be operational before the 2022-23 sugar season.
With the Ministry of Road Transport and Highways notifying the mass emission standards for 12% and 15% ethanol-blended petrol, the stage has already been set for manufacture of E12 and E15 compliant motor vehicles. The UP government can probably take the lead in enforcing 12% and 15% blending for new vehicles within the state. This makes sense, especially when the state is well poised to be India’s ethanol hub with all its sugar mills and distilleries. At 12%, 15% and 20% blending (all vehicles produced after April 2023 are supposed to be E20 compliant) this policy is worth pursuing first in UP, Maharashtra or Karnataka rather than in states that don’t grow sugarcane.
The road aheadSugarcane is a water-guzzler. Its water requirement is higher
than most crops (see table 5). The main reason for it is that ganna is grown over 11-12 months, compared to 4-5 months for paddy or wheat. Also, the worst sugarcane grower would harvest 40 tonnes per hectare – UP’s average, we saw, is 80 tonnes – whereas the best wheat or paddy farmers’ yields are 7-9 tonnes/hectare. Sugarcane consumes less water per day and even less for every unit weight of biomass produced. That has to do with it being a rare crop – in a list that also includes maize, sorghum and some grasses – exhibiting ‘C4’ photosynthesis. This is a more efficient mechanism, of deploying

48 / Unlocking Ganna Pradesh’s Potential
solar energy to convert atmospheric carbon dioxide and water into plant matter, than the more common ‘C4’ photosynthetic pathway. Table 5: Water requirement for different crops (Millimeter/total growing period)
Sugarcane 1500-2500Paddy/Rice 900-2500Wheat 450-650Sorghum (Jowar) 450-650Maize 500-800Ragi 400-450Cotton 700-1300Soyabean 450-700Groundnut 500-700Potato 500-700Onion 350-550Tomato 600-800Banana 1200-2200Grapes 500-1200
Source: http://agropedia.iitk.ac.in/content/water-requirement-different-crops.
Mother Nature, in a sense, has already made sugarcane highly efficient at carbon sequestration and a prolific biomass producer. Its green top leaves supply much of the fodder needs of UP’s farmers during the winter and spring months, before straw and stover are available from wheat in April-June and jowar/bajra in July-October. Sugarcane itself contains 70% water and 30% solids, comprising 14-15% each of sucrose and fibre.
Cane’s high water and fibre content, in turn, allows for sugar to be a unique industry generating its own steam and power requirement. This is, again, on account of biomass, which is nothing but stored energy from photosynthesis that gets released as heat on burning. The high-pressure boilers used in modern sugar mills can generate around 130 kilowatt-hours of electricity from every tonne of cane (i.e. 300 kg bagasse or 660 kg steam). After deducting 25 units of in-process consumption by the mill and another 11-12 units of

The Journal of Governance – January 2022 / 49
auxiliary consumption in the boilers/turbo-generators, about 95 units is exportable to the grid. Not for nothing that Balrampur Chini has an installed cogeneration capacity of 278.47 megawatts (MW) in its 10 sugar mills in UP that can together crush 76,500 tonnes cane per day. Out of the 278.47 MW, as much as 168.70 MW represents saleable cogeneration capacity. DCM Shriram’s four mills of 38,000 tcd, similarly, have a combined cogeneration capacity of 141 MW, of which 84 MW is exportable.
As regards water, we have already noted that it accounts for 70% of the weight of sugarcane. Out of that 70%, 15% goes into bagasse (the fibrous residue burnt in the boilers), 5% each into molasses and press mud, and 25% is used during crushing/juice extraction and lost due to evaporation. That still leaves 20% surplus water from the cooling towers/spray pounds that can be treated for use in irrigation. Sugarcane is, thus, a source of both surplus energy and water even after processing in mills.
The next challenge lies in how to make sugarcane part of a circular economy, wherein it gives back to nature what it takes to the maximum extent possible. For farmers, it is both a cash and fodder crop, the cane being sold to mills and the tops being fed to their animals. Ganna’s potential as an energy crop – producing sugar, biofuel and power – is already being harnessed by UP’s mills. But it does not stop there.
The press mud from mills – the residue cake after sugarcane juice is clarified and the mud collected at the bottom is further filtered – is used as an organic fertiliser, being rich in crude fibres, protein, sugar and micronutrients. Another useful fertiliser source is the spent wash from distilleries. This liquid effluent generated during alcohol production can pose serious environmental problems, if discharged into land and water bodies without proper treatment. There is, however, technology available now to simply concentrate the spent wash to 58-60% solids and feed it along with bagasse (as supporting fuel in 70:30 ratio) into an incineration boiler. The resultant ash coming out from the boiler in dry form has been found to contain up to 28% potash and 16.5-21% when converted into granules. For a country fully dependent on potash imports, this alternative
50 / Unlocking Ganna Pradesh’s Potential
production route can supply over a tenth of its consumption of the nutrient (https://www.aidaindia.org/Presentations2019/Delhi/Dr.%20Arvind%20Krishna.pdf). The Centre has also notified Potash derived from molasses (containing 14.5% of the nutrient) as a fertiliser and included it under the nutrient-based subsidy scheme.
UP’s sugar industry is today at an inflexion point where it can harness the full potential of the ganna that engages almost a tenth of the state’s population. Co-0238 is proof what varietal breeding can do for cane yields and sugar recoveries. There is tremendous scope to also grow the crop in an environmentally-sustainable way using less water and giving back to mother nature what is taken from it. Sugar mills in UP have gone beyond sugar to ethanol, cogeneration power and organic fertilisers. With forward-looking policy, whether on biofuels or transparent formula-based pricing of cane, Ganna Pradesh can do better than Brazil!
*****

The Journal of Governance – January 2022 / 51
Abstract
Increasing public investments in agriculture and irrigation have not been translating into higher rates of growth in private investment, output and farmers’ income. We probe the missing elements that might have come in the way based on the state level data from 1981-82 to 2015-16. It is found that public investment in agriculture continues to be skewed towards major-medium irrigation projects since the green revolution era, while farmers’ capital needs have altered beyond irrigation to machinery-implements, livestock, land improvement and non-farm business. We recommend state wise estimation of private capital formation in agriculture and its composition on a regular basis instead of depending on the decennial NSS-AIDIS data. Accordingly, public investment can be synchronised with farmers’ changing asset requirements to intensify the ‘crowding in’ effect and also accelerate agricultural growth.
Public and Private Capital Formation in Agriculture in India
Capital formation, used synonymously with investment, is undertaken in agriculture and allied activities by the public and private (mainly household) sectors in India. The share of public capital formation has steadily gone down over the last 50 years. An overwhelming share is now of private household sector at 82 per cent, followed by public sector at 15 per cent and the remaining 3 per cent by the private corporate sector, in plantation.
Seema Bathla and Gautam Kumar Das
Synchronizing Public Investment in Agriculture with Capital Requirements of
Farmers

52 / Synchronizing Public Investment in Agriculture with Capital Requirements of Farmers
Recognising that investments on both public and private accounts are imperative for agricultural growth and development, the key concerns have centred around:(1) how to increase investments in agriculture - through personal
savings, institutional lending and inviting the corporate sector?
(2) how much is the ‘crowding in’ effect of public investment in agriculture, rural infrastructure and investment support on private investment?
(3) does public spending on input subsidies cut down investments in agriculture?
(4) in what ways input subsidies be rationalised to impact farmers’ investment and hence crop productivity?
(5) which type of public investment has potential to mitigate poverty and inter- and intra-regional inequalities in income and output?
(6) can capital use efficiency in major-medium irrigation systems be improved through better governance and institutional reforms?
(7) what are the futuristic public investment requirements for augmenting agriculture growth, productivity and farmers’ income in the medium term and also mitigating the growing risks due to climate change and price volatility? There is no dearth of literature in the context of public
investment and input subsidies starting with Raj and Raychaudhuri (1980), Mitra (1986), Dantwala (1986), Dhawan (1988), Rath (1989), Shetty (1990), Rao (1989), Gandhi (1990), Mishra and Chand (1995) to Chand (2000), Fan et al. (2000), Gulati and Bathla (2002), Fan et al. (2008), Bisaliah et al. (2013), Gulati and Terway (2018), and Bathla et al. (2020). The policy implications from the research have been vividly drawn and measures taken from time to time. However, the recurrent agrarian crisis in several parts of the country amid multiple increases in public expenditure on irrigation, input subsidies, and rural infrastructure, have brought these issues to the forefront. Covid-19 pandemic

The Journal of Governance – January 2022 / 53
has evoked the criticality to maintain the food production, stocks and prices, implying an increasing role of the government and good governance.
We delve into the inter-state trends in public expenditure, private investment and the outcomes over a longer period of time from 1981/82 to 2015/16 to explore the missing elements that may have come in the way of accelerating private investment, agricultural growth and farmers’ income and the way forward for public investment policy. Data on public expenditure is sourced from Finance Accounts, CAG, GoI. The expenditure data given in nominal prices are converted into real prices at 2011-12 based on the GSDP deflator The decennial National Sample Survey (NSS), popularly called the All-India Debt and Investment Survey (AIDIS-schedule 18.2) provides estimates on household (HH) private investment (fixed capital expenditure) in each state. The state wise magnitude of private investment is based on the all-India estimates on gross capital formation on private account given in the NAS, CSO, MoSPI. The data series is bifurcated into states based on their respective share of capital formation in total given in the NSS – AIDIS - 1981-82, 1991-92, 2002-03 and 2012-13. The respective shares at given point of time are interpolated1.
Public expenditure on economic activities is categorised into revenue and capital expenditure heads. While revenue expenditure is incurred towards maintenance and operational purposes, salaries and input subsidies, capital expenditure is mainly for physical and financial asset formation. Table 1 shows that the average per hectare (ha) real public expenditure (revenue and capital) in agriculture & irrigation (including flood control) has increased from nearly Rs.1900 during the 1980s to Rs. 5100 during
1 The CSO estimates capital formation on public and private accounts are estimated using detailed budgetary documents, AIDIS and lending by the commercial and regional rural banks. The NSS takes representative sample and provide rich information on economic aspects of rural and urban HHs including investment and its composition in farm and non-farm, net returns/income, indebtedness, response to extension and price support policies etc.
54 / Synchronizing Public Investment in Agriculture with Capital Requirements of Farmers
2010/11 – 2015/16. The average per ha spending during 2010/11-2015/16 was the highest (>Rs. 8000) in Andhra Pradesh, Jammu & Kashmir, Odisha, Chhattisgarh, Jharkhand and Uttarakhand and the least (< Rs. 4000) in Kerala, Madhya Pradesh, Rajasthan, Tamil Nadu and West Bengal. Taking only capital expenditure, which may be called investment, the average expenditure in agriculture has always been less than Rs. 500 per ha. It has sizeably increased in irrigation from Rs.1079/ha during the eighties to Rs. 3330/ha during the recent period. Compared to investment in the agricultural sector per se, per ha investment in irrigation is the lowest (<Rs. 4000) in Chhattisgarh, West Bengal, Assam, Bihar, Haryana, Punjab, Kerala, Madhya Pradesh, Rajasthan, Uttar Pradesh and Tamil Nadu and much higher (> Rs. 8000) in Andhra Pradesh, Jharkhand and Uttarakhand during the same period.
These trends indicate that government spending has increased across the states but it is actually more under the revenue head as compared to capital formation, carried out under capital expenditure head. Sizeable inter-state disparities persist in public expenditure in agriculture and irrigation. The capital intensity has not yet improved in any state. It indicates a low priority of the respective states towards investment vis-à-vis day-to-day expenditure, including subsidies. Another worrisome aspect is the decline in the share of spending on agriculture and irrigation in total spending on economic services.
We also observe considerable differences in the annual rate of growth of expenditure in agriculture and irrigation across the states (Table 2). Importantly, public investment in irrigation grew by more than 10 per cent per annum during 2000/01 to 2009/10 and became negative in several states in the subsequent period (2010/11 to 2015/16) except in Karnataka, Punjab, Odisha, Uttar Pradesh and Rajasthan.
Similar to public investment, private household investment varies across the states. At the national level, it shows a robust increase from Rs. 2606/ha during the 1980s to Rs. 16,434/ ha during 2010/11-15/16, growing within a range of 2 per cent to 8 per cent per annum between 1981 and 2015. Investment by

The Journal of Governance – January 2022 / 55
farmers is the lowest in Chhattisgarh, a little higher in Assam, Bihar, Odisha and West Bengal, between Rs. 4000-8000 per ha and the maximum in other states, viz. Himachal Pradesh (Rs. 78,225), Kerala (Rs. 52,220), Uttar Pradesh (Rs. 31,081), Punjab (Rs. 29,238), Jammu & Kashmir (Rs. 25,559) during 2010/11-2015/16.
A noticeable aspect from the NSS data is a change in the asset preferences of farmers towards machinery-implements, land improvement, livestock and tractors. Tractor is also used for non-farm activities during the lean season in agriculture. Another observation relates to their overall investment behaviour, which has leaned towards residential land and buildings, and non-farm business, especially in high per capita income states such as Punjab and Haryana. The respective shares of these two components in gross capital expenditure were 68 per cent and 8.7 per cent compared to the share of farm business at 23.3 per cent during 2012-13. In fact, capital expenditure on residential land and buildings has grown at a much higher rate at 4.7 per cent compared to that in farm and non-farm businesses at 2.52 per cent and 3.31 per cent respectively between 2002/03 and 2012/13 (Bathla and Kumari 2017). Growing urbanization, expansion in industrial activities, low income from small land holdings (less than 2 ha) might have made investment in land lucrative relative to farming.
It is not clearly established whether income accrued from investment in allied activities is ploughed back into agriculture. However, the off-farm investments by farm households seem to be undertaken at the expense of asset formation in agriculture. Besides, an increasing number of farmers and labourers are exiting agriculture, leaving farming at the hands of tenants and women farmers with meagre resources and little understanding about the capital requirements. According to Kumar et al (2017), the institutional credit to farmers has gone up and is more inclusive, compared to the past, but it has failed to make any dent on capital formation, primarily because of a consistent decrease in the share of long-term lending.

56 / Synchronizing Public Investment in Agriculture with Capital Requirements of Farmers
Implications of Investment Patterns for Agricultural growth
Investments results in higher output, productivity and income. As shown in Tables 1 and 2, the average value of output from agriculture and livestock activities in 20 major states has increased from Rs. 38,597 per ha during 1981-89 to Rs. 12,69,430 during 2010-15 at an annual rate of growth of 2.6 per cent and 5.6 per cent respectively in each period. During 2010/11 to 2015/16, the average output ranged from Rs. 74,324 per ha in Chhattisgarh to Rs. 2,59,855 per ha in Jammu & Kashmir. The states that have lower (< Rs. 1,50,000 per ha) value of agricultural output include Assam, Bihar, Gujarat, Karnataka, Madhya Pradesh, Maharashtra, Odisha, Rajasthan and Chhattisgarh, and higher (> Rs. 2,00,000 per ha) include Haryana, Himachal Pradesh, Jammu & Kashmir, Kerala, Punjab, Tamil Nadu, West Bengal, Jharkhand and Uttarakhand. A phenomenal increase in the value of output in many states is attributable to livestock activities. The average annual rate of growth has increased across all the states, relatively higher in recent years in Andhra Pradesh, Madhya Pradesh, Gujarat, Odisha, Rajasthan, West Bengal, Jharkhand and Tamil Nadu.
Which of the two investments in agriculture – public or private HH has contributed more to an increase in the value of agricultural output? From Table 3, it is evident that the value of agricultural output has higher correlation with public expenditure in agriculture (0.56) and irrigation (0.88) during the eighties, which dropped to 0.53 and 0.56 respectively by 2010/15. In contrast, private investment continues to have a high correlation with agriculture output, between 0.81 and 0.88 over the period. This may not undermine the importance of public investment as its contribution to output is also seen via private investment owing to the well-established ‘crowding in’ effect between the two sources of investment in agriculture. Nevertheless, a high and statistically significant value of correlation between private and public irrigation investments during the eighties at 0.75 consistently went down to 0.46. The estimated value is relatively higher (0.88
The Journal of Governance – January 2022 / 57
during the eighties to 0.54 in the recent period) when public expenditure is taken on both revenue and capital accounts. It may indicate that farmers positively respond to government spending on irrigation subsidies being incurred from the revenue account head 2. Undeniably, the impact of public irrigation investment on private investment may have diminished over time for the simple reason that the states spent relatively more on day-to-day expenses on maintenance rather than on new asset formation and also due to growing capital use inefficiency in major-medium irrigation systems (Kannan et al. 2019).
A big push in irrigation investment identified during the 2000s has not yielded the expected outcomes in terms of increase in the net area irrigated by canals. The share of area irrigated by canals in total irrigated area has barely increased from 14 per cent to 17 per cent during 1980s to 2010s. In most of the states, the burden squarely falls on farmers to invest in tube wells for irrigation, which again has repercussions for environment due to extraction of groundwater beyond the recharge. The states are also to be blamed for providing subsidised power for agriculture usage and not pushing the concerned departments to complete the existing irrigation projects and maintain them.
Expanding the Trajectories of Public Investment beyond Major-Medium Irrigation Systems
Lower investment by farmers can easily contribute to lower income for which government has to come to their rescue. Farming is also increasingly becoming unviable due to a much steeper increase in the cost of inputs compared to the output. The problem is supplemented with inefficiencies in the marketing system and slow pace of reforms, a long chain of intermediaries and price volatility that dissuade remunerative prices to farmers for their produce. Crop diversification, though steadily increasing
2 Expenditure on indirect subsidies is on account of inputs (fertiliser, irrigation and energy) and direct subsidies are given on purchase of micro irrigation, machinery and other farm equipment’s under the RKVY-RAFTAAR, National Food Security Mission and National Horticulture Mission– government’s flagship programmes.

58 / Synchronizing Public Investment in Agriculture with Capital Requirements of Farmers
in some states is hardly backed with support from the government. This may be due to over production of a commodity which is not commensurate with its demand and hence results in fall in its price. Climate change has added to farmers’ woes with absolutely negligible technologies and support to address the problems. Each state needs estimates on the investment required in technologies to mitigate the emission levels accruing from crop cultivation and livestock activities. Of late, farmers in northern states are under intense pressure to abate stubble burning, either through diversification away from paddy-wheat rotation or use paddy straw for biomass or purchase ‘happy seeder’ machine. Though the respective state governments have come up with capital subsidy on machinery, the investments required on these counts would have been more precisely known if the NSO was carrying out its survey at short intervals, say every five year.
The foremost challenge, therefore is to regularly estimate public and private capital formation in agriculture at the disaggregate level in line with the methodology adopted at the national level 3. Second, is to maintain the momentum of public investment in agriculture and irrigation with an eye on assuring capital use efficiency in canal irrigation through better institutions and governance. For example, public-private partnership may be piloted for managing canal irrigation on the pattern of power sector in some of the states in India. Thirdly, as elicited above, the eastern and rainfed states of the country need considerable handholding, which also suggests prioritising public investments across the social and economic domains in each 4. Fourthly, private investment remains crucial, implying the need to uphold
3 Only a few states have attempted this exercise so far from 1980 onwards. Some clues on the type of assets purchase are obtained from the FAO database or inhouse surveys carried out by input companies and independent researchers.
4 While estimating marginal returns in terms of agriculture income from additional public investments and input subsidies (fertiliser, irrigation and energy), Bathla et al. (2020) recommended investments first in agriculture research and development (R&D), followed by education, health-nutrition and energy, that too in the rainfed and low per capita income states. Gulati and Terway (2018) also estimated higher payoffs from agricultural research, roads and education investments at all India. Lower benefits from irrigation investment are explained by a large number (337) of unfinished projects, which may not be contributing to any additional irrigation.
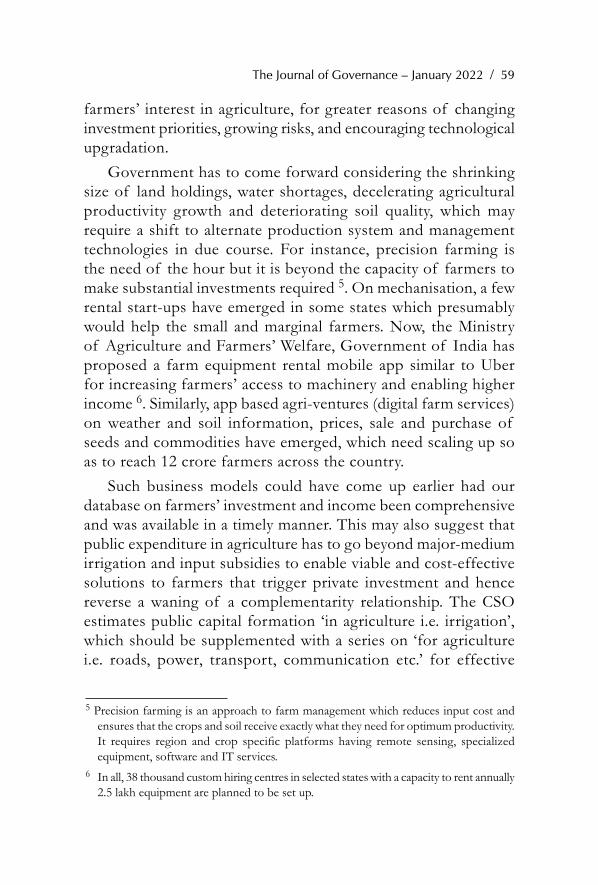
The Journal of Governance – January 2022 / 59
farmers’ interest in agriculture, for greater reasons of changing investment priorities, growing risks, and encouraging technological upgradation.
Government has to come forward considering the shrinking size of land holdings, water shortages, decelerating agricultural productivity growth and deteriorating soil quality, which may require a shift to alternate production system and management technologies in due course. For instance, precision farming is the need of the hour but it is beyond the capacity of farmers to make substantial investments required 5. On mechanisation, a few rental start-ups have emerged in some states which presumably would help the small and marginal farmers. Now, the Ministry of Agriculture and Farmers’ Welfare, Government of India has proposed a farm equipment rental mobile app similar to Uber for increasing farmers’ access to machinery and enabling higher income 6. Similarly, app based agri-ventures (digital farm services) on weather and soil information, prices, sale and purchase of seeds and commodities have emerged, which need scaling up so as to reach 12 crore farmers across the country.
Such business models could have come up earlier had our database on farmers’ investment and income been comprehensive and was available in a timely manner. This may also suggest that public expenditure in agriculture has to go beyond major-medium irrigation and input subsidies to enable viable and cost-effective solutions to farmers that trigger private investment and hence reverse a waning of a complementarity relationship. The CSO estimates public capital formation ‘in agriculture i.e. irrigation’, which should be supplemented with a series on ‘for agriculture i.e. roads, power, transport, communication etc.’ for effective
5 Precision farming is an approach to farm management which reduces input cost and ensures that the crops and soil receive exactly what they need for optimum productivity. It requires region and crop specific platforms having remote sensing, specialized equipment, software and IT services.
6 In all, 38 thousand custom hiring centres in selected states with a capacity to rent annually 2.5 lakh equipment are planned to be set up.

60 / Synchronizing Public Investment in Agriculture with Capital Requirements of Farmers
policy measures in this sector. Farmers also need to increase investment in dairying, poultry, small ruminants (sheep and goat) and rural based agro-processing enterprises. The banks too have to adapt to the changing requirements of the farming, and come up with innovative models of lending. These suggestions rightly concur with government’s policy shift from increasing agricultural production for food security to the doubling of farmers’ income.Table 1: Public Expenditure, Public Investment, Private Investment and Value of Output in Agriculture & Livestock (Rs. per hectare at 2011-12 prices)
Average State Public expenditure: agriculture
& allied activities
Public expenditure:
irrigation & flood control
Private (HH)
Investment: agriculture
& allied activities
Public investment: agriculture
& allied activities
Public investment: irrigation & flood control
Values of output :
agriculture and
livestock
1981-1982 to 1989-1990
Andhra Pradesh
992 2736 2584 45 1436 43881
1990-1991 to 1999-2000 1295 3605 3323 37 1647 65389
2000-2001 to 2009-2010 2238 11247 7630 58 7232 96179
2010-2011 to 2015-2016 5077 9664 18687 42 9213 158150
1981-1982 to 1989-1990
Assam
3042 2204 793 92 1611 54813
1990-1991 to 1999-2000 3390 1964 701 48 1306 77067
2000-2001 to 2009-2010 3335 2484 2275 50 1257 91110
2010-2011 to 2015-2016 4728 4474 5369 43 3134 125062
1981-1982 to 1989-1990
Bihar
1307 2920 1174 161 2049 51296
1990-1991 to 1999-2000 1430 1927 1016 15 985 68614
2000-2001 to 2009-2010 1597 3081 1923 48 1745 89166
2010-2011 to 2015-2016 6112 4207 4307 394 2889 147106
1981-1982 to 1989-1990
Gujarat
879 2537 2299 174 985 28703
1990-1991 to 1999-2000 1284 4074 2907 261 1934 41545
2000-2001 to 2009-2010 1879 5012 8939 245 3465 65199
2010-2011 to 2015-2016 4455 7729 16908 646 5684 139608
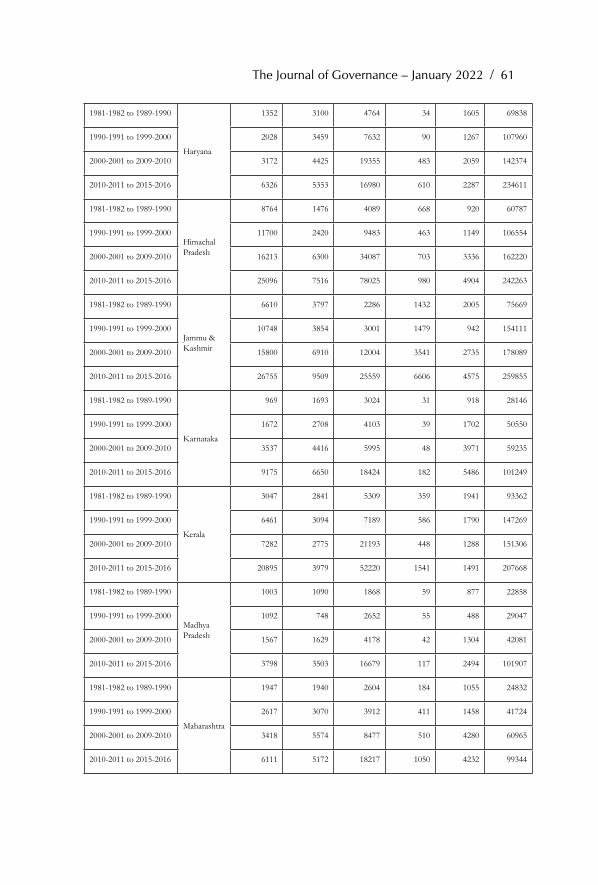
The Journal of Governance – January 2022 / 61
1981-1982 to 1989-1990
Haryana
1352 3100 4764 34 1605 69838
1990-1991 to 1999-2000 2028 3459 7632 90 1267 107960
2000-2001 to 2009-2010 3172 4425 19355 483 2059 142374
2010-2011 to 2015-2016 6326 5353 16980 610 2287 234611
1981-1982 to 1989-1990
Himachal Pradesh
8764 1476 4089 668 920 60787
1990-1991 to 1999-2000 11700 2420 9483 463 1149 106554
2000-2001 to 2009-2010 16213 6300 34087 703 3336 162220
2010-2011 to 2015-2016 25096 7516 78025 980 4904 242263
1981-1982 to 1989-1990
Jammu & Kashmir
6610 3797 2286 1432 2005 75669
1990-1991 to 1999-2000 10748 3854 3001 1479 942 154111
2000-2001 to 2009-2010 15800 6910 12004 3541 2735 178089
2010-2011 to 2015-2016 26755 9509 25559 6606 4575 259855
1981-1982 to 1989-1990
Karnataka
969 1693 3024 31 918 28146
1990-1991 to 1999-2000 1672 2708 4103 39 1702 50550
2000-2001 to 2009-2010 3537 4416 5995 48 3971 59235
2010-2011 to 2015-2016 9175 6650 18424 182 5486 101249
1981-1982 to 1989-1990
Kerala
3047 2841 5309 359 1941 93362
1990-1991 to 1999-2000 6461 3094 7189 586 1790 147269
2000-2001 to 2009-2010 7282 2775 21193 448 1288 151306
2010-2011 to 2015-2016 20895 3979 52220 1541 1491 207668
1981-1982 to 1989-1990
Madhya Pradesh
1003 1090 1868 59 877 22858
1990-1991 to 1999-2000 1092 748 2652 55 488 29047
2000-2001 to 2009-2010 1567 1629 4178 42 1304 42081
2010-2011 to 2015-2016 3798 3503 16679 117 2494 101907
1981-1982 to 1989-1990
Maharashtra
1947 1940 2604 184 1055 24832
1990-1991 to 1999-2000 2617 3070 3912 411 1458 41724
2000-2001 to 2009-2010 3418 5574 8477 510 4280 60965
2010-2011 to 2015-2016 6111 5172 18217 1050 4232 99344

62 / Synchronizing Public Investment in Agriculture with Capital Requirements of Farmers
1981-1982 to 1989-1990
Odisha
1247 2046 578 109 1686 38392
1990-1991 to 1999-2000 1805 2083 1047 120 1516 45245
2000-2001 to 2009-2010 2550 2991 3619 171 2152 62373
2010-2011 to 2015-2016 2801 11899 5572 320 4995 115675
1981-1982 to 1989-1990
Punjab
1107 2306 6360 -6 1177 91767
1990-1991 to 1999-2000 1418 3150 6339 -91 1940 125657
2000-2001 to 2009-2010 2020 3098 16435 155 1340 163466
2010-2011 to 2015-2016 12761 5196 29238 104 1327 228458
1981-1982 to 1989-1990
Rajasthan
415 1099 2006 29 535 22426
1990-1991 to 1999-2000 766 1380 3475 129 669 33456
2000-2001 to 2009-2010 889 1690 8287 73 722 48581
2010-2011 to 2015-2016 2040 1435 15063 175 503 100271
1981-1982 to 1989-1990
Tamil Nadu
2448 1141 4532 281 438 48536
1990-1991 to 1999-2000 5475 1453 6955 291 448 77221
2000-2001 to 2009-2010 6376 2715 11716 1633 1051 102889
2010-2011 to 2015-2016 15452 3726 11132 1434 2254 267183
1981-1982 to 1989-1990
Uttar Pradesh
840 2472 3500 45 1180 55850
1990-1991 to 1999-2000 1388 2265 4778 92 553 75064
2000-2001 to 2009-2010 2578 3000 13801 930 1324 100942
2010-2011 to 2015-2016 3581 4992 31081 323 1667 168494
1981-1982 to 1989-1990
West Bengal
1159 893 1595 99 332 41044
1990-1991 to 1999-2000 1595 1282 1733 67 468 79339
2000-2001 to 2009-2010 2507 2041 3250 119 613 141857
2010-2011 to 2015-2016 6280 3747 6690 679 1466 259004
1981-1982 to 1989-1990
Chhattisgarh
- - - - - -
1990-1991 to 1999-2000 - - - - - -
2000-2001 to 2009-2010 3482 2178 1306 135 1717 43276
2010-2011 to 2015-2016 14367 3813 2599 145 2887 74323

The Journal of Governance – January 2022 / 63
1981-1982 to 1989-1990
Jharkhand
- - - - - -
1990-1991 to 1999-2000 - - - - - -
2000-2001 to 2009-2010 3904 3537 2800 43 2555 91917
2010-2011 to 2015-2016 9757 9068 11299 357 3660 206279
1981-1982 to 1989-1990
Uttarakhand
- - - - - -
1990-1991 to 1999-2000 - - - - - -
2000-2001 to 2009-2010 9573 6396 14003 52 3451 123118
2010-2011 to 2015-2016 20776 13107 13383 3127 6794 200058
1981-1982 to 1989-1990
All 20 States
1264 1931 2606 106 1079 38957
1990-1991 to 1999-2000 1857 2284 3625 150 1090 57380
2000-2001 to 2009-2010 2756 3897 8292 339 2500 79212
2010-2011 to 2015-2016 5291 5127 16434 483 3330 126430
Source: Based on GOI - NAS, MOSPI, GOI-Finance Accounts, CAG, GOI-NSS-AIDIS. Data for the newly formed states – Chhattisgarh, Uttarakhand and Jharkhand are available from 2000 onwards; Andhra Pradesh is undivided.
Table 2: Annual Rate of Growth in Public Expenditure, Public Investment, Private Investment and Value of Output in Agriculture & Livestock per hectare at 2011-12 prices
State Public expenditure: agriculture
& allied activities
Public expenditure:
irrigation & flood control
Private Investment: agriculture
& allied activities
Public investment: agriculture
& allied activities
Public investment: irrigation & flood control
Values of output :
Agriculture and
livestock
1981-1982 to 1989-1990
Andhra Pradesh
8.70 7.22 -0.32 *** 4.28 1.44
1990-1991 to 1999-2000 -0.04 3.58 4.13 0.04 2.25 3.03
2000-2001 to 2009-2010 10.85 20.78 7.25 -22.87 29.48 5.98
2010-2011 to 2015-2016 22.12 -6.70 16.26 9.16 -2.60 11.42
1981-1982 to 1989-1990
Assam
6.52 1.26 -8.74 -10.51 0.30 0.94
1990-1991 to 1999-2000 -3.57 -2.26 7.35 -27.28 -3.36 2.86
2000-2001 to 2009-2010 5.23 10.82 10.94 9.93 13.64 3.70
2010-2011 to 2015-2016 -2.97 0.83 5.25 18.36 1.76 3.33
1981-1982 to 1989-1990
Bihar
6.82 4.12 -2.64 17.43 1.75 4.15
1990-1991 to 1999-2000 -7.74 0.06 -3.08 -17.45 0.37 1.92
2000-2001 to 2009-2010 16.13 8.52 8.40 *** 11.35 2.02
2010-2011 to 2015-2016 9.40 -7.76 4.83 70.33 -6.16 5.38
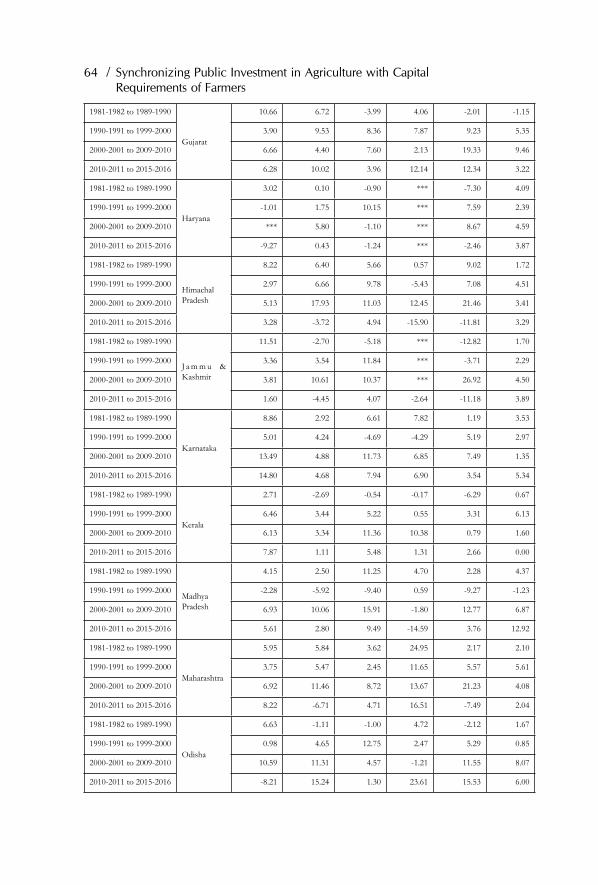
64 / Synchronizing Public Investment in Agriculture with Capital Requirements of Farmers
1981-1982 to 1989-1990
Gujarat
10.66 6.72 -3.99 4.06 -2.01 -1.15
1990-1991 to 1999-2000 3.90 9.53 8.36 7.87 9.23 5.35
2000-2001 to 2009-2010 6.66 4.40 7.60 2.13 19.33 9.46
2010-2011 to 2015-2016 6.28 10.02 3.96 12.14 12.34 3.22
1981-1982 to 1989-1990
Haryana
3.02 0.10 -0.90 *** -7.30 4.09
1990-1991 to 1999-2000 -1.01 1.75 10.15 *** 7.59 2.39
2000-2001 to 2009-2010 *** 5.80 -1.10 *** 8.67 4.59
2010-2011 to 2015-2016 -9.27 0.43 -1.24 *** -2.46 3.87
1981-1982 to 1989-1990
Himachal Pradesh
8.22 6.40 5.66 0.57 9.02 1.72
1990-1991 to 1999-2000 2.97 6.66 9.78 -5.43 7.08 4.51
2000-2001 to 2009-2010 5.13 17.93 11.03 12.45 21.46 3.41
2010-2011 to 2015-2016 3.28 -3.72 4.94 -15.90 -11.81 3.29
1981-1982 to 1989-1990
J a m m u & Kashmir
11.51 -2.70 -5.18 *** -12.82 1.70
1990-1991 to 1999-2000 3.36 3.54 11.84 *** -3.71 2.29
2000-2001 to 2009-2010 3.81 10.61 10.37 *** 26.92 4.50
2010-2011 to 2015-2016 1.60 -4.45 4.07 -2.64 -11.18 3.89
1981-1982 to 1989-1990
Karnataka
8.86 2.92 6.61 7.82 1.19 3.53
1990-1991 to 1999-2000 5.01 4.24 -4.69 -4.29 5.19 2.97
2000-2001 to 2009-2010 13.49 4.88 11.73 6.85 7.49 1.35
2010-2011 to 2015-2016 14.80 4.68 7.94 6.90 3.54 5.34
1981-1982 to 1989-1990
Kerala
2.71 -2.69 -0.54 -0.17 -6.29 0.67
1990-1991 to 1999-2000 6.46 3.44 5.22 0.55 3.31 6.13
2000-2001 to 2009-2010 6.13 3.34 11.36 10.38 0.79 1.60
2010-2011 to 2015-2016 7.87 1.11 5.48 1.31 2.66 0.00
1981-1982 to 1989-1990
Madhya Pradesh
4.15 2.50 11.25 4.70 2.28 4.37
1990-1991 to 1999-2000 -2.28 -5.92 -9.40 0.59 -9.27 -1.23
2000-2001 to 2009-2010 6.93 10.06 15.91 -1.80 12.77 6.87
2010-2011 to 2015-2016 5.61 2.80 9.49 -14.59 3.76 12.92
1981-1982 to 1989-1990
Maharashtra
5.95 5.84 3.62 24.95 2.17 2.10
1990-1991 to 1999-2000 3.75 5.47 2.45 11.65 5.57 5.61
2000-2001 to 2009-2010 6.92 11.46 8.72 13.67 21.23 4.08
2010-2011 to 2015-2016 8.22 -6.71 4.71 16.51 -7.49 2.04
1981-1982 to 1989-1990
Odisha
6.63 -1.11 -1.00 4.72 -2.12 1.67
1990-1991 to 1999-2000 0.98 4.65 12.75 2.47 5.29 0.85
2000-2001 to 2009-2010 10.59 11.31 4.57 -1.21 11.55 8.07
2010-2011 to 2015-2016 -8.21 15.24 1.30 23.61 15.53 6.00

The Journal of Governance – January 2022 / 65
1981-1982 to 1989-1990
Punjab
*** 3.14 -6.17 *** -4.05 3.49
1990-1991 to 1999-2000 *** 3.93 6.02 *** 5.30 2.91
2000-2001 to 2009-2010 *** 1.46 7.02 *** 0.03 3.73
2010-2011 to 2015-2016 37.93 7.27 3.31 84.96 14.22 2.68
1981-1982 to 1989-1990
Rajasthan
9.83 3.25 5.46 7.33 0.26 3.38
1990-1991 to 1999-2000 3.32 4.21 4.34 26.07 2.67 4.88
2000-2001 to 2009-2010 6.24 0.06 6.07 13.46 2.85 4.14
2010-2011 to 2015-2016 4.76 4.07 4.76 15.10 9.45 7.91
1981-1982 to 1989-1990
Tamil Nadu
2.71 0.13 3.54 1.88 -3.09 2.15
1990-1991 to 1999-2000 1.46 7.28 2.99 7.49 7.19 4.41
2000-2001 to 2009-2010 11.11 2.84 -1.55 38.34 4.11 7.48
2010-2011 to 2015-2016 15.71 -0.62 -0.01 8.58 -9.72 7.91
1981-1982 to 1989-1990
Uttar Pradesh
10.06 3.81 -0.45 *** -1.31 2.33
1990-1991 to 1999-2000 1.61 -1.29 5.27 *** -0.66 2.63
2000-2001 to 2009-2010 8.42 7.10 10.05 *** 12.10 4.03
2010-2011 to 2015-2016 14.86 5.56 4.97 *** 11.19 5.47
1981-1982 to 1989-1990
West Bengal
5.02 3.11 -0.43 -2.84 3.62 6.38
1990-1991 to 1999-2000 1.37 4.90 0.35 -2.50 3.30 5.56
2000-2001 to 2009-2010 9.66 5.90 8.17 26.97 10.59 9.62
2010-2011 to 2015-2016 6.44 6.78 3.45 37.65 19.88 4.97
1981-1982 to 1989-1990
Chhattisgarh
- - - - - -
1990-1991 to 1999-2000 - - - - - -
2000-2001 to 2009-2010 17.43 17.84 *** 44.44 20.83 3.55
2010-2011 to 2015-2016 23.63 2.69 2.81 -7.65 2.62 3.07
1981-1982 to 1989-1990
Jharkhand
- - - - - -
1990-1991 to 1999-2000 - - - - - -
2000-2001 to 2009-2010 15.67 13.85 *** *** 6.74 8.35
2010-2011 to 2015-2016 1.71 6.28 3.55 20.94 11.92 5.63
1981-1982 to 1989-1990
Uttarakhand
- - - - - -
1990-1991 to 1999-2000 - - - - - -
2000-2001 to 2009-2010 12.59 25.09 *** *** 41.92 2.60
2010-2011 to 2015-2016 8.79 7.74 -1.97 71.69 12.10 4.44
1981-1982 to 1989-1990
All 20 states State
6.32 3.73 1.76 5.14 0.25 2.63
1990-1991 to 1999-2000 1.34 3.45 2.48 7.57 3.29 3.28
2000-2001 to 2009-2010 8.48 9.80 8.01 16.46 15.70 4.87
2010-2011 to 2015-2016 10.49 -0.26 5.66 17.50 1.28 5.58
Source: GOI - NAS, MOSPI, GOI-Finance Accounts, CAG, GOI-NSS-AIDIS. *** Not available due to negative or zero values in capital expenditure.

66 / Synchronizing Public Investment in Agriculture with Capital Requirements of Farmers
Table 3: Correlation between Public and Private Investments in Agriculture and Value of Output in Agriculture & Livestock Activities
Variables 1981/82-1989/90 Value of output:
agriculture & livestock
Private Investment: agriculture
1990/91 – 1999/00 Value of output:
agriculture &
livestock
Private investment: agriculture
2000/01 – 2009/10 Value of output:
agriculture &
livestock
Private investment: agriculture
2010/11-2015/16 Value of output:
agriculture &
livestock
Private investment: agriculture
Public expenditure: agriculture & allied activities (revenue + capital)
0.56* 0.67* 0.63* 0.73* 0.66* 0.69* 0.53* 0.53*
Public expenditure: irrigation & flood control (revenue + capital)
0.88* 0.82* 0.76* 0.72* 0.64* 0.55* 0.56* 0.54*
Private investment: agriculture
0.87* 1 0.81* 1 0.87* 1 0.88* 1
Public investment: agriculture & allied activities
0.14** 0.19** 0.30** 0.49* 0.52* 0.61* 0.41* 0.38*
Public investment: irrigation & flood control
0.83* 0.75* 0.59* 0.61* 0.54* 0.46* 0.48* 0.46*
Note: * and ** denote statistical significance at 1% and 5 % level of significance.
ReferencesBathla Seema, P K Joshi and Anjani Kumar (2020): Agricultural Growth and Rural
Poverty Reduction in India: Targeting Investments and Input Subsidies, Springer Nature, Singapore.
Bathla, S and Y Kumari (2017): “Investment Behaviour of Farmers across Indian States: Determinants and Impact on Agriculture Income,” Changing Contours of Indian Agriculture: Investments, Income and Non-farm Employment, Seema Bathla and Amaresh Dubey (eds), Singapore: Springer, pp 51–74.
Bisaliah, S, S M Dev, and S. Saifullah (2013): Investment in Indian Agriculture: Macro and Micro Evidences, New Delhi: Academic Foundation.
Chand, R (2000): “Emerging Trends and Regional Variations in Agricultural Investments and their Implications for Growth and Equity” Policy Paper, National Centre for Agricultural, Economics and Policy Research, New Delhi
Dantwala, M L (1986): “Strategy of Agricultural Development since Independence,” Indian Agricultural Development since Independence: A Collection of Essays M L Dantwala (eds),, Oxford and IBH Publishing Co, New Delhi.

The Journal of Governance – January 2022 / 67
Dhawan, B.D. (1998): Studies in Agricultural Investments and Rural Savings. New Delhi: Commonwealth Publishers.
Fan, S, A Gulati, and S Thorat (2008)“Investment, Subsidies, and Pro-Poor Growth in Rural India”. Agricultural Economics, Vol 30, No 2, pp 163–170.
Fan, S, P Hazell, and T Haque (2000): “Targeting Public Investments by Agroecological Zone to Achieve Growth and Poverty Alleviation Goals in Rural India,” Food Policy, Vol 25, No 4, pp. 411–428.
Gandhi, Vasant P (1990): “Investment Behaviour in Developing Countries: The Case of Agriculture in India,” Food Research Institute Studies, Vol 22, No1, pp 45-82.
GOI (1981 to 2016):Finance Accounts, Ministry of Finance. New Delhi. http://www.saiindia.gov.in/english/index.html
GOI-NAS (1980 to 2014): National Accounts Statistics. Ministry of Statistics and Programme Implementation, Central Statistical Organisation, New Delhi.
GOI-NSS (1998): Household capital expenditure during 1.7.91 to 30.6.92: Debt and Investment Survey, 48th Round, New Delhi: National Sample Survey Organisation, Ministry of Planning and Programme Implementation, Government of India.
(2006): Situation Assessment Survey during 1.7.2002 to 30.6.2003, 59th Round, New Delhi: National Sample Survey Organisation, Ministry of Planning and Programme Implementation, Government of India.
(2014): Key Indicators of Debt and Investment in India, 70th Round (2012–13), New Delhi: National Sample Survey Organisation, Ministry of Planning and Programme Implementation, Government of India.
Gulati A and S. Bathla (2002): “Capital Formation in Indian Agriculture: Trends, Composition and Implications for Growth,” NABARD Occasional Paper No 24, NABARD, Mumbai, India: https://www.nabard.org/demo/auth/writereaddata/File/OC%2024.pdf.
Gulati, Ashok., and P. Terway (2018): “Impact of Investments and Subsidies on Agricultural Growth and Poverty Reduction in India,” Supporting Indian Farms the Smart Way, A Gulati, Marco Ferroni and Yaun Zhou (eds), Academic Foundation and ICRIER, New Delhi.pp.343-367.
Kannan E, S Bathla, GK Das (2019): “Irrigation governance and performance of public irrigation system across the Indian states”, Paper accepted for publication Agricultural Economics Research Review, conference volume, Dec. 16-19, 2019.

68 / Synchronizing Public Investment in Agriculture with Capital Requirements of Farmers
Krishna Raj and GS Raychaudhuri (1986): “Trends in Rural Savings and Private Capital Formation in India,” World Bank Staff Working Paper No 382, The World Bank, Washington D.C., USA.
Kumar Anjani, Mishra AK, Saroj Sunil and Joshi PK (2017): “Institutional versus non- institutional credit to agricultural households in India: Evidence on Impact from a National Farmers’ Survey,” IFPRI Discussion Paper 01614, Washington D.C. http://ebrary.ifpri.org/utils/getfile/collection/p15738coll2/id/131084/filename/131295.pdf
Mishra SN and R Chand (1995): “Public and Private Capital Formation in Indian Agriculture: Comments on the Complementarity Hypothesis and Others,” Economic and Political Weekly, Vol 30, No 25: pp. A64-A79.
Mitra A (1996): “Public and Private Investments in Agriculture,” Agricultural Development Paradigm for the Ninth Plan under New Economic Environment, B.M. Desai (eds), New Delhi, Oxford and IBH.
Rao CH Hanumantha (1989): “Technological Change in Indian Agriculture: Emerging Trends and Perspectives”, Presidential Address delivered at the 49th Annual (Golden Jubilee) Conference of the Indian Society of Agricultural Economics, Indian Journal of Agricultural Economics, Vol 44, No 4, October-December.
Rath Nilakantha (1989): “Agricultural Growth and Investment in India,” Journal of Indian School of Political Economy,” Vol 1, No 1, January-June.
Shetty S L (1990): “Investment in Agriculture: Brief Review of Recent Trends”’, Economic and Political Weekly, Vol 25, No 7/8, pp. 389-398
*****

The Journal of Governance – January 2022 / 69
The Global ContextWater is an important sector in its own right, but at the same
time water is a part of almost any conceivable economic sector as well as the lifeline of the planet’s life-supporting system. The world’s water resources are increasingly under pressure and several nations are falling short on a safe and adequate supply of fresh water for the vast majority of the population. As per the assessment of the United Nations (2019) among almost 7.7 billion residents of this world, more than 2 billion live in such countries that are going through severe water stress situations. One out of nine persons in today’s world lack access to safe water. Moreover, by 2050, one out of four persons is likely to reside in a country with chronic or recurring water shortages. It is often said that the human body needs water before it needs food. The reality is that we need a lot of water to produce sufficient and healthy food. Agriculture is by far the world’s largest water user (70 per cent of total water withdrawn each year) but the limits to using new water have largely been reached or breached and the competition between uses and users is increasing. Yet, globally only about 20 per cent of the world’s farmland is irrigated with water from rivers, lakes, and groundwater for watering the crops, meaning millions still must count on increasingly unreliable and erratic rainfall for their harvests. Moreover, this is only at risk of getting much worse, as population and water demands grow whilst climate change increases the severity and number of floods and droughts in many parts of the world, but especially in vulnerable developing countries.
Bharat Sharma
A Pragmatic Water Vision for IndiaBalancing Water for Food and for Growth

70 / A Pragmatic Water Vision for India Balancing Water for Food and for Growth
Our rivers and water bodies are our life-supporting assets. However, these are increasingly being depleted, polluted, and contaminated due to the rapid pace of urbanization, industrialization, and over appropriation with scant consideration even for the minimum environmental flows. Considering the graveness of the situation, the UN declared ‘ensuring access to water and sanitation for all’ as one of its Sustainable Development Goal (SDG 6). Society is both the cause, beneficiary, and victim of this unprecedented global challenge, which is more severe for developing, populous and water-stressed countries in Asia and Africa. Still, we plan for development and growth assuming that water will be there when and where it is needed – and that the water sector will simply catch up with the rest of the economy. Nevertheless, the water sector is not catching up. This is happening even though 78 per cent of jobs globally are either heavily or moderately water-dependent and there is a 7:1 return on the provision of adequate water, sanitation, and hygiene (World Water Development Report, 2016).
The Challenges: Water Situation in IndiaIndia is already experiencing seasonal and long-term water
shortages in several cities, select sub-basins and large watersheds due to unprecedented stress on limited water resources brought about by population growth, rapid urbanization, increasing industrialization, changing lifestyle patterns, and climate change. The situation is exacerbated by low water use efficiency in agriculture and other sectors and serious pollution of its surface and groundwater resources. A recent report by the Niti Aayog cautions “by 2030, the country’s water demand is projected to be twice the available supply and the deficit shall cause six per cent loss in the country’s GDP; India is facing a national groundwater crisis with 54 cent of wells declining in water level due to exploitative groundwater use; already 600 million people face high to extreme water stress; 75 per cent of households do not have drinking water on-premises and 84 per cent of rural households do not have piped water access (NITI, 2019)”.

The Journal of Governance – January 2022 / 71
Out of the 1999.2 Billion Cubic Metres (BCM) of total annual water resources in 20 major river basins, only about 1122 BCM can be utilized - 690 BCM through surface water and 432 BCM through groundwater. Studies predict that several basins (Indus, Sabarmati, Pennar, Krishna, and more) will reach ‘physical water-scarce ‘conditions by 2050, where the remaining utilizable water supply cannot be further developed without making a severe impact on the environment and riverine water users downstream. The current consumption in the country estimated in 2009 was about 793 BCM and will exceed all sources of supply by 2050. Since 1951, India’s per capita water availability decreased from about 5178 m3 to 1544 m3 in 2011 (GoI 2017, Fig. 1). India is fast moving from being a water-stressed country to a water-scarce country. Figure 1: Decline in annual per capita water availability in India
(GoI, 2017)
The most worrisome feature of Indian water resources is that the available resources are shrinking quantitatively due to infrastructure inadequacies and exploitative extractions and weak policies, regulations, and insufficient funds; and qualitatively due to widespread pollution, contamination, and decay of rivers, water bodies, wetlands, and groundwater resources. The gap is widening at all three levels – the gap between availability and utilization of the resources, the gap between potential created and utilized, and

72 / A Pragmatic Water Vision for India Balancing Water for Food and for Growth
the gap between demand and supply of the resources (Gulati et al., 2019). Some of the important concerns include the following:
• Low and shrinking large water storagesIndia can be water-secure only when it manages its monsoons
water well – save and store water when in excess in the rainy season and use the saved water prudently in the dry season. With large public expenditure and strong government support for the large public surface storage and irrigation during the initial five decades of planned development, canal irrigation enjoyed a place of eminence and pride. Before the country achieved a stage of adequacy, the pace of construction was interrupted by a shift in priority, settlement issues for the project displaced people, drying up of multilateral funding, environmental concerns, and other related factors. As a consequence, the dam capacity per capita of India stagnated at abysmally low levels. In 2019, India’s per capita water storage capacity was 188 m3 as against 576 m3 in China. As compared to other BRICS countries, India is ahead only of Indonesia – other countries fare much better than India (Fig. 2). While India’s average rainfall is 1.8 times that of China, China’s per capita water storage to make it water-secure is more than 3 times that of India.Figure 2: Dam storage capacity per capita for BRIICS and some
selected countries
That means India could and should do better in terms of increasing its water storage capacity. Besides the agricultural

The Journal of Governance – January 2022 / 73
distress, poor urban planning has turned the monsoon into a major seasonal problem for our cities, towns, and villages causing huge economic and life, and livelihood losses and spikes in the spread of water-borne diseases and epidemics.
• Shrinking of canal command areas Until the early seventies, canal water was the main source of
irrigation and even domestic and industrial water needs. However, widespread sub-optimal operations and management, poor maintenance, and an unwieldy financial model for the system led to its deterioration and a large gap in the creation and utilization of the irrigation potential. Despite the massive public investments, the Compound Annual Growth Rate (CAGR) of canal systems that grew at 7.29 per cent up to 1974-75, reduced to negative and now stands at lowly 0.52 per cent for the period up to 2014-15 (Fig, 3). The gap between potential created and utilized is higher for the major and medium systems as compared to the minor irrigation systems (Gulati et al., 2019). Figure 3: Compound Annual Growth Rate (CAGR) of the canal,
groundwater, and net irrigated area in India during 1950-51 to 2014-15
Several old and new initiatives like Canal Command Area Development (CAD), establishment of Water User Associations (WUAs), Accelerated Irrigation Benefit Program (AIBP), and
74 / A Pragmatic Water Vision for India Balancing Water for Food and for Growth
even the most recent Pradhan Mantri Krishi Sinchayee Yojana (PMKSY) have not been able to address the maladies of the canal irrigation system. Besides its on-demand availability, the sub-optimal performance of the canal irrigation system led to wide-scale development and over-exploitation of the national groundwater resources.
• Decline and depletion of groundwater resourcesAll of the water use sectors in India are now critically
dependent upon groundwater resources. About 64 per cent of the irrigation demand, 85 per cent of the rural drinking water need, and more than 50 per cent of the urban water need, and 85 per cent of the industrial water need is met from groundwater. It is estimated that about 9 per cent of the national GDP is directly linked to groundwater. As per recent estimates of CGWB, India’s extraction of 250 BCM of groundwater through more than 20 million private wells and tube wells is the largest in the world – more than a quarter of the global total of 982 BCM. Relentless and unplanned extraction of groundwater exceeding the average annual recharge has resulted in widespread decline of the water tables, reduced availability of water in the wells, and degradation of the resource manifested through contamination with heavy metals (iron, arsenic, chromium, etc.) and fluoride. The recent assessment reveals that about 16 per cent of the total 6000 groundwater assessment units of the country are affected by over-exploitation and are in the ‘critical’/ ‘semi-critical’ stage of groundwater development (CGWB, 2017). The average decline in the water table in northwest Indian states of Punjab, Haryana, Rajasthan, and western UP was 0.37 m per year compromising the hydrological sustainability of the food grain production. Extraction of water from deeper depths causes frequent well failures, higher costs of well construction, and higher costs on diesel and electric energy. The situation is further complicated with the populist state policies of free or highly subsidized energy supply for irrigation leaving little incentive for groundwater or energy conservation (Sharma and Ambili, 2010).

The Journal of Governance – January 2022 / 75
• Low water productivity and export of water-intensive commodities
Water Use Efficiency (WUE) of India at the national level is estimated by FAO as the sum of the efficiencies in the major economic sectors (agriculture, industry, and services weighted according to the proportion of water withdrawn by each sector over the total withdrawals). Overall WUE in India at USD 1.9/m3 as compared to USD 14.9/ m3 in South Africa, USD 16.7/ m3 in China, USD 21.2/ m3 in Brazil, and USD 281.1/m3 in the United Kingdom is one of the lowest in the world. Though water use efficiency is poor in all three sectors, it is abysmally low (USD 0.3/m3) in agriculture which is also the largest consumer of water (ADB, 2016).
Comparing the physical water productivity as well as irrigation water productivity of the three main irrigated crops of rice, wheat, and sugarcane with their corresponding land productivity across major states, one can find significant misalignments in the cropping patterns and available water resources (Fig. 4, Sharma et al., 2018). Irrigation water productivity of rice in the most food-surplus states of Punjab and Haryana is the lowest at 0.22 kg/m3 indicating inefficient use and thus depletion of water resources. Similarly, irrigation water productivity of sugarcane in the sub-tropical belts of Maharashtra, Tamil Nadu, Karnataka, and Andhra Pradesh is very poor and thus creates water scarcity for other crops and economic sectors. The irrigation water needs for excessive wheat and rice production in the northwestern states of Punjab, Haryana, western Uttar Pradesh, and parts of Rajasthan are very high ( > 3000- 4000 mm/ annum) due to low rainfall, high temperatures, and porous sandy soils; but this region receives near 100 per cent highly subsidized irrigation. On the other hand, the field crops in Bihar, eastern Uttar Pradesh, Chhattisgarh, Jharkhand, and Odisha have small but critical water needs due to good rainfall, moderate seasons, and good fertile soils. However, these regions remain water-starved during critical periods due to poor irrigation infrastructure and high costs of diesel-based irrigation. As such, the agricultural yields are low, the cost of
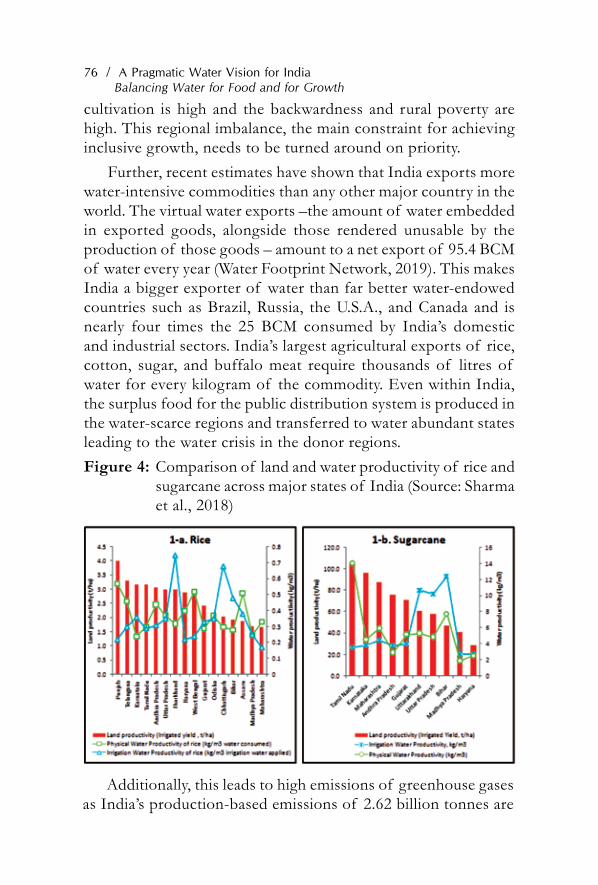
76 / A Pragmatic Water Vision for India Balancing Water for Food and for Growth
cultivation is high and the backwardness and rural poverty are high. This regional imbalance, the main constraint for achieving inclusive growth, needs to be turned around on priority.
Further, recent estimates have shown that India exports more water-intensive commodities than any other major country in the world. The virtual water exports –the amount of water embedded in exported goods, alongside those rendered unusable by the production of those goods – amount to a net export of 95.4 BCM of water every year (Water Footprint Network, 2019). This makes India a bigger exporter of water than far better water-endowed countries such as Brazil, Russia, the U.S.A., and Canada and is nearly four times the 25 BCM consumed by India’s domestic and industrial sectors. India’s largest agricultural exports of rice, cotton, sugar, and buffalo meat require thousands of litres of water for every kilogram of the commodity. Even within India, the surplus food for the public distribution system is produced in the water-scarce regions and transferred to water abundant states leading to the water crisis in the donor regions.Figure 4: Comparison of land and water productivity of rice and
sugarcane across major states of India (Source: Sharma et al., 2018)
Additionally, this leads to high emissions of greenhouse gases as India’s production-based emissions of 2.62 billion tonnes are

The Journal of Governance – January 2022 / 77
higher than its consumption-based emissions of 2.35 billion tonnes of CO2eq. This mismatch needs to be reversed through appropriate technical measures, and support, and trade policies (Sharma et al. 2021).
• Wastewater and water pollutionEnhanced water scarcity is caused both by the actual scarcity
of the resource per se and by the progressive deterioration of water quality in several metropolitan regions and the aquifers and basins, reducing the quantity of water that is safe to use. Water pollution is a serious problem In India as almost 70 per cent of its surface water resources and a growing number of groundwater aquifers are contaminated with biological, organic, inorganic, and toxic pollutants (NITI Aayog, 2018). As per the recent assessment by the Central Pollution Control Board of India (CPCB, 2018), there are 351 polluted river stretches in the country (up from 302 in 2015) with 45 of them critically polluted. The estimated polluted riverine length in India is 12,363 km, about 5 times the length of the Ganga main stem.
Estimates show that out of all the freshwater that is withdrawn, only 44 per cent is consumed, and the remaining 56 per cent with highly deteriorated quality is released to the environment as urban wastewater, industrial effluents, and agricultural drainage. More than 38,000 million litres of urban wastewater go into major rivers, water bodies and even percolates into the underground aquifers every day. Over and above there are massive industrial effluents and the raw sewage from rural areas, and polluted waters from agricultural fields and livestock rearing, which is generally much large as compared to domestic and industrial effluents – no estimates are available for these sources of pollution. Rapid urbanization, industrialization, and intensification of agriculture through higher use of inorganic fertilisers and pesticides and with only limited infrastructure and capacity for water treatment (presently only 37 per cent of total wastewater is treated) will further increase the degradation of the resource. The conditions shall become extremely challenging if adequate measures are not

78 / A Pragmatic Water Vision for India Balancing Water for Food and for Growth
put in place as per the existing global standards and the polluting outputs from agriculture are reused and recycled through a circular agricultural economy.
• Water and healthThe issues of health and well-being of society are closely
linked to an adequate water supply and functional sanitation systems. Despite the headway made in the last 15 years, several challenges remain. India continues to face significant challenges in the provision of quality water, sanitation, solid waste management, and drainage. Inequality in access is acute, with more than 90 per cent of urban residents accessing sanitation facilities compared to only 39 per cent in rural India. The World Bank estimates that 21 per cent of communicable diseases in India are linked to unsafe water and the lack of hygiene practices. Further, more than 500 children under the age of five die each day from diarrhoea in India. About 99 million people lack access to safe water.
In purchasing power parity (PPP) terms, the adverse economic impact of inadequate sanitation in India was USD 161 billion or USD 144 per person. The health-related economic impact of inadequate sanitation was Rs. 1.75 trillion, which was 72 per cent of the total impact. Diarrhoea caused mainly by poor quality water is the largest contributor and amounts to two-thirds of the total health impact (WSP, 2011). The other water-related diseases are dengue fever and encephalitis, which occur with high severity during and after the rainy season each year. Unfortunately, the impacts are disproportionately higher on the poor families as they tend to lose wages and spend precious resources on treating illness. Research has shown that in developing countries investments in safe and adequate water supply and sanitation reap a high benefit – at least 5 times greater than the amount invested (Hutton, Haller and Bartram, 2007).
Water and disasters in IndiaClimate change is increasing the frequency and severity of
extreme weather events. India is staring at extremes of ‘too
The Journal of Governance – January 2022 / 79
little and too much’ rainfall with a menacing regularity (Box 1). Significant drought conditions even before the onset of summers and extreme floods in unexpected locations during the monsoons are fast becoming a new normal. Changes to the coastline are already affecting livelihood sources and will be hotspots for vulnerability in the future. A 26-year study of the Indian shoreline from 1990 to 2016 shows that a third of the coast is seeing erosion, 38 per cent is stable and the rest is accreting. West Bengal is the worst affected with 63 per cent of its coastline eroding. A critical aspect is that disaster risk is rapidly urbanizing and will affect everyone. In recent years, it is urban flooding in particular that has made headlines in Bhopal, Chennai, Mumbai, and Srinagar, among others. Within the growing urban vulnerability, it is the poor and those who live in informal settlements (slums) that will be the hardest hit. There are close to 14 million slum households across India (Census 2011). Himalayan glaciers are melting, with serious implications for the whole region. These water-related disasters wipe out the hard-won development gains especially in the less developed eastern and north-eastern states and recurrent small-scale stresses keep vulnerable families in a cycle of poverty. There were 1.35 million new displacements due to disasters in India in 2017 alone.
Annually, around 2 per cent of the national GDP is lost due to water-related disasters. India suffered a whopping USD 79.5 billion economic loss due to climate-related disasters in the last 20 years. The period from 1998-2017 has seen a dramatic rise of 151 per cent of direct economic losses from climate-related disasters (UNO, 2018). Reducing the economic losses from disasters has the power to transform lives and contribute greatly to inclusive development and eradication of poverty. Integrating disaster risk reduction into investment decisions is the most cost-effective way to reduce these water-related risks.

80 / A Pragmatic Water Vision for India Balancing Water for Food and for Growth
Legal and policy framework for water in IndiaThe current legal framework about water in India is spread
across a variety of instruments, legislations, legal principles, and judicial precedents, not necessarily in harmony with each other. Water is largely a state subject with the authority of the centre to regulate the development of inter-state rivers and settle inter-state and international water disputes and cooperation. The process of approval and construction of major and medium projects is highly inefficient and seriously hampered by poor technical and financial management and accountability causing high cost and time over-runs and poor output delivery. Groundwater – the most widely exploited water resource in the country – continues to be perceived as an individual property rather than a community resource and without any effective regulation. The water resource is generally wielded as a political tool for the populist policies by
Impacts of Climate Change on Water Resources in India• Climate change scenarios for 2030s indicate an overall warming for
all the regions causing higher water needs. The net increase in annual temperatures ranges between 1.70 C – 2.2o C. The extreme maximum and minimum temperatures are also projected to increase.
• All the regions are projected to experience an increase in precipitation in 2030s with respect to 1970s and the maximum increase in the Himalayan region and minimum increase in the North Eastern region. The extreme precipitation events are likely to increase by 5-10 days in all the regions.
• Sea level along the Indian coast has been rising at the rate of 1.3mm/year and is likely to rise in consonance with the global sea level rise in the future with increasing cyclonic intensity.
• Water yield is projected to increase in the Himalayan region in 2030s by 5-20 per cent, however, likely to be variable across the North Eastern region, Western Ghats and Coastal region.
• Moderate to extreme drought severity is projected in 2030s for the Himalayan region, as compared to the other regions. All the regions are likely to experience flooding which are exceeding existing magnitudes by 10 per cent to 30 per cent.
Source: www.moef.nic.in

The Journal of Governance – January 2022 / 81
providing free or highly subsidized canal water and energy for pumping the groundwater leaving little incentive for water and energy conservation by the largest sections of the water users. As such, the existing water infrastructures are sluggishly developed, inadequately maintained, and poorly managed to lead to wastage and underutilization of the available resources. All this needs to change immediately and the time to act is now.
As discussed in the foregoing sections, India is most likely to face a conflicted and challenging future concerning water resources development and management in the coming decades. The water crisis is already underway and its impending impact will require consideration in all sectors from agriculture to construction, from manufacturing to services, and from urban planning to rural development. Efficient management of water resources is crucial to poverty alleviation, inclusive development, and food and livelihood, and environmental security. Water policy in India over the next few decades will have to focus on equitable access, better management; enabling rapid strides in water conservation, reuse, and recycling, building an institutional regime that operationalizes efficiency and cooperation, and minimizes water stress and conflicts. Such a water policy for a progressive India needs to be based upon ‘A New Water Vision for India @ 75’.
India Water Vision – 2035There have been some efforts by the government, and other
institutions to develop a national water vision for India. Bilateral donors have also helped few states to develop the state water vision. The present government has appreciated the need to develop Vision Documents for each of the important sectors of national development to charter the growth and investment trajectories to realize the enshrined vision during a targeted timeframe of the next 15 years.
The First National Water Policy (NWP, 1987) emphasized that “water is a prime natural resource, a basic human need, and a precious national asset. Planning, development, and management of water resources need to be governed by national perspectives”.

82 / A Pragmatic Water Vision for India Balancing Water for Food and for Growth
The action plan for realizing the tenets of the policy was not strong and most of the recommendations remained in limbo. In the meantime, water stress became more daunting in large parts of the country, water governance issues were not addressed, supplies for safe water for drinking and domestic needs were inadequate, rivers and water bodies started decaying due to severe pollution and direct discharge of the untreated wastewater, groundwater was hugely over-exploited, irrigation infrastructure was poorly managed and maintained and a holistic and inter-disciplinary approach at water-related problems was missing. To address some of these concerns a new National Water Policy (2012) was developed. The new NWP received several criticisms including “the draft is a slight improvement on the 2002 policy, but it is no more than ‘slight”, and “the issue is not about the objectives of the policy, but of instruments to translate the policies (intentions) into actions on the ground”. Based on this criticism and to address the emerging challenges holistically the government has constituted an expert committee in September 2019 to update the NWP,2012.
For the first time, the India Water Vision 2025 was initiated by Global Water Partnership (GWP) and by the South Asia Technical Advisory Committee of the GWP (IWP & IHD, 2000). This vision represented a ‘desirable future’ and was neither a forecast nor a projection. Two scenarios were considered for the Vision- ‘Business as Usual (BAU)’ and ‘Sustainable Water World (SWW)’. There was no specific vision statement, but the key vision components included important elements for resource sustainability. The total water demand for 2025 was estimated at 1027 BCM. This will necessitate an investment outlay of Rs. 5,000 billion during the next 25 years or about Rs. 200 billion per year (1997 prices). Such massive investments in new projects should be planned within the framework of an integrated scheme for river basin development plan. Further, the development of water resource projects would require explicit assessment of the environment and social impacts.
During the same time, the Ministry of Water Resources,

The Journal of Governance – January 2022 / 83
Government of India presented a detailed report of the National Commission on Integrated Water Resources Development (NCIWRD, 1999) which also estimated the water requirements of the different sectors for the periods of 2025 and 2050 under ‘High Demand’ and ‘Low Demand’ scenarios (Table 1). These requirements were at variance from the previous estimates and also highlighted the need for revision as new knowledge and more robust data are made available for future projections.Table 1. Present and estimated future water requirements by different sectors in India*
Uses Year 2010 Year 2025 Year 2050Total Water
UseRequirement % Requirement % Requirement %
Irrigation 557 78 611 72 807 68Domestic 43 6 62 7 111 9Industries 37 5 67 8 81 7Others ** 73 11 103 12 181 16Total 710 100 843 100 1180 100
* (High demand scenario, NCIWRD, 1999); **Others (Power, navigation, ecology, evaporation losses)
Based on these discussions, the Ministry of Water Resources, Government of India developed a vision for Integrated Water Resources Development and Management for the country (MoWR, GoI, 2003). The objectives enshrined in this vision are designed to be achieved by adopting a systematic policy focus, administrative initiatives, and enacting suitable legal instruments. Some progressive Indian states like Andhra Pradesh (GoAP, 2012) and Maharashtra (WRD, 2020) also developed their water visions.
• Development of India Water Vision – 2035Increasing population and urbanization, growing regional
water scarcities, changing land and water use patterns, increasing competition for water by different sectors, large scale pollution and contamination of surface and groundwater resources, and impending climate change scenarios have put serious challenges
84 / A Pragmatic Water Vision for India Balancing Water for Food and for Growth
over India’s ability to provide additional water to meet the growing demands. The government took note of the seriousness of the situation and rejuvenated its ministerial set up first by renovating it as “Ministry of Water Resources, River Development, and Ganga Rejuvenation” in 2015 and then to manage the subject more comprehensively through empowering it as “Ministry of Jal Shakti” in 2019.
During the budget speech of 2018, the Finance Minister of India stated that “In Indian ethos, anything which is good is supposed to bestow, cause, create and do good in all ten directions (Physical and Social Infrastructure for USD 10 trillion economy, Digital India, Pollution Free Nation, Generate Massive Employment, Clean Rivers, Blue Economy, Accelerated Space Program, Food Sufficiency, Healthy India and delivery through Team India). For the water dimension, our rivers and water bodies are our life-supporting assets and the government has worked vigorously for cleaning river Ganga”. Water Vision for India of 2030 is:
Clean Rivers, with safe drinking water to all Indians, sustaining and nourishing life and efficient use of water in irrigation using micro-irrigation techniques.
At almost the same time, the NITI Aayog of the Government of India (NITI, 2018) while releasing its first report on “Composite Water Management Index (CWMI)” for the country and its major states stressed that India is currently suffering the worst of the water crisis in history as 600 million of its population face high to extreme water stress, 84 per cent of rural households do not have piped water access and 70 per cent of the water resources were contaminated. CWMI, a comprehensive tool based on nine broad sectors and 28 indicators, indicated that all states need to perform better as more than 50 per cent of the population faced high water risk and also the food security risk in India. There is a growing national groundwater crisis, water quality remains a major challenge and urban access also suffers from significant gaps as India’s water treatment capacity is only about 33 per cent.
Given all these major challenges related to the poor state

The Journal of Governance – January 2022 / 85
of India’s water resources, India needs a new Water Vision and innovative technologies; robust policies, mechanisms, and institutions, and adequate resources to reverse the past trends and ensure water security for all. The proposed new India Water Vision 2035 statement is given below:
India Water Vision 2035
To develop a water secure India through provision of safe and adequate water for all its citizens, agriculture and industries while rejuvenating the rivers, aquifers and ecology for a climate-resilient transformative development.
• Perspectives for India Water Vision – 2035Different sections and strata of the society have their
perspectives on how water should be managed and supplied and there are strengths in each of these perspectives. As water is global in its origin but local in its availability and use and varies a great deal, we need an integrated or a confluence of the perspectives depending on the situation (Fig. 5). A brief explanation shall be helpful to appreciate this important context :
Fig. 5: Important societal perspectives for the new India Water Vision-2035 (Based on UNICEF, 2013 report)

86 / A Pragmatic Water Vision for India Balancing Water for Food and for Growth
i. The Rights Perspective demands that water is a fundamental human right and the state must supply it. Communities may also have traditional rights of access to rivers, lakes, springs, ponds and tanks, and other traditional sources. The Supreme Court of India has also supported this perspective in favour of the citizens.
ii. The Social Justice/ Equity Perspective is concerned with equity in water availability in rural and urban areas and within the same city for slum areas/ colonies and affluent communities. Injustices to poor communities, who generally pay higher time and economic costs for meagre supplies, and those displaced by project development without proper resettlement must be addressed amicably. Inequities also in the supply of irrigation water between ‘head’ and ‘tail’ reaches of the irrigation command is a matter of concern. This is the core asset for inclusive development.
iii. The Gender Perspective demands that women, girls, and small children always bear the burden of domestic water provisioning under difficult situations and thus waste their productive time, opportunities for growth as well higher exposure to the risks.
iv. The Community Perspective questions the ownership of the community versus the state and needs empowerment for management of the common pool resources, active participation in water project planning, augmentation and distribution rules and rights for incentives, specific uses, and sanctions for misuse.
v. The State Perspective is concerned with developing water vision and water policies, legislation, governance, administration, regulation of water supplies, resolving conflicts and concerns and facilitating cooperation at all levels, enforcing quality standards, raise the concerns for ecology and environment, and other silent stakeholders, priority in allocation; managing water-related disasters, epidemics and emergencies, supporting the use of innovation and science and technology and allocation of the budgetary provisions.
The Journal of Governance – January 2022 / 87
vi. The Economic Perspective views water as an economic good and an important input for economic activities like food production, services and manufacturing industries, hydropower generation, navigation, and leisure and entertainment. The resource should be subject to water markets for water trade, economic pricing of the resource and the water services; the enhanced role of the private sector for water resource development, application, treatment, and supply services; support to micro-irrigation and other innovations and efficient co-management of water and energy and other related policies.Besides these there may be other perspectives related to the
role of water for meeting the cultural, aesthetic, and environmental needs; water for nature and all the life forms, water for health and well-being; water for livelihood needs, and so on. While formulating the water policy, action plan and programs, and projects for ensuring ‘water security for all’ a single and standalone perspective will not be helpful. A right combination of these perspectives addressing the dominant concerns and suggestions in a context and location-specific to harness the opportunities shall help in an early realization of the main elements of the Water Vision.
• Harnessing the Opportunities: Realising Main Elements of the India Water Vision
Key elements of the vision shall include:
Water for Life- Domestic WaterThe main element in the vision is to “provide safe and adequate
water for all its citizens” which can be realized through: i. Safe, affordable, and adequate water supplies in/close
to the premises of all the citizens to meet the drinking, domestic, livelihoods, and sanitation needs.
ii. To eliminate/minimize all water-borne and water-related diseases and epidemics, especially for children, tribal and vulnerable communities.
iii. Put in place infrastructure, programs, and policies for

88 / A Pragmatic Water Vision for India Balancing Water for Food and for Growth
the treatment and safe disposal/ reuse of sewage and wastewater for a circular economy.
Water for life shall always have priority over all other uses of water and this must be reflected in sectoral allocations. Presently, the share of domestic water in India is a meagre 7 per cent of the total consumption, as compared to 12.2 per cent in China and 23 per cent in Brazil. This causes annual cycles of water stress, water crises, and emergency measures in a growing number of cities and towns and an increasingly large number of villages whose voices are less heard. Long queues at the water posts and the water tankers must end. The tragedy is that the poorest are hit the hardest and often end up paying higher costs than the affluent. The inequity in supply also has a strong rural-urban bias as only 18 per cent of the rural households have piped water supply as compared to 71 per cent in the urban areas. The domestic water problem, more often than not, is a problem of access rather than lack of availability. As urbanization and economic growth expand fast, the urban local water bodies and the Panchyati Raj institutions must be empowered technically and financially to address this problem on priority. Dedicated sources of water need to be identified, modern delivery infrastructure put in place, and managed and maintained professionally. The political chauvinism of free or highly subsidized water supplies even to the affluent societies at the cost of investments to serve the poor need to be checked.
The second aspect of the supply of drinking water is the ‘safe water’ or the quality of the supplied water which is at dangerous levels for a large population. When supplies are inadequate and uncertain, the quality is the first casualty. Safe supplies can be ensured only after proper treatment, which needs technology and investments. In the absence of these a growing population, especially the children will continue to suffer from water-borne diseases and epidemics. Suitable measures to minimize the spread of other water-related diseases like encephalitis, dengue, malaria, and tuberculosis may be properly emphasized in the programs and projects.

The Journal of Governance – January 2022 / 89
Estimates show that out of all the freshwater, only 44 per cent is consumed and the remaining 56 per cent with highly deteriorated quality is released to the environment with a major contribution from the urban sewage and wastewater. Our treatment capacity of the sewage water is limited as only 37 per cent of the wastewater is treated and the rest is directly discharged into rivers and water bodies seriously affecting their health and ecology. All sewage water must be treated before it is either reused or discharged. Suitable and affordable technical options are now available to convert the ‘waste’ into a ‘resource’ through resource recovery and reuse (RRR) principle and usher into the new and sustainable era of ‘circular economy.’
Water for Food – Agricultural WaterAgriculture is the largest user of freshwater in India- above 80
per cent of the total freshwater withdrawals leaving little water to meet the growing demands of other sectors. Water for agriculture is indeed central to ensure food security for all and reduce rural poverty but its management needs fresh thinking and some bold initiatives. The new water vision envisages to “achieving complete food security and nutrition while sustainably managing available water resources” through:
i. Improving land and water productivity of agriculture for all crops and commodities (including livestock and fisheries) and at all levels and regions.
ii. Align cropping systems with the agro-ecosystems through technical, economic, and policy and trade instruments.
iii. Leveraging science & technology and policies for efficient use of the water resources in agriculture.
iv. Manage the groundwater resources to bring its use within the permissible limits in the over-exploited areas and encourage its beneficial use in the underutilised regions. Maintain high levels of groundwater quality and restrict the use of contaminated waters.
v. Reducing distress and improving competence, resilience,

90 / A Pragmatic Water Vision for India Balancing Water for Food and for Growth
and incomes of the rainfed farmers both under stress and excess conditions.
There are three main reasons for which efficient use of water in agriculture in India is crucial. The first one is the large dependency of the rural economy on the Indian monsoon, as Indian agriculture remains vulnerable to monsoon shocks. Though Indian has the largest irrigated area in the world, its share is about 50 per cent of the total cultivated area in India. The second important factor is the scarcity of water resources, as water demands in India will exceed all sources of supply by 2050. The third one relates to the fact that India’s water demand patterns are fast changing. The demand for water for non-irrigation sectors is growing rapidly – domestic sector by 2.6 times, energy by 3.7 times, and industry by 2.2 times. The additional water demands can be met only by making the use of water in agriculture more efficient. As a comparison, China has already set its national target of total irrigation water use at 372 BCM by 2020 (~ 65 per cent of total withdrawal, Doczi et. al., 2014) and 373 BCM by 2030. To control total water use for irrigation, improving irrigation efficiency and reducing irrigation quota through enhanced use of pipe irrigation, micro and sprinkler irrigation for which private sector shall play a bigger role. The interesting part is that agricultural production shall increase significantly despite the lower allocations – creating a win-win situation (Hu, 2016). The more food we produce with the same amount of water, the less is the need for infrastructure development and the less the competition for water.
Water intensive crops of paddy and sugarcane use more than 60 per cent of the total irrigation water in India with very low irrigation water productivity (IWP of rice in Punjab and Haryana – 0.22 kg/m3 ) leaving little irrigation water for other crops and commodities, and as such land and water productivity of most crops is low, despite the large cultivated areas. Additionally, estimates have shown that India exports more water-intensive goods (rice, sugar, cotton, buffalo meat) than any other country in the world. Virtual water flows amount to a net 95.4 BCM a year- four times the water used by Indian households and industries.

The Journal of Governance – January 2022 / 91
Second, there is a mismatch in the selection of crops and the water availability in the region. Cropping pattern changes that are independent of water availability are leading to high water stress followed by heavy reliance on groundwater and its indiscriminate exploitation. This is exacerbated by populist energy policies of free supply and assured support prices for procurement. Excessive cultivation of paddy in Punjab and Haryana and sugarcane in Maharashtra and dry regions of Karnataka is hydrologically and financially unviable. Suitable technical, trade, and economic instruments need to be devised and employed to arrest the worsening trends (Sharma et al., 2018, Gulati et al., 2019).
India’s surface irrigation systems, especially the major and medium projects, suffer from a host of inefficiencies at all levels of planning, construction, operations, management, and maintenance and as such there are glaring gaps in the irrigation potentials created by the agencies and those utilized by the intended farmers and that too with low efficiency. The system needs total overhaul and up-gradation through a further acceleration of the ongoing programs like “Prioritised Accelerated Irrigation Benefit Program”, use of underground pipeline system to overcome the issue of land acquisition at the farm level, targeting the underprivileged geographies first where small irrigation shall make large differences; aggressive use of ICT, data platforms and project management systems to improve the irrigation project performance; lay more emphasis on ‘management' of the systems rather on just construction of the systems, and possibly unshackle the irrigation sector by transforming it as public good infrastructure (Gulati et al., 2019).
Food security in India is now critically dependent on its groundwater resources as about 64 per cent of irrigation demand is met through groundwater albeit with large negative externalities in the intensively irrigated areas. Relentless and unplanned extraction of groundwater has resulted in irrecoverable damage and depletion of the natural resource. There are no easy solutions to harness all the benefits of the resource and also to maintain its natural sanctity. The agriculture sector and other users shall
92 / A Pragmatic Water Vision for India Balancing Water for Food and for Growth
benefit from the amendment of the historical Land Easement Act which renders groundwater as a private resource, price reforms in the power sector to bring semblance to its over-exploitation or direct benefit transfer of power subsidy, realigning the cropping pattern for sustainable groundwater use and productivity, faster and wide-scale adoption of best sustainable groundwater use and water-saving practices like drip and sprinkler irrigation, laser land levelling, conservation agriculture practices, solar irrigation and sensitizing the community about the impending threats of overuse of the resource (Shah et al., 2008, Saha et. al., 2017).
The focus of agricultural innovation has largely been on irrigated grains and cash crops while dryland regions supporting a large number of poor farmers and livestock remain neglected. Drylands have always been under distress mainly due to the non-availability of water when it is most needed. Water availability and access is a trigger for the adoption of other yield improving levers like increased use of fertilisers, adoption of high yielding varieties, and disease and pest management in the rainfed lands. Watershed programs have shown some promise but their implementation on the scale to cover a large number of small and marginal farmers having limited assets remains a challenge. The priority shall be to harvest, conserve and efficiently use the harvested water to convert at least a part of the holding to cultivate high-value crops to assure the livelihoods, and then convert the remaining part for rainfed horticulture, silviculture and agro-forestry, improved pastures, livestock and dairy production, medicinal and herbal plantations and other rural enterprises. These should be supported by other livelihood options through the formation of self-help groups and supportive employment under non-farm activities during lean periods. Rainfed farmers should be increasingly covered through instruments of risk mitigation.
Policies for reducing water distress in agriculture have to focus on all fronts – ensuring that our food procurement policies are revised to incentivise low-water consuming crops, that our agricultural energy policies are tweaked to provide smarter incentives for sustainable groundwater extraction, and that
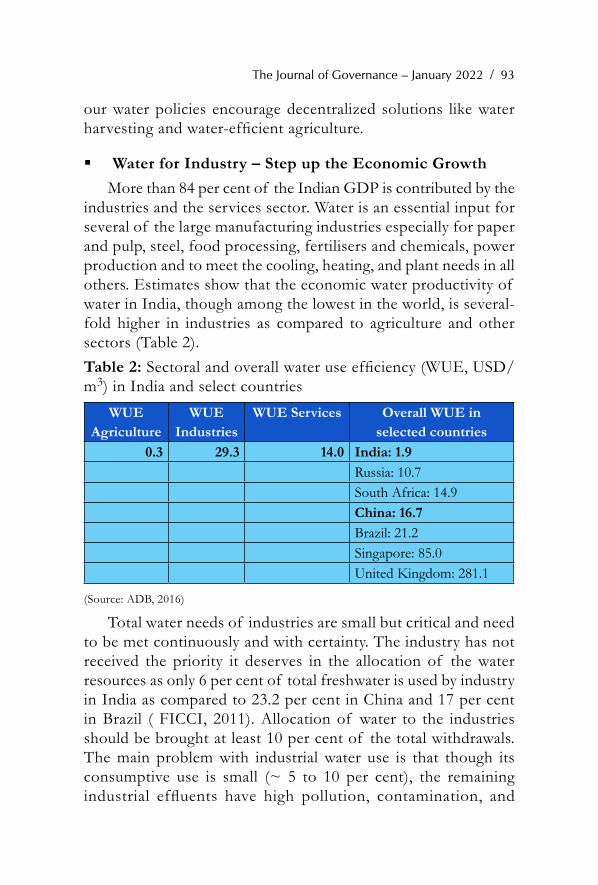
The Journal of Governance – January 2022 / 93
our water policies encourage decentralized solutions like water harvesting and water-efficient agriculture.
Water for Industry – Step up the Economic GrowthMore than 84 per cent of the Indian GDP is contributed by the
industries and the services sector. Water is an essential input for several of the large manufacturing industries especially for paper and pulp, steel, food processing, fertilisers and chemicals, power production and to meet the cooling, heating, and plant needs in all others. Estimates show that the economic water productivity of water in India, though among the lowest in the world, is several-fold higher in industries as compared to agriculture and other sectors (Table 2). Table 2: Sectoral and overall water use efficiency (WUE, USD/m3) in India and select countries
WUE Agriculture
WUE Industries
WUE Services Overall WUE in selected countries
0.3 29.3 14.0 India: 1.9Russia: 10.7South Africa: 14.9China: 16.7Brazil: 21.2Singapore: 85.0United Kingdom: 281.1
(Source: ADB, 2016)
Total water needs of industries are small but critical and need to be met continuously and with certainty. The industry has not received the priority it deserves in the allocation of the water resources as only 6 per cent of total freshwater is used by industry in India as compared to 23.2 per cent in China and 17 per cent in Brazil ( FICCI, 2011). Allocation of water to the industries should be brought at least 10 per cent of the total withdrawals. The main problem with industrial water use is that though its consumptive use is small (~ 5 to 10 per cent), the remaining industrial effluents have high pollution, contamination, and

94 / A Pragmatic Water Vision for India Balancing Water for Food and for Growth
toxic loads and are responsible for the degradation of the rivers, aquifers, and water bodies.
As such, the new Water Vision 2035 shall have the two main elements of:
i. To meet all genuine industrial water needs at affordable economic costs for a faster and sustainable economic development.
ii. Industry on its part shall ensure improved economic water productivity through water auditing and conservation (water positive), recycling and reuse, zero discharge of unsafe/ contaminated water, and sustainable development of input watersheds/ industrial environs as a corporate social responsibility.
To keep the industries globally competitive and to provide employment, services, and growth for the economy, their genuine water needs must be met on priority and at equitable economic costs. It was unfortunate that in recent years, some of the industries were either denied permission to start or the already functional industries had to stop/suspend operation for want of a supply of water. Wherever possible, the suitably treated wastewater from the cities can also be used by the neighbouring industries. Industries on their part must adopt the best management practices, conduct water audits for their operations, and must ensure that the water footprints of their products, commodities, and services conform to the global standards. More importantly, all industries shall be required to commit to fully treat the effluents to the acceptable levels before these are put to alternative uses or discharged into any source. Pollution due to industrial effluents is hazardous to the environment and society and cannot be tolerated. The treatment costs of the effluents must be built into the operational and input costs.
Additionally, most industries also have an input and supplies or even manpower watershed from where they draw their supplies. It shall be a corporate social responsibility of the concerned industries to ensure that these regions/ watersheds are not
The Journal of Governance – January 2022 / 95
degraded in any manner and rather are developed to improve the livelihood and environmental conditions. Several industries like ITC, Tatas, Ambuja Cement, Nestle, Vedanta, and others have shown that it is rewarding to take up such projects to improve the livelihoods and environment and also maintain cordial relations with the neighbouring communities.
Water for the Silent Stakeholders – Rejuvenation of the Rivers and the Ecosystems
The ecosystems and water resources therein are living and dynamic entities and can provide the intended environmental services only when they are clean and in good health. Our continued neglect and over-appropriation of the resources leaving little water for continuous and adequate flow (Aviral dhara) and control of pollution and contamination (Nirmal dhara) have rendered our rivers in a degraded, decayed (sometimes dead) and highly polluted and contaminated state. According to a recent assessment by the Central Pollution Control Board of India (CPCB, 2018), there are 351 polluted river stretches in the country (up from 302 in 2015) with 45 of them being critically polluted. The estimated polluted riverine length in India is 12,363 km, about 5 times the length of the Ganga main stem. The condition of even our most sacred and mighty river like the Ganga became so grave and pathetic that the nation had to launch the ‘National Mission for Clean Ganga’ by spending huge amounts of funds and efforts. Many other large rivers are also crying for immediate attention. Studies predict that several basins like Krishna, Pennar, and Indus will reach physical water-scarce (Closed basin) conditions by 2050, where the remaining utilizable water supply cannot be developed further without making a severe impact on the environment and riverine water users downstream. Under such a scenario, new Water Vision 2035 shall aim to:
i. Rejuvenate all the rivers, lakes, springs, water bodies, and wetlands to a healthy condition through adherence to environmental flow needs, zero tolerance to direct discharge, and safeguard the aquatic life.

96 / A Pragmatic Water Vision for India Balancing Water for Food and for Growth
ii. Development of rivers and other water bodies for irrigation and hydropower generation while improving the cultural, aesthetic, tourism, navigation, and other environmental services.
Biodiversity and nature’s contributions to people are our common heritage and humanity’s most important life-supporting ‘safety net’. But this safety net is now stretched almost to the breaking point. The new Water Vision envisions to simultaneously work on the two fronts: the priority is to rejuvenate all the rivers, lakes, wetlands, and water bodies that have been polluted and degraded to an unacceptable level of the national shame and thus seriously constraining their present and future environmental services. Second, the nation needs both technology and policy and regulation to bring these lost resources to an acceptable condition. Experience sharing from other countries where other large rivers like Thames and Danube which were once severely polluted but have now been restored shall be helpful. The second aspect is to develop the rivers and other bodies for provisioning of the environmental services without breaching the boundaries. As economies grow, the population needs spots and locations for tourism and recreation, aesthetics, and nature. India has also historically attached much of its cultural and spiritual activities to the clean rivers and lakes and now demands that the lost heritage must be restored. The ingenuity in the management and planning of rivers and water bodies is to strike a fine balance between the economic development and maintenance of clean, green, and healthy rivers and water bodies and the whole ecosystem (Fig. 7, McCartney et. al., 2013).
Lakes and wetlands also provide very useful regulatory and cultural services and act as sponges for absorption of the excess water and release the same during lean periods. These are also the most preferred habitats for aquatic and terrestrial life and biodiversity. Most of these water bodies stand either encroached or infested with aquatic weeds and garbage dumps. The Water Vision foresees that most of these resources shall be rejuvenated and significantly improved by the targeted timeframe.
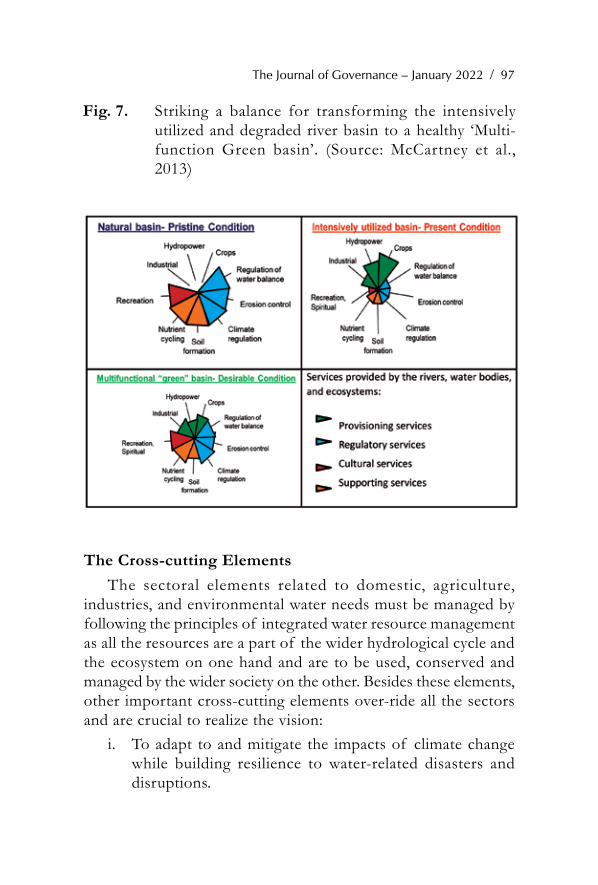
The Journal of Governance – January 2022 / 97
The Cross-cutting Elements The sectoral elements related to domestic, agriculture,
industries, and environmental water needs must be managed by following the principles of integrated water resource management as all the resources are a part of the wider hydrological cycle and the ecosystem on one hand and are to be used, conserved and managed by the wider society on the other. Besides these elements, other important cross-cutting elements over-ride all the sectors and are crucial to realize the vision:
i. To adapt to and mitigate the impacts of climate change while building resilience to water-related disasters and disruptions.
Fig. 7. Striking a balance for transforming the intensively utilized and degraded river basin to a healthy ‘Multi-function Green basin’. (Source: McCartney et al., 2013)

98 / A Pragmatic Water Vision for India Balancing Water for Food and for Growth
ii. Enhance public awareness and effective participation of the relevant stakeholders, training and education at all levels, establishment of the Centres of Excellence of Water Technology and Policy, enhanced use of ICT, and best practices for project management.
iii. Formulate and implement new and/or improved water and farm policies, governance structures, laws and regulations, economic instruments, water institutions, water cooperation, and sharing frameworks and treaties and ensure continued allocation of adequate budgetary provisions for the realization of the new vision.
Water has a unique role in the context of climate change- on the one hand, the resource itself is seriously impacted by climate change and manifested through melting of glaciers and snow covers, abnormal changes in the precipitation patterns, the frequent and intense occurrence of floods and droughts and cyclones and storms, and sea-level rise. These changes negatively affect all the sectors of the economy and human well-being. The second aspect is that efficient management of the water resources offers a great opportunity to adapt to climate change and also mitigate its adverse impacts. The new Water Vision foresees that by 2035 India will become climate-smart in all aspects of water management for its cities and citizens; crop production, livestock, and fisheries; manufacturing and service industries and the broader rivers, water bodies and ecosystems and environment through the application of global best practices and policies to enhance resilience, and mitigate the risks so that all the water-related disasters and disruptions are forecasted in advance. Society, structure, and systems are well prepared to tackle these anomalies with minimal economic and livelihood impacts.
The EpilogueWater resources are a societal subject and have varied
stakeholders at all levels. Various sections of society have different but equally valid perspectives about the resource. To arrive at a consensus, awareness of the society on different issues needs to

The Journal of Governance – January 2022 / 99
be improved to appreciate the other voices and evolve solutions and programs which are pragmatic and acceptable to larger sections and for larger regions. We have several success stories with individuals (Anna Hazare, Rajendra Singh) or at smaller levels of villages (Sukhomajri, Ralegaon Sidhi) and some communities (Neerkattis, Jalmitras) but unless these are implemented at scale the benefits shall be trivial. India also needs to bring in more science and technology especially the modern tools of regional modelling, use of ICT, remote sensing and GIS, advanced instrumentation, and measurement to deepen the understanding and develop evidence-based solutions. If we can’t measure something, it is hard to build a theory and management practice about it. Ideally, strong theories, formal models, and precise measurements and shared in publically available efficient data systems will interact in a virtuous cycle. Better methods will help us get the right answers. In the absence of good science and hypothesis, people revert to empirical pieces of evidence, hunches, and conjectures which are of little use for the design and implementation of successful programs and projects.
There is a growing emphasis on taking a systems-based approach to water, sanitation, and hygiene. Systems thinking tells us that a range of actors must play their part in program implementation. That theory then needs to be converted into action – first in creating the frameworks that establish and support the roles of these actors, and then in bringing those roles to life. To achieve this, India needs to thoroughly improve the existing water policies, laws and rules, and regulations and not use water as a political tool for populist gimmicks.
All rural people must be given access to water. Otherwise, it prevents the most vulnerable members of society, including women, youth, and the elderly, as well as minorities, from meeting the domestic and livelihood needs and growing enough food. And whilst the reasons behind migration are complex, when people go thirsty and hungry it can drive them to cities, contributing to additional problems like the growth of slums, unemployment, and social unrest. For women, in particular, increasing their access to

100 / A Pragmatic Water Vision for India Balancing Water for Food and for Growth
vital inputs like water, often ultimately leads to better nutritional outcomes for their entire household. Collecting more and better data to understand why certain groups continue to have unequal access requires data that is disaggregated by sex, age, income, migration status, and ethnicity, amongst others. This can then help policy-makers to adequately address the water security issues increasingly faced by the vulnerable sections of society.
Water sharing has been a source of continued tension in the national and international arena and India is still in the process of negotiating water use agreements within the states and with riparian countries upstream and downstream. While the Indus Water Treaty is cited as a successful treaty the same has also now generated much political debate. The Ganges Water Sharing Treaty with Nepal and Bangladesh and Brahmaputra water sharing with China has often been a cause for strained geopolitical ties. In the domestic sphere, the National Water Policy needs to be articulated to uniformly address issues related to water-sharing between upper and lower riparian states, water quality, pollution, pricing, and ownership of surface and groundwater sources. Conflicts between states – the Kaveri river water sharing dispute between Tamil Nadu and Karnataka and Sutlej water sharing between Punjab and Haryana – lead to persistently inefficient use and distribution. Among many other reasons, the absence of effective and acceptable water and cost-sharing frameworks among the donor and recipient states is a serious constraint in the implementation of even the most urgent links of river water transfer and sharing.
Finally, the realization of even the most profound water vision shall remain only a ‘desirable condition’ or a ‘wish list for the future’ unless it is supported by adequate and continued budgetary support. World Water Development Report (2016) shows that there is a 7 to 1 return on the provision of adequate water, sanitation, and hygiene, and $1bn invested in water supply and sanitation network expansion would result directly in the creation of 100,000 jobs. There are compelling reasons to invest in water and irrigation and the promotion of sustainable, inclusive,

The Journal of Governance – January 2022 / 101
and highly efficient water supply. Water savings require a big investment. China, which faced a similar situation a decade back, invested RMB 2.3 trillion on water infrastructure during 2005-14 and the projects were heavily reliant on government funding. The Water Vision 2025 (IWP, 2000) estimated an investment outlay at Rs. 5000 billion during the next 25 years or about Rs. 200 billion per year – but this has not happened in the past and now the revised cost needs to be estimated which may be 2-3 times higher than the earlier projections. The government alone cannot provide for such massive investments and the private sector should play a bigger role through third-party services or public-private partnerships (PPP). Reforms in water and energy tariffs, community participation, and possibly water rights trading also expect to provide incentives for the financing of the different elements of the proposed Water Vision 2035.
The government has shown its commitment through large programs like Pradhan Mantri Krishi Sinchayee Yojana (PMKSY) which aims to ‘provide water to each farm’ and ‘Per drop more crop’ with some innovative financing models and prioritization of the long-pending projects and mapping and rejuvenation of all the aquifers; National Mission for Clean Ganga (NMCG) to clean the Ganga river and extend the learnings to other polluted rivers. The ongoing Jal Jeevan Mission will provide piped water supply to 18 crore households and also generate 12 lakh jobs. These are good steps but not sufficient to address the water issues in a holistic and integrated manner and realize the vision of water for all from a promise to reality by 2035.
References ADB. 2016. Asian Water Development Outlook 2016: strengthening water
security in Asia and the Pacific, Mandaluyong City, Philippines: Asian Development Bank. Pp. 136.
FICCI. 2011. Water Use in Indian Industry Survey. FICCI Water Mission. Federation of Indian Chamber of Commerce and Industries, New Delhi. Pp. 7.
102 / A Pragmatic Water Vision for India Balancing Water for Food and for Growth
Doczi, J., Calow, R., d’Alamcon. 2014. Getting more with less: China’s progress in agricultural water. Overseas Development Institute (ODI), London. Pp. 48.
GoAP. 2012. AP Water Mission: Methods, Position Papers, and District Reports; Water Conservation Mission, Government of Andhra Pradesh,
GoI.1999. Water Resources Development Plan of India: Policy and Issues, Government of India, Ministry of Water Resources, National Commission for Integrated Water Resources Development Plan, New Delhi
Gulati, A., Sharma, B., Banerjee, P., Mohan, G. 2019. Getting More from Less: Story of India’s shrinking water resources. NABARD and ICRIER Report. Indian Council for Research on International Economic Relations, New Delhi. Pp. 170. available at: https://www.nabard.org/auth/writereaddata/tender/1712200837Getting%20More%20from%20Less-%20Story%20of%20India%27s%20Shrinking%20Water%20Resources.pdf
Hu, F. 2016. 8 Reasons to Invest in Irrigation in China. Centre for Water Resources, Beijing, PR China. available at: https://www.chinawaterrisk.org/resources/analysis-reviews/8-reasons-to-invest-in-irrigation-in-china/, accessed on 13 October 2021.
Hutton, G., Haller, L., Bartram, J. 2007. Global Cost-Benefit Analysis of Water Supply and Sanitation Interventions.” Journal of Water Health 5: 481-502.
IWP &IHD. 2000. India Water Vision 2025- Report of the Vision Development Consultation. India Water Partnership and Institute for Human Development, New Delhi. Pp. 75.
Kumar, S.V., Bharat, G.K. 2014. Perspectives on Water Resources Policy for India. Discussion Paper, The Energy and Resources Institute, New Delhi. Pp.19.
McCartney, M.; Cai, X.; Smakhtin, V. 2013. Evaluating the flow regulating functions of natural ecosystems in the Zambezi River Basin. Colombo, Sri Lanka: International Water Management Institute (IWMI). 59p. (IWMI Research Report 148). doi:10.5337/2013.206
MoWR. 2002. National Water Policy. Ministry of Water Resources, Government of India.
MoWR. 2012. National Water Policy. Ministry of Water Resources, Government of India.

The Journal of Governance – January 2022 / 103
NITI Aayog. 2018. Composite Water Management Index: A Tool for Water Management, National Institute for Transforming India (NITI), Government of India, New Delhi.
Saha, D., Marwaha, S., Mukherjee, A. 2017. Groundwater Resources and Sustainable Management Issues in India- in Clean and Sustainable Groundwater in India. Ed. Saha, D., Marwaha, S., Mukherjee, A, Springer, New Delhi.
Shah, T., Bhatt, S., Shah, R.K., Talati, J. 2008. Groundwater governance through electricity supply management: Assessing an innovative intervention in Gujarat, western India. Agric. Water Manage. 95:1233-1242.
Sharma, B.R., Ambili, G.K. 2010. Impact of state regulation on groundwater exploitation in the hotspot region of Punjab. Abstract- Toward Sustainable Groundwater in Agriculture: An International Conference Linking Science and Policy, 15-17 June 2016, San Francisco, USA.
Sharma, B.R., Gulati, A., Mohan, G., Manchanda, S., Ray, I., Amarasinghe, U. 2018. Water Productivity Mapping of Major Indian Crops, National Bank for Agriculture and Rural Development (NABARD), Mumbai and Indian Council for Research on International Economic Relations (ICRIER), New Delhi. Pp. 182.
Sharma, B.R., Thangaraj, P., Gulati, A. 2021. (Forthcoming). Degradation of air quality due to agriculture in India: assessment, prospects and the costs.Indian Council for Research on International Economic Relations (ICRIER), New Delhi.
UNICEF, FAO and SaciWATERs. 2013. Water in India: Situation and Prospects.UNICEF, New Delhi. Pp. 105. At: https://www.yumpu.com/en/document/view/27571578/water-in-india-situation-and-prospects-unicef, accessed on 10 October 2021.
UN. 2018. Economic Losses, Poverty and Disasters 1998-2017. UN Office for Disaster Risk Reduction, United Nations Organisation.
UN. 2018. The United Nations World Water Development Report-2018, UNESCO 2018. Available at: https://www.unwater.org/publications/world-water-development-report-2018/, accessed on October 13, 2021.
Viswanathan, V., Sharma, A. 2019. The Face of Disasters 2019. New Delhi, India: SEEDS. Pp. 64. accessed at: https://www.seedsindia.org/THE-FACE-OF-DISASTERS-2019.pdf, on 09 October 2021.
104 / A Pragmatic Water Vision for India Balancing Water for Food and for Growth
WRD.2020. Maharashtra State Water Vision. Water Resources Department, Pune, Maharashtra. (Source: https://wrdtest.maharashtra.gov.in/portal/content/default/pdf/events/Vision_2020_Website.pdf )
WSP.2011. Flagship Report: Economic Impacts of Inadequate Sanitation in India, Water and Sanitation Program of the World Bank, pp.128.
*****

The Journal of Governance – January 2022 / 105
Introduction In India, agriculture, despite a significant decline in its contribution
to the gross domestic product (GDP) from about 48 per cent in 1970-71 to 15 per cent in 2019-20, continues to attract considerable attention in the policy debates because of its critical role in ensuring food and nutrition security and reducing poverty. It supports the livelihood of about 45 per cent of the population, and agricultural growth has a larger impact on poverty reduction as compared to the growth in other economic sectors. Importantly, agriculture is dominated by subsistence-oriented smallholder farmers — over 99 per cent of the Indian farmers are low-income or resource-poor farmers possessing landholdings of less than 10 hectares.
Indian agriculture confronts several challenges at the WTO primarily on account of the inherent asymmetries and imbalances in the Agreement on Agriculture (AoA). These challenges are related to the domestic support, market access, export subsidies and food security. In fact, the developing member-countries of the WTO have been affected by the asymmetries in the AoA which have been favourable to the developed member-countries, for example, the developed member-countries continue to provide massive subsidies to agriculture without breaching their commitments to AoA. Their Aggregate Measurement of Support (AMS) entitlements have
Sachin Kumar Sharma, Pratap S. Birthal and Abhijit Das
Indian Agriculture under the WTO Regime: Key Issues*
* This paper is a brief version of an article titled “WTO and Indian Agriculture: Issues, Concerns, and Possible Solutions” to be published by National Academy of Agricultural Sciences (NAAS). It is an outcome of a brainstorming session organised by NAAS on October 7, 2021.
106/ Indian Agriculture under the WTO Regime Key Issues
allowed them to provide high levels of trade-distorting support along with product-specific concentration, leading to overproduction and depression in international prices of agricultural commodities, and consequently loss in farmers’ income in developing member-countries (Sharma et al., 2021a). A related issue is that of the import surges in the domestic markets of the developing countries, and the vulnerability of subsistence-oriented smallholder farmers to highly subsidised imports.
Notwithstanding these, India also finds it difficult in implementing its welfare-oriented agricultural policies due to the strict discipline laid in the AoA. In recent times, even the existing flexibilities available to the developing countries are being proposed to be subjected to further discipline in agriculture negotiations. India’s support programs have been facing consistent attacks at the WTO in the form of counter-notifications on the support provided to cotton, sugar, wheat and rice, besides questionings in various meetings of the Committees on Agriculture (CoA). The recent disputes on India’s sugar policies is an example (Sharma et al., 2021b). Market price support-based procurement and public stockholding, the backbones of India’s food security, also face criticisms at the WTO. In this context, this paper critically examines some of the challenges and issues faced by Indian agriculture at the WTO.
Issues and Concerns Related to Domestic Support
• DomesticSupportProvisions The domestic support measures, based on their impacts on trade,
production and prices, have been clubbed into four boxes in the AoA: the Amber, Green, Blue, and Development boxes. There is no financial limit for the programs covered under the Green, Blue and Development boxes. However, the trade-distorting support covered under the Amber Box is subject to strict disciplines and limits.
The public-funded programs or measures that do not have any price or trade-distorting effect are covered under the ‘Green box’, provided they satisfy the policy-specific criteria laid under Annex 2 of the AoA. These measures are general services, public stockholding
The Journal of Governance – January 2022 / 107
for food security purposes, food aid, decoupled income support and other direct payments. General services include agricultural research, pest and disease control, training, extension and advisory services, inspection, marketing and promotion, and infrastructural services. Direct payments in the Green box consist of decoupled income support, government participation in income insurance and crop insurance, producer and resource retirement programs, investment aid, environmental measures, and regional assistance programs. It should be noted that one of the conditions for direct payments to fall within the Green box is that these should be based on criteria defined and fixed during the historical base period (1986 – 1988). In other words, the Green box payments must not be based on, say, the factors of production in any period after the base period.
Direct payments with production-limiting conditions fall under Article 6.5 or the ‘Blue box’. However, these payments must also be based on any of the following sub-conditions: (i) fixed area and yields; or (ii) 85 per cent or less of the base level of production; or (iii) a fixed number of livestock heads. Although linked to production, the Blue box measures are not subject to any capping under the AoA. Over the last 25 years, a few member countries of the WTO, for instance, the EU, Norway, Japan and Iceland, have used Blue box to support their producers. In 2016, China became the first developing country member to use Article 6.5 to support corn producers, and subsequently cotton producers (Sharma et al., 2021b).
As a special and differential provision (S&DT), the AoA allows developing member countries to support their farmers without any prescribed financial limits under Article 6.2 or the Development box. This box includes (i) investment subsidies generally available to agriculture, (ii) agricultural input subsidies generally available to low-income or resource-poor producers, and (iii) subsidies given to producers to encourage diversification from producing illicit narcotics under this box.
The Amber box covers all other domestic support measures that do not fall in the Green, Blue or Development boxes. The Product-specific support (PSS) and non-product specific support (NPS) are the main constituents of the Amber box. The PSS refers
108/ Indian Agriculture under the WTO Regime Key Issues
to measures that are targeted to specific products, whereas the NPS is not restricted to any particular commodity. Minimum price support (MSP operations) and deficiency payments (e.g Bhavanter Yojana of Madhya Pradesh) are examples of product-specific Amber box support. On the other hand, the expenditure on input subsidies (e.g., fertiliser, canal irrigation and power subsidies) fall under the NPS because these are not targeted to a specific product.
Although the policy space under the Amber box is capped, the AoA allows WTO members to provide Amber box support up to a certain limit called ‘de minimis limit’. In simple words, the de minimis is the minimum level of policy space available to WTO members. The de minimis limit for the PSS is based on the value of production (VoP) of a specific product, while for the NPS it is based on the total value of agricultural production. The applicable de minimis limit for developed countries is 5 per cent and for developing countries, it is 10 per cent. China, being an acceding member of WTO, has an applicable de minimis limit of 8.5 per cent.
An important question is if a member country can provide Amber box support above the de minimis limit. The flexibility to exceed the de minimis limit is determined based on the Amber box support provided by a member country during the defined historical base period, which is reflected in its Schedule of Commitments. As per the AoA, the support below the de minimis limit is exempt from the current Amber box calculation. Let’s illustrate it assuming that a developing country provides support of US$300 million to its wheat producers under the Amber box which is equivalent to 8 per cent of the VoP of wheat. In this case, the support to wheat producers is less than the de minimis limit of 10 per cent, and thus it is treated as zero for the Amber box calculation. In another scenario, where the PSS for rice is US$ 600 million, equivalent to 16 per cent of its VoP, which is more than the de minimis limit of 10 per cent. In the absence of the PSS for other products (and the NPS as well), the current support under the Amber box is US$600.
This illustration provides for the reasons behind the existing policy space available to member countries at the WTO. Those members who had provided support above the de minimis limit

The Journal of Governance – January 2022 / 109
during the base period got the entitlement to support their farmers beyond the de minimis limit in future too. For example, the US, EU, Canada and Japan secured additional flexibilities to continue with the trade-distorting support above the prescribed de minimis limits. The PSS and NPS were below the de minimis limit for most developing countries, including India, during the base period. Thus, their maximum policy space under the Amber box was capped by the de minimis limit.
• ShrinkingPolicySpaceforProduct-SpecificSupport(PSS)On account of the low level of support during the base period
1986-88, the policy space to provide PSS for India is capped at 10 per cent of the value of production of a specific product. Under the PSS, a member can provide support in the form of market price support (MPS), direct payment based on price gap, and any other budgetary support. Measures like price deficiency payments are direct payments based on the price gap, that is, the difference between the target and market price. This measure does not entail any physical procurement by the government at the administered price, and the budgetary support incurred towards this can be considered as the PSS. Alternatively, the members may also choose to calculate the support under this measure by using the MPS methodology as explained below. The support provided by the US under the Price Loss Coverage programme (PLC) to its farmers is an example of price deficiency payments (Sharma et al. 2020).
Many developing countries support their farmers through price support measures. MPS is a form of market intervention in which the government procures produce from farmers at pre-announced prices. The government agencies like the Food Corporation of India (FCI) in India, BULOG in Indonesia, the General Authority for Supply of Commodities (GASC) in Egypt, Sinograin in China, National Cereals and Produce Board (NCPB) in Kenya, PASSCO in Pakistan, Turkish Grain Board (TMO) in Turkey, the Food Reserve Agency (FRA) in Zambia, play an important role in ensuring remunerative prices to farmers in respective countries (Sharma and Das, 2017; Sharma 2016b).

110/ Indian Agriculture under the WTO Regime Key Issues
In India, the minimum support price policy is an example of MPS. The AoA prescribes that the MPS is calculated by multiplying the difference between the External Reference Price (ERP) and the announced price, called the applied administered price (AAP) with the production eligible to receive the AAP.
MPS = (AAP – ERP) * Eligible productionThe ERP was the export or import price of a product in the base
period and it depended on a country’s trade status, that is whether it was a net-exporter or a net-importer of that product. Thus, the AoA compares fixed ERP with AAP to account for the trade-distorting support. However, the MPS calculations do not consider inflation, which results in an exaggerated calculation of MPS, leading to shrinkage in the policy space for the countries to implement MPS measures over time (Berthelot, 2015; Sharma, 2018; Thow et al., 2019). For instance, a comparison of minimum support price for 2021 with the fixed ERP of wheat (average during 1986-88) leads to a highly inflated and unrealistic MPS. As per India’s domestic support notifications, the proportion of the marketed surplus procured by the government agencies is treated eligible for calculating the MPS.
So, the question arises: Can inflation be considered in calculating the MPS for a product? Article 18.4 of the AoA mentions: “In the review process, Members shall give due consideration to the influence of excessive rates of inflation on the ability of any member to abide by its domestic support commitments.” Although it provides for consideration of inflation in calculating MPS, there is an ambiguity as to whether this flexibility is a unilateral right or it depends on the discretion of other members of the WTO during the review process. Some member countries, for example, Jordan and Turkey have considered inflation for calculating the current AMS. However, some member countries have questioned it by stating that consideration of inflation is not a unilateral right.
India has been notifying its domestic support notifications in US dollars. Table 1 shows the trend in notified support in US$ to wheat farmers in India. For many years the minimum support price was lower than the fixed ERP due to the currency depreciation since the base period 1986-88. For instance, the average exchange rate between

The Journal of Governance – January 2022 / 111
INR and US$ during the base period was 13.47, which significantly depreciated over time, and currently, it hovers around 74 INR per US$ (Sharma et al., 2021c). However, for other agricultural products like rice, the minimum support price is significantly higher than the ERP which results in exaggerated market price support. Consideration of inflation or using the updated ERP based on the previous three years average import or export price of specific agricultural products provide a more accurate level of support to agriculture.Table 1: Trend in product-specific support to wheat in India
Marketing year
Applied administered price (US$/
tonne)
External reference price (US $/tonne)
Eligible production
(million tonne)
Production (million
Ton)
Value of production
(VoP) (million
US$)
Product specific support (US $
million)
PSS as % of VoP
2015-2016 232.97 264 28.09 92.29 22292.4 -871.66 -3.91
2016-2017 242.28 264 22.93 98.38 24645.76 -498.04 -2.02
2017-2018 269.18 264 30.82 99.70 26993.18 159.68 0.59
2018-2019 263.15 264 35.8 103.60 27784.4 -30.53 -0.11
2019-2020 271.52 264 34.13 103.60 32962.63 256.7 0.78
Source: (1) Sharma (2016a); (2) Domestic support notifications of India.Currently, India supports producers of wheat, rice, cotton, and
pulses in the form of MPS, and therefore, the support should be less than 10 per cent of their respective VoP to comply with its commitments under the AoA. It is noteworthy that if India initiates a price deficiency payment, the additional expenditure will also be accounted for under the PSS.
PSS = MPS + Direct payments based on price gap + Other budgetary support < 10% of VoP
Given this formula, it is imperative for the developing members, including India, to aggressively demand a change in the fixed ERP based on 1986-88 prices to average export or import prices of recent years or to provide flexibility to consider inflation for calculation of current AMS calculation.
• AttackonSpecialandDifferentialProvisionsforDeveloping Members
Despite the limited policy space available under the AoA, in
112/ Indian Agriculture under the WTO Regime Key Issues
recent times the certain flexibilities that are available to developing member countries in the form of S&DT provisions have also come under attack at the WTO.
As explained, the Development box (Article 6.2) allows developing member countries to provide support without prescribed limits for certain measures such as the investment subsidies generally available to agriculture, input subsidies to low income or resource producers and subsidies provided to encourage diversification from illicit narcotic crops. As per the Schedule of Commitments submitted by India, the farmers who possess a landholding not exceeding 10 hectares are considered as low-income or resource-poor farmers. The average farm size in India is 1.08 hectares and 99.43 per cent of the farmers have a landholding size of less than 10 hectares (GoI, 2019). In simple words, almost all farmers are low-income or resource-poor, and therefore, India has the flexibility to provide input subsidies to farmers without any financial limit under the AoA.
Furthermore, it is to be noted that India also has the policy space to provide input subsidies under the non-product specific support of the Amber box. However, that flexibility is capped at 10 per cent of the VoP of the agricultural sector. As per the recent notification (for the year 2019-20), India has provided US$ 25 billion as input subsidies (subsidy expenditure on fertiliser, irrigation, and power) under the Development box. Crop insurance premium subsidies, as well as expenditure on interest subvention, amounted to US$ 4.7 billion are notified as non-product specific support, although these expenditures can be covered under the Development box.
However, few proposals have been tabled at the WTO that seek to dilute the S&DT provision for developing member countries by capping this support. Canada, Australia and New Zealand have been frequently raising this issue in agriculture negotiations (Sharma, 2020). Besides, some member countries have advanced proposals to lower the de minimis limit. Currently, the developing countries can provide Amber box support up to 10 per cent of the VoP. The developed countries are trying to make a narrative that the policy space for developing countries under the Amber box has been increasing at a higher rate as the de minimis limit for them is 10 per

The Journal of Governance – January 2022 / 113
cent as compared to 5 per cent for them. As the de minimis limit depends on VoP, the policy space under the de minimis also increases with an increase in VoP. On this logic, the developed countries seek to reduce the applicable de minimis limit (Sharma et al., 2021d). Already many developing countries have been facing a lack of policy space to implement programs under the Amber box. A further reduction in the de minimis limit would put farmers at a disadvantage. Given the limited flexibilities available to developing countries under the AoA, these proposals will invariably lead to a further reduction in policy space available for these countries.
• IssueofAdditionalEntitlementsThe AoA provides for the de minimis limit of 5 per cent and
10 per cent of the value of production of a product for developed and developing countries, respectively. However, some countries, for example, the US and EU, that had provided support above the defined limit during the 1986-88 base period have secured additional flexibilities in the form of AMS entitlement to continue with the trade-distorting support above the prescribed de minimis limit. In the countries that did not provide support above these limits, the permissible support was capped at the de minimis. The AMS entitlements allow countries to concentrate their support on particular products above the de minimis limit. The developed countries provide a very high level of subsidies. For example, owing to its AMS entitlement of $19 billion the US provided product-specific support of more than 50 per cent of the VoP of rice, cotton, sugar, and dry peas. In some years, more than 90 per cent of the total product-specific support was concentrated on only two products, dairy and sugar. Similarly, this flexibility also allowed the EU to support more than 65 per cent of the VoP of butter, milk, apple, rice and sugar. The trade-distorting support doled out by developed countries has been noted to cause overproduction, leading to the depression in the international prices of agricultural commodities (Sumner, 2003). These highly subsidized exports adversely affect farmers in developing countries, negatively impacting their livelihood and income (Oxfam 2002; Banga, 2014).

114/ Indian Agriculture under the WTO Regime Key Issues
The AMS entitlements represent the inherent imbalance and asymmetries in the AoA. The developing countries are consistently demanding the elimination of the AMS entitlement as a first step towards disciplining the trade-distorting support.
Issue of Public Stockholding for Food Security PurposesAn important issue for India at the WTO is public stockholding
for food security purposes. Food security programs in several countries, including India, typically have procurement, stockholding and distribution components. India implements a MSP backed public stockholding program to safeguard the interests of its consumers and farmers. Under this policy, the central government procures food grains (wheat, rice, coarse cereals and pulses) from farmers at MSP, and distributes them at subsidised prices to the vulnerable sections of society through the public distribution system (PDS) and other welfare schemes including the National Food Security Act, 2013. Thus, the procurement at MSP, stockholding, and distribution to eligible households form three integral components of India’s food security framework.
Under the AoA, the stockholding and distribution are covered under the ‘Green box’ and are exempted from the reduction commitments. However, the procurement at administered price falls in the Amber Box, which, as mentioned earlier, is capped at 10 per cent of the VoP of a product. Given this, it is feared that many developing countries may have already breached or are likely to breach this limit (Sharma, 2016b). The lack of flexibility under the Amber Box makes it difficult to procure food grains from farmers at the administered prices without breaching the applicable de minims limit. This may seriously jeopardize food security in developing countries.
Given the concerns of food security in developing countries, the provisions related to food security and public stockholding have been intensely negotiated at the WTO for several years. In 2013, at the Bali Ministerial Conference, an interim solution in the form of a ‘peace clause’ was reached, agreeing that “members shall refrain from going through the WTO Dispute Settlement Mechanism to

The Journal of Governance – January 2022 / 115
challenge the compliance of a developing member with its obligation related to domestic support” for the support provided to traditional staple food crops for public stockholding programs for food security purposes. This decision gave developing countries the flexibility to administer price support policies for food grains. However, for the Bali Decision to be applicable, developing countries have to ensure compliance with the notifications, transparency, anti-circumvention and safeguard provisions as provided. Additionally, the Bali Decision received criticism for its limited scope and coverage and the onerous transparency requirements on countries taking recourse to it. Although an interim solution in the form of the Bali Decision is available to developing countries, they must engage in fruitful negotiations to reach a permanent solution addressing the issue of public stockholding for food security.
India became the first WTO member to take recourse to the Bali Decision for protecting its public stockholding program for food security purposes for rice. India’s product-specific support to rice in 2018–19 crossed the 10 per cent de minimis limit. By invoking the Bali peace clause, India is unlikely to face a legal challenge from other members arising from this breach of commitments. Price-support-backed food security policy has played a vital role in fighting against hunger, especially during the COVID-19 pandemic, where millions continue to face livelihood and food insecurity issues (Sharma and Dobhal, 2020; Sharma et al., 2021e). By implementing the Pradhan Mantri Garib Kalyan Anna Yojana, India could ensure the food security of about two-thirds of its population, which otherwise was next to impossible in the absence of these policies.
Currently, members are engaged in finding a permanent solution to the issue of public stockholding. India is looking for a permanent solution that should be better than the interim solution in terms of coverage of products and future programs and less onerous conditions for transparency and anti-circumvention conditions.
Market Access and Special Safeguard Measures (SSM)As of 2019, India had an average bound tariff of 113 per
cent and an average applied tariff of 39 per cent on agricultural
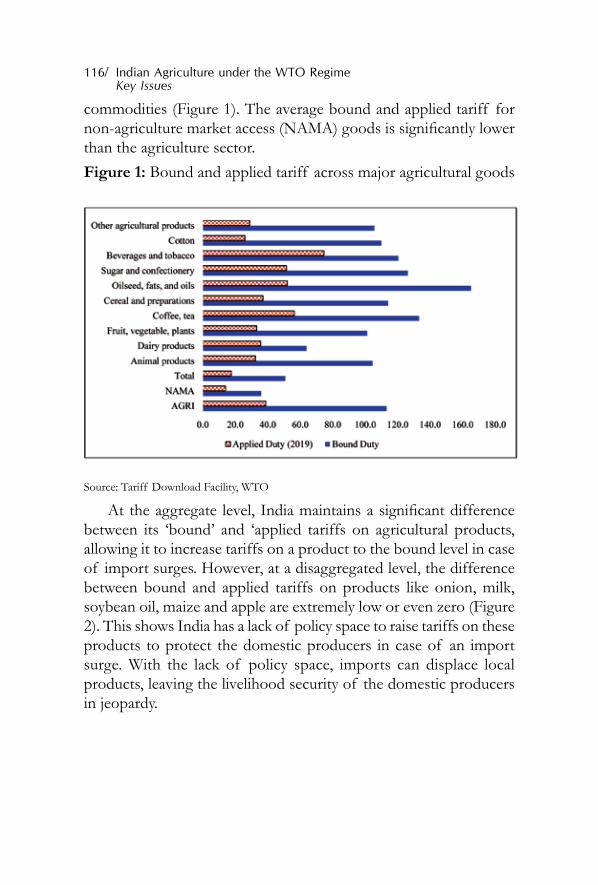
116/ Indian Agriculture under the WTO Regime Key Issues
commodities (Figure 1). The average bound and applied tariff for non-agriculture market access (NAMA) goods is significantly lower than the agriculture sector. Figure 1: Bound and applied tariff across major agricultural goods
Source: Tariff Download Facility, WTO
At the aggregate level, India maintains a significant difference between its ‘bound’ and ‘applied tariffs on agricultural products, allowing it to increase tariffs on a product to the bound level in case of import surges. However, at a disaggregated level, the difference between bound and applied tariffs on products like onion, milk, soybean oil, maize and apple are extremely low or even zero (Figure 2). This shows India has a lack of policy space to raise tariffs on these products to protect the domestic producers in case of an import surge. With the lack of policy space, imports can displace local products, leaving the livelihood security of the domestic producers in jeopardy.
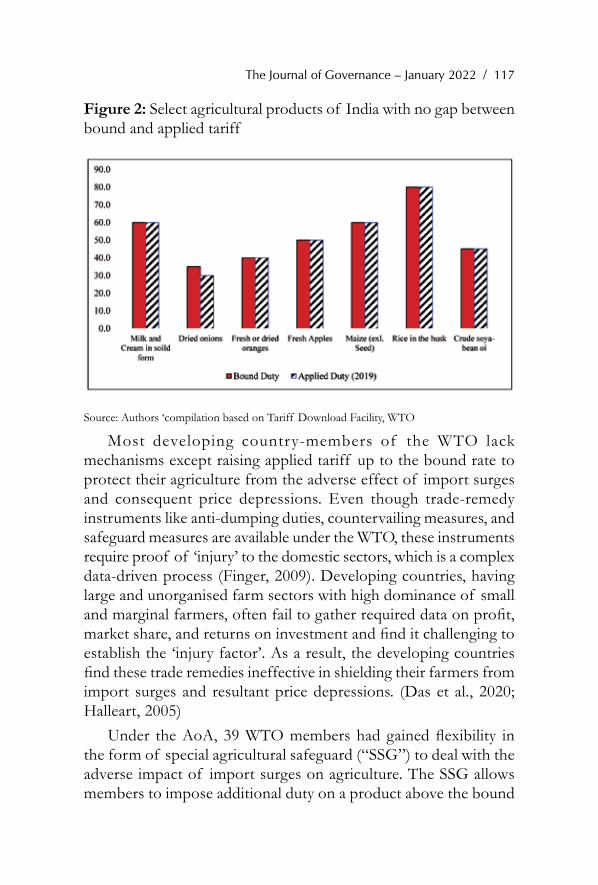
The Journal of Governance – January 2022 / 117
Figure 2: Select agricultural products of India with no gap between bound and applied tariff
Source: Authors ‘compilation based on Tariff Download Facility, WTO
Most developing country-members of the WTO lack mechanisms except raising applied tariff up to the bound rate to protect their agriculture from the adverse effect of import surges and consequent price depressions. Even though trade-remedy instruments like anti-dumping duties, countervailing measures, and safeguard measures are available under the WTO, these instruments require proof of ‘injury’ to the domestic sectors, which is a complex data-driven process (Finger, 2009). Developing countries, having large and unorganised farm sectors with high dominance of small and marginal farmers, often fail to gather required data on profit, market share, and returns on investment and find it challenging to establish the ‘injury factor’. As a result, the developing countries find these trade remedies ineffective in shielding their farmers from import surges and resultant price depressions. (Das et al., 2020; Halleart, 2005)
Under the AoA, 39 WTO members had gained flexibility in the form of special agricultural safeguard (“SSG”) to deal with the adverse impact of import surges on agriculture. The SSG allows members to impose additional duty on a product above the bound

118/ Indian Agriculture under the WTO Regime Key Issues
rate in case of an import surge or drop in prices without any requirement of proving ‘injury’ to the domestic sector. India does not have access to the SSGs and can only impose duties up to the bound limit under the AoA. A recent study shows that India had experienced an import surge for more than 300 tariff lines out of the total of 663 agricultural tariff lines, highlighting the need for an SSG like instrument (Das et al., 2020).
Since the initiation of the Doha Rounds, the developing countries, through a negotiation coalition called G-33 1 have been demanding a policy instrument similar to the SSGs in the form of a Special Safeguard Mechanism (SSM) that would allow them to impose duties beyond the bound level of tariff on products that face high import surges, or severe price depreciation.
Over the years, the need, importance and technical aspects of the SSM have been vigorously debated in agriculture negotiations. This has resulted in several proposals and draft modalities being presented on the negotiating tables on various aspects of the SSM such as product coverage, trigger levels, etc. Nonetheless, as of now , the members have failed to reach a consensus on the SSM modalities. While developing countries stress the need for the SSM to be accessible, effective and operable for all members, developed countries believe a more accessible SSM would lead to increased protectionism in agriculture. Currently, the SSM negotiations are at a deadlock due to the divergent positions of the member countries.
Moreover, developed member countries have also attempted to link the SSM negotiations with ongoing tariff-reduction negotiations, which would be detrimental for the policy space of developing country members. Under these tariff reduction negotiations, members are attempting to arrive at formulas to reduce bound tariffs in place, with a special focus on addressing extra high tariffs (tariff peaks), narrowing gaps between tariffs on raw and finished agricultural products (tariff escalation) and
1 G33 is a coalition of 47 developing countries at the WTO which has been raising issue related to food security, SSM, Special products and, special and differential treatment for the developing countries in agriculture negotiations.

The Journal of Governance – January 2022 / 119
reducing tariffs on special and sensitive agricultural products (UNCTAD, 2010).
As mentioned above, for many products the gap between bound and applied duty is low. Further reduction in tariff would make producers of those products, where the policy space is low due to India’s tariff commitment under the AoA, face severe livelihood insecurity. In this context, the demand for an SSM that is accessible, operable and effective is most relevant to protect farmers from import surges and price declines in developing countries. It is also important for the developing member countries to be cautious and mindful of ensuring effective special and differential treatment in agreeing to any tariff-reduction formula proposed.
Issues Related to Export SubsidiesUnlike the domestic support and market access pillars, the
member countries have achieved consensus on the elimination of export subsidies. Members achieved a most significant breakthrough at the Nairobi Ministerial Conference (2015) in terms of the decision to eliminate all agricultural export subsidies and to set disciplines on other export measures such as export finance and international food aid. This decision was that developed member countries had to immediately eliminate export subsidies on all products (by 2016) except certain products like swine meat and dairy, on which an extended timeline stretching to 2020 was allowed for eliminating export subsidies. Developing member countries with export subsidies entitlement were mandated to eliminate their export subsidies by the end of 2018 unless the said members had notified certain export subsidies in any of their latest three export subsidies notifications, in which case the subsidies could be maintained until 2022. Moreover, the declaration also stated that developing member countries would be allowed to use the S&DT provisions under Article 9.4 as far as marketing cost subsidies and internal transport subsidies till 2023, with an extension up to 2030 for the Least Developed Countries. The Nairobi Decision also laid down additional disciplines on export credits and export financing, and international food aid (WTO, 2015).

120/ Indian Agriculture under the WTO Regime Key Issues
As of now, India and other developing countries are allowed to provide export subsidies related to reducing export-marketing costs on agricultural products, including international transport and freight and processing costs under Article 9.1 (d) and internal transport and freight charges on export shipments under Article 9.1 (e) up to 2023, as per the Nairobi Declaration. That being said, India has been facing challenges to its export policies as well, with other members taking India to disputes panel at the WTO. In a dispute in 2019, the United States had challenged India’s export-related measures alleging that these violated the Agreement on Subsidies and Countervailing Measures (ASCM). The said dispute involved a challenge on the Merchandise Exports from India Scheme (MEIS), which also covered agricultural products. India failed to defend its measures successfully. India also faces challenges on alleged export subsidies to sugar under ongoing India- Measures concerning Sugar and Sugarcane (WTO, 2020; Sharma et al., 2019).
This clearly shows the need for India to reorient its existing export subsidy framework in a WTO compliant manner. It is also important to remember that the window on the extended applicability of Article 9.4 is available till 2023. It is imperative that India focuses on building up WTO compatible export-facilitation infrastructures before the deadline of 2023. Furthermore, the developing countries should seek disciplines on other areas under the said pillar, such as export financing and export credits in the continuing negotiations.
ConclusionThe asymmetries and imbalances in the AoA are major challenge
for the developing countries to ensure a level playing field for low-income or resource-poor farmers. Further, the developing countries are facing a lack of policy space to implement support measures compatible with their prevailing socio-economic conditions.
Given the issues and challenges for Indian agriculture under the WTO regime, India along with other developing members should continue to demand the elimination of asymmetries in the AoA, especially the AMS entitlement which allows some members to

The Journal of Governance – January 2022 / 121
provide very high levels of trade-distorting Amber box support. It will not only restrict the flexibility to provide trade-distorting Amber box support for agricultural products to 5 and 10 per cent respectively for the developed and developing countries but also avoid the concentration of support in a few products. Further, India shall continue to oppose the attempts to dilute the existing S&DT provisions, especially the capping of support under the development box (Article 6.2) and reduction of the de minimis limit. As many developing countries are implementing the price-support-backed procurement policy for food security, there is a need to address the issue of external reference price (ERP) based on 1986-88 prices in the market price support methodology. The ERP needs to be based on recent years import or export prices of a relevant agricultural product. Alternatively, the developing countries should demand the flexibilities to consider the inflation in the market price methodology.
Members are now engaged in finding a permanent solution to the issue of public stockholding for food security purposes. Any permanent solution needs to be better than the interim solution – Bali Peace Clause in terms of coverage of more products and new programmes as well as less onerous conditions. Additionally, to protect the interest of poor farmers from import surges, India should seek a simple, effective, operable and accessible SSM.
ReferencesBanga, R. (2014). Impact of Green Box Subsidies on Agricultural Productivity,
Production and International Trade, Background Paper No. RVC-11, UNCTAD publication.
Berthelot, J. (2015). Why the Fixed External Reference Price of 1986-88 should be Challenged, IDEAs, available at https://www.networkideas.org/wp-content/uploads/2016/07/External_Reference_Price.pdf
Das, A., Sharma, S. K., Akhter, R. Lahiri, T. (2020). Special Safeguard Mechanism for Agriculture: Implications for Developing Members at the WTO. Working Paper No. CWS/WP/200/59. Centre For WTO Studies, Delhi.
FAO. (2003). WTO Agreement on Agriculture: The Implementation Experience- Case Studies of Developing Countries. Commodity Policy and Projections

122/ Indian Agriculture under the WTO Regime Key Issues
Service Commodities and Trade Division, FAO. Rome.
Finger, J.M. (2009). A Special Safeguard Mechanism for Agricultural Imports: What experience with other GATT/WTO safeguards tells us about what might work. World Trade Review, 9(2), 289-318.
Government of India (GoI). (2019). All India Report on Number and Area of Operational Holdings, Agriculture Census 2015- 16; Department of Agriculture, Co-operation & Farmers Welfare, Ministry of Agriculture & Farmers Welfare, Government of India 2019.
Halleart J.J. (2005).Special Agricultural Safeguards: Virtual Benefits and Real Costs- Lessons for the Doha Round. IMF Working Paper WP/05/131. IMF.
Oxfam. (2002). Stop the Dumping! How EU Agricultural Subsidies Are Damaging Livelihoods in the Developing World, Oxfam Briefing Paper 31.
Ratna S., Sharma, S.K.,and Dobhal A. (2021). Indian Agriculture under WTO and FTAs: An Assessment, in Ratna S., Sharma, S.K., Kumar R., and Dobhal A. (eds) Indian Agriculture under the shadows of WTO and FTAs: Issues and Concerns, Springer: 3-25. DOI:10.1007/978-981-33-6854-5
Sharma R. (2000). Preparing for negotiating further reductions of the bound tariffs. In Multilateral Trade Negotiations on agriculture. FAO. Rome.
Sharma, S.K. (2016a). Introduction. In: The WTO and Food Security: Implications for Developing Countries, Springer, p.15-26.
Sharma, S.K. (2016b). Conclusion. In: The WTO and Food Security: Implications for Developing Countries, Springer, p.203-218.
Sharma, S.K., Das, A. (2017). Food sovereignty under WTO: an unfulfilled promise at Buenos Aires, Economic and Political Weekly, 52 (52): 16-20.
Sharma, S.K. (2018). WTO and its Implications for India and China: Food Security vs. Naked Commercial Interest. Agricultural Economics Research Review, 31 (2): 207-219.
Sharma, S.K., Dobhal. A., and Savooji, S. (2019) “A bitter pill to swallow: India’s sugar sector under siege at the WTO” Working Paper No. FCWS/WP/200/55. Centre For WTO Studies, Delhi.
Sharma, S. K. (2020). A Quantitative Analysis of Proposals on Domestic Support in WTO Agriculture Negotiations: Need for Reaffirming the Development Agenda. Working Paper No. CWS/WP/200/63. Centre for WTO Studies, Delhi.

The Journal of Governance – January 2022 / 123
Sharma, S. and Dobhal, A. (2020), Amidst the COVID-19 pandemic, India’s Food Security at the WTO, the Hindu BusinessLine, April 2, available at https://www.thehindubusinessline.com/economy/agri-business/amidst-the-covid-19-pandemic-indias-food-security-at-wto/article31234049.ece
Sharma, S. K., Sawant, A., Vats, P., Naik, S. & Lahiri, T. (2020). ‘Disciplining trade-distorting support to cotton in the US: An unresolved issue at the WTO negotiations’. Agricultural Economics Research Review, 33(2) 119-134.
Sharma, S.K., Lahiri, T., Neogi, S., Akhter, R. (2021a). Revisiting domestic support negotiations at the WTO: Ensuring a level playing field. The Journal of International Trade & Economic Development. https://doi.org/10.1080/09638199.2021.1967429
Sharma, S.K., Dobhal, A., Agrawal, S., Das, A. (2021b). Demystifying Blue Box Support to Agriculture under the WTO: Implications for Developing Countries. South Asia Economic Journal 22(2), 161-185. DOI: 10.1177/13915614211035852
Sharma S.K., Dobhal A., Savooji, S. (2021c). India’s Sugar Woes at the World Trade Organisation, Economic & Political Weekly, 56(37): 44-51.
Sharma, S.K., Das, A., Neogi, S., Lahiri, T., Mathur, P. (2021d). Agricultural Domestic Support Negotiations at the 12th Ministerial Conference: Diluting the Development Agenda. Working Paper No. CWS/WP/65, Centre for WTO Studies, Delhi.
Sharma, S.K., Mathur, P. and Akther, R. (2021e). Negative support’ to Indian farmers: myth or reality?. Frontline, March, 26.
Sumner, D. (2003). The Impacts of US Cotton Subsidies on Cotton Prices and Quantities: Simulation Analysis for the WTO dispute https://projects.ncsu.edu/project/arepublication/Effects_US_Cotton_Subsidies.pdf
Thow, A.M., Sharma, S.K. & Rachmi, C.N. (2019). An analysis of Indonesia’s shrinking food security policy space under the WTO, Food Security: The Science, Sociology and Economics of Food Production and Access to Food, Springer; The International Society for Plant Pathology, vol. 11(6), pages 1275-1287, December.
UNCTAD.(2010). Flexibilities for Developing Countries in Agriculture: Market Access Formulas. UNCTAD/DITC/TNCD/2008/1.

124/ Indian Agriculture under the WTO Regime Key Issues
WTO.(2001). India- Quantitative Restrictions on Imports of Agricultural, Textile and Industrial Products. WTO Doc No. WT/DS90. Geneva
WTO.(2015). Export Competition-Ministerial Decision of 19 December 2015. Ministerial Conference 10th Session, Nairobi. WTO Doc No. WT/MIN(15)/45.
WTO.(2020). India- Measures concerning Sugar and Sugarcane. WTO Doc no. WT/DS581. Geneva.
*****

The Journal of Governance – January 2022 / 125
In 1995, India became a party to the Marrakesh Agreement and in so doing became one of the original members of the World
Trade Organisation (WTO). In 1947, India had also been one of the founding parties to the General Agreement on Tariffs and Trade (GATT) which preceded the WTO. The Uruguay Round Agreement on Agriculture (URAA) was a key element of the single undertaking required to become a member of the new WTO. Under that agreement India, like all members, accepted disciplines on market access, on domestic support and on export competition, and as a developing country member of the fledgling WTO, agreed to implement its commitments over a ten-year period.
India’s commitments on agriculture in the Uruguay Round On market access, India adopted ceiling bindings on tariffs at
quite high levels of 100, 200 or 300 per cent. No reductions were required and India was not obliged to guarantee any particular level of market access. A small number of products were already subject to zero or very low tariffs but India was able to invoke the balance of payments exemption to protect those markets (Articles XII and XVIII:B of GATT 1994). Some years after the Marrakesh Agreement, India renegotiated those tariffs and was permitted to instate new tariffs in the general range of 60-80 per cent. India’s market access commitments are, therefore, not in any way onerous.
On domestic support India’s maximum limits on certain kinds of distorting domestic support potentially sum to 20% of the value of production, of which 10% could be non-product specific and a
Carmel Cahill
India and the WTO Negotiations on Agriculture
What strategy to adopt?
126/ India and the WTO Negotiations on Agriculture What strategy to adopt?
further 10% (by individual product) could be product-specific 1. In addition, developing countries, including India, are allowed to disburse investment subsidies and input subsidies for low-income or resource-poor farmers without any constraint (Article 6.2 of the URAA also called the Development Box). Contrary to many claims made in the literature and in the press, public stockholding for food security is permitted without limit as long as the government’s acquisition is made at market price, not at prices set by the government. The associated food distribution under such systems is also permitted as long as it is targeted to the poor (Annex 2 of the URAA).
In reality, total measured market price support in India has been negative since the base period of the URAA calculations because prices of many farm products in India were below international prices. The Indian government and URAA negotiators recognized this and it has been confirmed frequently since by researchers and international institutions (e.g. Gulati, Pursell, Hanson, 1990). As India had no support subject to limit, it did not need to reduce such support, but had significant leeway to increase support without risk of exceeding its URAA limits. Indeed, India’s entitlement (or permitted level of distorting domestic support) has increased enormously in absolute terms since the URAA, because de minimis is expressed as a percentage of value of production, which has grown steeply and because there is no ceiling on input subsidies to low income or resource poor farmers.
On export competition, while developing countries in general were required to reduce export subsidies by 24% in value and by 14% in volume over a ten-year period, India did not submit any schedule of export subsidy reductions as it did not, at that time, engage in direct export subsidisation. Certain indirect export subsidies arising from income tax concessions on export sales were subsequently phased out, while India continued aid for marketing costs, which was permitted under the URAA. Nevertheless, in subsequent years India found itself constrained by the ban on introduction of new, direct
1 The main type of product-specific support is market price support usually generated by a combination of administratively set prices, government stocking operations, and protective border measures. Market price support may be positive or negative. Direct payments to producers per unit of production also constitute product-specific support.

The Journal of Governance – January 2022 / 127
export subsidies, (agreed at the Nairobi Ministerial in 2015) especially when surplus stocks were high and world prices low.
Developments since 1995What has occurred in the 27 years since the signing of the
Marrakesh Agreement? No major multilateral agreement (except the Trade Facilitation Agreement which came into force in 2017) has been concluded. India has become more vocal and more influential at the WTO, aligning with emerging economies such as China, Brazil and South Africa, as well as with broader groupings of developing countries. These countries came together to counter the weight of the wealthy, most developed countries and to push for outcomes India believed to be more aligned with its own interests and those of other developing countries. This new attitude was manifest at WTO Ministerial meetings in Seattle in 1999 and Cancun in 2003. Consistent with the stance taken during the Uruguay Round and during the launch of the DDA (2001), India has continued to strongly oppose attempts to broaden the remit of negotiations, sticking with a strongly mercantilist stance which sees exports as positive and imports as a sign of economic failure. Perhaps it is the same philosophy which explains why India has also largely remained aloof from preferential trade agreements, while other countries in Asia, and emerging economies more generally, have accelerated their participation is such agreements. The most recent example was the withdrawal of India from the Regional Comprehensive Economic Partnership (RCEP) in late 2020.
On agriculture, India’s stance has been particularly strong, highly critical of the vast policy space that the advanced economies are perceived as having accorded to themselves, and demanding redress, while, at home, deploying border measures (varying tariffs, import and export restrictions) in support of domestic prices and price stability, not always successfully. Over the years, WTO members failed to deliver on the Doha Development Agenda (DDA), and the original Agreement on Agriculture remains in force. As a result, concerns have arisen about the continued feasibility of India’s policy of supporting producers by acquiring stocks at government-set prices

128/ India and the WTO Negotiations on Agriculture What strategy to adopt?
instead of market prices for its Targeted Public Distribution System (TPDS). This massive system distributes basic foodstuffs at low prices to poorer families. The issue has dominated India’s approach to agriculture negotiations at the WTO and arguably, more generally to the WTO, in recent years.
Recall that the DDA which was launched in 2001 is currently in an impasse and that the WTO has not been able to deliver a comprehensive new agreement on agriculture. Consequently, certain rules and related parameters used in the URAA have not changed. Market price support continues to be estimated by comparing administered prices (those set by governments in the context of support programmes) with a fixed external reference price (FERP) calculated as the average of the years 1986-1988. Back in the early 1990s these calculations yielded negative market price support for most commodities for most years for India (e.g. see Gulati et al, 1990). But, successive Indian governments increased the minimum support prices to keep pace with inflation and provide stability to farmers. As a result, price gap calculations now yield estimates of significant positive market price support, mainly because current administered (minimum support prices or MSP) prices are being compared to a 35 year old fixed reference price. However, academics and international organisations (OECD/ICRIER 2018), applying economic principles and current data, show that India has negative market price support for most commodities, that is, farmers are still receiving prices lower that current international prices, the exceptions being maize, sugarcane, poultrymeat and pulses (OECD 2021).
India attempted to overcome this problem by switching to notifying its domestic support to the WTO’s Committee on Agriculture in US$ rather than rupees (which were used in India’s original URAA schedules). This deals with at least some of the problem. But this approach has been explicitly and implicitly questioned, most recently in a series of counter-notifications submitted by the United States, later joined by Canada and Australia (WTO 2018). In the counter-notifications, all calculations are reported in rupees and no adjustment is made for inflation. It is not at all clear which, if either, interpretation is correct. The terms of the URAA oblige members to give due

The Journal of Governance – January 2022 / 129
consideration to the influence of excessive inflation albeit without ever defining how this should be done. Consequently, the counter-notifications suggest that India is in serious breach of its URAA commitments for the products covered by the exercise. (wheat, rice, cotton, pulses and sugarcane)
Therein lies the crux of the problem that India has been facing. Use of the FERP from 1986-88, and the huge scale of India’s public food distribution system, with acquisitions made at government prices (MSPs), technically put India in breach or at risk of being in breach of its commitments. This, and some ambiguity in the wording used in the URAA (Annex 2 or Green Box, articles 3 and 4, footnotes 5 and 6) about domestic food aid has led to claims that India and other developing countries are being prevented from deploying domestic food aid to the poorest of their citizens. In reality, the problem relates to the price at which public stocks for food security are acquired. If acquisition occurs at market prices there is no issue.
India has fought hard for a resolution, as it clearly wishes to continue using the system of MSPs in conjunction with the TPDS. In this India is strongly supported by other developing countries, notably the group known as G-33. But other countries have resisted solutions that would simply exempt such programmes. This is because they fear that to do so would undermine the basic concept on which the domestic support pillar of the URAA is built – namely that price interventions by governments are inherently distorting and need to be disciplined. In other words they are not willing to give “carte blanche” to developing countries to acquire stocks for food security at administered prices without any discipline At the WTO Ministerial Conference in Bali in 2013 a compromise was reached in the form of a “peace clause” whereby countries agreed that they would not challenge a country’s compliance with its support limits under existing programmes involving government purchases at administered prices for food security purposes. In return, countries availing of the peace clause agreed that they would not engage in operations that would distort trade or negatively impact the food security of other countries. Subsequently, it has been clarified that this peace clause will remain in place until a permanent solution is found.

130/ India and the WTO Negotiations on Agriculture What strategy to adopt?
That permanent solution has proved elusive. In 2020 India notified that it was in breach of its domestic support limits for rice in 2018 and 2019 (that is product-specific support in excess of 10% of value of production, measured in US$), thus formally invoking the peace clause mechanism for the first time.
The issue of a special safeguard mechanism (SSM) has also emerged as a high priority for developing countries, including India. Essentially, developing countries faced with a surge of low-priced imports, want to be able to trigger a mechanism allowing them to raise tariffs in order to protect domestic producers. However, developed countries are extremely reluctant to agree an SSM outside of a more general market access deal involving significantly lower tariffs. Note that, on average, developing countries agricultural tariffs are higher, sometimes significantly higher, than those of the developed countries. Neither are opponents of an SSM willing to allow a mechanism that could result in tariffs higher than the highest levels previously agreed. Consequently, this issue continues to be highly divisive.
At time of writing (January 2022) the 12th WTO Ministerial Conference, initially scheduled in 2020, and rescheduled to November/December 2021, has again been postponed, due to the coronavirus pandemic. To date, despite intense preparations, the ambition in agriculture is modest, relating mainly to transparency provisions. There is no permanent solution in sight to the issue of acquisition of public stocks for food security, nor on SSM. What therefore could or should India do?
Possible solutions?A relatively simple solution presents itself to the public
stockholding issue. India could advocate for a change in the method of calculation of market price support which abandons the use of the fixed external reference price and adopts current or near current reference prices. A recent paper produced by the informal pathways group (Pathways 2021) suggests, for example, that an Olympic average of the previous 5 years could be used. This change should be made in every instance within the URAA where an external reference price is used. As confirmed by the latest data from the OECD (OECD

The Journal of Governance – January 2022 / 131
2021), India’s MSPs for most commodities are currently near or below international reference prices, India would therefore be much less at risk of being in breach of its commitments. Moreover, India could still avail of its product-specific de minimis ceiling, currently 10% of value of production.
Huge progress could flow from such a change, going way beyond the solution it provides to the specific issue of public stockholding and food security. The recalculation across the board of market price support using current parameters would put an end to the anachronistic, even absurd, situation, whereby countries are asked to respect commitments based on data from more than 35 years ago, which have no economic meaning and which provide a false view of the current situation. Countries which have baulked at the idea that the Bali-negotiated peace clause should become the permanent solution because is so seriously undermines the basic tenet of the domestic support discipline of the URAA, would find it easier to return to meaningful negotiations. The reset in the stalled negotiations that some countries have been calling for could follow, with WTO members enabled to have a more honest and meaningful discussion based on an accurate, contemporary picture of the scale of distorting market interventions.
A broader agricultural reform agenda?There are broader issues at stake here for India, going beyond the
search for a technical solution to the problem of the fixed reference price. As reported by OECD/ICRIER 2018 and confirmed by other independent researchers, agricultural and food policy in India is in urgent need of deep reform. What are the issues?• Where the MSP has worked well, production has increased
constantly, and India now has significant surpluses of rice and wheat which it exports. The downside of these developments is that farmers are trapped in the production of low-value staples and are not willing to diversify into the higher value products that are needed to raise incomes and improve the nutritional composition of the diet of poorer people.
• Marketing regulations (ECA and APMCs) have led to high

132/ India and the WTO Negotiations on Agriculture What strategy to adopt?
intermediation costs, low producer prices for many products and inadequate investment, particularly in market infrastructure.
• More broadly, with 42 per cent of the population employed but generating only 16 per cent of GDP, productivity in agriculture is low and poverty high (OECD 2021). On average farms are too small to provide a decent living and are getting smaller. In the long-term, the solution lies in providing economic opportunities that will draw people out of agriculture, while investing to strengthen the productivity and competitiveness of those who remain
• Variable input subsidies which amounted to almost 9% of the value of agricultural production in India in 2020 (OECD 2021) are intended to offset the generally low prices but actually incentivise wasteful production practices and are responsible for environmental damage, cause severe depletion of water resources and are increasing greenhouse gas emissions.
• The scale of India’s public stockholding system (used for food security but also to try to dampen price volatility) means that stocks in excess of needs sometimes accumulate, leaving India vulnerable to challenge for resort to direct or indirect export subsidies or unable to meet the conditions of the Bali “peace clause”.
• The TPDS is extremely costly, insufficiently targeted to those really in need, subject to huge waste and losses, and arguably perpetuating poor nutritional outcomes due to its focus on staple grains.
• While overall spending on agricultural and food policies is high, there is insufficient investment in infrastructure, farmer education, diversification and innovation, financial systems and risk management. These issues are widely understood and the case for reform
compelling. The government recognised this when it attempted to deregulate and improve the functioning of markets with new legislation in 2020, although those reforms have stalled due to ferocious opposition from farmers and other agents in the food

The Journal of Governance – January 2022 / 133
system. Experiments with direct benefit transfers (DBT) in place of distribution of lower priced food stables to poor consumers, and the PM-KISAN programme providing direct transfers to poor farmers, demonstrate an understanding of the need for more effective programmes but also caution about how to handle the transitions. The new Agriculture Infrastructure Fund is a step in the right direction. India has undertaken to reduce its GHG emissions intensity by 33-35% by 2030 compared to 2005, in the context of the 2016 Paris Agreement, and it is hard to see how the agriculture and food sector can escape from making some contribution to reaching that goal.
Could a more wide-ranging, more constructive approach from India to the negotiations on agriculture at the WTO support this broad reform agenda? A willingness from India to accept a phasing out of the Article 6.2 exemption of input subsidies from discipline could be an important additional step, helping India to reduce environmental, water and climate pressures and releasing scarce fiscal resources for more rewarding uses. Accepting meaningful disciplines on market interventions could support a more profitable, more diverse and market responsive food system. Given how high India’s bound tariffs currently are, India has some room to be flexible on the terms of an SSM. A significant acceleration of the move towards direct benefit transfers for poor households and poor farmers would release India from existing and possible future constraints on stock acquisition for food security policies that are, in any event, highly distorting, wasteful and insufficiently targeted to those in need. These changes would release finance for important investments elsewhere. These are the kind of win-win changes which India should be able to support. Should India express its willingness to move on these issues, other key players, so far unwilling to accept the loss of bargaining power which would result from piecemeal solutions, could also be persuaded to come to the table. Clearly, for India and for other WTO members, movement on these issues will only happen if the approach is comprehensive, allowing for the trade-offs that the different protagonists need, to be able to return to meaningful negotiations.

134/ India and the WTO Negotiations on Agriculture What strategy to adopt?
A new era in India’s relationship with the WTO?Finding a technical solution to the public stockholding for food
security issue is not insurmountable as explained above. Other solutions have also been proposed. But, following the clarification that the “peace clause” agreed at Bali in 2013 will remain in place until and unless a more permanent solution is found, India has no real motivation to move on this issue. But there are other issues where India could move, or even lead, with a view to getting agreement on new multilateral rules that would work in tandem with India’s own policy needs. Such a move is unlikely to happen unless as part of an explicit political willingness to play a different type of role than has been the case to date. In this scenario, India would bring its considerable weight and influence to bear to assist the WTO to work its way out of the crisis which threatens it.
The WTO is currently facing a series of existential threats: the disablement of the dispute settlement system by the refusal of the United States to allow the nomination of judges to the system’s appellate body; the inability to deliver on the DDA or any significant multilateral negotiations (other than the 2017 Trade Facilitation Agreement); how developing country status should be defined; tensions between the US and China and the negative effects which have spilled over to other Members; failure to adequately discipline subsidies or state controlled enterprises; uncertainty about the compatibility of climate or environment measures and WTO/GATT law; and a whole host of other issues. And, of course, the failure to move forward on agriculture!
While adherence to the GATT and to the WTO as a founding member reflect an often -repeated commitment to multilateralism and a belief in its potential to create economic benefits, in reality India has been a somewhat reluctant champion of broad and deep market opening. India adopts a mercantilist stance on trade in goods and has been slow to allow the WTO to venture into new areas (investment, competition, e-commerce). India does not participate in plurilaterals such as the Government Procurement Agreement, has not signed up to the most recent version of the Information Technology Agreement and is not participating in the Joint Services Initiative. It

The Journal of Governance – January 2022 / 135
has already been noted also that India has engaged much less than other emerging economies in preferential trade agreements.
Arguably, India has been losing out on further growth and development opportunities as a result of taking these positions. Academics and researchers concur on this point. It follows that f the multilateral system of trade governance can deliver significant benefits to India, India could and should play a leading role in safeguarding and strengthening it. In this broader context, India could do a lot, from engineering a change of tone in the domestic debate about the benefits and costs of further opening markets, to deploying both its public and private diplomacy to persuade other countries to change position (e.g. the US on nominations to the appellate body) and to come to the table ready to make concessions.
This article has shown that India has scope to adopt win-win policy solutions in agriculture and has suggested some very specific steps in that direction. While outside the scope of this article, there are many other areas of the economy in which India could undertake win-win reforms, increasing its own competitiveness and strengthening its hand at the WTO. There is an opportunity and a need for India to take on a leadership role as a champion of the multilateral system. At home, careful thought would need to be given to the nature and sequencing of domestic reforms and to management of the adjustment processes, in agriculture and elsewhere in the economy. Indicating a willingness to propose solutions on agriculture could be a first step. It would be a game-changer for India and potentially much more broadly for the WTO.
References:Gulati, Ashok. & Pursell, Garry. & Hanson, James A. (1990). Effective incentives
in India's agriculture : cotton, groundnuts, wheat, and rice. Washington D.C. (1818 H Street Nw, Washington DC 20433) : New Delhi Resident Mission and Country Economics Department, World Bank
OECD (2021), Agricultural Policy Monitoring and Evaluation 2021: Addressing the Challenges Facing Food Systems, OECD Publishing, Paris, https://doi.org/10.1787/2d810e01-en.

136/ India and the WTO Negotiations on Agriculture What strategy to adopt?
OECD/ICRIER (2018), Agricultural Policies in India, OECD Food and Agricultural Reviews, OECD Publishing, Paris, https://doi.org/10.1787/9789264302334-en.
Pathways 2021, “New Pathways for Progress in Multilateral Trade Negotiations in Agriculture” Coordinated by Carmel Cahill and Stefan Tangermann, with co-authors Lars Brink, Shenggen Fan, Joseph Glauber, Anàbel Gonzalez, Tim Groser, Ashok Gulati, Joanna Hewitt, Anwarul Hoda, Alan Matthews, and Guillermo Valles Galmes. https://newpathwaysagric.wordpress.com/
WTO 2018 G/AG/W174, G/AG/W/188, G/AG/W/189
*****

The Journal of Governance – January 2022 / 137
Governance covers how things are to be done. As defined by the United Nations (UN) governing is the process of decision-
making and the process by which decisions are implemented (or not implemented). 1
In the complex geography of intellectual property (IP) in agriculture, balancing private rights granted to IP holders with public interest poses particular challenges for governance. The relevant public at large in the context of IP legislation with respect to seed technologies are not simply the consumer-farmers and seed savers of the country, but all beneficiaries of the agri-food system. Intellectual property rights (IPRs) on plant varieties have implications for crop production, floriculture and horticulture.
In India, IP on plant varieties is granted under the Protection of Plant Varieties and Farmers' Rights (PPV&FR) Act of 2001. Plant variety protection (PVP) is a particular kind of IP that gives legal entitlements to plant breeders vis-à-vis the market for a prescribed period over the variety of a crop/tree/vine that the breeder(s) develops. The entitlements called plant breeder rights (PBRs) granted to a breeder through a plant variety certificate (PVC) essentially grant exclusive rights to produce, sell, market, distribute, import or export the breeder’s plant variety. As of April 2021, the PPV&FR Authority had issued a total of 4513 PVCs, since it began IP registrations in 2009. 2
Two particular features of the Indian law on PVP make it uniquely
Shalini Bhutani
Intellectual Property Governance, Plant Variety Protection and Public Interest
1 https://www.unescap.org/sites/default/files/good-governance.pdf 2 As per information on the web site of the PPV&FR Authority http://164.100.60.210/
List_of_Certificates.htm

138/ Intellectual Property Governance, Plant Variety Protection and Public Interest
sui generis and different from PVP laws in other countries. Firstly, the PPV&FR Act recognises farmers as breeders. In other countries, PVP laws typically only recognise formal breeders (whether from the public sector or private companies) and grant them PBRs. In the PPV&FR Act, the definition of ‘breeder’ includes a farmer or group of farmers who has bred, evolved or developed any variety. In India a farmer can seek IP as a breeder in two different categories of registration:
• either under the ‘farmers’ variety’ (FV) category over an existing variety, such as for varieties that have been traditionally cultivated and evolved by the farmers in their fields, or wild relatives, land races or varieties about which the farmers possess the common knowledge;
• or under the ‘new variety’ category for a novel variety, just as any other (public or private sector) breeder, if the variety conforms to the criteria of novelty, distinctiveness, uniformity and stability. As per government data on registrations released in October 2018 3, 774 PVCs had been issued to private seed companies and 1587 to individual farmers/farming community. Only one of those 1587 plant variety certificates is for a ‘new’ variety; meanwhile the majority of the ‘new variety’ registrations have been granted to seed companies, followed by ICAR and SAUs.
Secondly, the PPV&FR Act recognises and provides for farmers’ seed rights. This is made evident in Section 39(1)(iv) in Chapter VI on Farmers’ Rights, which reads:
Notwithstanding anything contained in this Act a farmer shall be deemed to be entitled to save, use, sow, re-sow, exchange, share or sell his farm produce including seed of a variety protected under this Act in the same manner as he was entitled before the coming into force of this Act;
Provided that the farmer shall not be entitled to sell branded seed of a variety protected under this Act.
Explanation: For the purposes of clause (iv), “branded seed” means any seed put in a package or any other container and labelled in a manner indicating that such seed is of a variety protected under this Act.
3Compendium of Registered Varieties under PPV&FR Act, 2001 http://164.100.60.210/pdf/CompendiumFinal27Oct2018.pdf

The Journal of Governance – January 2022 / 139
The main section recognises and guarantees farmers’ pre-existing seed rights even vis-à-vis an IP-protected plant variety. However, the proviso prohibits farmers from selling packaged seeds with a label if they are of an IP-protected variety under the law. This is because farm-saved seeds are the biggest competition to seed companies. If and when farmers save, exchange or sell seeds, it eats into the market of the companies selling seeds.
Being able to save, use, sow, re-sow, exchange, share and even sell seeds is considered as an inherent right of a farmer, even in international law. The International Treaty on Plant Genetic Resources for Food and Agriculture (ITPGRFA), also referred to as the seed/plant treaty, recognises such farmer seed freedoms. However, the treaty makes it the responsibility of national governments to help farmers realise those rights. Article 9.3 in the treaty states:
Nothing in this Article shall be interpreted to limit any rights that farmers have to save, use, exchange and sell farm-saved seed/propagating material, subject to national law and as appropriate.
The notable clause in the Article is ‘subject to national law’; thus in India, farmers’ seed rights are subject to the national legislation – the PPV&FR Act. Pro-farmer interpretation and implementation of the relevant provisions of the said Act to make possible farmers’ rights on seeds and planting material is crucial.
India is one of the countries that voted in favour of the United Nations Declaration on the Rights of Peasants and Other People Working in Rural Areas (UNDROP) leading to its adoption in December 2018. Article 19 of UNDROP elaborates various dimensions of farmers’ seed rights. Article 19(1)(d) clearly states that peasants and other people working in rural areas have the right to seeds, including the right to save, use, exchange and sell their farm-saved seed or propagating material. Significantly, the Article also imposes obligations on States towards farmers’ seed rights. It requires States to ensure that seed policies, plant variety protection and other IP laws, certification schemes and seed marketing laws respect and take into account the rights, needs and realities of peasants and other people working in rural areas. In other words, the UN Declaration gives guidance to States for seed governance.

140/ Intellectual Property Governance, Plant Variety Protection and Public Interest
The question that arises is how farmers’ rights are being interpreted and implemented in real-time. The reality has been that smallholder farmers and seed keepers in India never asked for IP for their seed innovation. In fact, the majority of farmers and non-governmental organisations working on sustainable agriculture in the country have resisted the very idea of any kind of exclusive controls on seeds and planting materials. IP in seeds and all other fields of technology was being advocated in the Uruguay Round (UR) of trade talks spanning 1986-1994 under the framework of the General Agreement on Tariffs and Trade (GATT 1947), the predecessor to the World Trade Organisation (WTO 1995). This was based on a demand by seed multinational corporations (MNCs) and corporate plant breeders for IPRs, either through patents or PVP. Farmers’ groups in India had launched a ‘Seed Satyagraha’ against the Dunkel draft of the WTO during the UR to focus on the implications of the IP clauses proposed in the said draft. 4 Despite that, the final text of the WTO’s Agreement on Trade-Related Aspects of Intellectual Property Rights (TRIPS) requires member countries to provide IP protection in the seed sector. To be WTO-compliant the Parliament of India passed the Protection of Plant Varieties and Farmers’ Rights Act, 2001, though in its wisdom it chose not to allow patents on plants.
PVP is generally considered less than another kind of IP – patent, in three main ways:
1. The Protection Period granted to the breeder PVP-holder is for lesser duration (15 years for crops; 18 years for trees and vines) versus 20 years of exclusive economic rights to patent holders.
2. A Research Exemption permits researchers the use of the variety under PVP without action against infringement.
3. Farmers’ Privilege allows using the PVP-protected variety for their own (subsistence) purposes (though as an exemption to breeder rights and not as a matter of right), which is not possible in case the variety is patented.
For these reasons, taking the PVP legislative route is a better political decision for governments. It allows them to be compliant with the WTO TRIPs Agreement, while exercising the flexibility granted by the said
4 Indian farmers rally against Dunkel Draft and MNCs https://www.sunsonline.org/trade/areas/agricult/03051093.htm

The Journal of Governance – January 2022 / 141
Agreement to not provide for patents on plants. The issue is that the global seed industry wants a higher level of PVP,
at least more than what the Indian law provides. This is made clear by the positions of the Indian Seed Federation (ISF), Asia & Pacific Seed Association (APSA) [See box] and the Federation of Seed Industry in India (FSII) in India. In fact, the FSII (which is a member of ISF) was formed in 2016 due to an IP dispute with the National Seed Association of India. ISF recommends that all countries adapt their national PVP laws to take up as many provisions of the UPOV Convention and its 1991 version. The International Union for the Protection of New Varieties of Plants, commonly known as the UPOV Convention 5, designed for and by corporate plant breeders in Europe in the 1960s is taken as the gold standard for PVP by seed MNCs. UPOV 1991 only recognises farmers’ seed freedoms as an ‘optional exception’ to the rights of the breeder over the planting material, and not as a matter of rights. 6 Fortunately for both smallholder farmers and public researchers, India is not a member of the UPOV Convention, even though the seed MNCs would like it to be. The PPV&FR Act, 2001 in its current form with a unique Farmers’ Rights chapter, is unacceptable to the UPOV Secretariat for its country members.
APSA’s Position on Farm-saved seedAPSA supports the ‘Farmers’ Privilege’ as provided in 1991 Act of the UPOV Convention, under which these activities including ‘subsistence farming’, which constitute acts done privately and for non-commercial purposes, are excluded from the scope of the breeder’s right, and farmers who conduct these kinds of activities freely benefit from the availability of the protected new varieties. APSA supports the optional exception, where each country of the region may within reasonable limits and subject to the safeguarding of the legitimate interests of the breeder of a protected variety allow farmers to use their own seed on their own farm but not for the purpose of ‘across the fence’ sales.
- APSA Position on Intellectual Property Rights For the Seed Industry 7
5 https://www.upov.int/portal/index.html.en 6 Article 15(2) on Exceptions to the Breeder’s Right in the 1991 Act of the UPOV
Convention7 Full text downloadable here: https://www.apsaseed.org/storage/2020/09/Position%20
Paper%20on%20Intellectual%20Property%20Rights_83682.pdf

142/ Intellectual Property Governance, Plant Variety Protection and Public Interest
IP on seeds and planting materials is not only important to the seed MNCs, but also the food and beverage majors. PepsiCo is the world’s second largest food and beverage major (after Nestle).
PepsiCo in India put the farmers’ rights provisions of the PPV&FR Act to the test. PepsiCo India Holdings Private Limited (PIH) initiated legal cases against potato farmers in Gujarat in effect challenging farmers’ seed freedoms. The petitioner company - PIH, a wholly owned subsidiary of an American MNC PepsiCo, filed these cases in April 2019 claiming that the defendant farmers had infringed its IPR on a potato variety FL 2027/FC5 by growing it and selling its produce without its consent and without paying it any royalty for its variety. This is a particular variety of potato that PIH uses for the manufacture of its branded Lay’s chip business. PIH was demanding a relief from courts in the form of a permanent injunction restraining the farmers from using its potato variety FL 2027 registered under the PPV&FR Act or other varieties similar thereto. PIH sought Rs 1.05 crore per farmer in each of the four cases in a Commercial Court in Ahmedabad, Gujarat.
In 2018, the company had also filed cases against other farmers, traders, cold storage owners and local snacks businesses in Gujarat. This was the first time in India that farmers were sued in this manner under the PPV&FR Act, in spite of the farmer-friendly Section 39(1)(iv) in the law. But the legal proceedings did not lead to any interpretation of the said legal section by the courts. The cases were unconditionally withdrawn by PIH due to popular pressure and the public campaign, which ran during the April - May 2019 general elections.
In June 2019, an application seeking revocation of PepsiCo’s plant variety registration was filed by a farmers' rights activist – Ms Kavitha Kuruganti. In her own words, she did this "as a public-spirited citizen, with the support of other activists and experts in this field…to ensure that the spirit of the unique Indian legislation, wherein farmers' rights are unambiguously enshrined like nowhere else in the world, is upheld". The application for revocation invoked Section 34 of the PPV&FR Act, particularly its provision defending public interest.
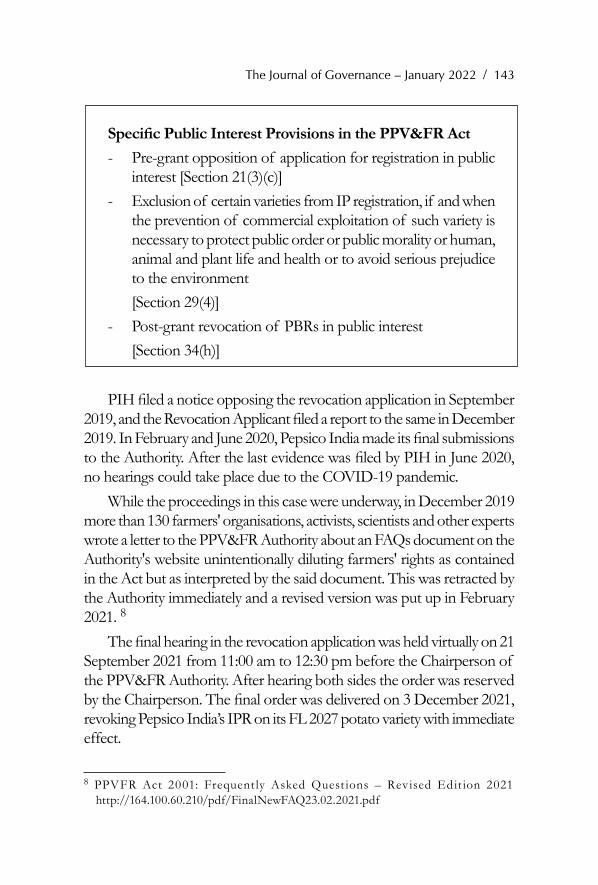
The Journal of Governance – January 2022 / 143
Specific Public Interest Provisions in the PPV&FR Act- Pre-grant opposition of application for registration in public
interest [Section 21(3)(c)]- Exclusion of certain varieties from IP registration, if and when
the prevention of commercial exploitation of such variety is necessary to protect public order or public morality or human, animal and plant life and health or to avoid serious prejudice to the environment
[Section 29(4)]- Post-grant revocation of PBRs in public interest [Section 34(h)]
PIH filed a notice opposing the revocation application in September 2019, and the Revocation Applicant filed a report to the same in December 2019. In February and June 2020, Pepsico India made its final submissions to the Authority. After the last evidence was filed by PIH in June 2020, no hearings could take place due to the COVID-19 pandemic.
While the proceedings in this case were underway, in December 2019 more than 130 farmers' organisations, activists, scientists and other experts wrote a letter to the PPV&FR Authority about an FAQs document on the Authority's website unintentionally diluting farmers' rights as contained in the Act but as interpreted by the said document. This was retracted by the Authority immediately and a revised version was put up in February 2021. 8
The final hearing in the revocation application was held virtually on 21 September 2021 from 11:00 am to 12:30 pm before the Chairperson of the PPV&FR Authority. After hearing both sides the order was reserved by the Chairperson. The final order was delivered on 3 December 2021, revoking Pepsico India’s IPR on its FL 2027 potato variety with immediate effect.
8 PPVFR Act 2001: Frequent ly Asked Quest ions – Revised Edit ion 2021 http://164.100.60.210/pdf/FinalNewFAQ23.02.2021.pdf

144/ Intellectual Property Governance, Plant Variety Protection and Public Interest
This in an important case related to India's unique sui generis statute. Unlike other applications for revocation, this is not a routine case in which one commercial seed company was challenging the grant of PVP to another seed company. While the revocation of the company’s breeder rights might be seen as a victory for the public campaign, but the 79 page judgement falls short of elucidating either farmers’ rights or public interest. The Chairperson defends the revocation largely on procedural deficiencies and incorrect information provided by the registered breeder.
In IP governance, what is not only critical is the process and procedures followed, but also the structures in place for governing the area. This brings into focus the role of the PPV&FR Authority. As per legislative intent and provisions of the law, this governmental agency is not only to grant IP, but also has responsibilities as the guardian of farmers’ rights. Yet there are currently no guidelines to aid the administrators on how to implement and enforce farmers’ seed rights. The Supreme Court of India has generally held that while determining public interest, one is not to see an imaginary grievance or wounded pride, but what is happening in real. The challenge to farmers’ rights from strong IP-holders (such as MNCs) is a real threat.
A National IPR Policy was announced by the Government of India in 2016. While it recognises that farmers are “the less visible and silent IP generators and holders, especially in the rural and remote areas”, it is focused on how to get more farmers to seek IPR. It neither acknowledges the positions taken by opposing farmers against IP, nor does it deal with the practical problems faced by farmers in being able to commercialise the varieties they might have registered under the PPV&FR Act. A Parliamentary Standing Committee of the Ministry of Commerce released its report on the Review of IPRs Regime in India in July 2021. 9 While the Committee correctly notes that acculturation of Indian farmers and farming communities in IPRs is far from being achieved in India, it should instead respect and recognise the socio-cultural ethos of these farmers. Instead, it recommends that the Government should make all out efforts to make farmers and farming communities voluntarily embrace
9 ht t ps ://r a j ya sabh a .n i c . i n/r sne w/Com m it t ee _ s i t e/Com m it t ee _ F i l e/ReportFile/13/141/161_2021_7_15.pdf

The Journal of Governance – January 2022 / 145
IP. Notably it makes only passing reference to the legal battles on IP in seed technology that India has witnessed.
ConclusionGood IP governance implies a framework for the management of
the country intellectual heritage and intangible assets, such as farmers’ knowledge on crop varieties. As the country veers towards corporate-driven agriculture with companies insistent on IP enforcement, governing this area will require much political will. IP over seed technologies has become a key source of the rental income of MNCs. The one who owns and exercise control over a resource, is able to influence the rules of the game in that area. In this scenario it will become all the more important to have adequate regulation to balance IP with public interest.
In the interest of the public, the GoI has shown leadership at the WTO to demand a waiver of certain provision of TRIPS to ensure that IPR do not create barriers to the timely access to affordable medical products including vaccines and medicines or to scaling-up of research, development, manufacturing and supply of medical products essential to combat COVID-19. 10 Similar interventions are required on the seeds front to guarantee accessibility and availability of planting material. The lived experience of India with IP in the seed sector makes it a fit case to insist on safeguards against the abuse of IPRs. Based on the experience, the following steps must be taken:
- An unequivocal interpretation of farmers’ seed freedoms as laid down in Section 39(1)(iv) of the PPV&FR Act must be forthcoming from the Authority
- The practical difficulties faced by farmers with respect to the realisation of farmers’ rights under the Act need to be collated and factored into future implementation of the Act and its Rules & Regulations
- Clear guidance on what is ‘public interest’ in the administration of the Act and its Rules is urgently needed; the rich jurisprudence on public interest developing in Indian courts must be brought to the notice of the functionaries in the Authority
10 file:///Users/shalini/Downloads/W669.pdf

146/ Intellectual Property Governance, Plant Variety Protection and Public Interest
- Certificates of PVP Registration granted to the breeder-applicants must insist that the PVP-holder’s rights are subject to farmers’ seed freedoms and after the grant of PVP, the PPV&FR Authority must have a mechanism to monitor how the PVP-holders are abiding by the law, particularly its farmers’ rights provisions
- PVP registration of plant varieties should be revoked when harassment of farmers takes place through frivolous litigation by private companies/PVP-holders; a suitable clause on this must be introduced in the PVC, if required
- Contracts of companies doing contract farming with farmers as ‘growers’, must not violate the legal rights conferred on farmers by the PPV&FR Act, 2001
- Along with reviving WTO/Trade cells, Farmers’ Rights Desks/Offices should be opened in all states, just as regional offices of the PPV&FR Authority have been operationalised in different parts of India to grant PVP
- Any ‘WTO-plus’ IP demands in free trade agreements or bilateral investment treaties insisting on UPOV Convention membership must be outrightly rejected
- Any parliamentary or governmental review of IP must be open to public consultation with the full participation of the original seed keepers – the farmers
Farmers’ seed rights are not simply a matter for farmers. We all benefit from the seed diversity that farmers help conserve and promote. IP governance must guarantee these rights as a matter of human rights and public interest.
*****

The Journal of Governance – January 2022 / 147
BackdropThe recently released Global Hunger Index (GHI) 2021 has
placed India at the 101st position out of the 116 countries. Despite improvements in the GHI score over the last two decades, from 38.9 in 2000 to 27.5 in 2021, India continues to suffer from serious levels of hunger. By contrast, China and Brazil rank among the top 19 countries with a GHI score of less than 5. An examination of the GHI, which captures the multi-dimensional nature of hunger at global, regional, and national level based on four components – undernourishment (insufficient calorie intake), child wasting (low weight-for-height), child stunting (low height-for-age), and child mortality (under-five mortality) – shows that India has been performing poorly in terms of reducing the incidence of hunger. South-Asian economies including Sri Lanka (65), Nepal (76), Bangladesh (76), and Pakistan (92) have also fared better than India in the 2021 GHI ranking (figure 1). Figure 1: GHI score: India and other countries
Shyma Jose & Kriti Khurana
The Deteriorating Child Nutritional Status in India
Evidence from NFHS 2019-20
Source: Global Hunger Index (2021)Note: Figures in parenthesis are the 2021 GHI ranking

148/ The Deteriorating Child Nutritional Status in India Evidence from NFHS 2019-20
However, the Government of India has challenged India’s lower GHI 2021 ranking to be “devoid of ground reality and facts and suffer from serious methodological issues” (GoI, 2021, pp1). The bone of contention is the methodology used by the Food and Agricultural Organisation (FAO) to estimate the undernourished population. The fact is that the FAO’s methodology to assess the share of the undernourishment population is based on Gallup poll, a telephonic survey-based estimate of the population which captures several indicators ranging from food availability, food consumption patterns, income levels and distribution, population structure (GoI, 2021; Sinha, 2021b).
The government’s criticism of GHI ranking is that the Gallop polls do not include questions to capture the efforts by the central government to ensure food security of the entire population during the pandemic and is rather unreasonable. Essentially, the attention should have been focussed on efforts to comprehend: why India fares poorly in GHI ranking and how the country could improve its ranking in coming years?
A low intake of essential nutrients like proteins, calories, fats and micronutrients especially in early childhood, results in children being underweight, stunting and wasting. All these factors lead to a burden on public health thus highlighting the importance of food and nutritional security. Recognizing the importance of nutrition to the development of a nation as well as to the world economy, the SDGs of 2030 agenda has placed nutrition as one of the most important goals with at least 12 of the 17 SDGs having relevance to nutrition. Notably, the United Nations (UN) considers improvement in child health to identify whether the world is close to achieve the sub-target 2.2, to “end all forms of malnutrition by 2030” which comes under the SDG goal 2 to “end hunger, achieve food security and improved nutrition, and promote sustainable agriculture”. It is important, since undernutrition puts children at a greater risk of disease vulnerability and affects their physical, cognitive and mental development (Barker, 1995). Moreover, nearly half of all deaths in children under 5 years of age is attributed to undernutrition (UNICEF, 2021).
The latest report on ‘The State of Food Security and Nutrition

The Journal of Governance – January 2022 / 149
in the World’ published by FAO, IFAD, UNICEF, WFP and WHO, documents that in 2018-20, of the 683.9 million undernourished people globally, around 208.6 (30.5 per cent) people were living in India compared to 122.4 million in China, 15.9 million in Bangladesh, 27.9 million in Pakistan and 29.4 million in Nigeria (FAO, IFAD, UNICEF, WFP and WHO, 2021) (Figure 2). Despite the large scale food security programmes in India, it still accounts for the largest undernourished population in the world (208.6 million). Appallingly, the number of undernourished population in India has increased from 189.2 million in 2017-19 to 208.6 in 2018-20 (FAO, IFAD, UNICEF, WFP and WHO, 2021). Figure 2: Distribution of undernourished people around the
world
Source: Food and Agriculture Organisation (FAO), 2015, 2021Note: The data of the number of undernourished people in China is for 2016-18 as the data for 2018-20 was not reported.
Globally, around 149.2 million children under 5 years of age are stunted, increasing from 21.3 per cent in 2016-18 to 22 per cent in 2018-20. Wasting affected the lives of around 6.7 per cent or 45.4 million children under five years of age. During 2020, close to 30.9 per cent (36.1 million) of the world’s stunted children under five years of age (measured by low height for age) and 17.3 (20.1 million) of the world’s wasted children (low weight for height) were from India (FAO et al. 2021).

150/ The Deteriorating Child Nutritional Status in India Evidence from NFHS 2019-20
India has performed poorly on all the standard nutritional measures compared to other countries in the year 2020. Due to chronic undernutrition or stunting around 47 million or 4 out of 10 children in India are not meeting their full human potential (United Nations, n.d.). The association between stunting and undernourishment by log GDP per capita (a measure of economic growth) for various countries across the world is given in figure 3. The GDP per capita is negatively correlated with malnutrition (stunting and wasting) among children. Countries with high GDP per capita have a low level of stunting and wasting including China, Malaysia and South Africa. It is therefore evident that high GDP per capita reduces child undernutrition, with its impact being the strongest on the incidence of wasting. Figure 3: Number of stunted and wasted children under five years
by nation’s GDP per capita (Constant 2015 US$)

The Journal of Governance – January 2022 / 151
Source: The State of Food Security and Nutrition in the World 2021 (FAO, IFAD, UNICEF, WFP and WHO, 2021) and World Bank
Nutritional status in India: Evidence from NFHS-5 (2019-20)The recently released National Family Health Survey (NFHS-5)
for 2019-20, which has released data on nutritional indicators only for 22 states/UTs 1, also paints a worrying picture of child nutrition in India. Contrary to the expectations, NFHS 5 results revealed that most of the Indian states have performed poorly across most standard child nutritional measures including stunting, wasting and underweight among children under the age of five years. The burden of undernutrition among children under the age of five years has not changed even with various intervention programs launched by the Government of India. In this paper, we will examine how did the Indian states perform concerning nutritional outcomes using the latest data NFHS (2019-20). Importantly, the paper will also note, state-wise, the various determinants of malnutrition among children
1 The data for Arunachal Pradesh, Chhattisgarh, Delhi, Haryana, Jharkhand, Madhya Pradesh, Odisha, Punjab Rajasthan, Tamil Nadu, Uttar Pradesh and Uttarakhand has not been released by NFHS- 2019-20 till now.

152/ The Deteriorating Child Nutritional Status in India Evidence from NFHS 2019-20
under five years of age to see if there has been any progress in 2019-20. In the paper, we have used weighted average of 18 states to illustrate overall picture, albeit, the comparison at all-India level using NFHS 2015-16 and NFHS 2019-20 may not be precise.
Using the data on 18 states 2 from NFHS-5 (2019-20), we observe that the prevalence of malnutrition measured by anthropometric indicators, namely, stunting (low-height-for-age), wasting (low-weight-for-height) and underweight (low-weight-for-age) has increased at state-level. The percentage of children (under the age of 5 years) that are stunted have not shown any significant improvement since 2015-16 in all the surveyed states and union territories except Bihar, Karnataka, Assam and Manipur (figure 4a). The most significant increase in stunting was found in Telangana and Tripura.
Similarly, wasting among children under the age of five years increased significantly in Bihar, Telangana, Assam, Nagaland, Jammu & Kashmir, Himachal Pradesh, Manipur and Mizoram (figure 4b). At the national level, in 2019-20, we found that about 35 per cent of children before 5 years of age were stunted, 21 per cent were wasted and 34 per cent were underweight (based on the weighted average (for 18 states).3
Anaemia 4, an indicator of poor health and nutrition, is a major health problem among children particularly in the age of 6-59 months in India. Various factors including iron and nutritional deficiency, obesity, chronic infection, non-communicable diseases cause anaemia among children.
In India, anaemia among children has worsened in almost all the states according to NFHS-5. The highest percentage increase of children in the age of 6-59 months suffering from anaemia was observed in Gujarat (79.7 per cent), Jammu & Kashmir (72.7 per cent), Bihar (69.4 per cent), West Bengal (69 per cent) and Maharashtra (68.9 per cent) (figure 4d). Also the prevalence of anaemia among children
2 We have included Jammu and Kashmir as a state in our analysis.3 To compute the weighted average of 18 states, we have used 2019 state-wise projected
population from the Population Projection of Census 2011 (published by MOH&FW, 2019) as weights.
4 An estimated 269 million children aged 6–59 months suffer from anaemia globally (WHO 2021).

The Journal of Governance – January 2022 / 153
aged 6–59 months has significantly gone up in the North-eastern states such as Assam, Mizoram, Nagaland, Manipur and Sikkim, which had the lowest level of anaemia among children in 2015-16. Additionally, there has been an increase in anaemia among children the age of 6-59 months from 58.6 per cent in 2015-16 to 67.3 per cent (based on weighted averages of 18 states) in 2019-20.Figure 4: Nutritional status among children in India: NFHS 4
(2015-16) and NFHS 5 (2019-20)

154/ The Deteriorating Child Nutritional Status in India Evidence from NFHS 2019-20
Source: National Family Health Survey, 2015-16 and 2019-20, IIPS
The child malnutrition indicators of NFHS 5 are certainly a cause of concern and thus require urgent action. In this regard, it is important to understand the determinants which impact the nutritional status of children under the age of five years.
Determinants of malnutritionThe UNICEF’s Framework for Causes of Child Undernutrition
highlights that the factors responsible for child undernutrition can be segregated into basic, underlying and immediate. Socio-economic, environmental and political factors are some of the basic determinants which, in turn, impact underlying determinants including access to household food security, proper care, healthy household environment and health care services while the immediate determinants of undernutrition include inadequate dietary intake and diseases (UNICEF, 1991). Studies, such as Tontisirin and Gillespie

The Journal of Governance – January 2022 / 155
(2001), have highlighted that the interaction between these immediate determinants increases the livelihood of high morbidity and mortality in developing countries. Moreover, India State-Level Disease Burden Initiative Malnutrition Collaborator Report (2019) found around 68.2 per cent of total under-five deaths (1.04 million in 2017) in India were primarily due to under-nutrition.
The seminal work in the Lancet series (2008) has emphasized that for achieving a substantial decline in undernutrition, addressing the underlying factors is significant; however, programmatic health and nutritional interventions are equally important for the prevention of undernutrition. Menon et al. (2017) have integrated the UNICEF Framework and Lancet Series (2008) findings to classify the determinants of undernutrition into immediate, nutritional inventions, and underlying determinants. The nutrition-specific interventions have direct linkages between food insecurity and undernutrition and thus, is considered a significant determinant of malnutrition in our framework (Figure 5). Figure 5: UNICEF’s Framework for Causes of Undernutrition
Source: Adapted and modified from UNICEF (1990) and Lancet Nutrition Series (2008)

156/ The Deteriorating Child Nutritional Status in India Evidence from NFHS 2019-20
One of the immediate determinants that is closely associated with child nutritional status is mother’s nutritional status which has intergenerational impact on child’s health (Gulati et al., 2012, Delisle, 2008, Jose et al. 2020). The mother’s body mass index can be used as a proxy to measure mother’s nutritional status 5. In 2019-20, there has been significant improvement in mothers’ nutritional status across states as compared to 2015-16. Kerala was an exception where there has been a marginal increase in percentage of women with low BMI index during the period (9.7 to 10.1 per cent) (Figure 6). Figure 6: Percentage of mothers with low BMI index, NFHS-4
(2015-16) and NFHS-5 (2019-20)
Source: NFHS-4 & NFHS-5, IIPS
Child feeding practices which include exclusive breastfeeding in the first six months after birth, continued breastfeeding till two years of age as well as providing nutritious diet at the age of six months (particularly in the weaning period) also determine the nutritional outcomes in children. One of the important elements of infant and child feeding practices is initiation of breastfeeding which requires new born to be put to breast within an hour of birth. On an average, 47.7 per cent of children were breastfed within one hour in 2019-20, which was a considerable increase from 41.5 per cent in 2015-16. Some states such as Goa, Kerala, Meghalaya, and Mizoram have more than 60 per cent of children put to breastfed within one hour.
5 Mothers with a BMI lower than 18.5 kg/m^(2 )are classified as suffering from under-nutrition.

The Journal of Governance – January 2022 / 157
Additionally, there has been considerable improvement in exclusive breastfeeding practices for children below six months of age, which has increased from 55 per cent in 2015-16 to 62.5 per cent (based on weighted averages of 18 states) in 2019-20 (Figure 7). Of the states whose data has been made available in NFHS-5, only Maharashtra, and Manipur have more than 70 per cent of children who were exclusively breastfed. WHO recommends exclusive breastfeeding for children in the first six months and this needs to prioritised in the other states as well.
Another important element of child feeding practices is introducing complementary and nutritious food after the first six months to ensure appropriate child growth and cognitive development. The lack of a diverse diet and frequent meals is closely related to stunting whereas consequent micronutrient deficiency leads to increased morbidity and mortality among children. In 2019-20, 12.7 per cent of children on an average received minimum adequate diet well above 9.6 per cent in 2015-16. However, a recent study shows that an estimated 45 - 64 per cent of rural poor cannot afford a nutritious diet (Raghunathan et al.2020), which calls policy action to include nutritious food such as millets and biofortified staples in nutritional security programmes. Figure 7: Percentage of children who were exclusively breastfed,
2019-20 and 2015-16
Source: NFHS-4 & NFHS-5, IIPS

158/ The Deteriorating Child Nutritional Status in India Evidence from NFHS 2019-20
Access to nutrition specific inventions including prenatal and postnatal health care and delivery at health care facility have been found to have significant impact on child undernutrition (Menon et al., 2018; Jose et al. 2020). The lack of proper antenatal care coupled with institutional deliveries are also associated with maternal and child mortality rates (Pradhan and Arokiasamy, 2006; UNICEF 2004). While institutional deliveries have been rising over the years in most states between 2015-16 and 2019-20, the weighted average of the 18 states shows that around 77.8 per cent of children were born in institutions in 2019-20 (Figure 8).Figure 8: Percentage of live birth through institutional deliveries (in
the five years before the survey), 2015-16 and 2019-20
Source: NFHS-4 & NFHS-5, IIPS
Additionally, in last five years, the share of women receiving four or more Antenatal Care (ANC) visits during their pregnancy, as recommended by WHO, has significantly increased from 51.2 per cent to 62.9 per cent (weighted average of 18 states) between 2015-16 and 2019-20. State wise picture shows that Gujarat, Himachal Pradesh, West Bengal, Jammu & Kashmir, Manipur, Karnataka Telangana and Kerala have more than 70 per cent of women receiving more than four antenatal care. However, Bihar and Nagaland still have close to a quarter of women with four or more antenatal check-ups.
Like prenatal care, postnatal care for children includes basic immunisation and vitamin supplements decreases the probability of
The Journal of Governance – January 2022 / 159
undernutrition in children (Menon et al., 2018, Gulati et al. 2012). According to NHFS-5, the share of children ages 12-23 months receiving all the basic vaccination 6 was 82 per cent among the 18 states, ranging from 96 per cent each in Jammu & Kashmir and Himachal Pradesh to 66 per cent in Assam.
The major underlying factors responsible for malnutrition, as mentioned earlier in UNICEF’s framework include household food insecurity, inadequate household environment and lack of access to health care facilities which further gets affected by economic factors including income poverty. Black et al. (2008) in their study found that household’s ability to feed adequate and balanced micro-nutrient rich food to children as well as the household’s ability to demand child and maternal health care services gets significantly affected by poverty. Although poverty reduction reduces the risk of undernutrition, however, eliminating poverty is not enough for ending malnutrition (Radhakrishna et al 2004), it requires multi-pronged policies to tackle the multi-dimensional problem of undernutrition.
Studies, such as Gillespie and Haddad (2001); Spears, Ghosh and Cumming (2013); Alderman and Headey (2017); Gulati et al. (2012), Jose et.al (2020), suggest that mothers’ education is one of the underlying determinant which strongly associated with the nutritional outcomes of children. Higher education among women, in particular, strongly correlates with women autonomy in decision making, sanitation and hygiene, and child caring practice (Jose et.al 2020). In 2015-16, 69 per cent of women were literate, albeit, only a tenth of women received higher education. However, in 2019-20, around 75 per cent of women (weighted average of 18 states) were literate with states such as Goa, Kerala, Mizoram and Himachal Pradesh reporting more than 90 per cent of women being literate. Using the data for same 18 states, we found that 41.4 per cent (weighted average) of women reported more than 10 years of schooling in 2019-20, ranging from 77 per cent in Kerala to 23.2 per cent in Tripura (Figure 9).
6 BCG, measles, and three doses of DPT and polio vaccine

160/ The Deteriorating Child Nutritional Status in India Evidence from NFHS 2019-20
Figure 9: Percentage of women with 10 or more years of schooling (%)
Source: NFHS-4 & NFHS-5, IIPS
Despite the priority given to education in various Centrally Sponsored Schemes (CSS), there are still vast variations in levels of higher education among women across states. Mother’s education affects the child’s nutritional outcomes through numerous pathways as it is strongly associated with improved sanitation and hygiene practices, adequate and appropriate breastfeeding practices and initiation of nutritious diet after six months.
Like mother’s education, a healthy household environment also makes a significant impact on the child nutritional status. The two household amenities that can be taken as a proxy to measure a healthy household environment and that have a significant impact on nutritional outcomes are the type of sanitation facilities available and drinking water sources (Spears, Ghosh and Cumming, 2013; Gulati et al. 2012, Jose et al. 2020). The synergy between Water, Sanitation and Hygiene (WASH) initiatives and nutrition-specific interventions will have a multiplier effect on improving nutritional outcomes. Consequently, the central government has been leveraging WASH through the Swachh Bharat Abhiyaan and Jal Jeevan mission to improve nutritional outcomes in recent years. During 2019-20, the weighted average of 18 states showed that around 70 per cent of the

The Journal of Governance – January 2022 / 161
household had improved sanitation facilities. 7 Most states reported improvement in sanitation facilities between 2015-16 and 2019-20 except Sikkim where household with improved sanitation facilities marginally fell from 89 to 87 per cent (Figure 10). States that have performed better in sanitation are Kerala, Sikkim, Mizoram, Punjab and Haryana while Bihar, Jharkhand, Odisha and Chhattisgarh need targeted and focused interventions to further improve access to improved sanitation facilities.Figure 10: Percentage of household with improved sanitation facility (%)
Source: NFHS-4 & NFHS-5, IIPS
On the contrary, Bihar, has done reasonably well with respect to improved drinking water facilities apart from Punjab, Sikkim, Telangana and Goa. However, Manipur, Meghalaya and Jharkhand have performed poorly in providing household with safe drinking water facilities. 8 Further research needs to be conducted to understand the reason for deteriorating WASH indicators in Sikkim over the two NFHS periods (Figure 11).
7 Improved sanitation facility includes “flush to piped sewer system, flush to septic tank, flush to pit latrine, flush to don't know where, ventilated improved pit (VIP)/biogas latrine, pit latrine with slab, twin pit/composting toilet, which is not shared with any other household. This indicator does not denote access to toilet facility” (IIPS, 2016, pp3).
8 Safe drinking water includes “piped water into dwelling/yard/plot, piped to neighbour, public tap/standpipe, tube well or borehole, protected dug well, protected spring, rainwater, tanker truck, cart with small tank, bottled water, community RO plant” ” (IIPS, 2016, pp3).

162/ The Deteriorating Child Nutritional Status in India Evidence from NFHS 2019-20
Figure 11: Percentage of household with improved drinking facility (%)
Source: NFHS-4 & NFHS-5, IIPS
Expenditure by the government on nutritional programmesIt is clear from the above discussion that the nutritional situation
as reflected in child stunting, wasting and underweight along with anaemia has not shown desired level of improvement in many parts of the country between 2015-16 and 2019-20. With only 9 years remaining to SDG goals, the pertinent question is if the budgetary allocation towards various nutritional programmes is well equipped to achieve nutritional security by 2030?
Even today, about 800 million Indians still depend upon the Public Distribution System (PDS) (the world's largest food safety net program) to meet their food and nutritional needs. Moreover, a recent study has estimated that access to these nutritional programmes, particularly mid-day meals scheme, results in intergenerational improvements in child linear growth (Chakrabarti 2021). The access to and coverage of nutritional intervention which, in turn, depends upon the adequate fiscal support, is important to make a significant dent in the malnutritional level in the country.
In the current Union budget 2021-22, a total of Rs 4.14 lakh crore has been earmarked for nutrition and other related programmes including ICDS, MDM, NFSA, National Health Mission, Swachh

The Journal of Governance – January 2022 / 163
Bharat Mission, National Education Mission, SAMARTHYA, etc (Table 1). The pressing need for a big hike in the direct nutritional programmes such as the Anganwadi programme and mid-day meals scheme was expected out of the union budget but instead, there was a decline in the allocation in some of the important nutritional schemes. This year, the four centrally sponsored schemes – Anganwadi services, POSHAN Abhiyan, Scheme for Adolescent Girls and National Creche Scheme – have been merged to form a new scheme - Saksham Anganwadi or Mission POSHAN 2.0 with a fiscal outlay of Rs 20,105 crore in 2021-22 (Table 1). The budget allocation of the schemes included in SAKSHAM in 2020 was Rs 24,557.4 crore in 2020 (Sinha 2021a). Also, the budget allocated to the Ministry of Women and Child Development (MWCD) has fallen short of its budget demand. The allocation for the mid-day meal scheme for 2021-22 is Rs 11,500 crore which is lower than the revised estimates of Rs 12,900 crore for 2020-21. Even the revised estimates for umbrella ICDS declined to Rs 20038.31 crore in 2020-21 compared to the actual estimates of Rs 22031.66 crore in 2019-20.
To strengthen the supplementary nutrition, the 15th Finance Commission had proposed a grant of Rs 7,735 crores for the states in its initial 2020-21 report. However, this recommendation was not retained in the final report with the finance commission’s view that child and maternal nutrition should be prioritised by the government through Anganwadi services without making an associated budgetary recommendation.
Table 1: Budgetary allocation under various nutritional programmes (In Rs. Crore)
Programmes 2019-20 (Actual)
2020-21 (RE)
2021-22 (BE)
Food Security ProgrammesNational Food Security Act 1,08,688.4 4,22,618.14 2,42,836.0
Health ProgrammesNational Health Mission 34,659.53 35,144.25 36,575.50Ayushman Bharat 3,200 3,100 6,400
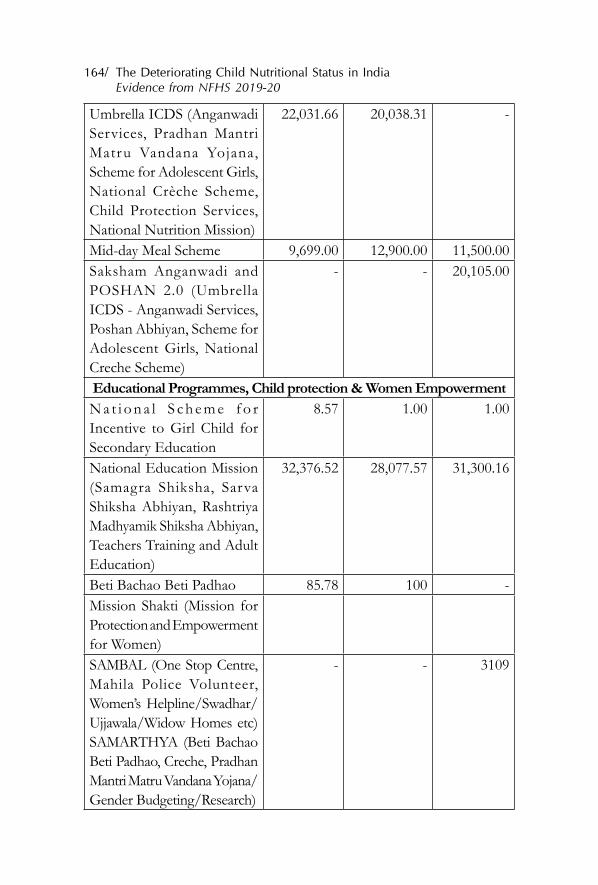
164/ The Deteriorating Child Nutritional Status in India Evidence from NFHS 2019-20
Umbrella ICDS (Anganwadi Services, Pradhan Mantri Matru Vandana Yojana, Scheme for Adolescent Girls, National Crèche Scheme, Child Protection Services, National Nutrition Mission)
22,031.66 20,038.31 -
Mid-day Meal Scheme 9,699.00 12,900.00 11,500.00Saksham Anganwadi and POSHAN 2.0 (Umbrella ICDS - Anganwadi Services, Poshan Abhiyan, Scheme for Adolescent Girls, National Creche Scheme)
- - 20,105.00
Educational Programmes, Child protection & Women EmpowermentN a t i o n a l S ch e m e f o r Incentive to Girl Child for Secondary Education
8.57 1.00 1.00
National Education Mission (Samagra Shiksha, Sarva Shiksha Abhiyan, Rashtriya Madhyamik Shiksha Abhiyan, Teachers Training and Adult Education)
32,376.52 28,077.57 31,300.16
Beti Bachao Beti Padhao 85.78 100 -Mission Shakti (Mission for Protection and Empowerment for Women)SAMBAL (One Stop Centre, Mahila Police Volunteer, Women’s Helpline/Swadhar/Ujjawala/Widow Homes etc) SAMARTHYA (Beti Bachao Beti Padhao, Creche, Pradhan Mantri Matru Vandana Yojana/Gender Budgeting/Research)
- - 3109

The Journal of Governance – January 2022 / 165
Water and Sanitation ProgrammesJal Jeevan Mission (JJM)/National Rural Drinking Water Mission
10,030.42 11,000.00 50,011.00
Swachh Bharat Mission (Rural)
8,213.03 6,000.00 9,994.10
Swachh Bharat Mission (Urban)
1,255.73 1,000.01 2,300.00
Source: Union Budgets, GoI (Various Years)
This year, Pradhan Mantri Matru Vandana Yojana, the scheme for maternity benefits, is now a part of SAMARTHYA scheme along with other schemes such as Beti Bacho Beti Padhao. The combined allocation of Mission Shakti (which includes SAMBAL and SAMRTHYA scheme) for the year 2021-22 is Rs 3109 crore. We see a clear reduction in the allocation towards nutritional schemes which has already being suffering from poor fiscal support despite the increasing prevalence of malnutrition in many states (Sinha 2021a).
Conclusion and way forwardChild nutritional outcomes including stunting, wasting and
underweight have deteriorated in many states as per the latest data released by the National Family Health Survey-5 of 2019-20. Worsening malnutrition rates could contribute to the disease burden in India while increasing the predominant risk for under-five death among children (Lancet 2019). Despite the various schemes launched by the government to tackle undernutrition, it is glaring that the child nutritional outcomes are not trickling down. Even anaemia is high among women and children in the country, increasing the risk of mortality.
What are the solutions that could bring India close to achieving the SDG goal of ending malnutrition by 2030?
Firstly, the piecemeal approach of the governments’ food distribution programmes including the mid-day meal (MDM) scheme, the Anganwadi system under the Integrated Child Development Scheme (ICDS), and subsidised food grains through the public

166/ The Deteriorating Child Nutritional Status in India Evidence from NFHS 2019-20
distribution system (PDS), seems to have surpassed its goal of improving the nutritional status of the population. Moreover, the decline in allocation in the Union budget towards nutrition-sensitive programmes could further negate the progress achieved till now to meet the SDG goal of ending malnutrition by 2030. It is satisfying that the Mission POSHAN 2.0 aims to undertake an ‘intensified strategy’ of improving the nutritional outcomes across 112 aspirational districts in India. However, with an increase in the prevalence of under-nutrition in some of the states, as reported in NFHS-5, there is a need to focus on the nutritional outcomes beyond 112 districts.
Secondly, the focus of these food-based welfare schemes needs to shift from staples such as rice and wheat to providing nutritious foodgrains such as coarse grains, pulses, and millets. An innovative solution to improve accessibility to nutritious diets, particularly in areas affected by undernutrition/micro-nutrient deficiency is bio-fortification, which incorporates important nutrients into the seeds of major staples. Studies have shown various examples of this innovative technology having been implemented successfully in different parts of the world (Ruel et al., 1999; Gulati et al., 2012; von Braun, 2010). The World Health Organisation also recommends fortification of rice with iron and wheat flour with folic acid to improve the iron status and intake of folate in regions with a high prevalence of anaemia. The Harvest-Plus programme of the Consultative Group on International Agricultural Research (CGIAR) has been promoting iron-fortified pearl millet and zinc-fortified wheat to improve nutrition and public health in India. Notably, by 2024, the central government has proposed to provide fortified rice to the poor under the aegis of various food-based government schemes. Food fortification will tackle only one aspect of malnutrition; however, there is a need for a multi-pronged strategy to curb the immediate, underlying and nutritional intervention causes.
It is important to note that that even though child nutritional outcomes are deteriorating in some states, the factors impacting malnutrition such as mother’s nutritional status (measured by women's BMI index), mother’s education (measured by women with

The Journal of Governance – January 2022 / 167
more than 10 years of schooling), access to improved sanitation facility and health care facility (measured using institutional deliveries, four or more antenatal check-ups and basic vaccinations) have improved in most states between 2015-16 and 2019-20. However, some states reported a fall in the share of children who were exclusively breastfed. Additionally, the introduction of complementary feeding and a diverse diet has not improved significantly over the last two rounds of NFHS. This requires large-scale and comprehensive awareness programmes and infant and young child feeding guidelines through good governance to improve breastfeeding practices and the introduction of nutritious diets during the weaning period. Additionally, the school curriculum could incorporate nutritional education programmes to provide knowledge about nutrition.
For successful implementation of various nutritional intervention programmes under the umbrella scheme National Nutrition Mission (POSHAN Abhiyan) as well as the routine inoculation coverage, the state governments also need to monitor stringently if set targets are achieved. Additionally, the state governments, through comprehensive awareness programmes, can empower Anganwadi workers and community participation to bring about significant improvement in access to nutritional intervention.
Lastly, the efficacy of these nutritional-sensitive interventions important for adequate nourishment such as food, access to health care, and adequate child care practices, in turn, depends upon a healthy household environment and mother’s education. Higher investment in women’s education, particularly higher education through liberal scholarships needs to be promoted as the mother’s educational status strongly correlates with women autonomy in decision making, sanitation and hygiene, and child caring practice. Studies have found that WASH initiatives in schools, for example, providing separate toilets for girls, have a positive effect on increasing schooling years and reducing dropout rates among girls (Jose et al. 2020). Importantly, the successful implementation of water and sanitation programmes such as Swachh Bharat Abhiyan and Jal Jeevan Mission at both the national and grassroots level depends not on only spreading awareness of basic sanitation and hygiene to community

168/ The Deteriorating Child Nutritional Status in India Evidence from NFHS 2019-20
and school children but also on the urgent attention on behavioural change and capacity building.
Unless there is a shift in the governments’ piecemeal efforts towards a more targeted, focused and evidence-based approach in nutritional interventions with tight monitoring, child nutritional status may not show desired improvement and the country may miss the target under SDG by 2030.
ReferencesBarker, D. J. (1995). Fetal origins of coronary heart disease. British Medical Journal,
311, 171–174.Black, R. E., L. H. Allen, Z. A. Bhutta, L. E. Caulfeld, M. de Onis, M. Ezzati, C.
Mathers, and J. Rivera. (2008). Maternal and Child Under-nutrition: Global and Regional Exposures and Health Consequences. Lancet 371 (9608): 243–60. http://linkinghub.elsevier.com/retrieve/pii/S0140673607616900(accessed October 22, 2021).
Chakrabarti, S., Scott, S.P., Alderman, H. et al. Intergenerational nutrition benefits of India’s national school feeding program. Nat Commun 12, 4248 (2021). Retrieved from https://doi.org/10.1038/s41467-021-24433-w (accessed November 2, 2021)
Delisle. H.E. (2008). Poverty – The Double Burden of malnutrition in mothers and the Intergenerational Impact. Ann. N.Y. Acad. Sci. 1136: 172–184. New York Academy of Sciences. Retrieved from doi: 10.1196/annals.1425.026 (accessed August 5, 2021).
Food and Agriculture Organisation of the United Nations, International Fund for Agricultural Development, United Nations Children's Fund, World Food Programme and World Health Organisation (FAO, IFAD, UNICEF, WFP and WHO. (2019). The State of Food Insecurity in the World 2019. Strengthening the Enabling Environment for Food Security and Nutrition. FAO: Rome.
FAO, IFAD, UNICEF, WFP and WHO. (2021). The State of Food Insecurity in the World 2021. Strengthening the Enabling Environment for Food Security and Nutrition. FAO: Rome
Gillespie, S. and Haddad, L. (2001). Attacking the double burden of malnutrition in Asia and the Pacific. Washington D.C: Asian Development Bank Press and International Food Policy Research Institute.
Government of India (GoI) (2021). Statement of Ministry of Women and Child Development on Global Hunger Report 2021. Ministry of Women and Child Development. Retrieved from Press Information Bureau (PIB) https://pib.gov.in/PressReleseDetailm.aspx?PRID=1764191 (accessed on November

The Journal of Governance – January 2022 / 169
11, 2021). Gulati, A., Kumar, A. G., Sreedhar G., and Nandkumar. T. (2012). Agriculture and
Malnutrition in India. Food and Nutrition Bulletin, Vol. 33 (1), pp 74-86.India State-Level Disease Burden Initiative Malnutrition Collaborators. (2019).
The burden of child and maternal malnutrition and trends in its indicators in the states of India: the Global Burden of Disease Study 1990–2017. Lancet Child Adolescent Health. Retrieved from https://doi.org/10.1016/S2352-4642(19)30273-1.2 (accessed July 19, 2021).
Jose, S., Gulati, A., and Khurana, K.(2020). Achieving Nutritional Security In India: Vision 2030. NABARD-ICRIER Report. Retrieved from http://icrier.org/pdf/Achieving_Nutritional_Security_in_India-Vision_2030.pdf
Kharas H., McArthur J.W. and Rasmussen K. (2018). How many people will the world leave behind? Assessing current trajectories on the Sustainable Development Goals. Brookings Global Economy and Development. Working Paper No. 123. Retrieved from www.brookings.edu/research/how-many-people-will-the-world-leavebehind
LANCET (2019). The burden of child and maternal malnutrition and trends in its indicators in the states of India: the Global Burden of Disease Study 1990–2017. The Lancet Child and Adolescent Health. Volume 3, Issue 12, P855-870.
Menon, P., Heady D., Avula, R. Nguyen, P.H. (2018). Understanding the geographical burden of stunting in India: A regression-decomposition analysis of district-level data from 2015–16. Maternal Child Nutrition. Vol. 14:e12620.Retrieved from https://doi.org/10.1111/mcn.12620 (accessed October 16, 2021).
Pradhan, J., and Aroikasamy, P. (2006). High Infant and Child Mortality Rates in Orissa: An Assessment of Major Reasons. Population Space Place Vol. 12 (3), pp 187–200.
Radhakrishna, R and C Ravi. (2004). Malnutrition in India: Trends and Determinants. Economic and Political Weekly, Vol. XXXIV, No 7, pp 14-20
Raghunathan K, Headey D, Herforth A. Affordability of nutritious diets in rural India. Food Policy. 2021 Feb;99:101982. doi: 10.1016/j.foodpol.2020.101982. PMID: 33746340; PMCID: PMC7957322.
Ruel, T.M., Levin, C., Armar-Klemesu, M., Maxwell, D. and S. Morris. (1999). Good care practices can mitigate the negative effect of poverty and low maternal schooling on children’s nutritional status: Evidence from Acrra. World Development. Vol. 27(11), pp 1993-2009.
Sinha, D. (2021a, February 2). A Budget that fails to address the hunger pandemic.

170/ The Deteriorating Child Nutritional Status in India Evidence from NFHS 2019-20
The Hindu. Retrieved from https://www.thehindu.com/opinion/op-ed/a-budget-that-fails-to-address-the-hunger-pandemic/article33721215.ece (Accessed on November 5, 2021).
Sinha, D. (2021b, October 26 ). A reminder that India still trails in the hunger fight. Retrieved from https://www.thehindu.com/opinion/op-ed/a-reminder-that-india-still-trails-in-the-hunger-fight/article37168319.ece (Accessed on November 2, 2021).
Spears, D., Ghosh, A., and Cumming O. (2013). Correction: Open Defecation and Childhood Stunting in India: An Ecological Analysis of New Data from 112 Districts. Retrieved from https://doi.org/10.1371/annotation/9ffcb740-f394-41af-bbbc-800c7cc25ea8 (accessed on September 19, 2021)
Tontisirin, K. and Gillespie, S. (2001). Linking Community-based Programs and Service Delivery for Improving Maternal and Child Nutrition, Asian Development Review, Vol. 17(1,2) pp. 33-65.
UNICEF. (1990). Policy review. Strategy for improving nutrition of children and women in developing countries. 1990. http://www.ceecis.org/iodine/01_ global/01_pl/01_01_other_1992_unicef.pdf (accessed August 5, 2021).
UNICEF (2021). Malnutrition. 2021. https://data.unicef.org/topic/nutrition/malnutrition/ (Accessed November 10, 2021).
United Nations (N.D). Nutrition and Food Security. https://in.one.un.org/un-priority-areas-in-india/nutrition-and-food-security/ (accessed on November 9, 2021) von Braun, J. (2010). Food insecurity, hunger and malnutrition: necessary policy and technology changes. New Biotechnology Vol. 27(5), pp 449-452
Welthungerhilfe, Concern Worldwide and IFPRI. (2000). Global Hunger Index 2019. Dublin/Bonn: IFPRI
Welthungerhilfe, Concern Worldwide and IFPRI. (2021). Global Hunger Index 2019. Dublin/Bonn: IFPRI
World Health Organisation (2021). WHO Global Anaemia estimates, 2021 Edition. https://www.who.int/data/gho/data/themes/topics/anaemia_in_women_and_children (Accessed on November 7, 2021).
*****
The Journal of Governance – January 2022 / 171
Anyone familiar with the fertiliser industry in India would not find it easy to comprehend how transformative and disruptive
changes swept the rest of the industrial sector through a series of reforms in 1991 which virtually dismantled the “licence-permit raj”. Even after three decades of economic liberalisation, which by common reckoning marked a structural break in India's post-independent economic policy, the fertiliser sector continues to operate in a highly controlled regime that was the defining characteristic of the pre-1991 reforms era.
India’s consumption of chemical fertilisers has increased manifold from a miniscule 69.8 thousand tonnes (in terms of nutrients) in 1950-51 to around 29 million tonnes in 2019-20 with a noticeable quantum jump in the post green revolution period. Share of nitrogenous fertiliser (N component) has remained overwhelmingly high over all these years – 79 per cent in 1950-51 and 65 per cent in 2019-20. As a matter of fact, India is the second largest consumer of nitrogenous fertiliser globally with a share of 16 per cent of the World N consumption (China being the largest with a share of 28 per cent).
Government intervention in the fertiliser sector can be traced back to 1957 when the Fertiliser Control order (FCO) was put in place to control and regulate sale, price and quality of fertilisers. The regulatory stranglehold was further tightened in 1973 through promulgation of the Movement Control Order (MCO) to directly control distribution of fertilisers. Till then, however, the Government did not subsidise fertiliser prices. Subsequently, from 1977 onwards, the Government of India (GOI) has continued to subsidise sale of
Jugal Kishore Mohapatra
Biting the Bullet: Direct Benefit Transfer of Fertiliser Subsidy
Challenges and Options
172/ Biting the Bullet: Direct Benefit Transfer of Fertiliser Subsidy Challenges and Options
chemical fertilisers. Theoretically, there might have been a defensible case for providing subsidy on fertiliser for a temporary period to promote new, high yielding technology in the late Sixties and early Seventies, since information asymmetries could have led to sub-optimal level of consumption in a free market scenario. However, persistence of this subsidy over the last four decades clearly indicates that primarily political economy considerations have ensured its continuation despite political regime changes.
Arguably the most substantive reform in the fertiliser subsidy during the last two decades was undertaken in April, 2010 by decontrolling the phosphatic and potassic (P & K) fertilisers and introducing a Nutrient-Based Subsidy (NBS) scheme for this segment. Under NBS, a fixed amount of subsidy linked to the nutrient content (per kg) is provided and the producers are free to set the retail prices, subject to “reasonableness” requirement. Thus, currently we have a dual subsidy policy for fertilisers – a “fixed subsidy-variable price” policy for P &K; and a “fixed price-variable subsidy” policy for urea.
The size of fertiliser subsidy, at current prices, has increased from Rs. 5.05 billion in 1980-81 to Rs. 734.35 billion in 2018-19 (nearly 145 times). Even during the period 2000-19, the scale of increase has been phenomenal – nearly fivefold rise from Rs. 138 billion in 2000-01. Subsidy on urea constitutes the largest component of the aggregate fertiliser subsidy with a share of nearly 65-70 per cent in this period. In contrast, the quantum of subsidy on the decontrolled phosphatic (P) and potassic (K) fertilisers has declined both in aggregate amount, (from a peak of Rs. 485.55 billion in 2008-09 to Rs. 241 billion in 2018-19) as well as in terms of its percentage share in the total fertiliser subsidy disbursed (from 50 per cent in 2008-09 to 33 per cent in 2018-19). This is primarily owing to the policy-switch from product-based subsidy to the ‘Nutrient Based Subsidy” (NBS) in 2010. Figure 1 below shows the year-wise quantum of subsidy during 2008-19:

The Journal of Governance – January 2022 / 173
Figure 1: FERTILISER SUBSIDY DURING 2008-09 AND 2018-19 (In Billion Rupees)
Source: Annual Reports of the Department of Fertilisers & Replies to the Parliament Questions
A noticeable feature of the current subsidy regime concerns the serious distortions it entails in the relative prices of urea vis-a-vis P and K fertilisers. For example, the average international price of urea in August, 2021 was US$ 513/MT; whereas the domestic retail price (exclusive of taxes) was fixed at Rs. 5360/MT(with an implicit subsidy of nearly 85 per cent). However, in case of DAP (the most commonly used Phosphatic fertiliser) and MOP (the most commonly used Potassic fertiliser) the domestic MRP was Rs. 24000/MT and Rs. 19663/MT as compared to the average international price of US$ 641/MT and US$ 280/MT respectively. As a consequence of the distorted relative prices, farmers almost everywhere overuse urea and the usage of P & K nutrients is well below the recommended levels, which in turn have serious adverse effects on the soil health and the overall farming ecosystem. It may be noted that although all the three nutrients are heavily subsidised in Bangladesh and Nepal also, the relative price of urea vi-a-a-vis is comparatively more distorted in India as table 1 shows:

174/ Biting the Bullet: Direct Benefit Transfer of Fertiliser Subsidy Challenges and Options
Table 1: Price of Urea, DAP & MOP in Bangladesh, India & Nepal in 2020
Fertiliser Type Price ($/kg)Bangladesh India Nepal
Urea 0.18 0.7 0.11DAP 0.19 0.29 0.35MOP 0.19 0.21 0.25
(Source: Kishore et al., 2021)
Provision of subsidy can be justified on economic principles if it promotes allocative efficiency or social welfare. The current regime of fertiliser subsidy probably does neither. Unsurprisingly Arvind Subramanian, former Chief Economic Adviser, has commented-nay, lamented - in his book “Of Counsel” as follows:
“This is arguably one of the worst policies imaginable. It is costly (nearly Rs.1lakh crore. Or 0.6 per cent of GDP) and regressive (disproportionately helping larger farmers), with devastating consequences for soil quality, water and health. ….Almost nothing redeems this subsidy.” (Emphasis supplied)
Sporadic tinkering has been attempted since 2014 onwards to rationalise the subsidy burden and to prevent use of highly subsidised urea for non-agricultural uses. These measures include gas-pooling (to supply natural gas – the primary input for urea – to all firms at a uniform price), neem-coating of urea (to prevent leakages, estimated to be of the order of 40 per cent according to a study by Ravinutala, 2016) and reduction in the bag-size of urea from 50 kg to 45 kg (to induce farmers to reduce urea usage). These interventions have possibly had marginal impact on the distortions in the fertiliser use as also on the subsidy outgo.
Besides the measures mentioned above, the GOI has also introduced a “modified” direct-benefit-transfer (DBT) system in October, 2016 for disbursement of fertiliser subsidy. However, the DBT in fertiliser (DBT-F) is only a modified subsidy payment system to the producers (fertiliser companies) and not to the end-users (i.e. farmers). Purchases by farmers at the authorised outlets are authenticated using Aadhaar Card, Kisan Credit Card, voter identity card etc. through point-of-sale (PoS) machines. Upon successful

The Journal of Governance – January 2022 / 175
authentication of sale, transfer of the subsidy amount to the fertiliser companies is authorised. The current mode of DBT-F significantly differs from the DBT schemes in vogue for LPG and the public distribution system (PDS) as shown in the table 2:Table 2: Features of DBT Schemes in LPG, PDS and Fertiliser
DBT parameter
DBT-LPG DBT-PDS DBT-F
Database of the end users/beneficiaries
Available Available Not available
Unique Identifier
Aadhaar Aadhaar None at present
Entitlement of the end-users/beneficiaries
Defined Defined Not defined-Open Ended
Mode of benefit transfer
Conditional cash transfer (CCT)
In-kind transfer
In-kind; but not similar to DBT-PDS
GoI has switched over to DBT in respect of major subsidies primarily with a view to plugging leakages, enhancing transparency and delivery efficiency. According to a well-publicised official estimate in early 2017, GoI saved nearly Rs. 500 billion as on 31st December, 2016 by deleting 31 million fake or “ghost” beneficiaries under DBT-LPG and 23 million “ghost” ration cards under DBT-PDS (though the basis of these claims have been seriously contested by the “activists” as well as researchers).
According to an assessment study of the DBT-F, carried out by Microsave Consultancy (MSC) on behalf of NITI Aayog during July - September 2018, it is estimated to have saved Rs. 108 billion (based on some assumptions which are open to questions) during the first year of implementation, besides facilitating real time tracking of fertiliser movement, stock availability and reduction of paper work at the retail points. However, the current system is unlikely to yield the anticipated improvements in the delivery efficiency unless it is converted to a CCT like DBT-LPG or an ‘in-kind’ DBT akin to the DBT-PDS.
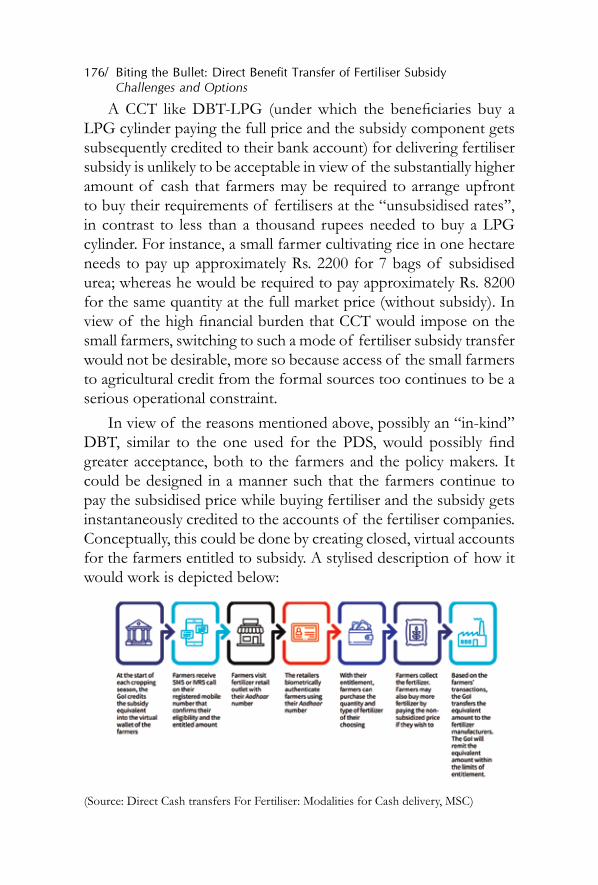
176/ Biting the Bullet: Direct Benefit Transfer of Fertiliser Subsidy Challenges and Options
A CCT like DBT-LPG (under which the beneficiaries buy a LPG cylinder paying the full price and the subsidy component gets subsequently credited to their bank account) for delivering fertiliser subsidy is unlikely to be acceptable in view of the substantially higher amount of cash that farmers may be required to arrange upfront to buy their requirements of fertilisers at the “unsubsidised rates’’, in contrast to less than a thousand rupees needed to buy a LPG cylinder. For instance, a small farmer cultivating rice in one hectare needs to pay up approximately Rs. 2200 for 7 bags of subsidised urea; whereas he would be required to pay approximately Rs. 8200 for the same quantity at the full market price (without subsidy). In view of the high financial burden that CCT would impose on the small farmers, switching to such a mode of fertiliser subsidy transfer would not be desirable, more so because access of the small farmers to agricultural credit from the formal sources too continues to be a serious operational constraint.
In view of the reasons mentioned above, possibly an “in-kind” DBT, similar to the one used for the PDS, would possibly find greater acceptance, both to the farmers and the policy makers. It could be designed in a manner such that the farmers continue to pay the subsidised price while buying fertiliser and the subsidy gets instantaneously credited to the accounts of the fertiliser companies. Conceptually, this could be done by creating closed, virtual accounts for the farmers entitled to subsidy. A stylised description of how it would work is depicted below:
(Source: Direct Cash transfers For Fertiliser: Modalities for Cash delivery, MSC)

The Journal of Governance – January 2022 / 177
While technology can resolve the problem of instantaneous transfer of the subsidy to the producers, there are some complex and challenging problems which have to be addressed by the policy makers before the suggested model can be operationalised. In this context, it is worth recalling that among the South Asian countries, Sri Lanka had introduced a direct cash transfer (DCT) scheme to replace product subsidy in fertiliser in February, 2016. It was targeted to provide cash transfer up to 2 ha of cultivated land and limited initially to rice (some more crops were added later subject to some eligibility criteria). The targeting criteria used were fairly complex and Sri Lanka did not have a reliable database of farmers linked to land records. The design of the scheme made subsidy disbursement quite cumbersome, resulting in irregularities and delays in subsidy payments. Unsurprisingly, the government of Sri Lanka jettisoned the scheme in 2018 soon after losing the election to the local bodies and reverted to the old system.
Sri Lankan experience offers critical lessons for the proposed DBT-F in India, the key takeaway being that it is extremely important to get the design right with a dependable database of the beneficiaries, simple criteria for targeting, and clearly defined entitlement besides deregulation of prices. Also, the delivery mechanism should ride on a robust technology platform. The three core issues which are required to be resolved for operationalising DBT-F are as follows.
First, unlike PDS, currently subsidy entitlement for fertiliser is universal and there is no digitised database of the beneficiaries with bank accounts mapped to a unique identifier. Conceptually, such a database can be created by pooling data on farmers from land records. However, in many states the land records have not been updated for years. Besides, tenant farmers are not captured in the land records since leasing of agricultural land is prohibited or not recorded in several states. According to the 70th round of NSSO, incidence of tenancy is fairly high in states like Andhra Pradesh (36 per cent), Bihar (23 per cent), Odisha (17 per cent), Haryana and West Bengal (15 per cent). These are only officially reported figures. The scale of “concealed tenancy” could be even higher since leasing in most cases is likely to be informal and unrecorded. Two recent developments

178/ Biting the Bullet: Direct Benefit Transfer of Fertiliser Subsidy Challenges and Options
could, however, facilitate creation of a “workable” database of the beneficiaries for the purpose of DBT-F. Under PM Kisan, the records of 90 million farmers with Aadhaar linked bank accounts have been digitised. The second development relates to the passage of the Crop Cultivator Rights Act, 2019 in Andhra Pradesh for registration of tenant farmers to enable them to access agricultural credits and other incentives. Other states could be persuaded to enact similar legislation to formally grant limited recognition to the tenants so that they can avail the benefits like subsidised farm credit, other input subsidies and coverage under crop insurance. The existing database of PM Kisan supplemented by the database of registered tenants could provide a robust digitised database of beneficiaries for DBT-F.
The second challenge relates to the plant-specific subsidy under the current regime of urea pricing. To put it briefly, under the current cost-plus pricing policy for urea, normative cost of production of each of 30 domestic urea plants is worked out. Accordingly, the subsidy that would be admissible for the urea supplied from that plant is determined as the difference between the delivered cost at the farm-gate and the retail price payable by the farmers. Since these plants are of different vintage and their energy efficiency (which is the major determinant of cost of production), there is wide variation in their normative production costs. Consequent non-uniformity in the urea subsidy payable to the producers would make operationalisation of the DBT-F quite complex. The solution lies in bringing urea under the NBS regime, as has been done in case of P and K fertilisers, so that a fixed, standardised subsidy would be applicable for all the producers uniformly.
The third challenge concerns fixation of subsidy entitlement of the farmers. As mentioned earlier, currently it is uncapped and open-ended. The policy makers have to take a call on whether to continue with the existing policy, or to cap the entitlement on the basis of a rational formula. While continuation of the current policy would perpetuate the inefficiencies and distortions in the use of fertilisers and limit the scope of rationalisation of the subsidy burden, the latter option would require political consensus on the principles to be used for determining the cap on subsidy entitlement, which is a daunting

The Journal of Governance – January 2022 / 179
task given the huge geographical and agro-economic diversity across states, besides wide variations in the extent of area irrigated and crops grown. Should a standardised subsidy per hectare of area operated be paid uniformly across states or separate rates be determined on the basis of gross fertiliser recommendations (GFR) of fertiliser nutrients per hectare of major crops grown in a particular district or state? These are no doubt highly complex issues with serious political economy ramifications. But possibly alternative rational formulae that largely meet both equity and efficiency considerations can be worked out in consultation with experts. Thereafter, evolving a consensus on this thorny issue would depend on the maturity and pragmatism of the political leadership.
Thus, designing a DBT mechanism for delivering fertiliser subsidy that would be efficient as well as equitable is feasible, by creating an appropriate technology platform and by reworking the associated processes. That still leaves the question if and when the Government would actually “bite the bullet”. It is difficult to provide a definitive answer to this question, particularly as major reforms in fertiliser subsidy have remained elusive for more than a decade and a patently inefficient system that is both wasteful and environmentally harmful has survived political regime changes. However, it seems highly unlikely that the present Government would attempt any major intervention in this area at least until the prevailing face-off with the farmers on the issue of the three farm laws is diffused. The Government has announced a decision to repeal the three farm laws but the farmers agitation is continuing. Since the farmers constitute a sizable constituency in the electoral politics, it is important to win their trust before major reforms can be undertaken. Thus, possibly there is a window of two to three years which can be productively used to persuade the states to enact laws for the registration of the tenants as proposed above and to move towards creation of a comprehensive digitised database of the farmers. Besides, preparatory work for bringing urea to a NBS system can also be completed. With these building blocks in place, at least a pilot project of DBT-F can be rolled out as and when the political leadership gets ready to take the big leap and usher in the much-needed reforms in fertiliser subsidy.

180/ Biting the Bullet: Direct Benefit Transfer of Fertiliser Subsidy Challenges and Options
At the moment, it is difficult to hazard any prediction regarding the future trajectory of major reforms relating to the farm sector. While observers strongly feel that reformist agenda of the Government has received a serious setback, some others still believe that it might be a temporary pause till such time as the Government manages to win back some measure of trust of the farmers. Thereafter, the Government might opt for a more consensual and gradualist reforms approach. The Government will soon constitute an expert committee to prepare a future road map for farm sector reforms through a wider consultative process. Hopefully, issues relating to the fertiliser sector would also be a part of this exercise. Since this process might take some time, possibly there is a window of reforms opportunity
References:Giri,A. & Rautela,R. (Undated). Reforms in fertiliser subsidy in India: The Way Forward.
Microsave Consulting
Giri,A. & Rautela,R.(2020). Direct Cash transfers in fertilisers: Modalities for cash delivery. Microsave Consulting.
Gulati, A., & Banerjee, P. (2015). Rationalising fertiliser subsidy in India: Key issues and policy options (No. 307). Working paper.
Kishore, A., Alvi, M., & Krupnik, T. J. (2021). Development of balanced nutrient management innovations in South Asia: perspectives from Bangladesh, India, Nepal, and Sri Lanka. Global Food Security, 28, 100464.
Rakshit, M. (2018). Some Economics of Fertiliser Subsidy. Journal of Quantitative Economics, 16(1), 209-228.
Ravinutala, S. (2016). Redesigning India's Urea Policy (Doctoral dissertation, Harvard University).
Sharma, V. P., & Thaker, H. (2010). Fertiliser subsidy in India: Who are the beneficiaries? Economic and Political weekly, 68-76.
Sharma, V. P. (2012). Dismantling fertiliser subsidies in India: Some issues and concerns for farm sector growth.
*****

The Journal of Governance – January 2022 / 181
Agriculture financing plays a catalyst role in the growth of agriculture sector and its availability and accessibility are vital
for the inclusive development of the sector. However, the inherent risk prevalent in the agriculture sector and the smaller ticket size of farm loans often create a perception of the sector being unattractive, among the banks and financial institutions. This perception poses further challenges for farmers in accessing finance on time since the lending agencies deem the agriculture sector as “problematic” for extending loans.
To address challenges in accessing finance, the system of negotiable warehouse receipt system was introduced in the year 2007, through the Warehousing (Development & Regulation) Act, which allowed the farmers to seek loans from banks against the Negotiable Warehousing Receipts (NWR). In this system, the farmers could get credit facilities from the bank or Agricultural Non-Banking Finance Companies (NBFCs) against warehouse/storage receipt, after depositing their produce in warehouses registered with the Warehousing Development and Regulatory Authority (WDRA). This system could have proved to be a boon for the farmers and prevented them from distress sale of their produce while benefitting the banks, financial institutions, insurance companies, and commodity exchanges, simultaneously.
But paradoxical as it may sound, Collateral Management (CM) system which can be a game-changer in agri-financing has come under severe stress after the initial promise. From the peak of 60,000 Crores in FY 2016-17, the total size of the CM business today stands at around Rs 20,000 crores. One of the biggest reasons cited for
Siraj Chaudhry
Collateral ManagementChallenges and the Way Forward
182/ Collateral Management Challenges and the Way Forward
the stress in the sector is some instances of fraudulent and forced removal of stocks from Collateral Management Agency (CM) custody, and the CMs were forced to compensate the losses emanating from such incidences. Some CMs have wound up their operations as the compensation demands from banks were in excess of their net worth. As a result, there has been a substantial reduction in the overall CM business which has led to banks shifting their focus towards large corporates involved in the business of food processing and seed and fertiliser distribution for fulfilling their priority sector lending targets, thereby, neglecting the core agriculture sector directly.
Banks generally exercise extreme caution in extending credit to the agriculture sector. They position CMs as a vehicle for transferring their risk of default. They engage collateral managers for ensuring the quantity and quality of stocks but in effect shift the responsibility for default or shortages of goods in the warehouses to the collateral manager. The banks do not want to play the role of a partner in the product cycle of Warehouse Receipt financing. In effect, the banks should take equal liability but in practice, they do not extend any support whenever a borrower goes delinquent. In practical terms, it means that the banks want to rid themselves of any kind of encumbrances whereas the CMs are willing and are capable to shoulder financial responsibility limited to their financial abilities and solvency. This situation has given rise to a disproportionate burden on the Collateral Management services sector.
The high fee charged by the WDRA for accreditation of warehouses is another impediment hampering the growth of the Collateral Management business. While the bank expects the CM companies to bear the cost of WDRA’s accreditation fees, the CM companies look towards the banks for fulfilling this obligation. It is for the banks to make such arrangements where serious players consider the engagement worthwhile in terms of fees. No wonder that even after 14 years of enactment of Warehousing (Development and Regulation) Act, 2007, the number of warehouses that are accredited with WDRA has remained under 2000, and most of India’s agriculture produce is still stored in non-accredited warehouses.
The inability of certain banks particularly the PSU banks
The Journal of Governance – January 2022 / 183
in initiating a margin call mechanism when the prices of the commodities under their pledge undergo a sharp decline is another deterrent in recovering shortfall in margin money. Subsequently, the borrower loses interest in the commodity when their equity in the pledged goods is eroded. With the loopholes in the legal system, some borrowers take advantage of the situation and resort to fraudulent activities which place the bank and CMs to risk.
The lack of formal regulation of Collateral Management Services is also hurting the interest of the Agricultural warehousing and collateral management services sector. At present, there is no regulator to control or support the functioning of CM service providers. In the absence of such regulation, there is a void that prevails when it comes to establishing a bridge between the industry and the external stakeholders including the government.
The Way ForwardIt is the reluctance of the banks that is restricting the growth of
post-harvest credit expansion through Collateral Management sector. In the absence of a well-established CM system, the farmers will be left with no other option but to turn to arhtiyas and the unorganised sector for their financial needs and getting entangled in the vicious debt cycle. Therefore, for strengthening the Agricultural ecosystem, the success of the Collateral Management Services sector is extremely important and for the sector to succeed, certain steps need to be taken on priority.
Globally the CM companies follow the system of collateral monitoring where the liability of the CM companies is in proportion to the CM fees but in India on the insistence of banks, the CM companies are forced to work on the model of collateral custody where there is unlimited liability. Due to the unlimited liability clause in collateral contracts, the CM companies end up incurring huge losses on account of the contentious and litigious claims made by the clients/borrowers. There is a need to limit the scope of unlimited liabilities offered through collateral custody and promoting the system of proportionate liabilities to prevent the CM businesses from financial ruin.
184/ Collateral Management Challenges and the Way Forward
The banks should also strengthen the mechanism of margin monitoring and should act swiftly in case of any margin calls which shall help in recovering shortfall in margin money or disposing of the commodity promptly to avoid any drastic loss in value of the commodity. They should treat the CM service providers as a partner and should extend support so that legal steps as and when required to be taken can be taken without any hindrance thereby avoiding any escalation of issues. The Government should also take steps to bring the CM service providers under a suitable regulatory system so that these services are standardized and regulated to avoid any unethical practices.
A process for recognition and rating of CM organisations may be adopted considering parameters like the Articles and Memorandum of Association of the CMs, shareholding pattern, net worth, experience in the industry, total warehouse capacity, presence across geographies, etc. It would be in the interest of the regulator(s) to formally recognize Collateral Management Services and make them an integral part of this Warehouse Receipt Finance ecosystem without exposing them to unlimited liability while protecting the interest of all the stakeholders.
The regulators should recognise the Collateral Manager’s role in its guidelines and advise the banks to mandatorily avail the services of collateral managers against WRF with limited and defined liability. It is important to highlight that India will have large farm-gate storage capacities being built over the next few years under the policy initiative of Agriculture Infrastructure Fund and a well-regulated and fairly treated Collateral Management sector will play a large role in achieving the objective of financial inclusion for our small and marginal farmers. This may become a significant contributor to our goal of doubling farmers’ income, the most laudable objective of Modi Government.
Lack of liquidity acts as a hindrance in unlocking the true potential of the agriculture sector and therefore every effort should be made to safeguard the Collateral Management system which is beneficial for all the stakeholders in the Agricultural value chain.
*****

The Journal of Governance – January 2022 / 185
Livestock and other animal-based industries contribute significantly to global and Indian economy. India has over 1.5
billion livestock and poultry. The dairy industry in India is almost 20 per cent of global dairy industry and Indian meat market is valued at USD 50 billion. The livestock industry also provides livelihood to over 280 million Indians. The Livestock, dairy and fisheries sector together are heading towards double digit annual growth. There are tremendous possibilities and growing scope for innovations and investment opportunities in these sectors. It is also important to understand and trace the trajectory of India’s animal husbandry and fisheries sector in the past few decades while highlighting the future opportunities in these sectors.
The Milestones in India’s Dairying Sector The transformation of dairying as an organised industry in
India began in the late 19th century when the Department of Defence established military dairy farms to secure the supply of milk and butter for army personnel. The first military dairy farm was established in Allahabad in 1889, and similar facilities were eventually established in Bangalore, Ootacamund, and Karnal. Further, to ensure the development and expansion of the dairy business, the Imperial Dairy Research Institute was set up, which went on to launch diploma programmes in dairying at Bangalore and Allahabad in 1922 and 1923, respectively.
Milk production was almost static from 1950 to 1970, growing at a CAGR of 1.2 per cent, while per capita milk availability fell from 130 grams/day in 1951 to 107 grams/day in 1970, one of
Atul Chaturvedi
India’s Livestock, Dairy and Fisheries SectorTrends and Opportunities

186/ India’s Livestock, Dairy and Fisheries Sector Trends and Opportunities
the lowest globally. The tale of transforming India's dairy industry from a milk deficit to a milk surplus began in 1946 with formation of Kaira District Cooperative Milk Producers Union Ltd. which later developed into Amul. Further, in 1965 with the establishment of the National Dairy Development Board, Operation Flood was initiated in 1970 to raise milk production, boost rural incomes, and offer milk at affordable costs to consumers. This programme increased milk production by 300 per cent, from 21.2 million tonnes in 1968-69 to 84.6 million tonnes in 2001-02. In addition, in 1998, India surpassed the United States of America to become the world's largest milk producer.
In the past five years, India’s dairy industry has grown at a CAGR of 6.3 per cent with the result that India today accounts for 23 per cent of the world’s milk production. The per capita milk availability has risen from 319 grams/day in 2015 to 406 grams/day in 2020. Dairying is a source of livelihood for 80 million farmers, 70 per cent of them are women and about one third of rural household income comes from dairying. So, the socio-economic significance of this sector cannot be overstated.
Amongst dairy products, liquid milk constitutes the largest segment, followed by Value Added Products, of which Ghee is the most popular, accounting for 18 per cent of the dairy market. Nevertheless, a major challenge stems from the fact that about 75 per cent of the country’s dairy sector is unorganised. This in turn impacts price realisation for dairy farmers and has hampered India’s export potential. However, it is also an opportunity for global and local firms to invest and capitalise on it as the processing capacity is expected to double from 53.5 Million Metric Tonnes (MMT) to 108 MMT by 2025 resulting in the dairy industry expanding from Rs. 1 trillion to Rs. 2.65 trillion in 2025. Such rapid expansion is anticipated because of expanding population, and a growing middle class. The fastest-growing products from 2015-2020 were ice cream (21 per cent), followed by paneer (19 per cent) and cheese (14 per cent). This is a promising sign for the sector since the demand for value-added dairy products (VADPs) is projected to rise, and VADPs provide
The Journal of Governance – January 2022 / 187
higher operating margins than liquid milk and milk powder. As a result, it is an excellent opportunity to invest in the Indian dairy market and leverage on the rising demand.
A major challenge in the context of Indian dairy pertains to the low productivity levels of our cattle relative to the world average. Recent data indicates that indigenous cows produce 3.08 kgs. of milk per cow per day while the yield of exotic crossbred cows is 8.20 kgs. This implies that, overall, the average productivity output of indigenous cattle (both non-descript and high yielding indigenous breeds) is only 1123.48 kg per animal per year, while for cross-bred cattle average productivity is 2993.16 kg per animal per year. So, the solution lies in breed improvement of indigenous breeds.
The advancements in reproductive technologies like In Vitro Fertilisation (IVF), embryo transfer process, and artificial insemination have played a pivotal role in making modern breeding technologies accessible to the country’s livestock farmers. The NAIP (Nationwide Artificial Insemination Programme) Phase-I was launched by the Prime Minister, Shri Narendra Modi in Mathura on the 11th of September in 2019. Every animal in the programme was assigned a 12-digit unique identification number under this scheme to ensure accuracy in tracking continuously from the period of artificial insemination till the birth of the calf. Likewise, Nationwide Artificial Insemination Programme (NAIP) Phase-II was initiated on the 1st of August 2020 and so far under the programme, 2.04 crore animals have been covered, 2.8 crore artificial inseminations have been performed and 1.5 crore farmers have benefitted in 604 districts which is expected to lead to the birth of 1 crore high yielding female calves. Consequently, 12 MMT of additional milk will be produced, as average productivity will be enhanced from 1861 kg per animal per year to 3000 kg per animal per year.
Thus, the focused intervention in the context of breed improvement, along with policy incentives through Rastriya Gokul Mission and Animal Husbandry Infrastructure Development Fund will go a long way towards strengthening India’s contribution to

188/ India’s Livestock, Dairy and Fisheries Sector Trends and Opportunities
the global supply chain. And if we sustain the current levels of growth and investment then India is poised to become a major milk exporting nation in times to come.
Opportunities in The Indian Livestock Sector India presents unique advantages to investors because we
have the lowest minimum wage amongst rising economies. For instance, the daily minimum wage in the United States is at least US Dollars (USD) 80 to 120 USD, while in India it is as low as 5 to 7 USD. Besides, given the low cost of living, India ranks third in Purchasing Power Parity. In Addition to this, with an average age of 29 years, India has the youngest workforce amongst all the leading economies of the world. China is aging and has higher wages – so this gives India a distinct advantage in times to come.
The increase in average income and urban population has resulted in a tremendous increase in demand for chicken meat and steady increase in consumption through time. Poultry meat consumption has grown over the last decade, rising from 2.2 MMT in 2010 to 4 MMT in 2020. To meet the rapidly increasing demand, egg production has climbed at a 6.61 per cent CAGR from 60.3 billion in 2010 to 114.4 billion in 2020, while meat output has expanded at a 6.54 per cent CAGR to 8.6 million tonnes. Presently, about 71 per cent of the country’s population consumes some form of meat and poultry is the most preferred option.
Poultry is the fastest-growing subsector of Animal Husbandry. Central Poultry Development Organisations (CPDOs) play a critical role in encouraging species diversification by generating strains of low input technological birds such as Kalinga Brown, Kaveri, Chann, and others. It also provides training to poultry farmers and conducts feed analysis. In FY 2021, 3585 poultry units were constructed as part of the Innovative Poultry Productivity Project (IPPP).
Most cattle have low productivity, and a lack of adequate feed supplies and health care makes breed improvement imperative. India has a wide variety of 50 indigenous cattle breeds and

The Journal of Governance – January 2022 / 189
17 buffalo breeds. The target is to increase the average milk production of selected breeds from among the various breed types (for example, Gir for high milk output) from 4.85 kg per day to 6.77 kg per day per indigenous animal. For the conservation and development of the indigenous bovine breed, Rashtriya Gokul Mission is being run since December 2014 and more than Rs. 1800 crores have been spent till FY 2021.
Animal Health is an important component of Animal Husbandry. The Indian animal healthcare industry accounts for 2.5 per cent of the global animal healthcare industry and is expected to grow at a 6 per cent CAGR. Animal vaccines comprise 17 per cent of the overall Animal Healthcare industry in India, which stands at Rs. 7100 crores. To prevent the spread of exotic diseases through the import of livestock, animal quarantines centres have been established in 6 states. Around 148 million vaccines for Foot and Mouth Disease (FMD) and 2.2 million for brucellosis have been given till now. Close to Rs. 1170 crores have been spent by Government of India to step-up measures to improve livestock health.
Despite being the largest producer of milk in the world, the share of India in global exports of dairy products is relatively small (0.2 per cent). However, the previous 5 years trend suggests that Indian exports are picking up as they grew by 14.6 per cent during this period from Rs. 755 crores in FY 2016 to Rs. 1492 crores in FY 2021. In July 2018, the Government of India has extended duty benefits under the Merchandise Export from India Scheme (MEIS) for certain dairy products, which has resulted in an increase of 136 per cent in exports quantity from 48,039 MT in FY 2018 to 1,13,725 MT in FY 2019. Also, post COVID recovery in exports has been tremendous as the exports have increased by 8 per cent in FY 2021.
India has the world's largest livestock population, and as a result, it exports a significant amount of meat products. With buffalo meat worth Rs. 22,661 crores exported in FY 2020, India was the fourth-largest exporter after only Brazil, Australia, and the United States of America. There are 63 APEDA registered

190/ India’s Livestock, Dairy and Fisheries Sector Trends and Opportunities
total meat processing plants. Sheep and goats are incredibly crucial livestock species in
India, owing to their short generation intervals, higher rates of proliferation, and the ease with which goats and their products, such as meat, wool, and milk, may be marketed. India exported 14,368 MT of goat and sheep meat products worth Rs. 654 crores in FY 2020. Processed meat exports have grown significantly, with a CAGR of 53.4 per cent between FY 2017 and FY 2021 and the outlook for exports is optimistic, indicating the need for new processing facilities.
Growth and Trends in Indian Fisheries According to the FAO, India is the world's second largest
aquacultural fish producer, and accounts for 8.6 per cent of world’s production. The extraordinary rise of Indian aquaculture is attributed in large part to the government's assistance for research and development. The National Fisheries Development Board (NFDB) was founded in 2006 to promote the holistic development of the fisheries sector by increasing fish output and productivity and supplementing healthy nutrition for the booming population. Since then, India's output has increased at an exponential rate, rising from 6.6 million tonnes in 2006 to 14.2 million tonnes in 2020. While sea fish output has remained stagnant, inland and aquaculture fish production has increased by 7.6 per cent during the same period, from 3.8 million tonnes in 2006 to 10.4 million tonnes in 2020, establishing India as a global player in aquaculture.
The sector is vital to the Indian economy, employing about 28 million people, 44 per cent of whom are women. The sector's gross value added in 2018-19 was Rs. 2,12,915 crores at current basic prices, and it grew at 17.6 per cent from 2012 to 2019, making it one of India's fastest-growing sectors. This development is the consequence of persistent efforts of the Central and state governments to promote this sector by introducing new production and post-harvest technologies, quality inputs especially brood, seed and feed, species diversification,

The Journal of Governance – January 2022 / 191
disease management, strengthening of value chain, promotion of sustainable fishing practices and above all the growth of a vibrant private sector around the fulcrum of governmental interventions and investments.
There are various supply chain concerns in the industry, which result in increased storage costs and higher disease losses. In certain circumstances, fishermen are not compensated fairly, and most profits are earned by middlemen. These issues are currently being addressed through disruptions in the industry. Various e-commerce platforms deliver fresh fish straight to customers' homes, and several artificial intelligence (AI) driven solutions have been created to forecast diseases, boost output, and, eventually, raise farmers' earnings.
India has an enormous aquaculture potential due to its 8118 km of coastline, 0.19 million km of rivers and canals, 1.4 million hectare of brackish water and 6.1 million hectares of reservoirs, ponds, tanks and wetlands. Cage cultivation in fresh water reservoirs and marine waters, and Recirculatory Aquaculture Systems and Biofloc in semi urban areas promise to be attractive options for expansion, diversification and intensification of aquaculture and productive utilization of land and water. Seaweed cultivation along the coastline has huge potential for creation of additional and alternative livelihoods for fishers especially women in coastal areas.
TradePotentialofTheFisheriesSector Exports of marine goods have expanded significantly over
the last decade, rising at a 16.6 per cent CAGR from Rs. 10,048 crores in 2010 to Rs. 46,663 crores in 2019-2020. Frozen shrimp is the flagship export item that has played a critical role in such exponential expansion, with exports increasing at a CAGR of 23.4 throughout the same period. Consequently, frozen shrimp exports have accounted for 73.2 per cent of overall marine product exports in value terms in 2020, increasing from 41.6 per cent in 2010. India's shrimp production is one of the largest in the world given its low labour costs and economic scale, allowing

192/ India’s Livestock, Dairy and Fisheries Sector Trends and Opportunities
India to be a competitive shrimp trader worldwide. Frozen fish is the second-largest export item, accounting for 17.32 per cent of total exports. The government's ongoing support for marine products bodes well for the industry's future.
The future of dairy, meat and fisheries exports from India looks promising. However, an integrated approach needs to be adopted for strengthening the logistical infrastructure for exports by expanding cold chain facilities, focusing upon exports of value-added products with increased shelf-life and improved packaging to compete in international markets, and establishing high-quality standards.
Innovation and Digitalisation Transforming the Livestock and Fisheries Sector
Significant technological advancements in the sector have occurred in recent years, including the creation of INDUSCHIP to examine the diversity of indigenous breeds and discover Single Nucleotide Polymorphisms (SNPs) that are ideal for them. It is a custom-made genotyping chip, and over 15,000 animals have been genotyped to establish a referral population. The government has also taken measures to provide direct assistance to dairy farmers by launching the e-Gopala application, which will allow them to buy and sell disease-free germplasm, access quality breeding services (artificial insemination, veterinary first aid, vaccination, and so on), and receive advice on animal nutrition and treatment. The app will notify farmers about several ongoing government programmes so that they may take advantage of them.
The dairy industry's ecosystem is evolving as a host of tech start-ups attempt to digitise the dairy supply chain and improve milk quality and output. Some start-ups are integrating and analysing data and delivering real-time suggestions to dairy farmers to increase milk production efficiency using the Internet of Things (IoT) and Machine Learning (ML). Farmers are also using mobile applications to interact with input providers for fodder and veterinarians in case of an emergency.
The Direct to Consumer (D2C) concept is the most popular

The Journal of Governance – January 2022 / 193
among start-ups in this industry, and several players have entered the competition. It is gaining popularity in cities as customer preferences shift toward fresh milk, seafood, and meat. It's also convenient because the products are delivered to consumers' residences, and they may pre-pay or sign up for long-term subscriptions. Furthermore, it has disrupted the conventional supply chain by removing intermediaries and reducing adulteration which enables farmers and fishermen who are associated with such start-ups to be also compensated fairly.
A start-up grand challenge was held in 2019-20 to hunt for innovative and financially viable solutions to the problem statements presented by the Animal Husbandry and Dairy sector. The competition was open to all entrepreneurs with innovative solutions to six problem statements, and 12 start-ups received cash incentives. The winners in six categories received up to three months of incubation support, including lab facilities to produce proof of concept, business and investor connections, and expert coaching. Following the completion of the programme, the actions of these six entities were followed for nine months. Another round of start-up grand challenge has also been launched in November 2021 to further push innovation culture in the sector.
Government Policies to Bolster Animal Husbandry and Fisheries
To further spur growth in the livestock sector and thus make animal husbandry more financially viable for the 10 crore farmers involved in the sector, the Government has approved the execution of a Special Livestock Sector Package consisting of several activities by modifying and reconfiguring various components of the Government of India's schemes for the next five years commencing in 2021-22. This package intends for the Central Government to contribute Rs. 9800 crore over a five-year period to leverage a total investment of Rs. 54,618 crore. Tagging of Animals is being carried out through unique ID for each milch animal which are linked with information network for

194/ India’s Livestock, Dairy and Fisheries Sector Trends and Opportunities
animal production and Health (INAPH). The Unique ID contains historical data on artificial insemination, vaccination, disease etc. The INAPH will help in planning and programme monitoring.
The Animal Husbandry Infrastructure Development Fund (AHIDF) has been established with an outlay of Rs. 15,000 crores to facilitate incentivisation of private sector investments in the development of infrastructure for dairy and meat processing, and the establishment of animal feed plants. It is providing 3 per cent interest subsidy to eligible applicants, with a two-year moratorium on the principal loan amount and an additional six-year repayment period thereafter. It would directly or indirectly assist 35 lakh farmers to create a living. Moreover, another scheme, the National Programme for Dairy Development (NPDD), is being implemented with the goal of installing nearly 8900 bulk milk coolers, which would cover about 26,700 villages and thus benefit more than 8 lakh milk producers, and 20 LLPD milk will be procured in additionally. Financial assistance from the Japan International Cooperation Agency (JICA) is also being made available under NPDD, allowing for the development and creation of new infrastructure in 4470 villages (8.96 LLPD chilling and 7 LLPD processing capacity), resulting in an incremental procurement of 14.2 LLPD.
Since most low-producing indigenous breeds are with small and marginal farmers and landless labourers, the Rashtriya Gokul Mission (RGM) scheme initiated by the Government is critical in the development and protection of indigenous breeds, as well as in alleviating the economic position of the rural poor. The scheme is important in enhancing milk production and productivity of bovines to meet growing demand of milk and making dairying more remunerative to the rural farmers of the country. The scheme will be continued under umbrella scheme Development Programme from 2021 to 2026. The RGM will result in enhanced productivity and benefit of the programme, percolating to all cattle and buffaloes of India especially with small and marginal farmers. All the components of scheme will be implemented on 100 per cent grant-in-aid basis except the components of

The Journal of Governance – January 2022 / 195
accelerated breed improvement programme where subsidy of Rs. 5000 per IVF pregnancy will be made available to participating farmers as GoI share and also up to 50 per cent of the cost of sex sorted semen will be made available to participating farmers for promoting use of Sex Sorted Semen. The establishment of breed multiplication farm is also envisaged under RGM where subsidy up to 50 per cent of the capital cost with ceiling of Rs. 2.00 crore for each project will be made available to entrepreneur.
The National Livestock Mission (NLM), which was started in 2014-15, has been restructured this year to provide a greater emphasis on entrepreneurship development and breed improvement in rural poultry, sheep, goat, and piggery, as well as feed and fodder development. The rural Poultry Entrepreneurship component would directly employ 1.5 lakh farmers, while sheep goats and poultry development will directly assist 2 lakh farmers. Risk management would cover around 7.25 lakh high-yielding animals, benefiting 3.5 lakh farmers. The supply of fodder and fodder seed in the country will be multiplied many times over because of promotion of fodder entrepreneurs.
The Department of Fisheries has sanctioned the Pradhan Mantri Matsya Sampada Yojana (PMMSY) with the intention of boosting fish production to 22 MMT over the next five years with an investment of over Rs. 20,000 crores. It would contribute to the creation of 55 lakh direct and indirect employment opportunities, the reduction of post-harvest losses from 20-25 per cent to about 10 per cent, and the increase of fisheries export profits to Rs.1,00,000 crore by 2024-25. Additionally, the Fisheries and Aquaculture Infrastructure Development Fund (FIDF) has been set up to achieve a sustainable growth of 8-9 per cent, in a move to augment the country’s fish production. It aims to create and modernise inland, capture & culture fisheries infrastructure.
Thus, taken collectively the various policies and recent incentives by the Government will go a long way towards increasing the focus and budget allocation for the entire Animal Husbandry and Fisheries cluster. Further, to attract investments into this sector, the Government with the help of “Invest India” under the

196/ India’s Livestock, Dairy and Fisheries Sector Trends and Opportunities
aegis of the Ministry of Commerce & Industry is handholding investors throughout the life cycle of the investment. At this juncture, Ministry of Fisheries, Animal Husbandry & Dairying, Government of India is not just focused on attracting investments into the country but is equally enthused about identifying new markets for Indian livestock and fisheries products. In keeping with the vision of “Atmanirbhar Bharat” our prime focus is also on amplifying all the initiatives and pitching India as the most ideal investment destination.
*****

The Journal of Governance – January 2022 / 197
Prabhat Kumar, with a deep insight and a disarming candour, in this book analyses the present state /scenario of public services
in the country. He begins with an assessment of the prevailing situation in the backdrop of the past, carefully examining the well-established structure of public services with its built-in constraints and the camouflaged fault lines. After identifying the basic flaw, he underlines the need for a fresh approach – a new strategy, to remedy the situation. The new strategy seeks to pay special attention to the ethical aspect in governance, hence the title of the book – ‘Public Service Ethics’.
It is only after a proper analysis of the situation and better appreciation of ground realities that one is able to realise as to what has been missing all along from the system of administration – namely, the ethical content. The ethical concern comes as a breath of fresh air, giving a new perspective to the age-old concepts of administering the services. A clear perspective in this regard can be gained only by looking at the larger picture, through the filters of right and wrong, in keeping the conscience of the public servant.
With his long and varied experience of administering the services at various levels – from a Sub Divisional Officer to the Cabinet Secretary and then the Governor of a State, the author has had the maximum possible exposure (in this field), providing him with rich and an exceptionally wide variety of experiences in Public Service. He has presented an insider’s view, tempered with an empathetic understanding of the recipient’s needs and responses at the other end of the spectrum. Basically, though, it is an approach from the administration’s side – by and for the administration, to guide the practitioners of this art in realising the significance of empathy,
Public Service Ethics – A Quest for Naitik Bharat
Prabhat Kumar Published 2021 by IC Centre for Governance
Pages: 225 Price: INR 599
ISBN: 978-81-950891-3-0
BOOK REVIEW

198/ BOOK REVIEW
transparency and, more than all that, the ethical justifications for acts of governance.
It is the conscience of the civil servant, the ability to differentiate the right from the wrong, which is the best guide. And the ethical considerations are never far from a person with a conscience. It is the need to realise this fact which constitutes the keystone of the basic structure of the author’s thesis.
The book is full of insights yet the style is not ponderous. Despite being a part of the babudom for long – ‘almost four decades in government’, the author has successfully avoided the cultivated officialese – the hallmark of the seasoned bureaucrat, overflowing with ambiguous, passive constructions riddled with circumlocution. Prabhat Kumar’s is a direct approach, more in the style of a frank conversation with his readers, occasionally providing enlightening nuggets of his experiences in the field. But more than the words and the language, it is the thrilling and inspiring content of the text, the personal experiences that he shares with the audience, which have the readers’ attention riveted to the text. The anecdotes that he mentions, once in a while, suggest the right way to approach a difficult problem with a view to find the solution and lend credibility to his pronouncements. They also make the narration interesting – adding to the human interest element.
As a realist, the author points out that good governance is a quest, a dream. It naturally follows that popular discontent with public services is a universal phenomenon. As an idealist and a practical, hands-on administrator, he stresses the need for ethical administration and recommends a course of action – training in ethics which should be the cornerstone of all trainings in Union and State administrations. He regards it as the single critical determinant of corruption-free administration. While defining the role of ethics in public service, he clarifies that it is not restricted to the call of duty; it goes well beyond it. The concept also goes beyond what is normally understood by integrity. It has nothing to do with religion. It is different from morality (which is a little more esoteric and mysterious than ethics) and it is certainly different from legality – it is more than the mere enforcement of the law. After clearing the cobwebs
The Journal of Governance – January 2022 / 199
of likely confusion with terms with similar connotations, with a cogent analysis, the author pronounces his perception of ethics: ‘in the present context…. ethics basically incorporates systematising, defending and recommending concepts of right and wrong conduct. To do what is right is ethical.’
This may be regarded as the keynote statement of the work.Of the many instances of going against the grain, to do what he
felt was right (and therefore, ethical), two deserve more than just a passing mention: insistence on doing what is right by saying NO to authority, be it the CM or the President, and when to swim against the current, disregarding all the sage counsel of advisors and experts, to find a way to do what is felt to be right.
This – doing the right thing in the service of people, even against heavy odds, is, perhaps, the most important aspect of Ethics in Public Service. One has to follow the voice of one’s conscience and stick to one’s beliefs to follow what appears to be the right course of action.
The author’s pronouncements carry weight, and more than that credibility – not because of his status, not even on account of his sincerity and conviction, but because of his deep commitment to the cause of Public Service and his capacity/ boldness to call a spade a spade, unconcerned by the impact or the repercussions. At times, it is with a sense of deep hurt and agony that he makes a frank, honest and rather disturbing pronouncement, not in keeping with his normal polite demeanour, calling the past 50 years a period of shame for our governance.
It is a rare bureaucrat, as the author, indeed, is, who would pass such a judgmental remark about a system of which he, too, has been a part. It must have been on account of his concern, the strong sense of public welfare and the anguish experienced at the inadequacies of the services, that he did not mince his words. He does feel strongly about the non-realization of the right to live with dignity – envisaged in the constitution but 25% of the population still living below the poverty line – the corruption and the malpractices having noticeably increased during the period. Though the predicament is not a simple

200/ BOOK REVIEW
one, observation of ethics in governance would certainly go a long way to remedy the situation. It is the noble thought of the people’s wellbeing that is at the back of all his stress on ethics – doing the right thing by the people.
This, indeed, is the essence of ethics in public service. Such a work is rarely to be seen in our system. Rightly has it been said that ‘This book is not what one reads and puts away but its message is something that should become an inseparable part of what one lives by,’ and that ‘It is a must read for all public servants who have the interests of the people in mind’.
It is the first, and so far the only work of its type, based on personal experiences, long and deep ponderings over issues of public service, encapsulating nuggets of practical wisdom, rare in a world dominated by self-interest and personal aggrandisement. Prabhat Kumar has brought forth a whiff of fresh air in the staid world of writing on Public Administration. Besides the public servants, all those who are intellectually alive, are interested in good governance and the general functioning of the body politic, will find the book a valuable addition to their reading list.
‘Public Service Ethics’ is sure to enrich the sparse, readable literature on the subject.
The IC Centre deserves kudos for bringing out this book.
Vishnu Saksena
*****
The Journal of Governance – January 2022 / 201
OUR CONTRIBUTORS
ABHIJIT DAS is Professor and Head at Centre for WTO Studies, Indian Institute of Foreign Trade, New Delhi.Email: [email protected]
AJAY VIR JAKHAR is Chairman, Bharat Krishak Samaj.Email: [email protected]
ATUL CHATURVEDI is Secretary, Department of Animal Husbandry & Dairying, Ministry of Fisheries, Animal Husbandry & Dairying, Government of India.Email: [email protected]
BHARAT SHARMA is Scientist Emeritus, International Water Management Institute (IWMI), New Delhi Office and Senior Visiting Fellow, Indian Council for Research on International Economic Relations, New Delhi.Email: [email protected]
CARMEL CAHILL was Deputy Director, Trade and Agriculture Directorate, Organisation for Economic Co-operation and Development (OECD), Paris.Email: [email protected]
GAUTAM KUMAR DAS is Research Associate, National Council for Applied Economic Research, New Delhi. Email: [email protected]
HARISH DAMODARAN is National Rural Affairs and Agriculture Editor of The Indian Express and Senior Fellow at the Centre for Policy Research, New Delhi.Email: [email protected]
202/ OUR CONTRIBUTORS
JUGAL KISHORE MOHAPATRA retired from the IAS. He was Secretary, Ministry of Fertiliser and Ministry of Rural Development, Government of India. He has also served as Chief Secretary, Odisha.Email: [email protected]
KRITI KHURANA is a PhD Scholar (Economics) at BITS PILANI (Hyderabad). She has worked in Indian Council for Research on International Economic Relations (ICRIER) as Research Assistant.Email: [email protected]
PRATAP S. BIRTHAL is Indian Council of Agricultural Research (ICAR) National Professor at the National Institute of Agricultural Economics and Policy Research, Pusa, New Delhi. He is a Fellow of the National Academy of Agricultural Sciences (NAAS).Email: [email protected]
SACHIN KUMAR SHARMA is an Associate Professor at Centre for WTO Studies, Indian Institute of Foreign Trade, New Delhi. Email: [email protected]
SEEMA BATHLA is Professor at the Centre for the Study of Regional Development, Jawaharlal Nehru University, New Delhi. Email: [email protected]
SHALINI BHUTANI is a legal researcher and policy analyst working on agriculture, biodiversity and trade rules in the Asian region.Email:[email protected]
SHWETA SAINI is a Research Consultant on Indian Agricultural Policies and Senior Fellow (Visiting), Indian Council for Research on International Economic Relations (ICRIER).Email: [email protected]

The Journal of Governance – January 2022 / 203
SHYMA JOSE is Research Fellow, Indian Council for Research on International Economic Relations (ICRIER).Email: [email protected]
SIRAJ CHAUDHRY is the Chief Executive and Managing Director of National Commodities Management Services Limited.Email: [email protected]
VISHNU SAKSENA is a former civil servant, presently into study of ancient scripts and languages besides poetry and philately.Email: [email protected]
Guest EditorSIRAJ HUSSAIN retired from the IAS in 1979 as Union Agriculture Secretary. Since then, he is a Visiting Senior Fellow at Indian Council for Research on International Economic Relations (ICRIER).Email: [email protected]
*****

The Journal of GovernanceIC Centre for Governance3, Palam Marg, 3rd Floor, Vasant Vihar, New Delhi-110057
IC Centre for Governance
Justice M. N. Venkatachaliah – ChairmanFormer Chief Justice of India
D.V. KapurFormer Chairman, Reliance Power limited
Fali S. NarimanFormer Member of Parliamen, Rajya Sabha
J C lutherFormer Deputy Governor , Reserve Bank of India
K. KasturiranganMember of Parliament Rajya Sabha
K.l. ThaparDirector, Asian Institute of Transport Development
Mahesh KapoorFormer Advisor, Planning Commission
Mukund B. KaushalFormer Secretary, Internal Security, Ministry of home Affairs
Nalini SinghCMD, TV live India Pvt. ltd
Prabhat KumarFormer Cabinet Secretary
Pratap NarayanFormer Director General, Fertiliser Association of India
R.A. MashelkarFormer Director General CSIR
R.D. MathurTrustee MRA
Rajmohan GandhiFormer President, Initiatives of Change
Sarosh J. GhandyFormer MD, Tel-con Construction Company
Shanti NarainFormer Member Traffic Railway Board
Surendra SinghFormer Cabinet Secretary
Syed Shahid MahdiFormer Vice Chancellor, Jamia Millia Slamia
T.S. KrishnamurthyFormer Chief Election Commissioner of India
Yogendra NarainFormer Secretary General Rajya Sabha
The IC Centre for Governance has been set up with the objective of collective thinking and acting on important issues of governance. It believes that public governance is too serious a matter to be left entirely to the state and that the involvement of civil society is not only desirable but also essential. The Centre seeks to strengthen the capacity of civil society and government for ensuring good governance.
Editorial Board
V K Agnihotri
Mahesh Kapoor
R A Mashelkar
Anil Tyagi
Prabhat Kumar – Editor
Siraj hussain – Guest Editor

IC CENTRE FOR GOVERNANCE3, Palam Marg, 3rd Floor, Vasant Vihar, New Delhi-110057
Tele : 91-11-40809939E-mail: [email protected] • Website: www.iccfg.net
ThE JO
uRN
Al OF G
OVERN
ANCE
Volume 24 January 2022
ContributorsAbhijit Das * Ajay Vir Jakhar * Atul Chaturvedi
Bharat Sharma * Carmel Cahill * Gautam Kumar Dasharish Damodaran * Jugal Kishore Mohapatra * Kriti Khurana
Pratap S. Birthal * Sachin Kumar Sharma * Seema BathlaShalini Bhutani * Shweta Saini * Shyma Jose
Siraj Chaudhry * Vishnu Saksena
Volume 24
January 2022
SPECIAL ISSUE ON AGRICULTURE
IC Centre for GovernanceN e w D e l h I