Embed Size (px)
Citation preview

February 15-19, 2009, San Francisco, CAFebruary 15-19, 2009, San Francisco, CA
Current increase, power efficiency improvement and PFC reduction
at RTA Bell Bay Smelter
Geoff Bearne, Rio Tinto Alcan.Melbourne, Australia
Presented on behalf of Bell Bay Potrooms

February 15-19, 2009, San Francisco, CA
Topics• Introduction to the Bell Bay smelter.
• Production increase through significant current creep and process optimisation (1988-2008).
• Perfluorocarbon emission reductions by targeting zero anode effects.
I’d like to take this opportunity to describe two significant improvement initiatives undertaken at the Bell Bay Smelter.
The first initiative is the result of the plant’s unrelenting drive to improve production and productivity, while reducing costs, by creeping current to levels that were not considered possible twenty years ago.
The second initiative is the potroom’s concerted effort to reduce anode effects (both in frequency and duration) to a level where their environmental impact is minimised.
But firstly I would like to introduce you to the aluminium smelter.

February 15-19, 2009, San Francisco, CA
Bell Bay Aluminium Smelter• First aluminium smelter in the
Southern Hemisphere.• Began production in 1955 as
Government owned facility.• First potline VS Søderberg.• Acquired by Comalco in 1960
heralding start of Australia’s integrated aluminium industry.
• Bell Bay is now one of three Rio Tinto Alcan smelters in Australia, but the only one wholly-owned.As shown on the map, the Bell Bay smelter is located in Northern Tasmania, close to George Town, a town with a population of around 7,000 situated close to the mouth of the Tamar River.
The Søderberg potline (Line 1) was shut down in 1981.

February 15-19, 2009, San Francisco, CA

February 15-19, 2009, San Francisco, CA
Potline 2 – 172 cells
Potline 3 – 178 cells
Potline 4 – 188 cellsBooster section referredto as “Potline 1” – 20 cells
2008 production – 177,000 tonnes/year
Three Potlines – 118kA
One booster section – 130kA

February 15-19, 2009, San Francisco, CA
020406080
100120140160180200
1955 1965 1975 1985 1996 2004 2005 2006 2007 2008
k to
nnes
Hot Metal
Capacity has grown over the years, initially through potline expansions, but more recently throughamperage increase and efficiency improvements. This has put significant pressure on improvingwork practices and process control to maintain cell performance and minimise environmentalimpacts, particularly from anode effects.

February 15-19, 2009, San Francisco, CA
Kaiser P57 technology, originally 86kA
The cells are Kaiser P57 side-by-side end riser technology, developed in the 1950’s. They were originally equippedwith centre bar breakers but were later converted to point feed (more on this later).
The cell hoppers are filled with reacted alumina, from the scrubbing system, by overhead crane. The dry scrubbingsystem is Comalco developed Torbed technology. Alumina is sourced from either QAL or Rio Tinto’s new Yarwunrefinery in Queensland. Both source bauxite from Weipa. Alumina is delivered to an “A” frame storage shed on site.
The cell control system was developed in-house and includes a computer per cell, linked to middle level supervisorycomputer per 16 cells. The user interface is via a top level computer system that includes an extensive data base.

February 15-19, 2009, San Francisco, CA
Each Potroom is serviced by one general purpose crane and one anode changing crane (CTM)

February 15-19, 2009, San Francisco, CA
Anodesetting
Filling aluminahoppers
Metaltapping
CellDressing

February 15-19, 2009, San Francisco, CA
Challenges• Bell Bay is a relatively small output smelter
operating an older technology.• To remain competitive requires continual
improvement in efficiency, cost and productivity.• 2008 targets included:
2% year on year production increase.2% year on year controllable cost reduction.Reduced site GHG emissions (1.75 tCO2e/t Al)
• 2009 aim is primarily survival:Minimum CAPEX and OPEXMaximum efficiency and minimum waste

February 15-19, 2009, San Francisco, CA
Continuous story of current creep
80
85
90
95
100
105
110
115
120
125
130
1989 1991 1993 1995 1997 1999 2001 2003 2005 2007
Cur
rent
(kA
)
14.0
14.5
15.0
15.5
16.0
16.5
17.0
Spec
ific
Ener
gy C
onsu
mpt
ion
(DC
kWh/
kg)
Energy consumption
Line 1
Lines 2 - 4
Line 1
Lines 2 - 4
A group of booster cells has been used for cell performance assessments since 1999. It runs 5 to 15kA above the rest of the plant.Current increases have generally been achieved at constant cell heat loss, thus improving energy consumption.

February 15-19, 2009, San Francisco, CA
80
90
100
110
120
130
140
150
160
170
180
1989 1991 1993 1995 1997 1999 2001 2003 2005 2007
Cur
rent
(kA
)
87.0
88.0
89.0
90.0
91.0
92.0
93.0
94.0
95.0
96.0
Cur
rent
Effi
cien
cy (%
)
Lines 2 - 4
Line 1
Current
Current Efficiency
Line 1Lines 2 - 4
PE improvements have resulted from increasing CE and cell squeezing strategy
Concurrent with current increase, current efficiency has been improved from around 90% to 94% in the last 20 years. This is the result of improved work practices, cell design and process control.

February 15-19, 2009, San Francisco, CA
Current increase capability enablers
200mm tall anode slot2007
560mm wide Anode (Carbon Baking Furnace packing layers reduced)2006
Side chamfered anodes2004
120 kA superstructure on line conversion with wider anode spacing and extra anode bus. 945 symmetrical anodes. Change from 48 hour to 36 hour tap.
2003
165mm tall anode slot, deck plate cutting2002
945mm asymmetric anodes, CTM anode setting, lower anode cover2000
Increased downstream cathode busbar cross sectional area1999
925mm asymmetric anode, point feed on-line conversion1998
Torbed dry scrubber fume treatment plant installed 1997
130 mm dia. stub, symmetric hanger, cut fume skirts, chamfered anode back1996
860mm asymmetric anode1989814 x 525mm anode,100mm diameter stub1980 - 85

February 15-19, 2009, San Francisco, CA
Cells were heat balance constrained• Cathode heat balance improved at higher current, resulting
in a lower cathode electrical resistance. Prior to this point cells were probably limited by heat balance (too cold).
• Gains from 1996 onwards were largely from heat balance improvement with increasing current.
• Removing cover from hangers in 2001 allowed higher current density (scaling of the steel hanger was an issue)
Year 1985 1990 1991 1996 1999 2001stub dia mm 100 100 100 130 130 130amperage kA 86 88 92 94 100.5 107
anode length mm 814 860 900 900 925 945anode width mm 525 525 525 525 525 525
anode cd amps/mm sqrd 0.0101 0.0097 0.0097 0.0099 0.0103 0.0108Cathode Resistance typ micro Ohms 4.8 4.2 4.1

February 15-19, 2009, San Francisco, CA
Impact of anode setting sequence
Cell 4000
0
0.1
0.2
0.3
0.4
0.5
0.6
1/01/03 1/02/03 1/03/03 1/04/03 1/05/03 1/06/03 1/07/03 1/08/03 1/09/03 1/10/03 1/11/03 1/12/03 1/01/04 1/02/04 1/03/04 1/04/04 1/05/04
LF n
oise
(mic
ro-o
hms)
90,000
95,000
100,000
105,000
110,000
115,000
120,000
Cur
rent
(Am
pere
s)
36 hour cycle 120kA Superstructure
Double setting
Profile changed to 6
Instability associated with setting upstream duct end anodes was evident before superstructure changes and current increase (as evidenced by the cyclical increases in low frequency noise before June 2003), however it deteriorated after these changes.
Current
Low Frequency Noise

February 15-19, 2009, San Francisco, CA
Impact of anode setting sequence
Stability issues were resolved by reversing the anode setting sequence, modifying the anode setting profile and parameters
0.03
0.04
0.05
0.06
0.07
0.08
0.09
0.10
2 4 6 8 10 7 9 1 3 5Anode
Noi
se (m
icro
-ohm
s/m
in)
Low frequency noise on anode setting shift 2 4 6 8 10
7 9 1 3 5
2 4 6 8 10
7 9 1 3 5
upstream
duct
Anode setting profile
-20
-15
-10
-5
0
5
10
15
20
25
2B 2A 4B 4A 6b 6a 8A 8B 10A 10B 7B 7A 9B 9A 1a 1b 3A 3B 5A 5B
Anode
Prof
ile (m
m)
February 15-19, 2009, San Francisco, CA
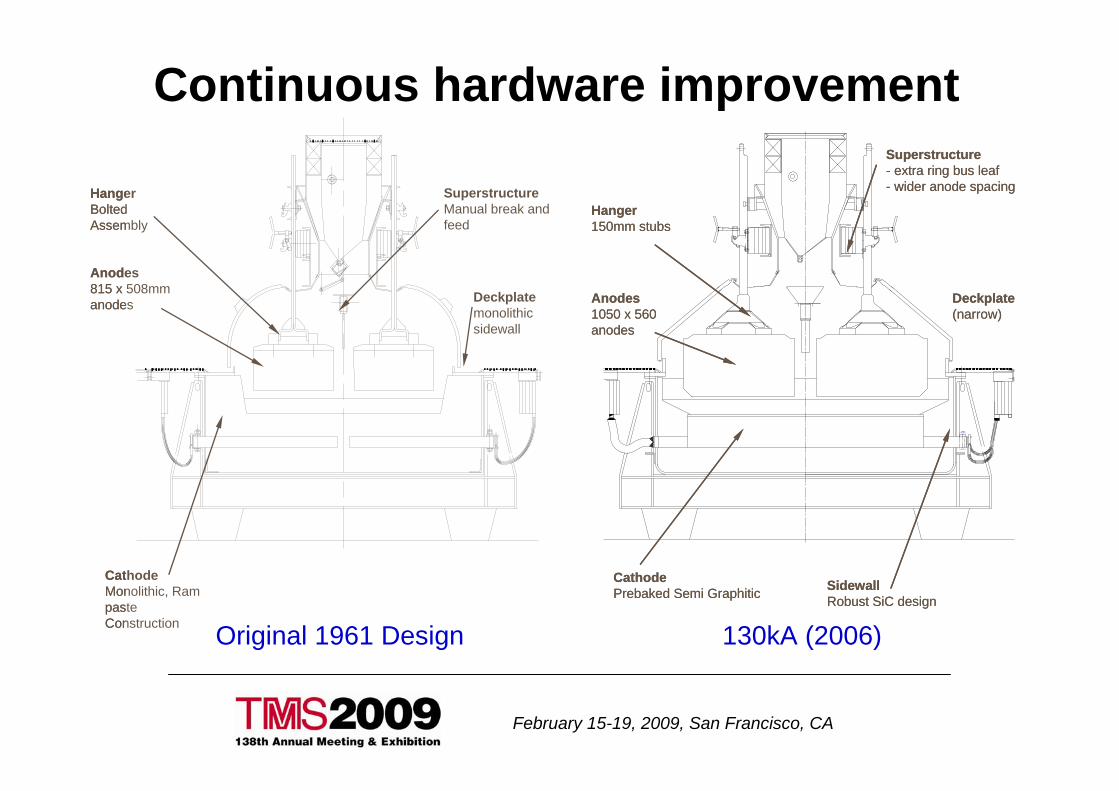
Continuous hardware improvement
Anodes815 x 508mm anodes
HangerBolted Assembly
SuperstructureManual break and feed
CathodeMonolithic, Ram pasteConstruction
Deckplatemonolithicsidewall
Deckplate(narrow)
Anodes1050 x 560 anodes
Hanger150mm stubs
Superstructure- extra ring bus leaf- wider anode spacing
CathodePrebaked Semi Graphitic Sidewall
Robust SiC design
Original 1961 Design 130kA (2006)

February 15-19, 2009, San Francisco, CA
Anode assembly development
130kA 18 day rota 120kA 20 day rota 114kA 16.5 day rota130kA 18 day rota 120kA 20 day rota 114kA 16.5 day rota

February 15-19, 2009, San Francisco, CA
Typical cell performance (12 month averages)
0.0710.087Average iron concentration (%)0.100.063Anode effect frequency (AE/cell day)
0.3950.436Net carbon (kg/kg Al)539516Power actual (kW)14.614.5Spec. Energy Consumption (DC kWh/kg)93.993.9Current efficiency (%)12.212.3Excess aluminium fluoride (%)966959Bath temperature (degrees C)1.091.10Anode current density (A/cm2)1050945Anode length (mm)4.594.56Volts/cell (V)
128.1116.0Current (kA)Line 1 2008Line 4 2008Critical Process Variable/End-Of-Line

February 15-19, 2009, San Francisco, CA
130kA Project• Ramping to 130kA will increase metal
production by 23kt (13%).• Large productivity gains planned through
amperage creep, automation and workflow optimisation.
• Enablers are larger anode, new anode hanger and cell designs and power supply upgrades.
• Estimated CAPEX of US$35.As a result of the global financial situation, resulting in a collapse in aluminium price to around US$1,350/tonne, the 130kA project is presently under review.

Perfluorocarbon (PFC) emissions
February 15-19, 2009, San Francisco, CA
CARBON ANODE
ALUMINA
CRUST BREAKER
MOLTEN ALUMINIUM
LIQUIDBATH
CRUST
CARBON ANODE
ALUMINA
CRUST BREAKER
MOLTEN ALUMINIUM
LIQUIDBATH
CRUST
• At low alumina conc. (~1.5%) anode polarisation increases.
• Fluorine ions of the liquid bath are discharged.
• These react to form PFC gasses.• Result in an “anode effect”
Cross section of a reduction cell
Compound Global Warming Potential
(100-year horizon) CO2 1 CH4 21
HFC-134a 1,300 CF4 5,700 C2F6 11,900 SF6 23,900
CARBON ANODE
ALUMINA
CRUST BREAKER
MOLTEN ALUMINIUM
LIQUIDBATH
CRUST
CARBON ANODE
ALUMINA
CRUST BREAKER
MOLTEN ALUMINIUM
LIQUIDBATH
CRUST
• At low alumina conc. (~1.5%) anode polarisation increases.
• Fluorine ions of the liquid bath are discharged.
• These react to form PFC gasses.• Result in an “anode effect”
Cross section of a reduction cell
Compound Global Warming Potential
(100-year horizon) CO2 1 CH4 21
HFC-134a 1,300 CF4 5,700 C2F6 11,900 SF6 23,900
The generation of PFC emissions during anode effects, with their very high green house gas contribution, is well established.

Anode effect (AE) Performance over time
AE Frequency and Duration, Bell Bay
0.0
0.51.0
1.52.0
2.5
3.03.5
4.0
Jan-85
Jan-87
Jan-89
Jan-91
Jan-93
Jan-95
Jan-97
Jan-99
Jan-01
Jan-03
Jan-05
Jan-07
Jan-09
Freq
uenc
y (A
E/C
ell D
ay)
0
2040
6080
100
120140
160
Dur
atio
n (S
ec)
FrequencyDur >8V
1998 Point feed conversion
Bar Break, Target 3 AE/day
1994 Control system upgrade
Target 2 AE/day
Six Sigma program
Regulator failure
February 15-19, 2009, San Francisco, CA
Campaigns to reduce anode effect frequency, and later anode effect duration, have been undertaken over two decades.

1985 -1994– 3 anode effects per day– Centre feed, bar break operation
– 1 break, 3 dump feed strategy (~7kg dump weight)– No resistance tracking– Anode effects scheduled– Considered necessary for sludge control– Attempt to reduce frequency from 3/day to 2 in 1989– Two tier Siemens R30 Mini computer/ Siemens MC210
microcomputer
BladeBlade
Historical anode effect performance
February 15-19, 2009, San Francisco, CA

1994 - 1998– Major control system upgrade, Comalco-developed cell
control strategy– New three tier VAX, IVAX, Analogic computer system– Resistance tracking introduced– No scheduled anode effects– AE frequency reduced to 0.5 ~ 1.0 AE/day (enabled by
control strategy improvements)– Still issues with alumina dissolution (back feeding) as a
result of alumina sinking into the metal pad from the relative large dump mass during feeding.
Historical anode effect performance
February 15-19, 2009, San Francisco, CA

1998– Bar breakers converted to point feed, adapted from
original bar break beam
– 4 picks with chutes to direct alumina into feed hole– Hopper outlets blanked off– Dump gate dams fitted– Pick length and breaker beam stroke optimised
Conversion to point feed
Chutes
70mm diameter spikes
Chutes
70mm diameter spikes
February 15-19, 2009, San Francisco, CA

Point feed conversion considerations• On-line beam change out procedure,
to avoid safety issues.• Hopper utilisation/ dead capacity.• Pick material selection (304 or 304L
austenitic stainless).• Breaker stroke length, pick length
and immersion.• Pick location relative to anode
position.
February 15-19, 2009, San Francisco, CA
• crust breakerscrust breakers• crust breakerscrust breakers
A number of issues needed addressing during thepoint feed conversion, including: • Procedure to allow safe access into cell hoppers
using a mobile cooling system.• Pick material selection – early choices saw
significant erosion of tip.• Crust breaker pick length and beam stroke –
needed to avoid too much submersion in bath to prevent overheating and bath build up.
• Ore gates were blanked off to reduce variation in dump weight.
• Pick location – early choice resulted in air burn adjacent to anode stubs. Picks were relocated to anode corners.

2001– Commenced measuring AE duration (defined as time
above 8 volts)2006
– Greenhouse gas targets established for AE contribution.
– Site Target < 0.07 AE/cell day, 30 seconds duration.– Expectations set:
• Goal of zero anode effects• Every AE treated as an “exception”
– Six Sigma program commenced:• Initially addressing AEs in new cells• Expanded to include all cells.
February 15-19, 2009, San Francisco, CA
Upping the ante on anode effects

AE reduction focus areasTarget areas:
– New cell start-up control– Alumina feed equipment reliability– Recovery from no load and reduced load– Post anode setting control of ACD– Automatic anode effect termination effectiveness– Resistance tracking parameters (tuning to mitigate the
impact of current increase)– Individual cell parameter tuning for alumina dump weight– Individual cell power settings (heat balance control)– Individual exception cell follow up– Adaptive feed
February 15-19, 2009, San Francisco, CA

Challenging anode effect myths (that we used to believe!)
• Anode effects are necessary.• AEs are required for new cells.• AEs are unavoidable after reduced load/no
load.• Increasing line current always increases AE
frequency.• Larger anode area/decreased bath volume
must increase AE frequency.• Alumina source change always causes AEs.• It is too hard to improve from where we are
now.
February 15-19, 2009, San Francisco, CA

AE frequency benchmarking
0.0
0.1
0.2
0.3
0.4
0.5
0.6
0.7
0.8
0.9
1.0
0.0 0.5 1.0 1.5 2.0 2.5 3.0 3.5
Anode Effect Frequency
Cum
ulat
ive
Frac
tion
of R
epor
ting
Faci
litie
s
PFPBCWPBSWPBVSS - Open Circles PFHSS
Bell Bay0.0
0.1
0.2
0.3
0.4
0.5
0.6
0.7
0.8
0.9
1.0
0.0 0.5 1.0 1.5 2.0 2.5 3.0 3.5
Anode Effect Frequency
Cum
ulat
ive
Frac
tion
of R
epor
ting
Faci
litie
s
PFPBCWPBSWPBVSS - Open Circles PFHSS
Bell Bay
February 15-19, 2009, San Francisco, CA
From IAI survey 2005

AE duration benchmarking
0.0
0.1
0.2
0.3
0.4
0.5
0.6
0.7
0.8
0.9
1.0
0.0 2.0 4.0 6.0 8.0 10.0 12.0 14.0
Anode Effect Duration (minutes)
Cum
ulat
ive
Frac
tion
of R
epor
ting
Faci
litie
s
PFPBCWPBSWPBVSSHSS
Bell Bay0.0
0.1
0.2
0.3
0.4
0.5
0.6
0.7
0.8
0.9
1.0
0.0 2.0 4.0 6.0 8.0 10.0 12.0 14.0
Anode Effect Duration (minutes)
Cum
ulat
ive
Frac
tion
of R
epor
ting
Faci
litie
s
PFPBCWPBSWPBVSSHSS
Bell Bay
February 15-19, 2009, San Francisco, CA
From IAI survey 2005

Benefits of low AE frequency & duration• Reduced greenhouse gas emissions• Reduced energy consumption and improved CE• Reduced crust disruption from AE termination:
– helps reduce anode airburn– helps reduce fugitive fluoride emissions
• Reduced manual intervention to “pole” out failed AEs after failed automatic termination
• Reduced risk of cell failure due to overheating• Improved amperage stability, hence “gentler” on
power supply equipment
February 15-19, 2009, San Francisco, CA
Reducing and eliminating anode effects has many other benefits as well as reducing GHG emissions. These include reduced costs, increased safety and reduced process variation.

Summary: Key factors in eliminating anode effects
• Motivation (leadership)
• Improved work practices:• Quality of routine work (including maintenance)• Diagnosis and prompt correction of problems• Tuning of cell control parameters (feed and heat balance)
• Improved alumina feeding equipment design and reliability
• Enhanced automated process control strategy:• Eliminating “scheduled” anode effects• Tighter control of alumina concentration• Improved anode effect termination• Better cell management around periods of reduced power
• Process Stability
February 15-19, 2009, San Francisco, CA

Acknowledgements
Bell Bay performance achievements are a testament to the Operations and R&D staff who have continually challenged the limits and extend them. Thanks to John Lemberg, Mark Fyfe, Robbie Matthews, Greg Picot, Greg Hardie, Allan Graham and many others.
February 15-19, 2009, San Francisco, CA