Embed Size (px)
Citation preview

I
Characteristics of DisruptiVe Plasma
Current Decay in the HT-2 TOkamak
Mitsushi Abe, Kazuhiro Takeuchi and Michio Otsuka E14ergy Research Laboratory. Hitachi Ltd..
Hitachi 319-12.
(Received June 8, 1992/revised manuscript received November 16, 1992)
AbSt ract
Motions of plasma current channel and time evolutions of eddy current distribution on the
vacuum vessel during disruptive plasma current decay were studied experimentally in the
Hitachi tokamak HT-2. The plasmas are vertically elongated and circularly shaped plasmas.
A disruptive plasma current decay has three phases. During the first phase, a large
displacement of the plasma position without plasma current decay is observed. Rapid plasma
current decay is observed during the second phase and the decay rate is roughly constant with
time. The eddy current distribution is like that due to the shell effect whichcreates a poloidal
field to reduce the plasma displacement. During the third phase, the plasma current decays
exponentially. The second phase is Qbserved in slightly elongated and high plasma current
(> 20kA) circularly shaped plasmas. The plasma current decay rates in the second phase
depend on the plasma cross sectional shape, but they do not in the third phase. The magnetic
axis moves from the plasma area to the vacuum vessel wall between the second and third
phases.
KeywordS: plasma disruption, magnetic analysis, tokamak, electromagnetic force, equilibrium magnetic
field,
I
1. INTRODUCTION Disruption is one of the key problems in
tokamak device design as it causes thermal and
mechanical trouble. The former is due to rapid
dissipation of the plasma thermal energy. The
latter is due to the eddy currents and electro-
magnetic force caused by disruptive plasma current
(Ip) decay. From the viewpoint of mechanical
design, understanding the characteristics of disrup-
tive lp decay and predicting electromagnetic force
on the vacuum vessel wall during disruption are important [1] .
Disruptive lp decay rates and plasma-coil
interactions in post disruptive plasma have been
experimentally examined in some tokamaks[2-4] ,
however, plasma current channel motion during
dusruptive lp decay was not clarified. Experi-
ments on disruptions in large tokamaks have also
been carried out. The lp decay rates in large
tokamaks were reported [5-9] and it was shown
that the poloidal current on the vacuum vessel can
not be ignored during vertical displacement events
(VDE'S) and the force due to poloidal current and
toroidal field should be take into account for the
tokamak device design [10-1l] . However, a gener-
al understanding of the disruptive lp decay phase
352

I
~~f d*~t;~~~,-~~'fl~~~
has not been gained yet. The motion of the plasma
current channel and the configuration of the magnetic field during disruptive lp decay should be
examined experimentally.
The Hitachi tokamak HT-2 has magnetic probes, both inside (plasma side) and outside of the
vacuum vessel wall[12] . , This placement allows
measurement of the eddy current on the vessel wall,
determination of the plasma current channel
locations and magnetic field configuration even
during disruptive lp decay [12-14] . The magnetic
analysis code SHP[14] models the plasma current
distribution using a few filamental loop currents
and has already been applied to the HT-2 experi-
ments to study the plasma motion during disrup-tions [12] . The results showed that the poloidal
field due to the shell effect of toroidal eddy currents
plays an important role in plasma motion at an early
phase of lp decay. However, in the last phase, the
plasma motion can not be explained by the poloidal
field distribution. In order to solve this discrepan-
cy, the field input type equilibrium code FITEQ[13] ,
which is an MHD equilibrium code like that presented in ref. [15] , was modified to analyze
plasmas during disruptive lp decay.
In this paper, we discuss the characteristics of
disruptive lp decay in the HT-2 tokamak. The
phases of lp decay are identified from the lp
waveform during disruption. Then, the magnetic
configuration during disruptive lp decay is discus-
sed, considering the reasons for changes of the eddy
current distribution and the lp decay waveform.
Following this, the decay time of lp during plasma
disruptions is exam,ined.
Characteristics of Disruptive Plasma Current Decay in the HT-2 Tokamak ~~~S, ~tF~l4~2
intended to produce an equilibrium poloidal field.
The B coils are designed for a reverse flux swing of
the iron core, but they are also used for the
equilibrium poloidal field. In the latter case, some
of the HY coils are also used for the reverse swing.
The vacuum vessel is made of 9mm th.ick stainless
steel. The magnetic penetration time is 1.3ms for
the vertical field and 1.5ms for the horizontal field.
The vacuum vessel loop resistance 9v is 14m9.
The decay time of the net toroidal current on the
vacuum vessel is roughly 0.05ms. The poloidal
angle 6 is measured in the counterclockwise
direction.
The HT-2 has 36 magnetic probes, 15 flux loops
and two Rogowski coils to measure the poloidal
Table I Parameters of HT-2 Tokamak
Parameter Symbol Value Unit
Plasma current Electron density (tine averaged)
Plasma major radius Plasma mimr radius Elongation P p+V2 Toroidal fietd
Vacuum vesset ,oop resistance tron core flux swing
Safety tactor at surface
Discttarge duraton
IP
n. Rp
ap x
A BT
~v
qs
0-55 1 -3xl Otg
0.39-0.44 0.08-0, 1 2
0.9- I .45
0,8-1 . 1
1 .O
14 O,oe2 3,0
70
A m4 m m
T m~ Wb
ms
2. EXPERIMENTAL SETUP AND MAGNETIC MEASUREMENT
2. 1. Experimental device and cause of disrup-
tion
The experiments are carried out in a small
tokamak, the Hitachi tokamak HT-2. Typical parameters are listed in Table I. Its poloidal cross
section is shown in Fig.1. A special feature of this
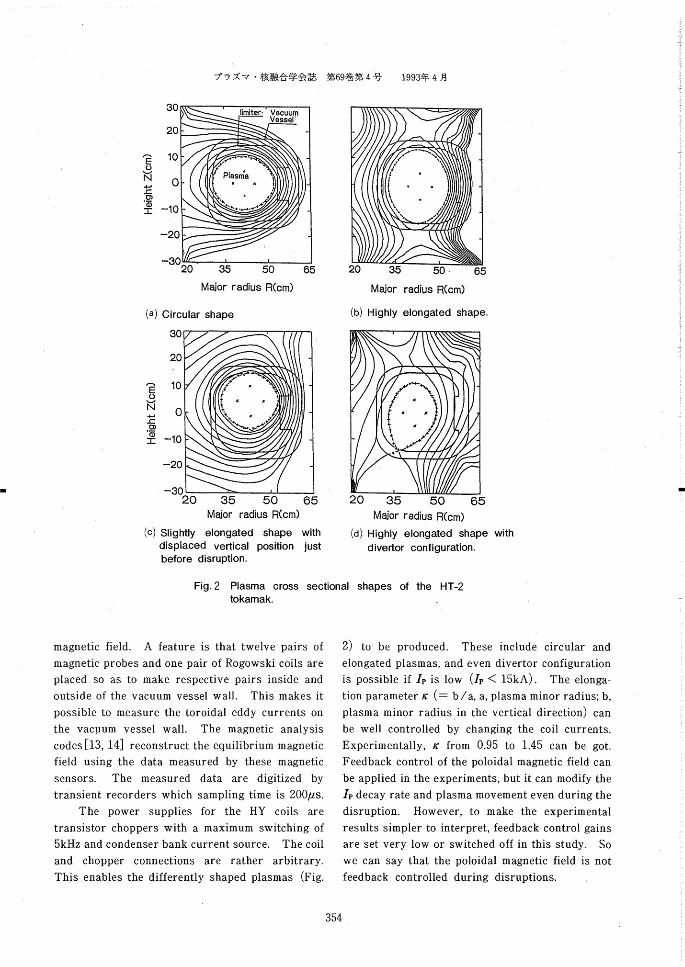
tokamak is its ability to generate various cross sectional plasmas (Fig. 2). It has three kinds of
poloidal coils: eight HY coils (HY1-HY8) , two B
coils (B1, B2) and two sets of horizontal field coils
(ACH and DH1, DH2). The HY coils are mainly
o. 6
c.4
o2
~ ~~
~~o
- O. 2
- o. 4
- 0.8
l ron
Core
t Plekup Coff
B8t . Flux Lcop DHI ~
~~1 HY3 HY2 ~l HY 4
~ Lf mi ter HY 1 ~e
~~ACH FptQidat Artete
,~~ Moveble Limitor
dg!
~ J~
ACH
Veeuvm Ve8・et
~~1 HYe HY7 ~~
B B2 ~ DH2
E~ HY8
Teroid・1 Coit
Fig. 1
Q.Q o.2 o.4 0.8 0.8 1.o M.i.. Rrdt~ R (~)
Poloidal cross section of the Hitachi tokamak
HT-2. Abbreviations are explained in the text (section 2.1 ). The arrows denote the magnetic
probes and the dots denote the flux loops. ,
353
30
20
10
o
-10
-20
-30
j~ ;~7 ・ ~~~~A';~~:~A~,p~~
I
f~ E o v N ~ ,o) ~5
I
1993~j~ 4 )il
limiter, Vaouum Vessel :
..r"t~"" ~1F
Plasma t
t,tb.. ,~4 -"'4'1'~"':
(a)
20
Circular
30
20
10
o
-1 o
-20
-30
35 50 65 Major radius R(cm)
shape
20 35 Major
(b) Highly
f¥ E o .~'
N ~' J: c, .~5
::
(c)
t:
,f* ~ e,
l t t ,,
tt ~ J' ,b ~~t~Ul~":
20 35 50 Major radiVS R(cm)
Slightly elongated shape displaced vertical position
before disruption.
Fig.2 Plasma cross tokamak.
50 ・ 65 radivs R(cm)
elongated shape.
l 65
with
j ust
sectional
20
(d)
35 50 65 Major radius R(cm)
Highly elongated shape divertor configuration.
shapes of the HT-2
with
magnetic field. A feature is that twelve pairs of
magnetic probes and one pair of Rogowski coils are
placed so as to make respective pairs inside and
outside of the vacuum vessel wall. This makes it
possible to measure the toroidal eddy currents on
the vacuum vessel wall. The magnetic analysis codes[13, 14] reconstruct the equilibrium magnetic
field using the data measured by these magnetic
sensors. The measured data are digitized by tr~nsient recorders which sampling time is 200lrs.
The power supplies for the HY coils are
transistor choppers with a maximum switching of
5kHz and condenserbank current source. The coil
and chopper connections are rather arbitrary. This enables the differently shaped plasmas (Fig.
2) to be produced. These include circular and
elongated plasmas, and even divertor configuration
is possible if lp is low (Ip < 15kA). The elonga-
tion parameter /~ (= b /a, a, plasma minor radius; b,
plasma minor radius in the vertical direction) can
be well controlled by changing the coil currents.
Experimentally, /c from 0.95 to 1.45 can be got.
Feedback control of the poloidal magnetic field can
be applied in the experiments, but it can modify the
lp decay rate and plasma movement even during the
disruption. However, to make the experimental
results simpler to interpret, feedback control gains
are set very low or switched off in this study. So
we can say that the poloidal magnetic field is not
feedback controlled during disruptions.
354

I
~~~*7~"-1~~~~l~~C Characteristics of Disruptive Plasma Current Decay in the HT-2 Tokamak
The cause of disruptions with the circular shape plasma is a low safety factor. Plasmas are vacuum vce8et
disrupted when the surface safety factor q* decreases to 3.0. The disruptions of elongated
plasmas (including the divertor configuration) are ~) due to the VDE'S. Rapid lp decay is usually @ observed when q~ drops to 2.0 because of the VDE.
Characteristics of disruptions with circularly ~ shaped plasmas and slightly elongated plasmas have
already been reported [12] . We have obtained the
toroidal eddy current on the vacuum vessel wall and
the magnetic field around the plasma by using the
SHP code[14]. The last phase of lp decay is not
well described by the SHP code. So, our magnetic analysis also uses the equilibrium code FITEQ [13]
with some modification to apply it to the disruptive
lp decay.
2. 2. Modifioation of FITEQ code and force
balanoe Magnetic field values corresponding to those
measured by the HT-2 magnetic sensors can be calculated from coil currents I., eddy current le and
plasma current density jp. The currents are
determined so as to minimize the following residual
E in the magnetic analysis [13, 14] ,
~ p E = ~ { P!yn ~ pj' ~p (R, ip), I., I*) }21(Tj2,
j=1 (1) where Pj', Pj~n ,aj and mp are the calculated field
values corresponding to the j-th magnetic sensor,
the measured field value of the j-th magnetic sensor,
the measurement error of the j-th magnetic sensor
and the number of magnetic sensors, respectively.
Once the currents are determined, the poloidal field
and electromagnetic forces can be calculated from
the currents.
The FITEQ is an MHD equilibrium code for a
steady state plasma and we modify it, so it can be
applied to the magnetic field during disruptive lp
decay. The modification includes assumption of
currents in the scrape off plasma area as well as in
the core plasma area. This situation is shown in
Fig. 3. There are three regions in the vacuum
vessel. Region I is the core area, in which all the
magnetic surfaces are closed without any interac-
tion with the limiter or the vacuum vessel wall.
Region 2 is the scrape-off area where current is on
the op~n magnetic surface. Region 3 is the scrape-
~~~~, f~~34~;
r
D < ~
(a) During steady state (b) During disruptive plasma
discharge. current decay.
Fig.3 Halo current region in poloidal cross section and
distributions of plasma current density jp as
functions of minor radius r.
off areawithout current. The original FITEQ code
ignores region 2, because it is applied to stable
plasmas like that of Fig. 3(a). However, during
disruptive lp decay with rapid plasma motions [12] ,
part of region I becomes region 2. Since the
current in the scrape-off area decays in less than
0.2ms, region 2 can be ignored, except during
disruptions. The modified equilibrium code FITEQD (FITEQ code for Disruption) assumes
toroidal current in the area in which the flux
function ip satisfies the equation,
ipa* > ip > ipH, (2) where ip.* is the flux function value at the magnetic
axis and ipH rs an input value which makes the
iterative calculation conyerge and E small.
The electron density of the HT-2 plasma is
about 3 x 10¹⁹m~3 and roughly an equivalent
density of H+ is in the plasma. The plasma weight
is estimated to be roughly 108kg because its volume
is 0.2m3. The electromagnetic force is estimated to
be in the order of 100N, because typically poploidal
field and plasma current is on the order of 0.01T
and 10kA. If the plasma is not at equilibrium, its'
acceleration rate is on the order of 10roms~2 and it
will collide with the vessel wall in several micro
seconds. However, disruptive lp decay occurs in
355

I
~f~ ;~7 ' ~~~:A*~~F~~~#*
about Ims,, so it can be said that the plasma is still at
an equilibrium. In this sense FITEQD is applic-
able to the disruptive lp decay phase.
During the disruptions, the plasma directly
touches the vacuum vessel wall and forces due to
thermal pressure and poloidal current as well as
due to the toroidal current can not be ignored
between the plasma and the vacuum vessel. The kinetic pressure Pk on the vessel wall is expressed
by,
(3) Pk = IeekTe + nikTi
where ne, ni, Te and Ti are the electron density, ion
density, electron temperature and ion temperatures
at scrape-off area, and k is the Boltzmann's constant. The pressure Pl due to poloidal current
is recognized as the difference of the magnetic
pressure of the toroidal field BT and is
P1 = (B~lN ~ B~oUT) / (2l/o) (4 )
where BTIN and BTOUT are the toroidal fields inside
and outside of the vessel wall, respectively, and !lo
is permeability in vacuum.
On the other hand, the plasma experiences a
force due to the toroidal current. The total force
FPT is obtained by the plasma surface integral
FPT = f B~ np / (2llo) dSp, (5)
and is estimated by the SHP code, where np is
the normal vector to the plasma surface directed
~~69~~~~ 4 I~* 1993~~ 4 J~
inward and FPT {= (F~T, FzPT)} is a vector on a
poloidal cross section. If the plasma is in a steady
state, FPT is zero. However, in the disruptive lp
decay phase, the force balance is,
FP = FPT + FPkl
FPT + f (p + p) nv dSv O (6)
where FP is the force acting on the plasma, nv is the
normal vector to the vacuum vessel wall directed
inward and the integral is calculated on the vacuum
vessel , wall. The force FPkl {= (FRPkl, FzPkl )
= f (Pk + pl) nvdSv} is the force acting on the
plasma due to thermal pressure and poloidal current and it is estimated by,
FPkl = _ FPT (7) using the SHP code in this study.
3. EXPERIMENTAL RESULTS 3. I . Eddy current distr,ibution during disruptive
lp decay The poloidal field strengths Bp are measured
during disruptions and results are plotted in Fig. 4,
including the time evolution of lp and net toroidal
current lv on the vacuum vessel. The lp decays in
0.5-1.5ms. In Fig. 4(a), showing the circular plas-
ma results, the plasma moves in the direction of the
small major radius side (6 = 180') .In Fis. 4(b), for
highly elongated plasma, it moves vertically
l
Fig. 4
50
_ 40 <J. 30
- 'a ~ " 10
O
p6 ~ bo C ~i -6
6
<'~'~,_;
!~0 210
(a)
Time evolutions of
IN and OUT mean respectively.
,
fl
f
1
,
IN ' , UT l
C=270'
:
11 12 13 15 17 18 19 20 21 1,
Time (ms) Time (ms) (b) Highly elongated plasma. Circularly shaped plasma.
plasma current lp,Poloidal field Bp, net vessel current lv during
the data are taken on the plasma side and atmospheric side
22
HT-2 disruptions.
ot the vessel wall,
356
I
~f -~ti~=,~~w~C
(toward the top: 6 = 270'). The poloidal fields
shown are the measured data in the direction in
which the piasmas are moving. The toroidal eddy
current density je on the vacuum vessel wall can be
estimated by
j* ~ (BpOUT ~ BplN) ///o, (8)
where BpOUT and BplN are outside and inside
poloidal fields. When plasmas are moving toward
the walls, the eddy current at the wall position in
which direction the plasma is moving, is in the
opposite direction of lp ~* < O) . However, the
eddy currents at this point become the same dirction
as lp ~* > O) at last. After that the eddy current
changes its direction, Ip decreases exponentially
and asymptotically reaches zero. The maximum lv
is observed to coincide with this change of direction.
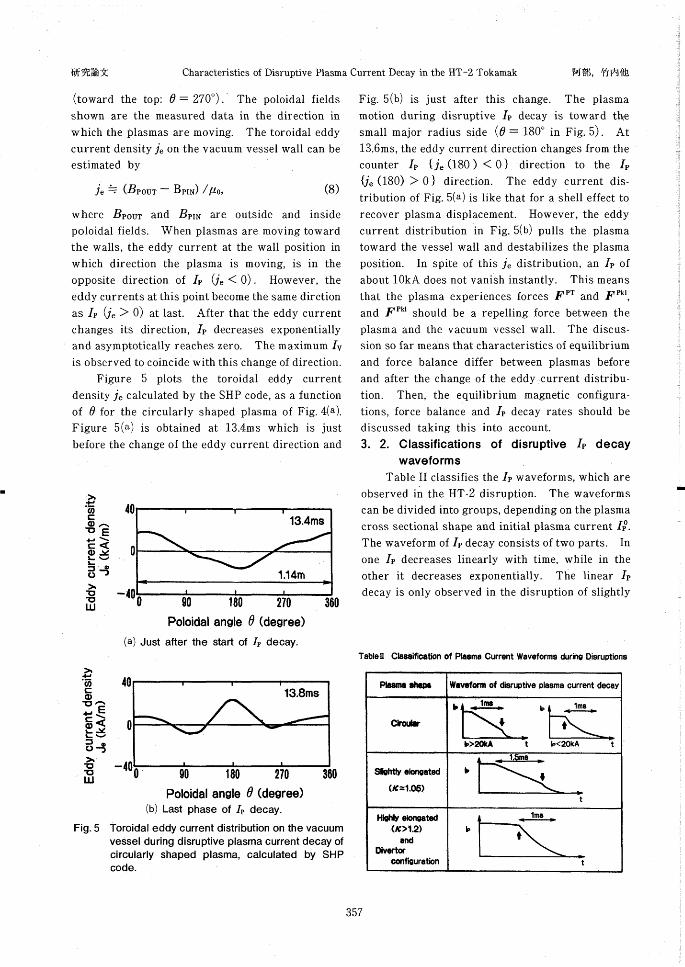
Figure 5 plots the toroidal eddy current density j* calculated by the SHP code, as a function
of a for the circularly shaped plasma of Fig. 4(a).
Figure 5(a) is obtained at 13.4ms which is just
before the change of the eddy current direction and
> :S CO
c Of~ 1,E ~'¥ c< O~: L,J L:3 _,o
O' > lO =, UJ
40
o
Characteristics of Disruptive Plasma Current Decay in the HT-2 Tokamak
-10
13.4ms
1 .1 4m
> d+ .55
C O ~f~ 4JE ,: ¥d,
e~: L¥' :' O1)o
> U U LU
(a)
40
O 9Q 1 80 270 360 Poloidal an9le 6 (de9ree)
Just after the start ot I, decay.
~~~S, ~rP~l4~a
Fig. 5(b) is just after this change. The plasma
motion during disruptive lp decay is toward the
small major radius side (6 = 180' in Fig. 5). At
13.6ms, the eddy current direction changes from the
counter lp {j* (180 ) < O} direction to the lp
{je (180) > O} direction. The eddy current dis-
tribution of Fig. 5(a) is like that for a shell effect to
recover plasma displacement. However, the eddy current distribution in Fig. 5(b) pulls the plasma
toward the vessel wall and destabilizes the plasma
position. In spite of this j* distribution, an lp of
about 10kA does not vanish instantly. This means
that the plasma experiences forces FPT and FPkl
and FPkl should be a repelling force between the
plasma and the vacuum vessel wall. The discus-
sion so far means that characteristics of equilibrium
and force balance differ between plasmas before
and after the change of the eddy current distribu-
tion. Then, the equilibrium magnetic configura-
tions, force balance and lp decay rates should be
discussed taking this into account.
3. 2. Classifications of disruptive lp decay
wavefo rm s
Table 11 classifies the lp waveforms, which are
observed in the HT-2 disruption. The waveforms
can be divided into groups, depending on the plasma
cross sectional shape and initial plasma current I~,.
The waveform of lp decay consists of two parts. In
one lp decreases linearly with time, while in the
other it decreases exponentially. The linear lp
decay is only observed in the disruption of slightly
13,8ms
TableH Cta88ifle8tkm of Pbsma Current Waveforms during DisruDtions
Fig. 5
o
- 40 o 360 ' 90 1 80 270 Poloidal angle e (de9ree)
(b) Last phase of lp decay.
Toroidal eddy current distribution on the vacuum
vessel during disruptive piasma current decay of
circularly shaped plasma, caloulated by SHP code.
357
I
8
f~ ;~7 ・ ~~~!A*~~~~,---"*~
~ < J~
~ ,y~
~' c OL
L:-
o o co ,o
o >
,, < J, '~, ~? d~ =L(D
=0
o co (o
o >
6
4
2
o
6
4
2
(a) Elon9Gted
x ,C:::1.1
A ,C=1.2-1.4 A Divertor
confi9uration
/ /
/ al /
/ ll la
/ /
/ /
,~
/ /
/ JL
JL
/
ll /// Iv=; I Io
~ I~
/ Pp
{ Iv=T
lp= Pp +0 4
v~2i '
(b) Circular shaDe lv=~Pp
/ /
/ /
p- ~ n / lv~~i:+3.v I e /
e I e ' ee ' ll,, e e' e ...,. le .. It .... / / _, '-~'~/ I~-~+0,4 i
.p ;1__"
/ /
O o I O 20 30 40 50 Initial Dlasma current ~o(kA)
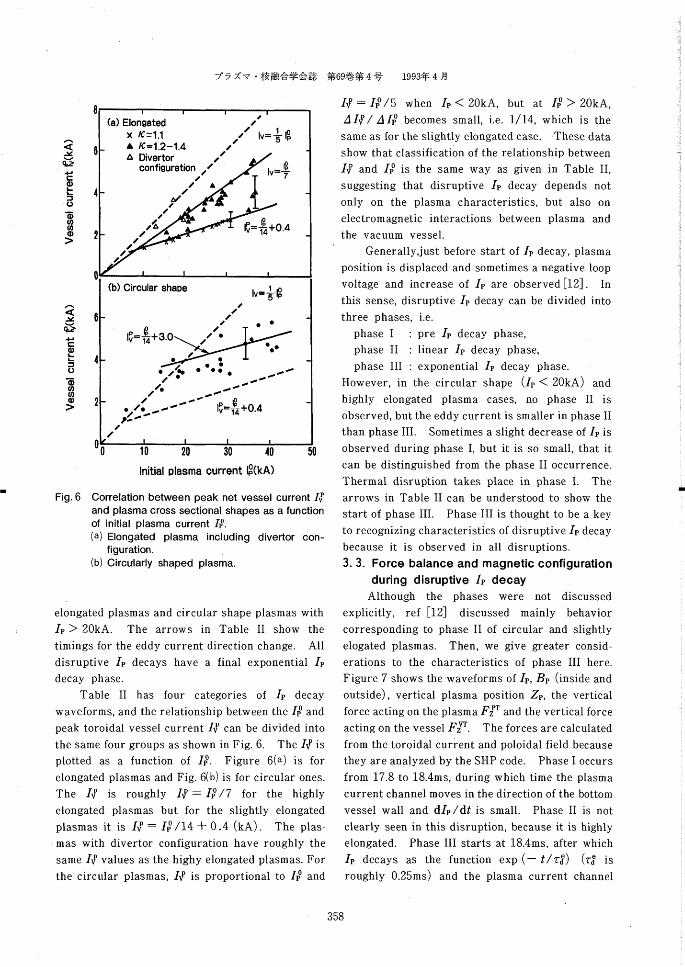
Correlation between peak net vessel current 1~
and plasma cross sectional shapes as a function of initial plasma current I~.
(a) Elongated plasma including divertor con-figuration.
(b) Circu'larly shaped plasma.
~~69~~~~ 4 ~~ 1993~~ 4 ,~
I~ = Ip0/5 when lp < 20kA, but at lpo > 20kA,
AI~/ Alpo becomes small, i.e. 1114, which is the
same as for the slightly eiongated case. These data
show that classification of the relationship between
lvP and lpo is the same way as given in Table II,
suggesting that disruptive lp decay depends not
only on the plasma characteristics, but also on
electromagnetic interactions between plasma and
the vacuum vessel.
Generally,just before start of lp decay, plasma
position is displaced and sometimes a negative loop
voltage and increase of lp are observed[12] . In
this sense, disruptive lp decay can be divided into
three phases, i.e.
phase I : pre lp decay phase,
phase 11 : Iinear lp decay phase,
phase 111 : exponential lp decay phase.
However, in the circular shape (Ip < 20kA) and
cases, no ase 11 is
Fig. 6
elongated plasmas and circular shape plasmas with
lp > 20kA. The arrows in Table 11 show the timings for the eddy current direction change. All
disruptive lp decays have a final exponential lp
decay phase.
Table 11 has four categories of lp decay waveforms, and the relationship between the lpo and
peak toroidal vessel current lvP can be divided into
the same four groups as shown in Fig. 6. The lvP is
plotted as a function of lpo. Figure 6(a) is for
elongated plasmas and Fig. 6(b) is for circular ones.
The I~ is roughly lvP = Ip0/7 for the highly
elongated plasmas but for the slightly elongated
plasmas it is lvP = I~/14 + 0.4 (kA) . The plas-
mas with divertor configuration have roughly the
same If values as the highy elongated plasmas. For
the circular plasmas, I~ is proportional to lpo and
highly elongated plasma cases, no phase
observed, but the eddy current is smaller in phase II
than phase 111. Sometimes a slight decrease of lp is
observed during phase I, but it is so small, that it
can be distinguished from the phase 11 occurrence.
Thermal disruption takes place in phase I. The
arrows in Table 11 can be understood to show the
start of phase 111. Phase 111 is thought to be a key
to recognizing characteristics of disruptive lp decay
because it is observed in all disruptions.
3. 3. Force balance and magnetic configuration
during disruptive lp-decay
Although the phases were not discussed explicitly, ref [12] discussed mainly behavior
corresponding to phase 11 of circular and slightly
elogated plasmas. Then, we give greater consid-
erations to the characteristics of phase 111 here.
Figure 7 shows the waveforms of lp, Bp (inside and
outside), vertical plasma position Zp, the vertical
force acting on the plasma FZPT and the vertical force
acting on the vessel FzVT. The forces are calculated
from the toroidal current and poloidal field because
they are analyzed by the SHP code. Phase I occurs
from 17.8 to 18.4ms, during which time the pla~ma
current channel moves in the direction of the bottom
vessel wall and dlp/dt is small. Phase 11 is not
clearly seen in this disruption, because it is highly
elongated. Phase 111 starts at 18.4ms, after which
lp decays as the function exp (-t/r~) (Td Is
roughly 0.25ms) and the plasma current channel
358
l

I
~f~~f~;~~*---=,~~ ~
ao
Characteristics of Disruptive Plasma Current Decay in the HT-2 Tokamak
0.2
Fay~1S, it~l4~;
'~ < J~'
~
30
20
10
o
Plasma current
IN
__ ._ _ d- -~- -~*~ ~" ~ ~i~ OUT 'b' ~ ~ ~..
~,~__ Pobidal fleld ( 6 270' = )
E ~. N j~ ,O'_
q' :::
0.1
'**
h ~ L2i
o,03
o
-0.03
o
-0.1
-0.2
f' E~
o ~ '~l
r~ Z ~, r ,LN LL
h )N LL
Fig. 7
O
-4
-8 O
- 2GO
-400
O
-200
- 400
18 I9 Time (ms)
Vertical force balance during disruptive lp decay
ot elongated plasma. The disruption is due to the VDE. Plasma ourrent lp, Poloidal field Bp (lN
and OUT), plasma vertical position Zp, vertical
force on plasma FZFT and vertical force on vessel
FZVT are plotted. The forces are calculated by
the toroidal current only.
.~ E ~. N d~! J:: .a,_
a, =:
f~ S ~. N ~~ a' ,~
=
0,1
o
-0.1
-o. 2
O. 1
o
-0.1
l
.t
.::::i::' . .4 "
. . I . .*. .
':': :~-'~'1'r:~'¥'
!"!"' : r:¥" : '¥' : j; '1/~:;;;i ~~~:~~~:~,:¥{~:
: ' ?:/ :.・:~k:-i'~: .~:L t ,~::¥~
~ { ,~ it.:;/;.:* ~
s' ';,.,.t' s 'r:~' ~:~, : ' '
~ :"t'}-~i$' ~,,~ I .,~, '$1 't. t'J~' 'h'eslell :1~ I A: ' ~s.: ~'5 :. y:_'~ I ~ 1 !~t~.~tt¥;"" ~ " '. ' " ':~:/j:/'/
.J~. . ~ '/' I ' l_ . ¥. . J¥' ~:;;$
' "'~' '~~:?~is
.::::r .::::::l
' ~:'~11~:~; f
7 :;'~ : : : :.:!:".':~:~~ i :~:
""/~ ' ~: :: t~ : :¥:
:::':k,~' .::'::t~.:::
"':~¥i:.~~' :::::1.¥c:~i.:
~ """t'*:"" : :~i・:・: : : : '~ 'Y l:~:.:.* ...r.::i*~J" ':¥ . **: * . .
18.4ms
-0.2 I
changes its direction of motion. The Zp after
19.0ms is not plotted because the small lp and large
eddy current cause a large uncertainty with the
filamental model of the plasma.
During phase I, FZPT is roughly zero, but
becomes non-zero by the start _of phase 111. The
FZPT should be cancelled by the force due to the
poloidal current and thermal pressure, i.e. FzPkl of
Eq. (7) . The vacuum vessel experiences the counter force and the total force on trie vessel is the
sum of - FzPkl and F~T. It is plotted by a dashed
line in Fig. 7. Then we conclude that during phase
I, the force acting on the plasma is mainly due to the
toroidal current, but on entering the lp decay phase,
the force due to the poloidal current and th~ thermal
pressure become important.
Figure 8 shows the magnetic configuration and
plasma current density during disruptive lp decay
Fig. 8
0.28 0.38 O.48 0.58 4 3 2 1 O Major radius R(m) Plasma current denSity
Jp(1 06Alm2)
Magnetic configuration and plasma current density distribution during disruptive lp decay
analyzed by FITEQD. The dofted area shows where the plasma current is found.
as analyzed by FITEQD. The disruption is the same as in Fig. 7. The first one is got at 18.0ms
which is during phase I, the second is at 18.4ms
which is at the end of phase'l, ahd the third is at
18.8ms which is early in phase 111. The dotted area
shows where the current is found. At 18.0ms the
plasma vertical displacement is small and the scrape-off area with current is thin. At 18.4ms,the
vertical displacement has become large and the
scrape-off area carrying the current becomes thick.
Since the plasma directly touches the, vessel wall,
359

I
j~ ;~7 ' ~~;~~!A*~~:A~~~~~~*~
the force FzPkl of Eq. (7) has a rather large value as
discussed in Fig. 7. At 18.8ms, during phase 111,
there is no closed flux surface in the plasma area.
The magnetic axis has moved out of the plasma area
and the upper half of the initial plasma has
remained. At this time, Ip of 15-20kA is still
observed in the plasma area. The change of toroidal eddy current direction at the start of phase
III can be recognized as due to the displacement of
the magnetic axis from the plasma area to the
vacuum vessel wall.
The reason that the plasma current channel
changes its direction of motion at the start of phase
III is recognized as follows. The core part of the
plasma current is displaced from the plasma area to
the vessel wall at about 18.6ms with rapidly moving
magnetic axis, but the scrape-off plasma current
does not move and remains in the vacuum vessel.
Since the magnetic measurement system measures
the weighted center of the plasma current distribu-
tion, it measures the current center of the scrape-off
area. However, if the measured plasma cent-er is
defined by the magnetic axis, the plasma does not
change direction.
Figure 9 shows a disruptive lp decay of a
slightly elongated plasma. The parameters are the
same as in Fig.7, except for pp + Ii/2, where ~p is
the poloidal beta and li is the normalized internal
inductance. The pp + Ii/2 is not well analyzed
when lp becomes small. Phase 11 is from 16.4 to
17.4ms (strictly speaking, phase 11 starts just after
16.4ms) and phase 111 starts at 17.4ms. Decrease
of the ~p + Ii/2 value suggests thermal disruption
occurs at 16.4ms. During phase II, the plasma is
going up, FZPT has a non-zero value and BplN rs
larger than BpOUT at 6 = 90'. Then,the magnetic
axis is thought to be in the plasma area, and it is
moving toward the top wall. However, the motion
is suppressed by the shell effect of the toroidal eddy
currents and the force FPkl also suppresses the
motion because FZPT has a non zero value. The
plasma position is maintained by balancing FPT and
FPkl. The important difference between disrup-
tions of Fig. 7 (highly elongated) and Fig. 9
(slightly elongated) is the speed of the magnetic
axis motion. The magnetic axis arrives at the vessel wall instantaneously (less than 0.2ms) after
the lp decay starts in Fig. 7 but it takes about Ims in
< ~,¥_
J~
h ~a GO
l~ < ~'
~ r~i
h teN
40
30
2Q
10
O
0.05
1993~1~ 4 ;!
Verticel force (Plasma)
400
200
O
Verticel force (VesseD
400 __・* .,...
200 *_.,_ O
=1cv
1 ,o + o q~L
0.5
O
~N LL
Fig. 9
16 17
Time (ms)
18
Vertical force balance during disruptive plasma
current d,ecay of slightly elongated plasma. Plasma current lp, Poloidal field Bp ( IN and OUT)
, pp + Ii/2 value, plasma vertical position Zp, vertical force on plasma FZPT and vertical force on
vessel FZVT are plotted. The forces are calcu-
lated by the toroidal current only.
Fig. 9. In the highly elongated case, the plasma
experiences strong Zp instability and lp decay
enhances the instability even more, so the magnetic
configuration changes rapidly to phase 111. Howev-
er, in the slighly elongated case the Zp instability is
weak and Zp is maintained mainly by FPT and
partially and by temporarily FPkl, Since FPT and
FPkl decay in roughly Ims and 0.Ims respectively,
reproducing the forces is necessary to maintain Zp.
Then, the plasma continues to move toward the top
vessel wall, which scrapes away the current in
plasma.
However, the results analyzed by the SHP code
describes the plasma position of the weighted center
of plasma current. Magnetic analysis using the
FITEQD code was carried out to obtain the motion
of the magnetic axis. Figure 10 shows the magnetic
configuration and plasma current density of slightly
360
l

~~f*~ti~・~~~~'~il^~~ Characteristics of Disruptive Plasma Current Decay in the HT-2 Tokamak ~~~~, ~r~~4~
~ c _ 3 o -~ ~~ 2 o '~ 'o c~' ~~C 1 *, 'a ~9 1 O CL
O, 2
0.1
E
N O ~ c .a,_
~ -O 1
-0.2
1 6.4ms
.:i~k:;~;~~;.::'~~~~b~"**・*; ~~
. .'. d:r".~-. . 4 '$ '. .1 ' *~ V$ ~S:'/'/'1~:.-
. .~:¥'~.~~;.¥$~':¥
y~t""' ・ ・ ・ , .- ・ ・ ・)・~¥ ¥:,~~:¥;~
- /' '~ ・~:::::~t:ii ' ! :~: 3;'?::
~; "~ '~ '1~",L:-" ""' "~ '~* . .rTIT" "* *' /
*;~ If" ~~~~' -' "'t / '-" j ¥:~:::;~ "'1
18.8ms
"!'1lt"' I't'l :"I$rt" ~~~~ I;{;:~ tF . :' .:1 It. l 'l' 14rTl" " t t ' ,,. . . ~it;""I " lll"t'l' "I J'IilS:"'!"'1¥tl ~: {: S ~fJ
~ t i't "I"I"i:t' Y'It't' ,.. .,ll rll'It .:'t tl'll"I' ~::~::::h~~:.:i'::~ Itl! :~,~ ~1 1 I~" I ' t 'l
:t'::':~/
:1;'::i:/:"::/ : IS¥"'1" ;:::;,~'fl'JL'J'J"J'S 'I"'t' 'IIll'lJ"f' ' : : :1~.;: : I :1:~i : 'f: I : :': ' t I !
l'l~'-11" '~' I il"I IJI tlt J
'I:~"Itl::.L 'II l:l ll I I I l'l~1~"t I '4:" J'J' ' t'l "4 "e ~"I
"""" ' f I " ' 'r 'd ' t l" "$ " l ~1'1':"' '-'1111 " /
"'rt "i " I / $ ' I ' i t ' t " I l'!" t4 " ' Il {rr ~4 '1'1~1 "I J ll""IIlttl'll'4tt 1'1 ,..'a,, . . t I """I" 1"'$ ' / I t ~~~'~i~1~1 ' " I ;4" t' ' L:_~.::-'~::/: ;:?t'
17.4ms
:. ' ':7:ik : :~:c'd~:~~;;~~~$i ' i ~ ; ・ ~
・:'.::;;i;i';~;::i;;is'~-
:/~ .. . ;~:./"f/ :;:?~;;~~~":::"':"":g 'L"' """'f'::/""'1 ' " ' ' "' '!"h! ' """':';"I " 'F"::.....J....!::h' ,., 'h.'....._... "" !::l """'*"":,;"i'
:.'}' '/"'~':~$ ' :1:'* ' '::'.$'1"'/*'J"
' :;/" r' ~;;~:"' "'/~:::'::) '$""' """""'f : ~S : ";-' : ~:/:・~:.. j ,;;
. .J. '::;"~'i" "Js
Fig. 10
0.33 0.43 0.53 0.33 0.43 0.53 0.33 0.43 0.53 Maior radius R (m) Maior radius R (m) Major radius R (m)
Magnetic configuration and plasma current density during disruptive lp decay of slightly elongated plasmas.
I
elongated plasma during disruptive lp decay.
Three time slices are analyzed. The first one is at
16.4ms which is during phase I, the second is at
16.8ms w'hich is during phase 11 and the third is at
17.4ms which is end of phase II. Halo plasma
current in the scrape off area is necessary to
converge the iterative calculation of FITEQD.
Comparing with Fig. 8, the magnetic axis does not
vanish instantly in Fig. 10 as estimated from SHP
results in Fig. 9.. During phase II, the magnetic
axis exists and moves not only the vertical but also
the radial direction, but the area with closed flux
surfaces become small. The scrape off area with
halo current become large but the position of the
area does not change so much.
We conclude that the presence of phase II
depends on the existence of magnetic axis during lp
decay phase. When the position stability of the
plasma is strong as highly elongated case, the
magnetic axis vanishes instantly and no phase 11 is
observed. In the highly elongated case like Fig. 7,
reproduction of FPT and FPkl is not enough to
maintain magnetic axis position against the instabil-
ity, ev,en temporarily.
The thermal disruption can be observed clearly
in Fig. 9 slightly elongated case, while there is no
clear thermal disruption in highly elongated case.
This also can be understood by the position instability. Since the vertical position instability
is strong in highly elongated case, the thermal
disruption is thought to be occurred in coincidence
with the vanish of magnetic axis and rapid lp decay
start, which make it difficult to observe the thermal
disruption. However, in the slightly elongated
case, since the position instability is not strong,
magnetic axis stays for a while and lp decay does
not coincide with the thermal disruption. This
situation makes it easy to observe the thermal
disruption.
The process of disruptive lp decay can be
recognized as a process of magnetic axis displace-
ment from the plasma area to the vessel wall.
When the axis arrives at the wall, the plasma current channel is supported by the forces FPT and
FPkl. Then,phase 111 is an equilibrium condition in
which the plasma is supported by the magnetic field
and vacuum vessel wall. Interactions due to the
kinetic pressure and poloidal current are present
between the plasma and the vessel wall.
3. 4 Time constant of disruptive lp decay
The lp decay time Td is usually defined by the
average of dlp/dt divided by the lpo [12]. Howev-
er, we have just shown that the lp decay ph.ase can
be divided into three phases, so it is reasonable to
discuss Td for each phase. The lp decay rate for
phase I can be ignored because the rate dlp/dt is
very small. Phase 11 has linear lp decay and dlp/dt is constant with time. The decay time 1,Idl
for phase 11 is defined by
rdl = _ I~)/(dlp/dt). (9) Phase 111 has exponential lp decay and the decay
361
I
j ~? ;~? ・ ~~~~A*~~fA**#*
time r~ is defined by
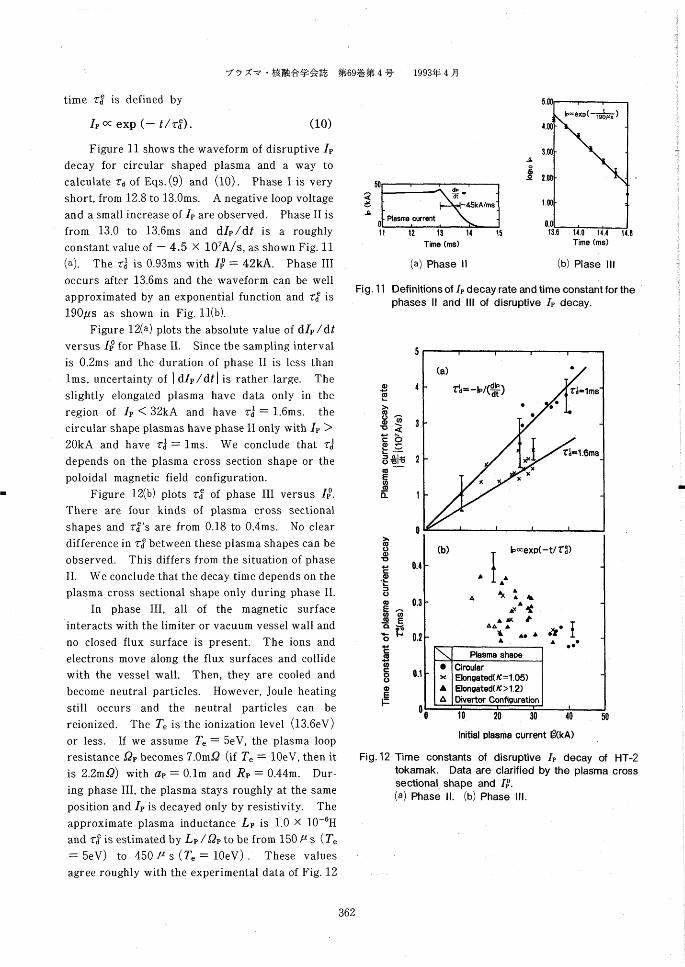
lp oc exp (- tlr~) . (10) Figure 11 shows the waveform of disruptive lp
decay for circular shaped plasma and a way to calculate Td of Eqs.(9) and (lO) . Phase I is very
short, from 12.8 to 13.0ms. A negative loop voltage
and a small increase of lp are observed. Phase 11 is
from 13.0 to 13.6ms and dlp/dt is a roughly constant value of - 4.5 x 10⁷A/s, as shown Fig. 11
(a). The T~ is 0.93ms with lpo = 42kA. Phase 111
occurs after 13.6ms and the waveform can be well
approximated by an exponential function and rd' is
190/Is as shown in Fig. 11(b).
Figure 12(a) plots the absolute value of dlp/dt
versus lpo for Phase II. Since the sampling interval
is 0.2ms and the duration of phase 11 is less than
Ims, uncertainty of I dlpldtl is rather large. The
slightly elongated plasma have data only in the
region of lp < 32kA and have rdl = 1.6ms. the
circular shape plasmas have phase 11 only with lp >
20kA and have r~ = Ims. We conclude that rdl
depends on the plasma cross section shape or the
poloidal magnetic field configuration.
Figure 12(b) plots r~ of phase 111 versus lpo.
There are four kinds of plasma cross sectional
shapes and r~'s are from O 18 to O 4ms. No clear
difference in T:d* between these plasma shapes can be
observed. This differs from the situation of phase
II. We conclude that the decay time depends on the
plasma cross sectional shape only during phase II.
In phase 111, all of the magnetic surface
interacts with the limiter or vacuum vessel wall and
no closed flux surface is present. The ions and
electrons move along the flux surfaces and collide
with the vessel wall. Then, they are cooled and
become neutral particles. However, Joule heating
still occurs and the neutral particles can be reionized. The T* is the ionization level (13.6eV)
or less. If we assume T* = 5eV, the plasma loop
resistance Qp becomes 7.0mQ (if T* = 10eV, then it
is 2.2m9) with ap = 0.Im and Rp = 0.44m. Dur-
ing phase 111, the plasma stays roughly at the same
position and lp is decayed only by resistivity. The
approximate plasma inductance Lp is 1.0 X 10⁻⁶H
and T~ is estimated by Lp /Qp to be from 150 P s (T*
= 5eV) to 450 P s (T* = 10eV) . These values
agree roughly with the experimental data of Fig. 12
50
1993~~ 4 )~
db ~T~
-45kA/ms
* ~
< ~'
o Pl8sma current
5,ao
a.OO
3.00
2 .OO
1 .oo
0.0
11
Fig. 1 1
b*exD(- t 190Ps )
lz IS 13.6 u.o 14.4 1, 8 14 15
Time (ms) Time (ms) (a) Phase ll (b) Plase 111
Definitions of lp decay rate and time constant tor the
phases 11 and 111 of disruptive lp decay.
5
o d +' L,D
> CD
o-o'Q 3 ¥ 1'< ~'~ =0 O-LL ~ 8 ~l~ 2
co~ E cb ,D
~: t
~ CD
o o ~ 4' ,ca'
L :'
o 'o
E 'o ~o
Q '~ o ~ c 'u 1' ~ o o o e F:
f~ ,O
E ~*' ~:1'
o
0.4
0.3
0,2
8.1
o
(a)
T{d=-b/(d_・d_dl~)
,c
,
~'1
xx
, e
t~ - I ms
rdt -1 .6ms
(b )
A
A
}
AA
e
A A
bceex p( - t/ Zi~)
J~dLAJL J~A J~
JL~( JL IL dlLe JL '~re I JIL
A A ee Plasma shaoe
Circular
Ebn9ated(/C=1.05) Elongated(,c>1.2)
Divertor Confi9ur8tion
,
Fig. 1 2
O I O 20 30 40 50 Initial plasrha current l~(kA)
Time constants of disruptive lp decay of HT-2 tokamak. Data ~are clarified by the plastna cross
sectional shape and lpo. (a) phase ll. (b) Phase lll.
362
I

I
~~f~~~t~~'-~~"~i+Ro~ Characteristics of Disruptive Plasma Current Decay in the HT-2 Tokamak ~~~1S, i~rF~l4~~
(b), we conclude that the lp decay of phase 111 is
simply due to the high resistivity of the plasma
which is cooled to be T* = 5 - 10eV, The cause of
such low temperatures is that there is no closed flux
surface during phase 111 and the plasma touches the
vessel wall directly.
4. DISCUSSION 4. I . Phase 111 and vessel loop resistance
The plasma current channel does not move
during phase 111. The plasma and the vacuum vessel can be recognized as a simple parallel circuit.
The relationship of lv and lp during phase 111 is
roughly,
lp/Iv = 9v/1~)p (11) and 9p is calculated at T* = 5 - 10eV in phase 111.
The sum of lp and lv Should be less than lpO even at
the beginning of phase 111. Then, the lp during
phase 111 is,
lp < Ipo 1~)v/(9v + 9p) (during phase 111) .
(12)
where 9p is a value calculated at T* = 5 - lOeV.
The HT-2 has quite a large 12v Value, i.e. ~v > 1~)p
and at the beginning of phase 111, Ip is a rather large
value of 10 - 20kA. In this case, rd* is equal to
Lp 19p.
However, a tokamak with low 9v (12v < 9p)
should have a small lp at the beginning of phase 111,
suggesting that the phase 11 period becomes longer
due to low 9v. The r~ should be equal to the decay
time of lv (rd' = Lv/~v : Lv is the inductance of net
vessel current lv) with low 9v.
The waveform of disruptive lp decay depends
on the 9v Value and 9v/9p Should be taken into
account, when the results of this research are
compared with disruptions in other tokamak
devices. However, usually tokamak devices are designed so that 9v rs larger than 9p (T* = 5 -
10eV) . This is true of the HT-2. Then it is
expected that the waveform of HT-2 disruptive lp
decay is similar to that of other tokamak disrup-
tions, except for those with insulation in the toroidal
direction.
4. 2. Comparison with disruptive lp decay of
large tokamaks Several reports on disruptive lp decay, espe-
cially that due to VDE's has been published from
large tokamak experiments. Here, we consider the
common characteristics of disruptive lp decay in
large and small (HT-2) tokamaks.
The DIILD tokamak_ experiment[16] reported
that disruptive lp decay includes two phases. In
the first, the plasma moves vertically without lp
decay and in the second. Ip Starts to decay and a
vertical force due to poloidal current is observed.
These are the same characteristics as phases I and
II shown in the HT-2 disruptions. However, no phase 111 is identified, although exponential lp decay
occurs in the reported waveform. Then, phase 111
also occurs in DIII-D.
The JET tokamak experiments did not identify
phases but many common characteristics can be drawn from the Harris report[171. The direction
of vertical movement changes during disruptive lp
decay. After this, Ip decays exponentially and T*
decreases to less than 100eV coinci,ding with the
change of plasma movement direction. In JET disruption, Td' is calculated to be 12ms (T* = 5eV)
and this value is consistent with the experimental
result. These characteristics are shared with the
HT-2 experiments. Then,we can say that phaseIII
occurs in the JET disruptive lp decay and T* is
roughly 5eV during the this phase, because phase 111
is a phase during which no closed flux surface is
present and plasma is cooled by the vessel wall
.directly.
5. CONCLUSION Characteristics of disruptive lp decay have
been studied experimentally in the Hitachi tokamak
HT-2. The plasmas studied were vertically elon-
gated and circularly shaped. The disruptive lp
decay occurred with three phases. During phase I,
large displacement of plasma position without lp
decay was observed. A rapid lp decay was observed during phase 11 and the decay rate was
almost constant with time. The eddy current distribution was like that of a shell effect which
creates a poloidal field to reduce the plasma
displacement. Phase 11 was observed in slightly elongated and high lp (> 20kA) circularly shaped
plasmas, which did not have strong plasma position
instability. During phase 111, Ip decayed exponen-
tially and no closed flux surface was present in the
363

I
j~ ;~:7 ' ~;~~~~~~~A~*#*
plasma area. The lp decay rates in phase II
depended on the plasma cross sectional shape, but
they did not in phase 111. The plasmas directly
touched the vessel wall during phase 11 and 111.
Then, the plasma position was maintained by the
forces of poloidal current and thermal pressure as
well as toroidal current. The poloidal currents
flowed in the scrape-off area and the vessel wall
during phase 11 and 111. The magnetic axis was
displaced from the plasma area to the vacuum vessel
wall between phase 11 and 111.
ACKN OWLEDG EM ENTS We would like to thank Drs. Doi, Ozaki, Oomae
and Murai for their encouragement throughout this
work.
REFERENCES [ I J C. Flanagan, "Research and Development Needs
for ITER Engineering Design", ITER Documenta-
tion Series N0.20 International Atomic Energy
Agency, Vienna, 1991.
[ 2 J K. Yamazaki and G.L. Schmidt, J. Nucl. Mater. 128
& 129, 832 (1984) .
[ 3 1 TFR Group, Nucl. Fusion 25, 919 (1985).
[ 4 J K. McGuire, D. Buchenauer, P. Couture, R. Izzo, K.
Kawahata, D. Monticello, K. Okano and N. Sauthiff,
J. Nucl. Mater. 121, 329 (1984) .
[ 5 J D.J. Ward, R.D. Gill, P.D. Morgan, J.A. Wesson,
"The Final Phase of JET Disruptions", Europhy-
sics Conference Abstracts, 15th European Confer-
ence on Controlled Fusion and Plasma Heating,
Vol.12B, Part. I, P.330 (1988).
[6 1 J.A. Wesson, R.D. Gill, M. Hugon, F.C. Schuller,
J.A. Snipes, D.J. Ward, D.V. Bartlett, D.J. Campbell,
P.A. Duperrex, A.W. Edwards. R.S. Granetz,
N.A.O. Gottardi. T.C. Hender, E. Lazzaro, P.J.
Lomas, N. Lopes Cardozo, K.F. Mast, M.F.F. Nave,
N.A. Salmon, P. Smeulders, P.R. Thomas, B.J.D.
Tubbings, M.F. Tuner and A. Weller, Nucl. Fusion
29, 641 (1989) .
~~69~~~i~ 4 ~= 1993~~ 4 )~
[ 7 J JT-60 Team "Review of JT-60 Experimental
Results from January to October, 1989", JAERI-M
90-066 Chapter 10, Japan Atomic Energy Research
Institute (1990) .
[ 8 J J.A. Wesson, D.J. Ward, M.N. Rosenbluth, Nucl.
Fusion 30, 1011 (1990).
[ 9 1 M.J. Schaffer, B.J. Leikind, Nucl. Fusion 31, 1750
(1991) .
[10] P. Noll, "VDE'S and halo currents on JET", ITER
Specialist Meeting on Vertical Displacement
Events and Disruption-Generated Runaway Elec-
trons, July 23-25, Garching, Germany,(1990)
[1l] A.G. Kellman, J.R. Ferron, T.H. Jensenn, L.L. Lao,
E.A. Lazarus, J.B. Lister, J.L. Luxon, D.G. Skinner,
E.J. Strait, E. Reis, T.S. Taylor, A.D. Turnbull,
"Vertical Stability, High Elongation, and the
Consequences of Loss of Vertical stability on DIII-
L12]
[13]
L14]
[15]
[16]
[17]
D" , 16th Symposium on Fusion T~chnology,
Ldndon 1990, Proceedings p.1045, Elsevier Science
Publishers B.V. 1991.
M. Abe, K. Takeuchi, H. Fukumoto, M. Shimizu and
M.Otsuka, Jpn. J. Appl. phys. 29, 395 (1990) .
M. Abe and K. Takeuchi, Kakuyugo Kenkyu 67, 275 (1992).
M. Abe, K. Takeuchi, H. Fukumoto, M. Otsuka,
Kakuyugo Kenkyu 61, 38 (1989) .
L.L. Lao, H. St. John, R.D. Stambaugh, A.G.
Kellman, W. Pfeiffer, Nucl. Fusion 25, 1611 (1985); L.L. Lao, T.H. Jensen, Nucl. Fusion 31,
1909 (1991).
A. Kellman, T.H. Jensen, L.L. Lao, J.Luxon, E. Reis,
M.Schaffer, D.Skinner, E. Strait, "Vertical Dis-
placemel4t Events. Disruptions. aled Ruleaway Elec-
trov,s ile DIII-D" , ITER Specialist Meeting on
Vertical Displacement Events and Disruption-
Generated Runaway Electrons, July 23-25, Gar-
ching, Germany, (1990) .
G.R. Harris, "Comparisons of the Current Decay
During Carbon-Boulcded aud Beryllium Boulcded
Disruptions in JET", JET-Report (90) 07, (1990) ,
JET Jomt Undertakmg Abington, Oxon, UK.
364