Embed Size (px)
Citation preview

Current Climate Science and Climate Scenarios for Florida
Daniel Bader and Vivien Gornitz
Water Utilities and Climate Change Workshop Palm Beach County Water Utilities/
Water Research Foundation June 10, 2011
1
State of the Science
• International/National – IPCC 4th Assessment
Report (2007) – IPCC 5th Assessment
Report (2013) – USGCRP Climate Impacts
Report (2009)
• State/Regional – Florida Climate Action
Plan released in 2008
2

Southeast Florida Climate
• Temperature – Range from an average of 67
°F in January to 83 °F in August
• Precipitation – Annual average of 56 in – Pronounced rainy and dry
season • Local climate features
– Thunderstorms – Tropical cyclones
3

Observed Climate Trends
Temperature and sea level
are rising in South Florida
4
Temperature data from NOAA NCDC. Sea level data from NOAA Tides and Currents. Source: Columbia University Center for Climate Systems Research

El Niño Southern Oscillation (ENSO)
SST Anomalies from 1998 El Niño
5

El Niño Southern Oscillation (ENSO) Teleconnections – Seasonal Averages
6 Source: NOAA CPC

Downscaling • Statistical downscaling produces finer scale features than Global
Climate Models (GCMs) using historical relationships between the large and small spatial scales
• Dynamical downscaling achieved by running a Regional Climate Model (RCM) RCM at high resolution over a small spatial domain driven by GCM output
7
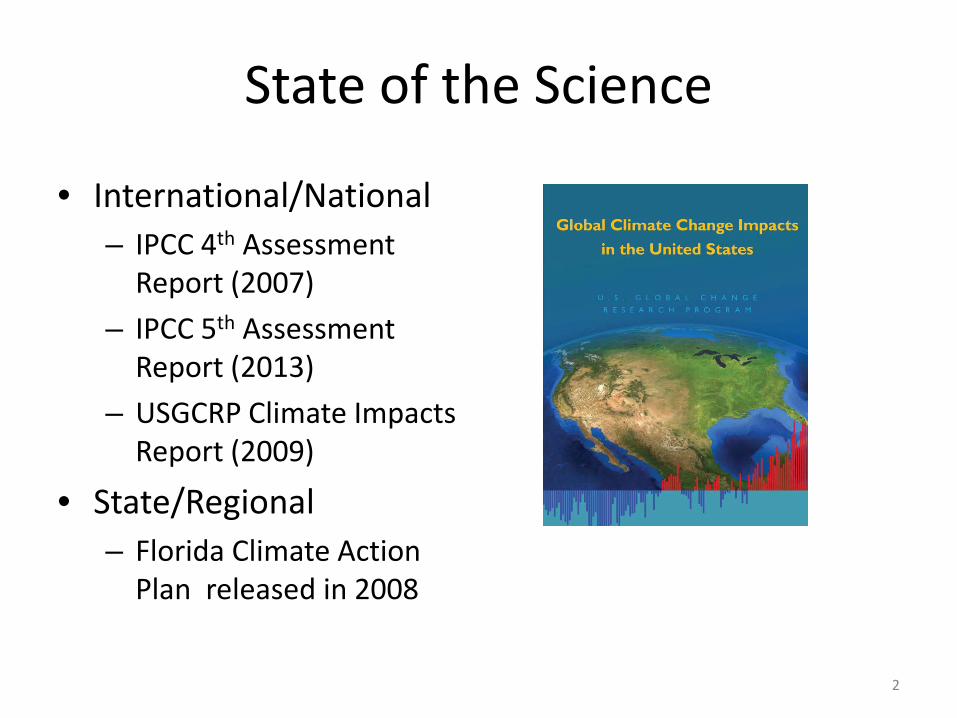
Mean Annual Changes
Baseline 2020s 2050s 2080s
Air Temperature 76 ˚F 1.0 to 2.0 ˚F 2.0 to 3.5 ˚F 3.0 to 5.5 ˚F
Precipitation 56 in -5 to 5 % -10 to 5 % -10 to 5 %
Temperature and precipitation changes reflect a 30-year average centered on the specified decade. The baseline for temperature and precipitation is the most complete 30-year data period centered around the 1980s. The baseline value is an average of baseline data from the Miami, Miami Beach, Fort Lauderdale, Palm Beach, and Belle Glade stations. Temperatures are rounded to the nearest half degree, precipitation to the nearest 5%. Data are from NOAA.
Based on 16 GCMs and three emissions, downscaled to ~12 km resolution Shown are the central range (middle 67%) of model-based values
Bias-corrected and spatially downscaled CMIP3 data: http://gdodcp.ucllnl.org/downscaled_cmip3_projections/, Maurer et al (2007). Source: Columbia University Center for Climate Systems Research
8

Mean Annual Changes
9
Combined observed (black line) and projected precipitation. Projected model changes through time are applied to the observed historical data. The three thick lines (green, red, and blue) show the average for each emissions scenario across the 16 GCMs from the BCSD dataset. Shading shows the central range. The bottom and top lines, respectively, show each year’s minimum and maximum projections across the suite of simulations. A ten-year filter has been applied to the observed data and model output. The dotted area between 2005 and 2015 the period that is not covered due to the smoothing procedure. Source: CCSR
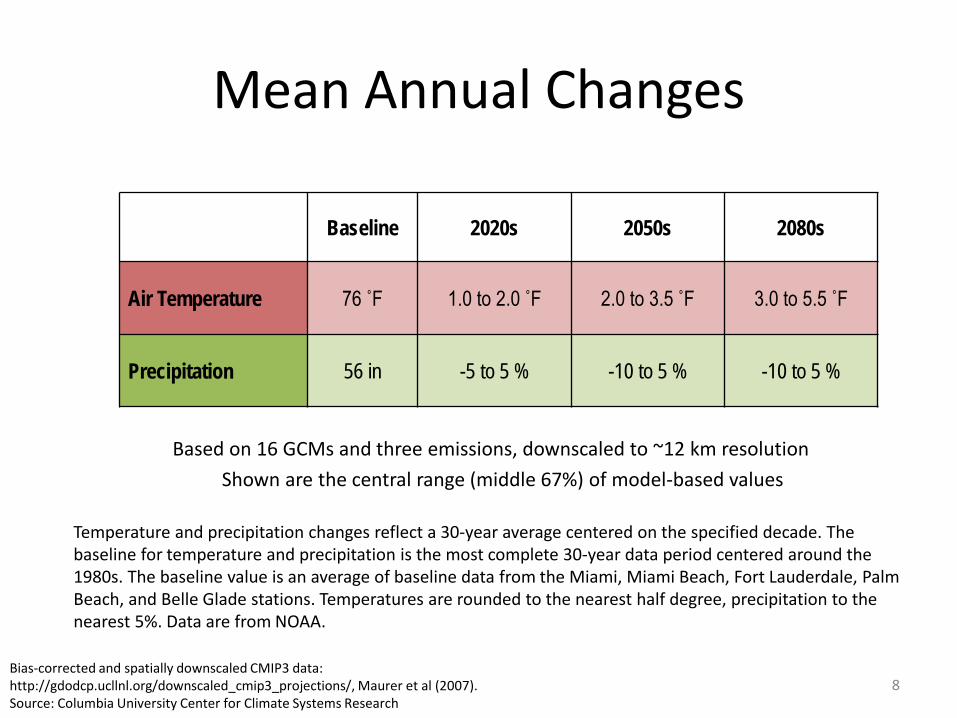
Regional Temperature Projections A2 2080s 16 GCM Annual Temperature
Change (°F), relative to 1970-1999 16 GCM Annual Temperature
1970 – 1999 (°F) 16 A2 GCM Annual Temperature
2070 – 2099 (°F)
10
Annual Temperature (°F) Temperature Change (°F)
Bias-corrected and spatially downscaled CMIP3 data: http://gdodcp.ucllnl.org/downscaled_cmip3_projections/, Maurer et al (2007). Source: Columbia University Center for Climate Systems Research

Regional Precipitation Projections 16 GCM Annual Precipitation
1970 – 1999 (in) A2 2080s 16 GCM Annual Precipitation
Change (%), relative to 1970-1999 16 GCM A2 Annual Precipitation
2070 – 2099 (in)
11
Annual Precipitation (in) Percentage change in precipitation (%)
Bias-corrected and spatially downscaled CMIP3 data: http://gdodcp.ucllnl.org/downscaled_cmip3_projections/, Maurer et al (2007). Source: Columbia University Center for Climate Systems Research

Extreme Events
Daily Temperatures Baseline 2020s 2050s 2080s Max temperature at
or above 90˚F (days/year)
60 84 to 98 107 to 139 130 to 174
Min temperature at or below 45˚F (days/year)
9 6 to 7 4 to 6 3 to 5
Precipitation at or above 1 inch (days/year)
18 17 to 19 16 to 19 15 to 19
The number of days per year exceeding 90°F is projected to rise in the coming century, and the number of days with temperatures below 45°F is projected to decrease. * For Fort Lauderdale, FL
12 Baseline data from NOAA Source: Columbia University Center for Climate Systems Research
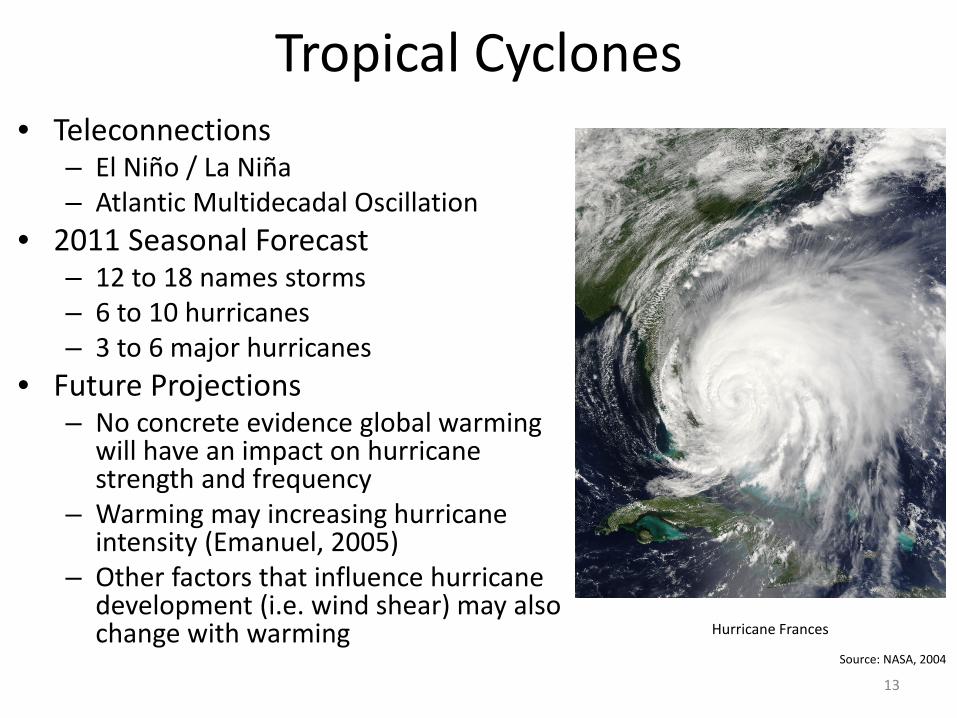
Tropical Cyclones • Teleconnections
– El Niño / La Niña – Atlantic Multidecadal Oscillation
• 2011 Seasonal Forecast – 12 to 18 names storms – 6 to 10 hurricanes – 3 to 6 major hurricanes
• Future Projections – No concrete evidence global warming
will have an impact on hurricane strength and frequency
– Warming may increasing hurricane intensity (Emanuel, 2005)
– Other factors that influence hurricane development (i.e. wind shear) may also change with warming
13
Hurricane Frances
Source: NASA, 2004

Qualitative Extremes Qualitative Changes in Extreme Events During this Century
Event Direction of Change Likelihood
Heat Stress Very Likely
Downpours Likely
Intense storms More likely than not
Drought* More likely than not
Extreme winds More likely than not
Likelihood categories based on IPCC WG1, 2007. Very likely = >90% probability of occurrence Likely =>66% probability of occurrence More likely than not =>50% probability of occurrence *The scenarios presented here can be used to produce quantitative estimates of drought frequency
14
Source: Columbia University Center for Climate Systems Research

Land water storage
Causes of Sea Level Change
Vertical land motions
Mass changes
Thermal expansion
Groundwater mining,impoundment in reservoirs,
runoff, deforestation,seepage into aquifersurban
Subsidence/uplift due toglacial isostatic adjustment,tectonics
Glaciers andice sheets
Ocean water
Local water mass density Temperature, salinity, ocean currents

Sea Level Rise Methods • IPCC-based approach
– Global thermal expansion – Local land subsidence (GIA) – Meltwater from glaciers, ice caps, and ice
sheets – Local water surface elevation
• Rapid ice-melt approach – Based on acceleration of recent rates of
ice melt in the Greenland and West Antarctic ice sheets and paleoclimate studies
– Rationale: • Observed sea level slightly above high end
IPCC projections • Climate models cannot yet fully capture
processes such as: – Surface ponding and basal lubrication of
glaciers – Thinning of ice shelves that buttress land ice – Thinning of ice at grounding lines
16

Sea Level Rise Projections Southeast Florida
Baseline 2020s 2050s 2080s
IPCC-based NA + 2 to 4 in + 6 to 9 in + 10 to 19 in
Rapid ice-melt scenario NA ~ 4 to 6 in ~ 18 to 21 in ~ 39 to 48 in
17
Sea levels are averages for the specified decade. Changes are relative to the 2000 to 2004 base period. The central range (middle 67% of values from model-base probabilities) across the 7 GCMs and 3 GHG emissions scenarios is shown; sea level rise rounded to the nearest inch. “Rapid ice melt scenario” is based on acceleration of recent rates of ice melt in the Greenland and West Antarctic ice sheets and paleoclimate studies. The scenario assumes a 1 meter rise in sea level due to ice melt alone.
Source: Columbia University Center for Climate Systems Research

Sea Level Rise Projections
18
Combined observed (black line) and projected sea level rise for two future sea level rise scenarios. Projected model changes through time are applied to the observed historical data. The darker shaded blue shows the full range of projections for the rapid ice-melt scenario while the lighter shade of blue shows the full range of projections for the GCM-based sea level rise approach. The three thick lines (green, red, and blue) within each sea level rise scenario show the average for each emissions scenario across the 7 GCMs A ten-year filter has been applied to the observed data and modeled output. The dotted area between 2004 and 2015 the period that is not covered due to the smoothing procedure. Source: CCSR

Sea Level Rise Comparison
19

Sea Level Rise Comparison
20
Year
Relative Sea Level Rise, inches
Historic Modified
NRC Curve I Modified
NRC Curve II
IPCC-based
Rapid ice-melt
2010 0 0 0 Up to 4 Up to 4
2030 2 3 7 1 to 6 5 to 10
2060 4 9 24 4 to 13 19 to 28
2100 8 19 57 10 to 29 49 to 70
2110 9 23 67 NA NA