Embed Size (px)
Citation preview
Current and future role of instrumentation and monitoring in theperformance of transport infrastructure slopes
J. A. Smethurst1*, A. Smith2, S. Uhlemann3, C. Wooff4, J. Chambers3, P. Hughes5,S. Lenart6, H. Saroglou7, S. M. Springman8, H. Löfroth9 & D. Hughes101 Faculty of Engineering and the Environment, University of Southampton, Southampton SO17 1BJ, UK2 School of Civil and Building Engineering, Loughborough University, Loughborough LE11 3TU, UK3 British Geological Survey, Environmental Science Centre, Keyworth, Nottingham NG12 5GG, UK4 London North Eastern (LNE), Network Rail, Floor 3, George Stephenson House, Toft Green, York YO1 6HP, UK5 School of Engineering and Computer Sciences, Durham University, Durham, UK6 Slovenian National Building and Civil Engineering Institute (ZAG), Dimic eva ulica 12, Si-1000 Ljubljana, Slovenia7 School of Civil Engineering, National Technical University of Athens, 9, Iroon Polytechniou Street, 157 80 Zografou,
Athens, Greece8 Institute for Geotechnical Engineering, ETH Zurich, Rämistrasse 101, 8092 Zurich, Switzerland9 Swedish Geotechnical Institute, SE-581 93 Linköping, Sweden10 School of Planning, Architecture and Civil Engineering, Queens University Belfast, David Keir Building, 39 Stranmillis
Road, Belfast BT9 5AG, UKS.U., 0000-0002-7673-7346; H.S., 0000-0002-5253-7972
*Correspondence: [email protected]
Abstract: Instrumentation is often used to monitor the performance of engineered infrastructure slopes. This paper looks at thecurrent role of instrumentation and monitoring, including the reasons for monitoring infrastructure slopes, the instrumentationtypically installed and parameters measured. The paper then investigates recent developments in technology and considers howthese may change the way that monitoring is used in the future, and tries to summarize the barriers and challenges to greater useof instrumentation in slope engineering. The challenges relate to economics of instrumentation within a wider risk managementsystem, a better understanding of the way in which slopes perform and/or lose performance, and the complexities of managingand making decisions from greater quantities of data.
Received 23 August 2016; accepted 4 May 2017
Linear earthwork assets in the form of cuttings and embankmentsare a major component of modern transport systems, and theirperformance is critical to ensuring transport operations are safe andreliable. Earthwork slope failures pose significant hazard: failures inembankments may undermine roads and railways, slips in cuttingsmay cause material to obstruct transport routes, posing risks todrivers and causing derailment of trains (e.g. Table 1), and there arenumerous locations where road and rail routes span large, and oftenslow-moving, landslides. Across Europe, field monitoring is widelyused to help understand mechanisms of movement and deterior-ation, assess condition and risk, and provide design parameters forrepair of slopes.
Geotechnical monitoring is usually applied only to earthworks ornatural slopes that are causing or showing specific problems, oftenin the form of excessive displacements. A common approach is todrill boreholes and install instrumentation to measure soildisplacement and groundwater levels; these may be used inassessment of potential risk or early warning (if movementsaccelerate), or in analysis of stability or design of remedialmeasures. Accessing steeply sloping ground to drill boreholes forinstrumentation can be costly, and monitoring of this type can beapplied only to slopes causing significant hazard.
Regular assessment can identify slopes that may be at risk offailure: this is often carried out by visual inspection (looking forsigns of movement), combined with information on the slope angle,and the nature of ground and potential groundwater conditions.There are limitations to such assessments: vegetation can oftenobscure signs of ground movement; slopes may not always show
signs of distress and instead fail in a brittle and rapid manner; theexact nature of ground and groundwater conditions is oftenestimated. Visual inspections may have limited usefulness inpredicting the onset of instability, as they provide little or noinformation on subsurface processes that are a precursor to slopefailure. Slopes that are not necessarily known to be a hazard can failunexpectedly, presenting problems for the safe operation of transportsystems. As a result, there is growing interest from asset owners inmore pervasive approaches that would allow more widespreadcondition monitoring of geotechnical assets. Such approaches rarelyinvolve drilling boreholes as this would be too costly to apply to longlengths of asset; instead, many apply monitoring of surfacedisplacements or strain, soil water content or climate. A networkof sensors can also be linked by wireless connections, with datauploaded to the internet. Geophysical monitoring (e.g. by means ofelectrical resistivity tomography (ERT) and seismic methods),remote sensing using satellites, or ground-based radar or lightdistance and ranging (LiDAR) all provide alternative pervasiveapproaches. However, many such systems are relatively untried formonitoring of engineered slopes, and it is not completely clear howmonitored parameters such as surface displacements or soil moisturecontent should be used in indication of increased risk or incipientfailure; there is often insufficient knowledge about slope processes tolink physical parameters with risk of failure.
Where problem slopes are large, or are in very challenging terrain,continual monitoring and assessment may be applied instead ofremedial measures, which may simply be impractical owing toexcessive size or cost. Monitoring can be used to gauge the
© 2017 Swedish Geotechnical Institute. This is an Open Access article distributed under the terms of the Creative Commons Attribution License (http://creativecommons.org/licenses/by/3.0/). Published by The Geological Society of London. Publishing disclaimer: www.geolsoc.org.uk/pub_ethics
Thematic set:COST Action TU1202 – Impact of climate changeon engineered slopes for infrastructure Quarterly Journal of Engineering Geology and Hydrogeology
Published online July 27, 2017 https://doi.org/10.1144/qjegh2016-080 | Vol. 50 | 2017 | pp. 271–286
by guest on April 6, 2020http://qjegh.lyellcollection.org/Downloaded from
likelihood of incipient failure and provide early warning. In suchcircumstances, monitoring needs to be continuous, reliable andreported in near ‘real time’, with clear criteria to suit the level ofexpertise needed to make a judgement (Stähli et al. 2014). Assetowners commonly differentiate their monitoring systems dependingon function, so that a safety critical system would be defined as an‘alarm’ system and would have additional stipulations on its set-upand use compared with a conventional ‘monitoring’ system. Forlarge time-series datasets, for which manual interrogation isimpractical, automated systems may process and analyse data todetermine when critical predefined thresholds have been exceeded(e.g. Smith et al. 2014b). The reliability of an instrumentationsystem is dependent on continued operation of instruments oftenplaced in challenging environmental conditions, and the setting ofsuitable thresholds. False alarms can be costly in terms of money,confidence and reputation if they unnecessarily halt rail and roadtraffic.
Instrumentation may also be used for research or to provide longrecords of how slopes may progressively deteriorate with time, orhow long periods of climate may influence pore pressures andmovements (e.g. Smethurst et al. 2012; Springman et al. 2012).This information obtained from instrumentation may be vital inunderstanding deterioration and modes of failure (of which theremay be many); this information can feed back into improvedconceptual and numerical models that seek to identify assets thatmay be at risk. In some geologies and environments, deteriorationmechanisms are complex, and there is considerable progress still tobe made in working out how to monitor these and incorporate themin models (Dijkstra & Dixon 2010; Springman et al. 2012; Briggset al. 2017).
Climate change presents an increased risk to slopes. Researchstarting to investigate the impact that climate change may have ontransport slopes indicates that more extreme periods of climate,coupled with ageing assets, may cause a higher rate of failures.Climate changes that pose a threat to engineered slopes includemoreextreme rainfall events (both heavy showers and long periods ofrain), drought and increased freeze–thaw cycles (Springman et al.2009; Clarke & Smethurst 2010; Bles et al. 2015). A greater use ofinstrumentation may help to manage the risk that climate changeposes to transport systems.
There is evidence that proactive management of slopes can bemuch more cost effective than reactive repairs following failure(Glendinning et al. 2009). Instrumentation and monitoring canform an important component of a long-term earthworks assetmanagement strategy. Asset owners are often required by regulatorybodies to show continual improvement in asset management andsafety; this has included investing in greater use of monitoring tocontrol and manage risk. Thus the opportunities to use and developtechniques for condition monitoring are now very favourable.
In summary, there are several uses for instrumentation andmonitoring in geotechnical asset management; and a plethora ofchallenges. This state-of-the-art review seeks to consider existingconventional approaches to instrumentation for slopes (what tomonitor for a range of applications), to look at new instrumentation
and technology that may seek to change monitoring approaches forslopes (with examples of several systems under development ortrial), and to seek to ‘futuregaze’ at the next set of challenges thatnew technology will pose, and suggest how instrumentation shouldbe developed in the future.
Applications for monitoring
A number of applications for instrumentation and monitoring ofinfrastructure slopes have been considered in the introduction, andthese will be described in further detail here. These may besummarized as: (1) monitoring the condition of slopes (which mayinclude earthworks that are subject to significant changes in loadingor profile, and verifying the performance of remedial measures); (2)obtaining parameters for use in design of remedial schemes (incombination with a model); (3) early warning systems to providealarm or indication of incipient failure; (4) monitoring slopes tomanage risk at the infrastructure corridor scale; (5) monitoringslopes to understand mechanisms of degradation and response totrigger events, to provide better conceptual models of slopeperformance; (6) development and testing of new instrumentation.This list may not be exhaustive, but many monitoring needs shouldfall within one of these categories.
All applications for monitoring should have an overarching aimof assisting asset management, which may be defined as ‘co-ordinated activities and practices through which an organizationoptimally and sustainably manages its assets and asset systems, theirassociated performance, risks and expenditure over their life cyclesfor the purpose of achieving its organisational strategic plan’(Hooper et al. 2009). However, each of the applications listed abovemay address different parts of an asset management strategy, andthus have a differing specific aim for which the type ofinstrumentation, reading intervals and duration, volume andprocessing of data, and analysis and decision-making process mayall be very different (Dunnicliff 1993). Table 2 provides furtherconsideration of these common applications. It should be noted thatTable 2 may not cover all applications, and there are also other waysof categorizingmonitoring approaches and systems (e.g. see Hooperet al. 2009).
Members of the COSTAction have provided details for a numberof key example case histories, for which extensive monitoringdatasets are available, covering a range of the applications above.Some are referenced in the ‘example case histories’ column ofTable 2, and full details of the sites, including owners of thedatasets, are given on the Action website www.bgs.ac.uk/cost1202/(where they are labelled ‘WG2 completed proformas’).
What to monitor
An instrumentation and monitoring scheme should be designed andset up to achieve specific aims (Dunnicliff 1993; Chapman et al.2012); six applications with different aims have been considered inthe previous section. The intended aims of the scheme shoulddictate the monitoring objectives, which lead to detailed design ofinstrumentation type, number of instruments, method of installation,data collection approach and reading interval, and how the data arestored, analysed and interpreted. The design of a monitoring schemeshould be guided by previous site investigation information, and insome cases a detailed ground model (Fookes 1997) and thepredicted hazard.
This paper does not intend to be an exhaustive guide to allavailable types of instrumentation; however, suggestions for theparameters that could be monitored for each of the applications ofmonitoring are given in Table 2. These are only indicative, and mayvary considerably for the wide range of possible sites and geologythat could fall into each category.
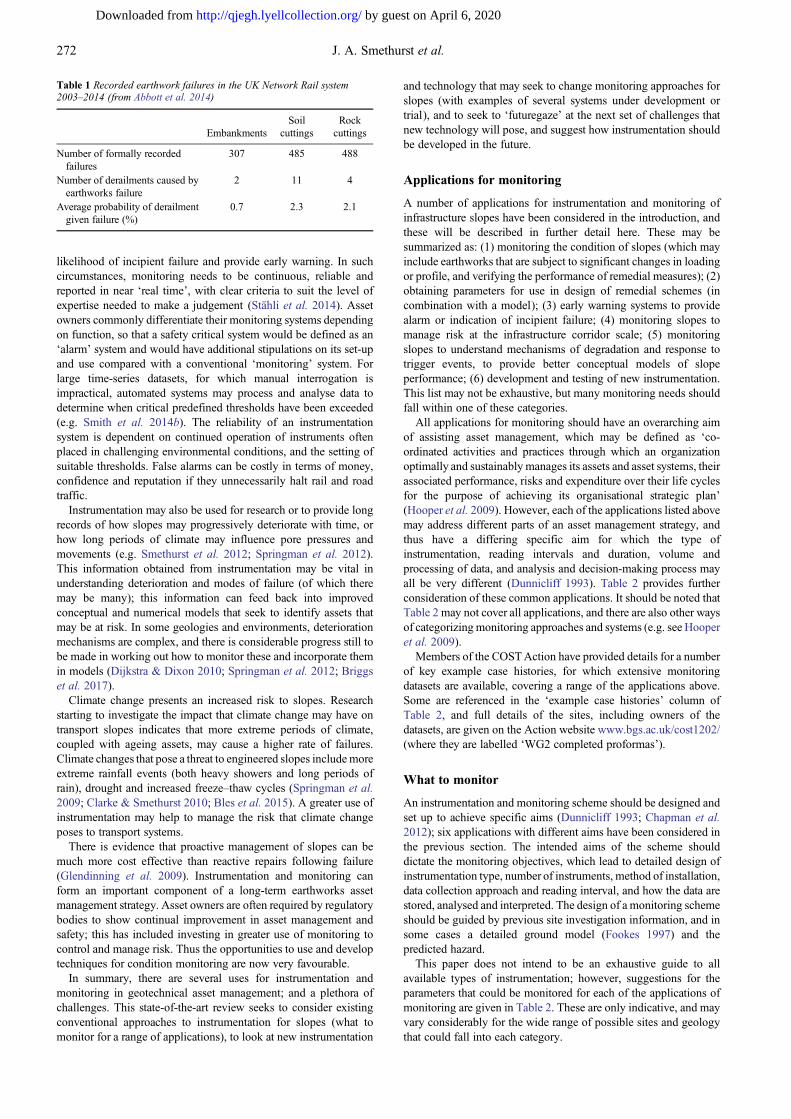
Table 1 Recorded earthwork failures in the UK Network Rail system2003–2014 (from Abbott et al. 2014)
EmbankmentsSoil
cuttingsRock
cuttings
Number of formally recordedfailures
307 485 488
Number of derailments caused byearthworks failure
2 11 4
Average probability of derailmentgiven failure (%)
0.7 2.3 2.1
272 J. A. Smethurst et al.
by guest on April 6, 2020http://qjegh.lyellcollection.org/Downloaded from
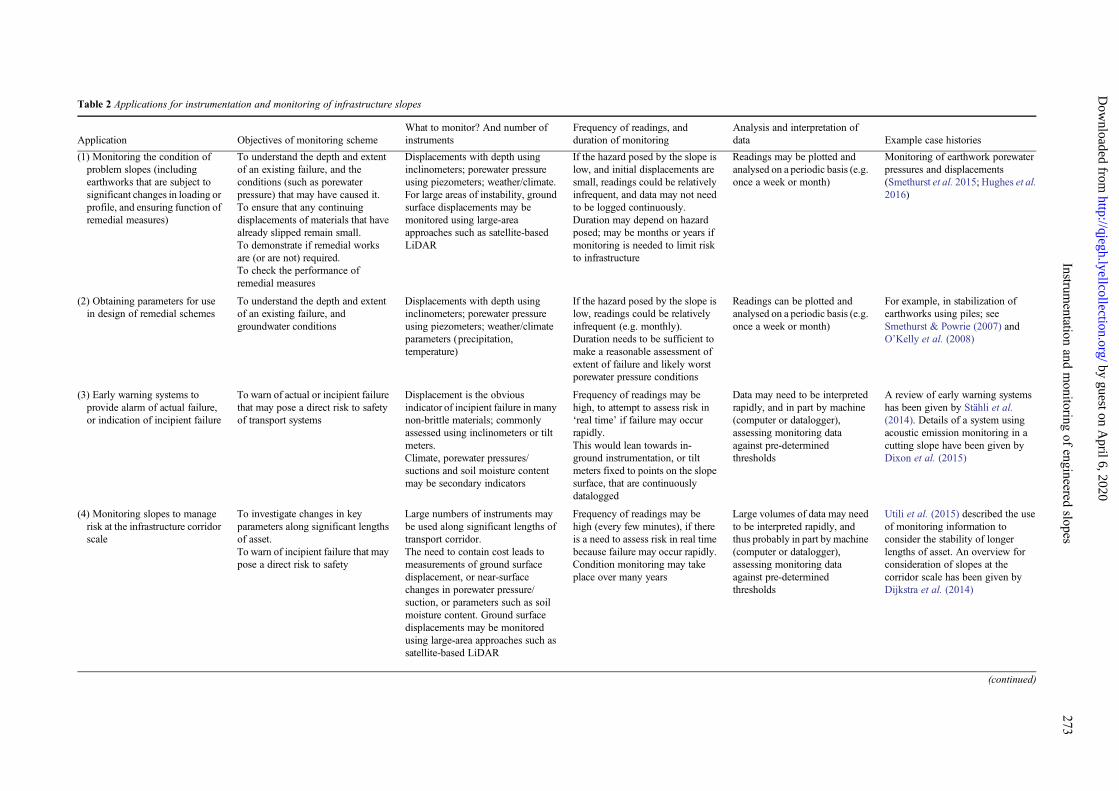
Table 2 Applications for instrumentation and monitoring of infrastructure slopes
Application Objectives of monitoring schemeWhat to monitor? And number ofinstruments
Frequency of readings, andduration of monitoring
Analysis and interpretation ofdata Example case histories
(1) Monitoring the condition ofproblem slopes (includingearthworks that are subject tosignificant changes in loading orprofile, and ensuring function ofremedial measures)
To understand the depth and extentof an existing failure, and theconditions (such as porewaterpressure) that may have caused it.To ensure that any continuingdisplacements of materials that havealready slipped remain small.To demonstrate if remedial worksare (or are not) required.To check the performance ofremedial measures
Displacements with depth usinginclinometers; porewater pressureusing piezometers; weather/climate.For large areas of instability, groundsurface displacements may bemonitored using large-areaapproaches such as satellite-basedLiDAR
If the hazard posed by the slope islow, and initial displacements aresmall, readings could be relativelyinfrequent, and data may not needto be logged continuously.Duration may depend on hazardposed; may be months or years ifmonitoring is needed to limit riskto infrastructure
Readings may be plotted andanalysed on a periodic basis (e.g.once a week or month)
Monitoring of earthwork porewaterpressures and displacements(Smethurst et al. 2015; Hughes et al.2016)
(2) Obtaining parameters for usein design of remedial schemes
To understand the depth and extentof an existing failure, andgroundwater conditions
Displacements with depth usinginclinometers; porewater pressureusing piezometers; weather/climateparameters (precipitation,temperature)
If the hazard posed by the slope islow, readings could be relativelyinfrequent (e.g. monthly).Duration needs to be sufficient tomake a reasonable assessment ofextent of failure and likely worstporewater pressure conditions
Readings can be plotted andanalysed on a periodic basis (e.g.once a week or month)
For example, in stabilization ofearthworks using piles; seeSmethurst & Powrie (2007) andO’Kelly et al. (2008)
(3) Early warning systems toprovide alarm of actual failure,or indication of incipient failure
To warn of actual or incipient failurethat may pose a direct risk to safetyof transport systems
Displacement is the obviousindicator of incipient failure in manynon-brittle materials; commonlyassessed using inclinometers or tiltmeters.Climate, porewater pressures/suctions and soil moisture contentmay be secondary indicators
Frequency of readings may behigh, to attempt to assess risk in‘real time’ if failure may occurrapidly.This would lean towards in-ground instrumentation, or tiltmeters fixed to points on the slopesurface, that are continuouslydatalogged
Data may need to be interpretedrapidly, and in part by machine(computer or datalogger),assessing monitoring dataagainst pre-determinedthresholds
A review of early warning systemshas been given by Stähli et al.(2014). Details of a system usingacoustic emission monitoring in acutting slope have been given byDixon et al. (2015)
(4) Monitoring slopes to managerisk at the infrastructure corridorscale
To investigate changes in keyparameters along significant lengthsof asset.To warn of incipient failure that maypose a direct risk to safety
Large numbers of instruments maybe used along significant lengths oftransport corridor.The need to contain cost leads tomeasurements of ground surfacedisplacement, or near-surfacechanges in porewater pressure/suction, or parameters such as soilmoisture content. Ground surfacedisplacements may be monitoredusing large-area approaches such assatellite-based LiDAR
Frequency of readings may behigh (every few minutes), if thereis a need to assess risk in real timebecause failure may occur rapidly.Condition monitoring may takeplace over many years
Large volumes of data may needto be interpreted rapidly, andthus probably in part by machine(computer or datalogger),assessing monitoring dataagainst pre-determinedthresholds
Utili et al. (2015) described the useof monitoring information toconsider the stability of longerlengths of asset. An overview forconsideration of slopes at thecorridor scale has been given byDijkstra et al. (2014)
(continued)
273Instrum
entationand
monitoring
ofengineered
slopes
by guest on April 6, 2020
http://qjegh.lyellcollection.org/D
ownloaded from
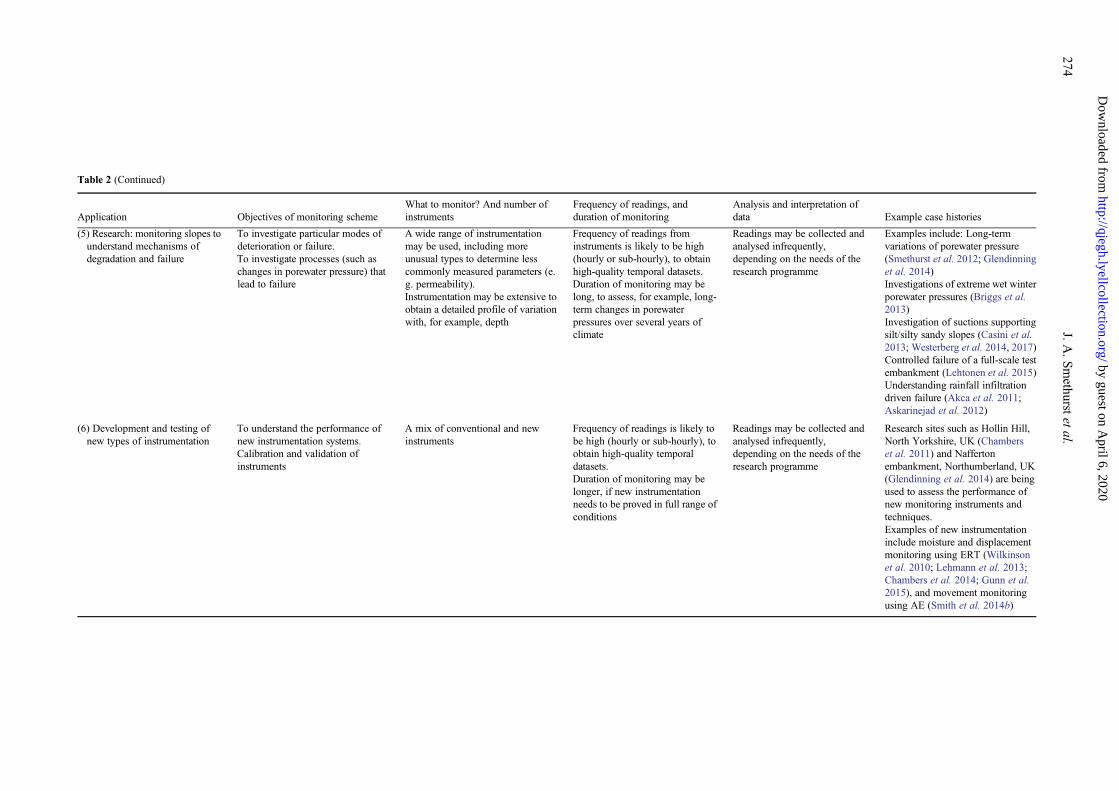
Table 2 (Continued)
Application Objectives of monitoring schemeWhat to monitor? And number ofinstruments
Frequency of readings, andduration of monitoring
Analysis and interpretation ofdata Example case histories
(5) Research: monitoring slopes tounderstand mechanisms ofdegradation and failure
To investigate particular modes ofdeterioration or failure.To investigate processes (such aschanges in porewater pressure) thatlead to failure
A wide range of instrumentationmay be used, including moreunusual types to determine lesscommonly measured parameters (e.g. permeability).Instrumentation may be extensive toobtain a detailed profile of variationwith, for example, depth
Frequency of readings frominstruments is likely to be high(hourly or sub-hourly), to obtainhigh-quality temporal datasets.Duration of monitoring may belong, to assess, for example, long-term changes in porewaterpressures over several years ofclimate
Readings may be collected andanalysed infrequently,depending on the needs of theresearch programme
Examples include: Long-termvariations of porewater pressure(Smethurst et al. 2012; Glendinninget al. 2014)Investigations of extreme wet winterporewater pressures (Briggs et al.2013)Investigation of suctions supportingsilt/silty sandy slopes (Casini et al.2013; Westerberg et al. 2014, 2017)Controlled failure of a full-scale testembankment (Lehtonen et al. 2015)Understanding rainfall infiltrationdriven failure (Akca et al. 2011;Askarinejad et al. 2012)
(6) Development and testing ofnew types of instrumentation
To understand the performance ofnew instrumentation systems.Calibration and validation ofinstruments
A mix of conventional and newinstruments
Frequency of readings is likely tobe high (hourly or sub-hourly), toobtain high-quality temporaldatasets.Duration of monitoring may belonger, if new instrumentationneeds to be proved in full range ofconditions
Readings may be collected andanalysed infrequently,depending on the needs of theresearch programme
Research sites such as Hollin Hill,North Yorkshire, UK (Chamberset al. 2011) and Naffertonembankment, Northumberland, UK(Glendinning et al. 2014) are beingused to assess the performance ofnew monitoring instruments andtechniques.Examples of new instrumentationinclude moisture and displacementmonitoring using ERT (Wilkinsonet al. 2010; Lehmann et al. 2013;Chambers et al. 2014; Gunn et al.2015), and movement monitoringusing AE (Smith et al. 2014b)
274J.A
.Smethurst
etal.
by guest on April 6, 2020
http://qjegh.lyellcollection.org/D
ownloaded from
The commonly measured parameters are as follows.
(1) Ground displacements. These are commonly measuredusing inclinometers, extensometers, tilt meters and crackmeters (measuring lateral, vertical, rotational andextensional movements respectively). There are also manyapproaches to measurement of surface displacement, suchas using photogrammetry, radar interferometry and LiDAR.Displacement or strain tends to be fairly easy to measure,and in-ground instruments in particular can do so withconsiderable precision, if installed and read carefully.Measurements can show if ground displacements aretaking place, to what depth movements occur, and themagnitude of displacements. It is notable that slope stabilityis controlled by stress (the strength of soil and rockmaterials, as input into a stability analysis), but stresses inthe ground are difficult to measure and may be dependent onthe stress history of the soil, which is often unknown. Strains(or displacements) are measured instead. However, to gainunderstanding of the failure mechanism from thesemeasurements there is generally a need to understand thestiffness and deformation behaviour of the soils concerned.Trying to judge incipient failure using displacements in verystiff (or very soft, in the case of some glaciomarine clays)brittle materials, may be difficult.
(2) Ground water pressures. Increased strain or complete failurein many slopes is caused by changes in effective stress, inturn caused by increases in porewater pressure. Thusporewater pressures are commonly monitored, using arange of differing types of piezometer. In partiallysaturated slopes, stability may be aided by porewatersuctions, and instruments that can measure suction or lossof suctions may be important (see Ridley et al. 2003;Springman et al. 2012).
(3) Climate or weather. Rainfall is commonly monitored, as thishas a direct influence on saturation of the ground and soilporewater pressures. Depending on the nature of the ground,periods of prolonged heavy rainfall, over hours, days ormonths, will cause porewater pressures to rise, possiblytriggering failure. Longer term records of rainfall, oftencombined with evaporation or evapotranspiration to giveeffective rainfall, can be used as an indication of increasedperiods of risk of slope instability (Clarke & Smethurst2010). Very short high-intensity rainfall events can triggerslope failure, and are also often of interest. Temperature, andin colder climates ground temperature, is also important; forexample, thawing of frozen ground can lead to increasedwater pressures, which may destabilize slopes.
There are a wide selection of monitoring approaches available forslopes, including different modes of sensor deployment (exploredfurther in the next section), the measurement of parameters notlisted above, and use of techniques that are less well establishedand/or are still in development. The selection of instrumentation tomeet the specific objectives of a monitoring scheme usuallyconsiders the accuracy, precision, sensitivity, reliability and spatialand temporal resolution of different techniques (Dixon et al. 2015).Detailed descriptions of well-established geotechnical instrumen-tation approaches have been given by Dunnicliff (1993), and arealso categorized in the recent European geotechnical monitoringstandard (BS EN ISO 18674-1:2015, BSI 2015). Novel monitoringapproaches will be considered later in this review.
Comments on the frequency of readings, and interpretation ofresulting data, for the six categories of monitoring application aregiven in Table 2. Some of the applications that require large
quantities of data to be analysed rapidly remain challenging, andsome of the issues surrounding these will also be discussed below.
How to monitor
Monitoring can be carried out using a wide range of modes ofsensor deployment; for example, from repeated manual measure-ments within a borehole for determining changes at a site scale, tosatellite-based sensors for monitoring ground surface displace-ments at a regional scale. Key distinctions include the following:(1) ground-based v. remotely located sensors (airborne or satellite);(2) static v. dynamic (moving) sensors; (3) surface v. subsurfaceinformation; (4) point sensors v. spatial or volumetric monitoringtechnologies; (5) permanently deployed sensors v. manuallyrepeated measurements with temporary sensors; (6) telemetricv. manual data retrieval. The mode of deployment has majorimplications for coverage, spatial and temporal resolution, and thecost of monitoring.
Remote sensing techniques using airborne and satellite-basedsensors can provide a very cost-effective means of acquiring high-resolution information for the ground surface over very large areas(Hardy et al. 2012; Miller et al. 2012; Castagnetti et al. 2013;Cigna et al. 2015; Wasowski et al. 2014; Hugenholtz et al. 2015),but are generally limited in terms of temporal resolution (which isbased on satellite orbits or flight schedules) and provide onlysurface or very near-surface information. For smaller infrastructureslopes (v. large landslides) spatial resolution may also beinsufficient, and remote sensing techniques can also be impededby the dense vegetation cover present on some infrastructureslopes (e.g. Miller et al. 2008).
Dynamic ground-based sensing systems, such as terrestrialLiDAR (Lato et al. 2009, 2012; Marjanovic et al. 2013; Fan et al.2014), radar inferferometry (Springman et al. 2012; Caduff et al.2014), ground penetrating radar (GPR; Donohue et al. 2011, 2013;Silvast et al. 2013) and capacitive resistivity imaging (CRI; Kuraset al. 2007) can obtain greater spatial and subsurface information,but are limited in terms of temporal resolution by the need formanual data collection, and therefore can be expensive whenfrequent (i.e. high temporal resolution) monitoring is required.
Point sensors can give very good resolution and accuracy, but areinherently limited in coverage (i.e. they measure only within theimmediate vicinity of the sensor), but spatial imaging techniques,such as electrical resistivity, seismic methods and groundpenetrating radar (Donohue et al. 2011; Loke et al. 2013) cancomplement point information and help with interpretation inground or groundwater conditions that are heterogeneous. Wirelesssensor networks (Gong et al. 2013) and fibre-optic approaches (Zhuet al. 2015) have been developed that can also provide informationat increasing spatial scale. Permanently deployed point sensorscoupled with low-power electronics and data telemetry can achievevery high temporal resolution and near-real-time informationdelivery (Smethurst et al. 2006; Chambers et al. 2014). Systemsthat operate remotely and automatically and interface with a widerange of permanently deployed sensor types are becomingincreasingly well developed (Intrieri et al. 2012).
New instruments and innovation
New forms of instrumentation and the increasing ability ofcomputing and the internet to distribute, manage and processlarge amounts of data provide exciting opportunities, as well aschallenges, for slope monitoring. This section looks at a number ofdeveloping monitoring technologies, their maturity (whether theyare at early phases of development, or becoming increasinglyestablished; e.g. with numerous field trials) and the changes thatthey will or may provide in monitoring of infrastructure slopes for a
275Instrumentation and monitoring of engineered slopes
by guest on April 6, 2020http://qjegh.lyellcollection.org/Downloaded from
wide range of purposes. It also considers potential effects that moresophisticated monitoring systems may have on management of data,decision making and communication.
New measurement technologies
A range of new monitoring technologies are being used ordeveloped for monitoring of slope stability, and a number ofthese, with their abilities, limitations and maturity, are described inTable 3. It should be noted that Table 3 is not exhaustive, as turningto landslide monitoring gives other novel approaches, such as usingextensometers running parallel to the slope surface (Wang et al.2008). The constraints on space also mean that it is not possible toinclude all advantages or limitations, particularly those relating tovery specific applications.
The novel forms of instrumentation in Table 3 seek to provide arange of improvements over conventional techniques, including thefollowing.
(1) Higher resolution data, both in time and space.(2) Lower costs, including the cost of both the instrumentation
and installation, particularly the need to drill fewer orsmaller boreholes, or, in the case of some remote sensingapproaches, drill no holes at all. Cost can be a major driverin instrument and technique selection.
(3) Automated monitoring: systems that collect and transmitdata, and in some cases automatically process and compareit with thresholds to provide an alarm (e.g. of increasingdisplacements). Automated systems also reduce the need formanual measurements and the need to put personnel inpotentially hazardous environments.
(4) Greater lifespan for instrumentation. For example, localizedshear surface displacements of about 50 – 100 mm canrender inclinometer casings unusable; in contrast, shearsurface displacements in excess of hundreds of millimetreshave been recorded using shape acceleration array (SAA)systems (Buchli et al. 2013; Dasenbrock 2014) and activewaveguide acoustic emission (AE) monitoring systems(Smith et al. 2014a).
Several of the techniques in Table 3 are reaching maturity, and arestarting to be commonly adopted for geotechnical and structuralmonitoring (e.g. the shape array), whereas others are still in theearlier stages of development. Some are well-established monitor-ing techniques, but their use for infrastructure slopes has beenlimited (e.g. optical fibres), and they still require application-specific development, with careful trials before wider application tothe transport network.
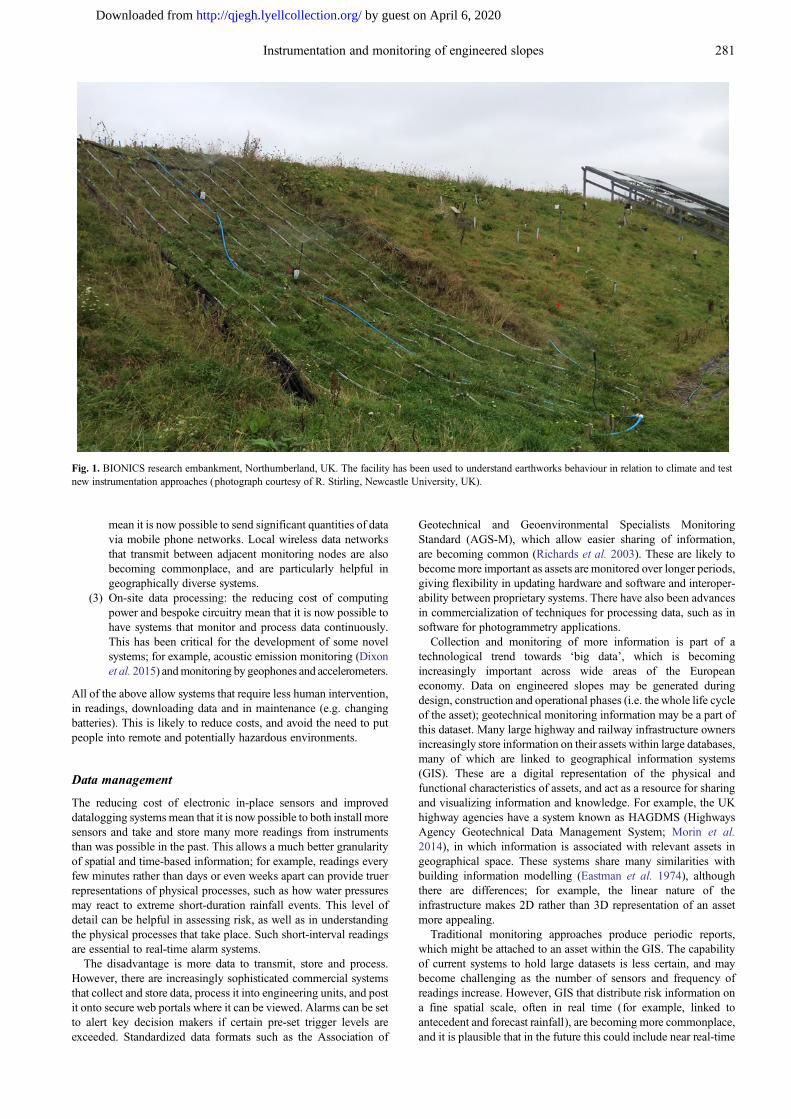
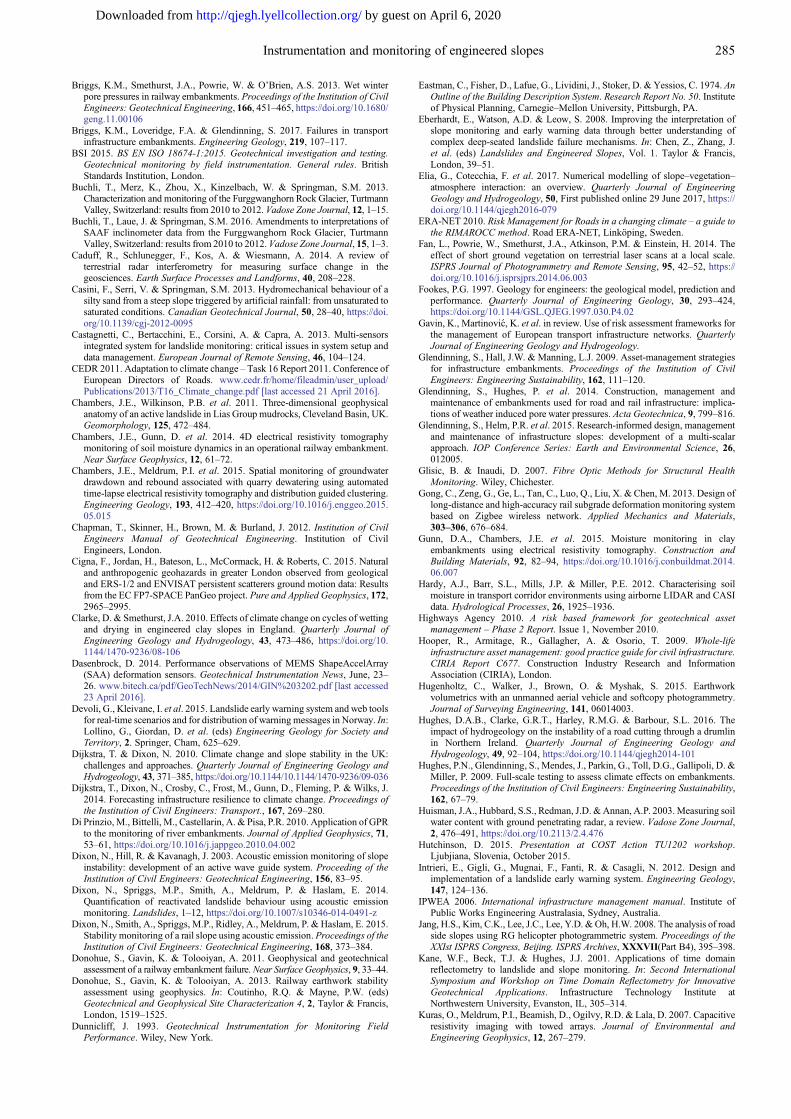
Several of the relatively new techniques are being activelydeveloped by members of COST TU1202: the British GeologicalSurvey has been developing ERT for earthworks moisturemonitoring (e.g. Chambers et al. 2014; Gunn et al. 2015), andLoughborough University, UK, has been developing and is nowstarting to commercialize an acoustic system for monitoring slopedisplacement rates (called ALARMS; Dixon et al. 2014; Smithet al. 2014a, 2017). Both of these systems show considerablepromise: ERT as a means of imaging moisture changes inearthworks, and ALARMS as a low-cost warning system forslope movement. Both have been installed in an embankmentresearch facility at Nafferton, Northumberland, UK, to test theirabilities against conventional instrumentation (Fig. 1; for furtherdetails, see Hughes et al. 2009; Glendinning et al. 2014); suchfacilities are valuable for testing new approaches in a controlledenvironment.
Table 3 identifies three techniques that have been little used so farfor monitoring infrastructure slopes and that all show some promise,particularly as more pervasive approaches for condition monitoring
of long lengths of asset at relatively low cost. These are thefollowing.
(1) Optical fibres used to measure surface strain in slopes(rather than in a borehole). As the monitored fibre can belong, the technique is potentially suited to monitoringsignificant lengths of asset. Fibres could be buriedlongitudinally, e.g. a short distance below the crest of aslope. The limitations and challenges are the relatively highcost of the equipment needed to read the strain in the fibre(although this is reducing in price), the need to correct fortemperature effects, and the uncertainty as to how the fibrewill deform in response to slope movements. Time domainreflectometery (TDR) does not measure strain, but canidentify the location where distortion takes place within acoaxial cable, and thus may be able to perform a similarrole, potentially at lower cost.
(2) Remote sensing technologies such as LiDAR, andphotogrammetry, using data from satellites, aerial vehiclesor terrestrial systems. Both techniques are becomingcommon for terrain mapping and monitoring surfacechange for large landslides and rock slopes. The methodscould be used to measure surface deformation ofinfrastructure slopes, but challenges include developing asuitable monitoring platform (rail or road vehicles, or anaerial approach), a system for handing large quantities of data(point cloud data fromLiDAR; images for photogrammetry),and the resolution and accuracy of surface change detectionincluding in the presence of vegetation.
(3) Wireless sensor systems, with wirelessly networked probessuch as tiltmeters and moisture content probes used acrossor along an asset. These are already being developed forslope monitoring applications, particularly to provide alarmof slope movements (Network Rail 2015). If a record ofmeasurements is required for condition monitoring,transmission of large quantities of data has significantpower demands, and there is still some uncertainty as to howsurface or near-surface point measurements can be used toindicate deterioration or incipient failure of a slope.
All of the above require further investigation and then potentiallydevelopment and testing for use with infrastructure slopes. Indevelopment of new approaches, collaboration between assetowners, instrumentation contractors and research institutions isimportant to ensure any new methods align to practical monitoringand asset management needs.
Datalogging and transmission
Not included explicitly in Table 3 are recent advances indatalogging and transmitting technologies, which may be summar-ized as follows.
(1) Use of less power: commercial datalogging systems canoperate with low power consumption, particularly tomonitor instruments and store data, such that it is possibleto run small dataloggers for many months or even yearsfrom a single small battery cell. Transmission of datawirelessly has a greater power need, and batteries then needcharging systems such as fuel cells or photovoltaic panels,although approaches to careful use of power, such as turningon only once every hour to transmit data, can be adopted.Energy harvesting from vibration is also used, for which anumber of commercial systems are available (e.g.Perpetuum 2016).
(2) Ability to transmit greater quantities of data at speed: newthird and fourth generations of mobile data technology
276 J. A. Smethurst et al.
by guest on April 6, 2020http://qjegh.lyellcollection.org/Downloaded from
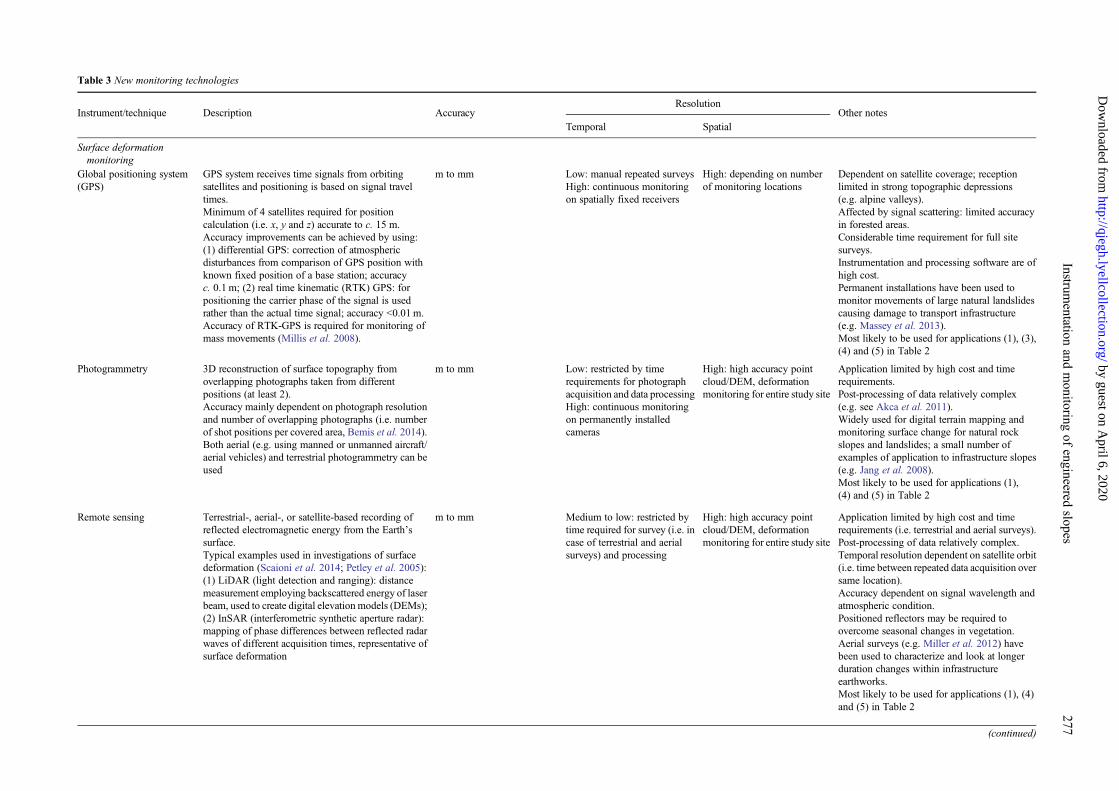
Table 3 New monitoring technologies
Instrument/technique Description AccuracyResolution
Other notesTemporal Spatial
Surface deformationmonitoring
Global positioning system(GPS)
GPS system receives time signals from orbitingsatellites and positioning is based on signal traveltimes.Minimum of 4 satellites required for positioncalculation (i.e. x, y and z) accurate to c. 15 m.Accuracy improvements can be achieved by using:(1) differential GPS: correction of atmosphericdisturbances from comparison of GPS position withknown fixed position of a base station; accuracyc. 0.1 m; (2) real time kinematic (RTK) GPS: forpositioning the carrier phase of the signal is usedrather than the actual time signal; accuracy <0.01 m.Accuracy of RTK-GPS is required for monitoring ofmass movements (Millis et al. 2008).
m to mm Low: manual repeated surveysHigh: continuous monitoringon spatially fixed receivers
High: depending on numberof monitoring locations
Dependent on satellite coverage; receptionlimited in strong topographic depressions(e.g. alpine valleys).Affected by signal scattering: limited accuracyin forested areas.Considerable time requirement for full sitesurveys.Instrumentation and processing software are ofhigh cost.Permanent installations have been used tomonitor movements of large natural landslidescausing damage to transport infrastructure(e.g. Massey et al. 2013).Most likely to be used for applications (1), (3),(4) and (5) in Table 2
Photogrammetry 3D reconstruction of surface topography fromoverlapping photographs taken from differentpositions (at least 2).Accuracy mainly dependent on photograph resolutionand number of overlapping photographs (i.e. numberof shot positions per covered area, Bemis et al. 2014).Both aerial (e.g. using manned or unmanned aircraft/aerial vehicles) and terrestrial photogrammetry can beused
m to mm Low: restricted by timerequirements for photographacquisition and data processingHigh: continuous monitoringon permanently installedcameras
High: high accuracy pointcloud/DEM, deformationmonitoring for entire study site
Application limited by high cost and timerequirements.Post-processing of data relatively complex(e.g. see Akca et al. 2011).Widely used for digital terrain mapping andmonitoring surface change for natural rockslopes and landslides; a small number ofexamples of application to infrastructure slopes(e.g. Jang et al. 2008).Most likely to be used for applications (1),(4) and (5) in Table 2
Remote sensing Terrestrial-, aerial-, or satellite-based recording ofreflected electromagnetic energy from the Earth’ssurface.Typical examples used in investigations of surfacedeformation (Scaioni et al. 2014; Petley et al. 2005):(1) LiDAR (light detection and ranging): distancemeasurement employing backscattered energy of laserbeam, used to create digital elevation models (DEMs);(2) InSAR (interferometric synthetic aperture radar):mapping of phase differences between reflected radarwaves of different acquisition times, representative ofsurface deformation
m to mm Medium to low: restricted bytime required for survey (i.e. incase of terrestrial and aerialsurveys) and processing
High: high accuracy pointcloud/DEM, deformationmonitoring for entire study site
Application limited by high cost and timerequirements (i.e. terrestrial and aerial surveys).Post-processing of data relatively complex.Temporal resolution dependent on satellite orbit(i.e. time between repeated data acquisition oversame location).Accuracy dependent on signal wavelength andatmospheric condition.Positioned reflectors may be required toovercome seasonal changes in vegetation.Aerial surveys (e.g. Miller et al. 2012) havebeen used to characterize and look at longerduration changes within infrastructureearthworks.Most likely to be used for applications (1), (4)and (5) in Table 2
(continued)
277Instrum
entationand
monitoring
ofengineered
slopes
by guest on April 6, 2020
http://qjegh.lyellcollection.org/D
ownloaded from
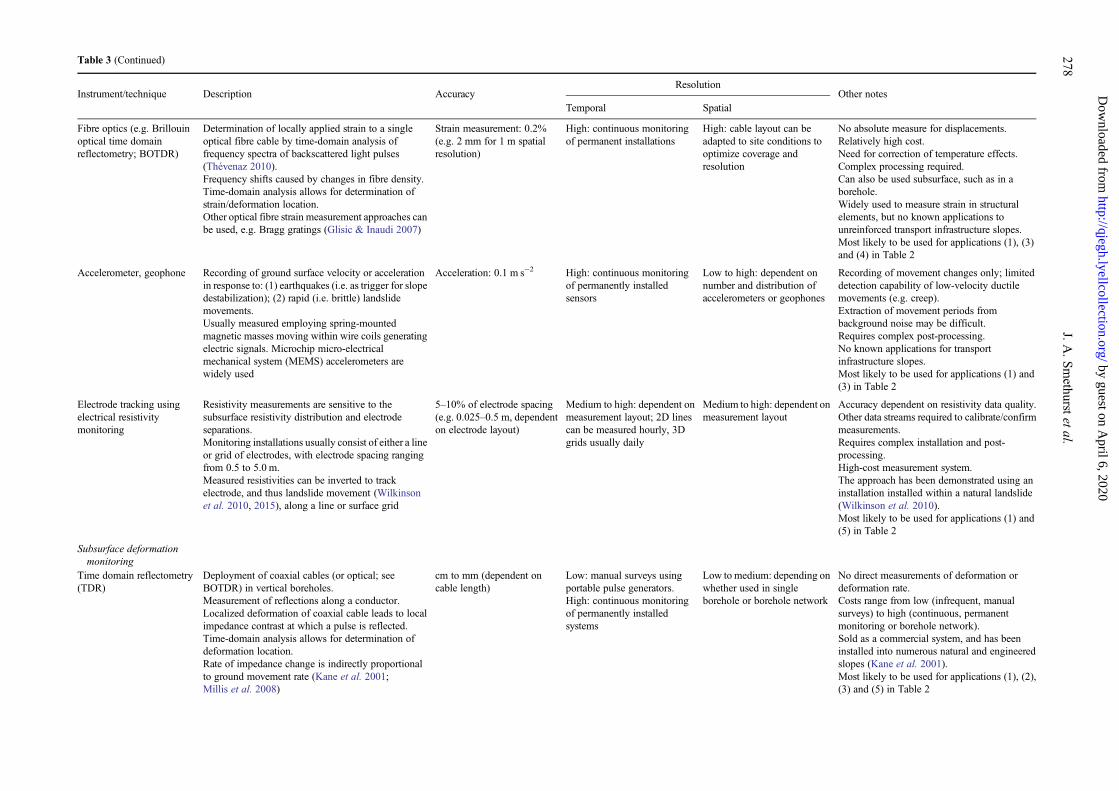
Table 3 (Continued)
Instrument/technique Description AccuracyResolution
Other notesTemporal Spatial
Fibre optics (e.g. Brillouinoptical time domainreflectometry; BOTDR)
Determination of locally applied strain to a singleoptical fibre cable by time-domain analysis offrequency spectra of backscattered light pulses(Thévenaz 2010).Frequency shifts caused by changes in fibre density.Time-domain analysis allows for determination ofstrain/deformation location.Other optical fibre strain measurement approaches canbe used, e.g. Bragg gratings (Glisic & Inaudi 2007)
Strain measurement: 0.2%(e.g. 2 mm for 1 m spatialresolution)
High: continuous monitoringof permanent installations
High: cable layout can beadapted to site conditions tooptimize coverage andresolution
No absolute measure for displacements.Relatively high cost.Need for correction of temperature effects.Complex processing required.Can also be used subsurface, such as in aborehole.Widely used to measure strain in structuralelements, but no known applications tounreinforced transport infrastructure slopes.Most likely to be used for applications (1), (3)and (4) in Table 2
Accelerometer, geophone Recording of ground surface velocity or accelerationin response to: (1) earthquakes (i.e. as trigger for slopedestabilization); (2) rapid (i.e. brittle) landslidemovements.Usually measured employing spring-mountedmagnetic masses moving within wire coils generatingelectric signals. Microchip micro-electricalmechanical system (MEMS) accelerometers arewidely used
Acceleration: 0.1 m s−2 High: continuous monitoringof permanently installedsensors
Low to high: dependent onnumber and distribution ofaccelerometers or geophones
Recording of movement changes only; limiteddetection capability of low-velocity ductilemovements (e.g. creep).Extraction of movement periods frombackground noise may be difficult.Requires complex post-processing.No known applications for transportinfrastructure slopes.Most likely to be used for applications (1) and(3) in Table 2
Electrode tracking usingelectrical resistivitymonitoring
Resistivity measurements are sensitive to thesubsurface resistivity distribution and electrodeseparations.Monitoring installations usually consist of either a lineor grid of electrodes, with electrode spacing rangingfrom 0.5 to 5.0 m.Measured resistivities can be inverted to trackelectrode, and thus landslide movement (Wilkinsonet al. 2010, 2015), along a line or surface grid
5–10% of electrode spacing(e.g. 0.025–0.5 m, dependenton electrode layout)
Medium to high: dependent onmeasurement layout; 2D linescan be measured hourly, 3Dgrids usually daily
Medium to high: dependent onmeasurement layout
Accuracy dependent on resistivity data quality.Other data streams required to calibrate/confirmmeasurements.Requires complex installation and post-processing.High-cost measurement system.The approach has been demonstrated using aninstallation installed within a natural landslide(Wilkinson et al. 2010).Most likely to be used for applications (1) and(5) in Table 2
Subsurface deformationmonitoring
Time domain reflectometry(TDR)
Deployment of coaxial cables (or optical; seeBOTDR) in vertical boreholes.Measurement of reflections along a conductor.Localized deformation of coaxial cable leads to localimpedance contrast at which a pulse is reflected.Time-domain analysis allows for determination ofdeformation location.Rate of impedance change is indirectly proportionalto ground movement rate (Kane et al. 2001;Millis et al. 2008)
cm to mm (dependent oncable length)
Low: manual surveys usingportable pulse generators.High: continuous monitoringof permanently installedsystems
Low to medium: depending onwhether used in singleborehole or borehole network
No direct measurements of deformation ordeformation rate.Costs range from low (infrequent, manualsurveys) to high (continuous, permanentmonitoring or borehole network).Sold as a commercial system, and has beeninstalled into numerous natural and engineeredslopes (Kane et al. 2001).Most likely to be used for applications (1), (2),(3) and (5) in Table 2
278J.A
.Smethurst
etal.
by guest on April 6, 2020
http://qjegh.lyellcollection.org/D
ownloaded from
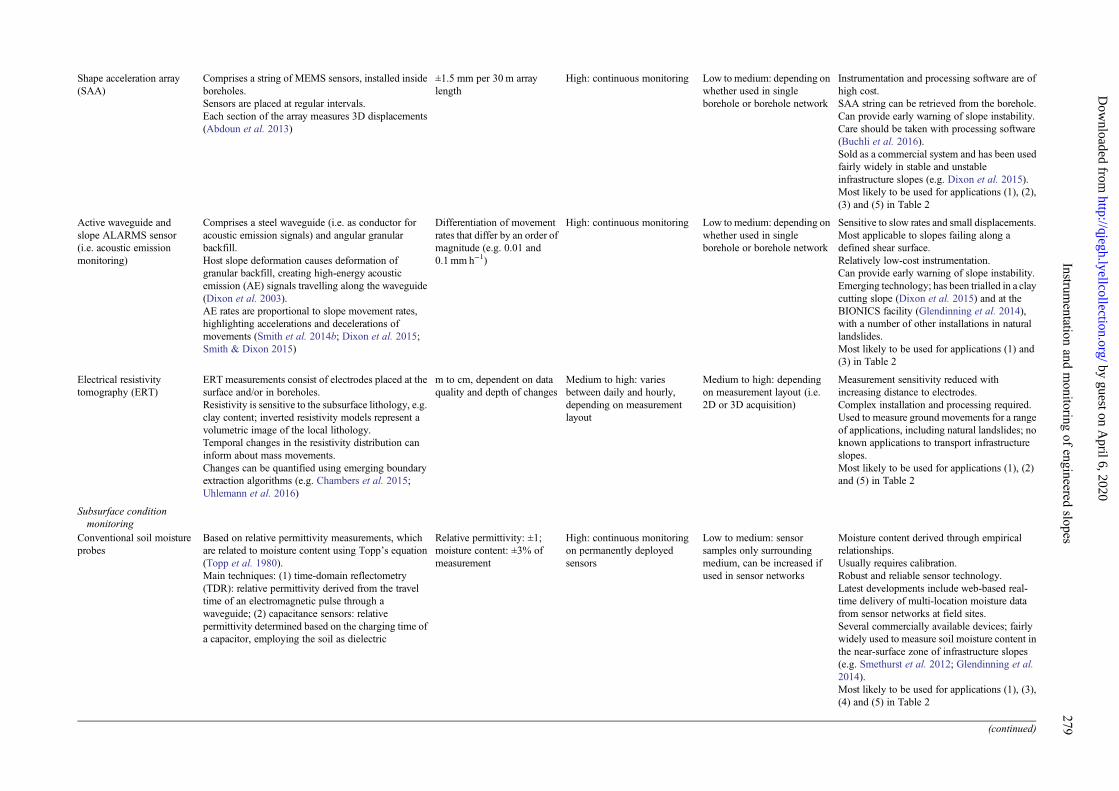
Shape acceleration array(SAA)
Comprises a string of MEMS sensors, installed insideboreholes.Sensors are placed at regular intervals.Each section of the array measures 3D displacements(Abdoun et al. 2013)
±1.5 mm per 30 m arraylength
High: continuous monitoring Low to medium: depending onwhether used in singleborehole or borehole network
Instrumentation and processing software are ofhigh cost.SAA string can be retrieved from the borehole.Can provide early warning of slope instability.Care should be taken with processing software(Buchli et al. 2016).Sold as a commercial system and has been usedfairly widely in stable and unstableinfrastructure slopes (e.g. Dixon et al. 2015).Most likely to be used for applications (1), (2),(3) and (5) in Table 2
Active waveguide andslope ALARMS sensor(i.e. acoustic emissionmonitoring)
Comprises a steel waveguide (i.e. as conductor foracoustic emission signals) and angular granularbackfill.Host slope deformation causes deformation ofgranular backfill, creating high-energy acousticemission (AE) signals travelling along the waveguide(Dixon et al. 2003).AE rates are proportional to slope movement rates,highlighting accelerations and decelerations ofmovements (Smith et al. 2014b; Dixon et al. 2015;Smith & Dixon 2015)
Differentiation of movementrates that differ by an order ofmagnitude (e.g. 0.01 and0.1 mm h−1)
High: continuous monitoring Low to medium: depending onwhether used in singleborehole or borehole network
Sensitive to slow rates and small displacements.Most applicable to slopes failing along adefined shear surface.Relatively low-cost instrumentation.Can provide early warning of slope instability.Emerging technology; has been trialled in a claycutting slope (Dixon et al. 2015) and at theBIONICS facility (Glendinning et al. 2014),with a number of other installations in naturallandslides.Most likely to be used for applications (1) and(3) in Table 2
Electrical resistivitytomography (ERT)
ERT measurements consist of electrodes placed at thesurface and/or in boreholes.Resistivity is sensitive to the subsurface lithology, e.g.clay content; inverted resistivity models represent avolumetric image of the local lithology.Temporal changes in the resistivity distribution caninform about mass movements.Changes can be quantified using emerging boundaryextraction algorithms (e.g. Chambers et al. 2015;Uhlemann et al. 2016)
m to cm, dependent on dataquality and depth of changes
Medium to high: variesbetween daily and hourly,depending on measurementlayout
Medium to high: dependingon measurement layout (i.e.2D or 3D acquisition)
Measurement sensitivity reduced withincreasing distance to electrodes.Complex installation and processing required.Used to measure ground movements for a rangeof applications, including natural landslides; noknown applications to transport infrastructureslopes.Most likely to be used for applications (1), (2)and (5) in Table 2
Subsurface conditionmonitoring
Conventional soil moistureprobes
Based on relative permittivity measurements, whichare related to moisture content using Topp’s equation(Topp et al. 1980).Main techniques: (1) time-domain reflectometry(TDR): relative permittivity derived from the traveltime of an electromagnetic pulse through awaveguide; (2) capacitance sensors: relativepermittivity determined based on the charging time ofa capacitor, employing the soil as dielectric
Relative permittivity: ±1;moisture content: ±3% ofmeasurement
High: continuous monitoringon permanently deployedsensors
Low to medium: sensorsamples only surroundingmedium, can be increased ifused in sensor networks
Moisture content derived through empiricalrelationships.Usually requires calibration.Robust and reliable sensor technology.Latest developments include web-based real-time delivery of multi-location moisture datafrom sensor networks at field sites.Several commercially available devices; fairlywidely used to measure soil moisture content inthe near-surface zone of infrastructure slopes(e.g. Smethurst et al. 2012; Glendinning et al.2014).Most likely to be used for applications (1), (3),(4) and (5) in Table 2
(continued)
279Instrum
entationand
monitoring
ofengineered
slopes
by guest on April 6, 2020
http://qjegh.lyellcollection.org/D
ownloaded from
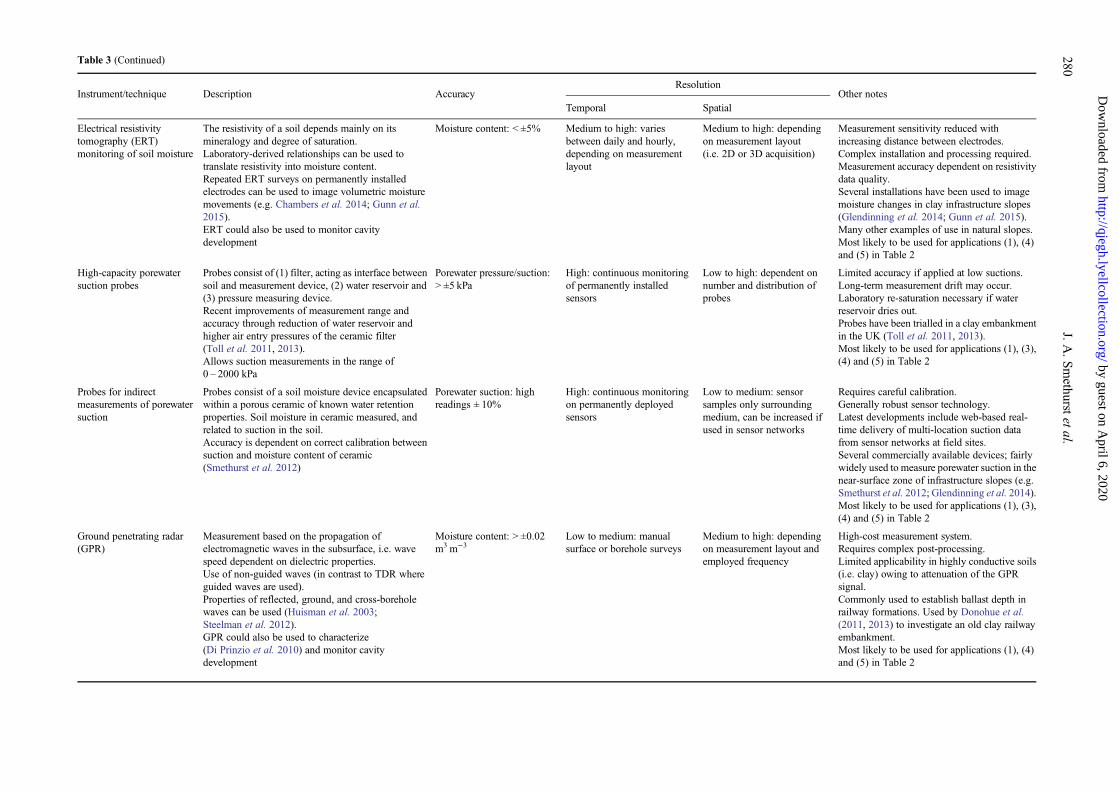
Table 3 (Continued)
Instrument/technique Description AccuracyResolution
Other notesTemporal Spatial
Electrical resistivitytomography (ERT)monitoring of soil moisture
The resistivity of a soil depends mainly on itsmineralogy and degree of saturation.Laboratory-derived relationships can be used totranslate resistivity into moisture content.Repeated ERT surveys on permanently installedelectrodes can be used to image volumetric moisturemovements (e.g. Chambers et al. 2014; Gunn et al.2015).ERT could also be used to monitor cavitydevelopment
Moisture content: < ±5% Medium to high: variesbetween daily and hourly,depending on measurementlayout
Medium to high: dependingon measurement layout(i.e. 2D or 3D acquisition)
Measurement sensitivity reduced withincreasing distance between electrodes.Complex installation and processing required.Measurement accuracy dependent on resistivitydata quality.Several installations have been used to imagemoisture changes in clay infrastructure slopes(Glendinning et al. 2014; Gunn et al. 2015).Many other examples of use in natural slopes.Most likely to be used for applications (1), (4)and (5) in Table 2
High-capacity porewatersuction probes
Probes consist of (1) filter, acting as interface betweensoil and measurement device, (2) water reservoir and(3) pressure measuring device.Recent improvements of measurement range andaccuracy through reduction of water reservoir andhigher air entry pressures of the ceramic filter(Toll et al. 2011, 2013).Allows suction measurements in the range of0 – 2000 kPa
Porewater pressure/suction:> ±5 kPa
High: continuous monitoringof permanently installedsensors
Low to high: dependent onnumber and distribution ofprobes
Limited accuracy if applied at low suctions.Long-term measurement drift may occur.Laboratory re-saturation necessary if waterreservoir dries out.Probes have been trialled in a clay embankmentin the UK (Toll et al. 2011, 2013).Most likely to be used for applications (1), (3),(4) and (5) in Table 2
Probes for indirectmeasurements of porewatersuction
Probes consist of a soil moisture device encapsulatedwithin a porous ceramic of known water retentionproperties. Soil moisture in ceramic measured, andrelated to suction in the soil.Accuracy is dependent on correct calibration betweensuction and moisture content of ceramic(Smethurst et al. 2012)
Porewater suction: highreadings ± 10%
High: continuous monitoringon permanently deployedsensors
Low to medium: sensorsamples only surroundingmedium, can be increased ifused in sensor networks
Requires careful calibration.Generally robust sensor technology.Latest developments include web-based real-time delivery of multi-location suction datafrom sensor networks at field sites.Several commercially available devices; fairlywidely used to measure porewater suction in thenear-surface zone of infrastructure slopes (e.g.Smethurst et al. 2012; Glendinning et al. 2014).Most likely to be used for applications (1), (3),(4) and (5) in Table 2
Ground penetrating radar(GPR)
Measurement based on the propagation ofelectromagnetic waves in the subsurface, i.e. wavespeed dependent on dielectric properties.Use of non-guided waves (in contrast to TDR whereguided waves are used).Properties of reflected, ground, and cross-boreholewaves can be used (Huisman et al. 2003;Steelman et al. 2012).GPR could also be used to characterize(Di Prinzio et al. 2010) and monitor cavitydevelopment
Moisture content: > ±0.02m3 m−3
Low to medium: manualsurface or borehole surveys
Medium to high: dependingon measurement layout andemployed frequency
High-cost measurement system.Requires complex post-processing.Limited applicability in highly conductive soils(i.e. clay) owing to attenuation of the GPRsignal.Commonly used to establish ballast depth inrailway formations. Used by Donohue et al.(2011, 2013) to investigate an old clay railwayembankment.Most likely to be used for applications (1), (4)and (5) in Table 2
280J.A
.Smethurst
etal.
by guest on April 6, 2020
http://qjegh.lyellcollection.org/D
ownloaded from
mean it is now possible to send significant quantities of datavia mobile phone networks. Local wireless data networksthat transmit between adjacent monitoring nodes are alsobecoming commonplace, and are particularly helpful ingeographically diverse systems.
(3) On-site data processing: the reducing cost of computingpower and bespoke circuitry mean that it is now possible tohave systems that monitor and process data continuously.This has been critical for the development of some novelsystems; for example, acoustic emission monitoring (Dixonet al. 2015) andmonitoring by geophones and accelerometers.
All of the above allow systems that require less human intervention,in readings, downloading data and in maintenance (e.g. changingbatteries). This is likely to reduce costs, and avoid the need to putpeople into remote and potentially hazardous environments.
Data management
The reducing cost of electronic in-place sensors and improveddatalogging systems mean that it is now possible to both install moresensors and take and store many more readings from instrumentsthan was possible in the past. This allows a much better granularityof spatial and time-based information; for example, readings everyfew minutes rather than days or even weeks apart can provide truerrepresentations of physical processes, such as how water pressuresmay react to extreme short-duration rainfall events. This level ofdetail can be helpful in assessing risk, as well as in understandingthe physical processes that take place. Such short-interval readingsare essential to real-time alarm systems.
The disadvantage is more data to transmit, store and process.However, there are increasingly sophisticated commercial systemsthat collect and store data, process it into engineering units, and postit onto secure web portals where it can be viewed. Alarms can be setto alert key decision makers if certain pre-set trigger levels areexceeded. Standardized data formats such as the Association of
Geotechnical and Geoenvironmental Specialists MonitoringStandard (AGS-M), which allow easier sharing of information,are becoming common (Richards et al. 2003). These are likely tobecomemore important as assets are monitored over longer periods,giving flexibility in updating hardware and software and interoper-ability between proprietary systems. There have also been advancesin commercialization of techniques for processing data, such as insoftware for photogrammetry applications.
Collection and monitoring of more information is part of atechnological trend towards ‘big data’, which is becomingincreasingly important across wide areas of the Europeaneconomy. Data on engineered slopes may be generated duringdesign, construction and operational phases (i.e. the whole life cycleof the asset); geotechnical monitoring information may be a part ofthis dataset. Many large highway and railway infrastructure ownersincreasingly store information on their assets within large databases,many of which are linked to geographical information systems(GIS). These are a digital representation of the physical andfunctional characteristics of assets, and act as a resource for sharingand visualizing information and knowledge. For example, the UKhighway agencies have a system known as HAGDMS (HighwaysAgency Geotechnical Data Management System; Morin et al.2014), in which information is associated with relevant assets ingeographical space. These systems share many similarities withbuilding information modelling (Eastman et al. 1974), althoughthere are differences; for example, the linear nature of theinfrastructure makes 2D rather than 3D representation of an assetmore appealing.
Traditional monitoring approaches produce periodic reports,which might be attached to an asset within the GIS. The capabilityof current systems to hold large datasets is less certain, and maybecome challenging as the number of sensors and frequency ofreadings increase. However, GIS that distribute risk information ona fine spatial scale, often in real time (for example, linked toantecedent and forecast rainfall), are becoming more commonplace,and it is plausible that in the future this could include near real-time
Fig. 1. BIONICS research embankment, Northumberland, UK. The facility has been used to understand earthworks behaviour in relation to climate and testnew instrumentation approaches (photograph courtesy of R. Stirling, Newcastle University, UK).
281Instrumentation and monitoring of engineered slopes
by guest on April 6, 2020http://qjegh.lyellcollection.org/Downloaded from
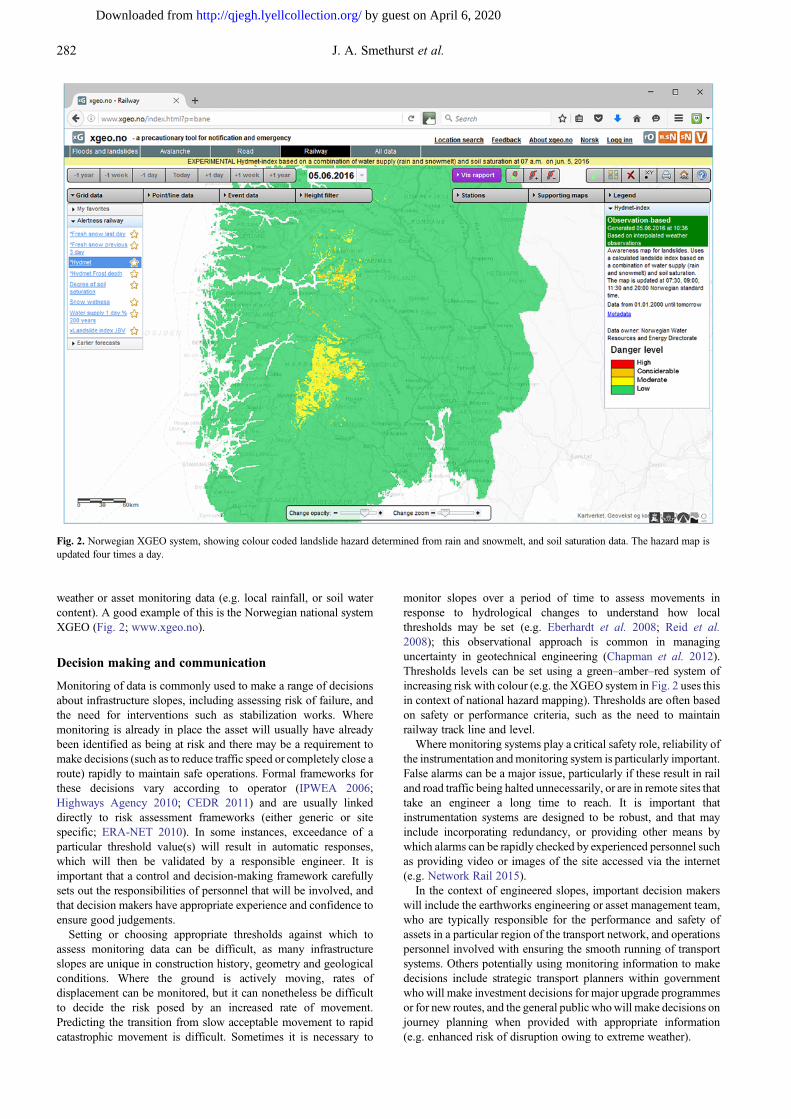
weather or asset monitoring data (e.g. local rainfall, or soil watercontent). A good example of this is the Norwegian national systemXGEO (Fig. 2; www.xgeo.no).
Decision making and communication
Monitoring of data is commonly used to make a range of decisionsabout infrastructure slopes, including assessing risk of failure, andthe need for interventions such as stabilization works. Wheremonitoring is already in place the asset will usually have alreadybeen identified as being at risk and there may be a requirement tomake decisions (such as to reduce traffic speed or completely close aroute) rapidly to maintain safe operations. Formal frameworks forthese decisions vary according to operator (IPWEA 2006;Highways Agency 2010; CEDR 2011) and are usually linkeddirectly to risk assessment frameworks (either generic or sitespecific; ERA-NET 2010). In some instances, exceedance of aparticular threshold value(s) will result in automatic responses,which will then be validated by a responsible engineer. It isimportant that a control and decision-making framework carefullysets out the responsibilities of personnel that will be involved, andthat decision makers have appropriate experience and confidence toensure good judgements.
Setting or choosing appropriate thresholds against which toassess monitoring data can be difficult, as many infrastructureslopes are unique in construction history, geometry and geologicalconditions. Where the ground is actively moving, rates ofdisplacement can be monitored, but it can nonetheless be difficultto decide the risk posed by an increased rate of movement.Predicting the transition from slow acceptable movement to rapidcatastrophic movement is difficult. Sometimes it is necessary to
monitor slopes over a period of time to assess movements inresponse to hydrological changes to understand how localthresholds may be set (e.g. Eberhardt et al. 2008; Reid et al.2008); this observational approach is common in managinguncertainty in geotechnical engineering (Chapman et al. 2012).Thresholds levels can be set using a green–amber–red system ofincreasing risk with colour (e.g. the XGEO system in Fig. 2 uses thisin context of national hazard mapping). Thresholds are often basedon safety or performance criteria, such as the need to maintainrailway track line and level.
Where monitoring systems play a critical safety role, reliability ofthe instrumentation andmonitoring system is particularly important.False alarms can be a major issue, particularly if these result in railand road traffic being halted unnecessarily, or are in remote sites thattake an engineer a long time to reach. It is important thatinstrumentation systems are designed to be robust, and that mayinclude incorporating redundancy, or providing other means bywhich alarms can be rapidly checked by experienced personnel suchas providing video or images of the site accessed via the internet(e.g. Network Rail 2015).
In the context of engineered slopes, important decision makerswill include the earthworks engineering or asset management team,who are typically responsible for the performance and safety ofassets in a particular region of the transport network, and operationspersonnel involved with ensuring the smooth running of transportsystems. Others potentially using monitoring information to makedecisions include strategic transport planners within governmentwhowill make investment decisions for major upgrade programmesor for new routes, and the general public whowill make decisions onjourney planning when provided with appropriate information(e.g. enhanced risk of disruption owing to extreme weather).
Fig. 2. Norwegian XGEO system, showing colour coded landslide hazard determined from rain and snowmelt, and soil saturation data. The hazard map isupdated four times a day.
282 J. A. Smethurst et al.
by guest on April 6, 2020http://qjegh.lyellcollection.org/Downloaded from
Forecasting and communicating periods of enhanced risk
Risk is often assessed at the corridor or network scale, where theremay be an increased risk of failure and thus disruption to operationsduring and after long periods of heavy rainfall, or prolonged verydry periods (which may cause shrinkage of clay earthworks). Thereare established methods for assessing geotechnical risk over lengthsof corridor (Gavin et al. in review) and these can incorporateantecedent conditions and/or forecast weather, combined withgeological and topographical information. The Norwegian XGEOsystem uses hydrological (soil water content) information to assesspotential risk of landslips on 1 km grid squares at a national scale(Fig. 2; Devoli et al. 2015; Boje et al. 2014), and a demonstratorsystem is being developed for the UK London to South West railroutes called GeoSRM (Sadler et al. 2016) that determinesearthworks risk based on geology, soil moisture conditions andforecast rainfall. More sophisticated systems could incorporateunderlying slope failure models based on approximate soilproperties and the geometry of the earthworks, although it couldbe challenging to predict failure within particular slopes as key data(geometry, geology, condition) and models of failure are ofteninsufficient or too simplified (Glendinning et al. 2015; Elia et al.2017). Nonetheless, such a system could be valuable if coupled withnear-future weather data (e.g. impending storms) to assess thebroader probability of slope failure causing disruption to transportoperations. Local monitoring data could also be incorporated withina system to improve estimates of risk, although this may requireprocessing of large amounts of data through multiple iterations ofmodels, requiring significant computational resources.
XGEO is publically available in Norway, and is used to helpcommunicate risk and thus the potential for travel disruption (from arange of hazards including geotechnical failure) to the generalpublic. This information provision can be critical in helping thepublic to make informed decisions about how and when to travel.
The future; where do we go next?
Many European countries have mature road and rail systems, someof which are now old; for example, many rail earthworks have beenused for 100 years or more. Despite their age, the demand for travelis growing in many European countries; for example, rail use in theUK has grown by more than 50% since 2000 (Powrie 2014) and isexpected to double in the next 25 years. The public expectation forperformance and reliability is also greater, and this poses challengesfor linear infrastructure systems in which elemental failure can causedisruption to large lengths of route. Increasing safety is alsoexpected of public infrastructure systems; in the UK during periodsof adverse wet weather railway earthworks pose a greater safety riskto the travelling public and railway staff than the other infrastructuretypes (such as track, signalling and bridges) combined (Hutchinson2015). Climate change may also affect asset performance. The maindriver for slope failure is rainfall, and it is possible that a hotterfuture European climatewill see rainfall arrive in more intense stormevents. Drier summers may also pose difficulties for earthworks,causing cracking and shrinkage problems in clay soils (Clarke &Smethurst 2010). Both the public and transport operators want safeand disruption-free systems, and this is likely to be a driver forchange to the way that assessment and monitoring of geotechnicalassets is approached.
Monitoring of data is also needed to help understand and reducefailure in newly built infrastructure. New road and rail systems oftenoperate at higher speed, and the hazard posed by running intoslipped debris (causing derailment or crash) is greater. The lessonsfrom understanding deterioration and failure in older systems isneeded to help design, monitor and maintain new geotechnicalassets.
This is also an exciting time for monitoring technologies. Theemergence of the internet, increasingly powerful wireless transmis-sion and data recording technologies, cheaper sensors, enhancedremote sensing technologies, the ability to process large amounts ofdata in real time, and greater commercialization of monitoringtechnology across domains are all making possible things notavailable to us even a few years ago. All of the above are feedinginto new technology development in geotechnical monitoring; theabove sections in this paper detail some novel approaches beingdeveloped by COSTAction members, although there are also manyothers.
Specific slopes with known stability problems require carefulmonitoring using more conventional instrumentation (inclin-ometers, piezometers) to manage the risk that they present.However, generally the majority of earthworks will not bemonitored, subject at best only to visual inspection by experiencedpersonnel at frequencies between annual and 10 yearly. Some ofthese slopes do and will fail unexpectedly, causing disruption, atconsiderable cost to the economy. To try and monitor longer lengthsof earthwork, operators are increasingly keen on more pervasivecondition monitoring approaches (i.e. those that monitor surfacedisplacement and soil water content, etc. over long lengths of assetat low cost), that may be able to highlight earthworks that areshowing initial distress. Such systems could require little humanintervention; remote sensing, wireless and internet technologiesmay all allow systems that are significantly automated.
There is also considerable potential to enhance the way that weview, manage and disseminate monitoring data using the internet;this paper has looked at two examples in the Norwegian XGEO andUK GeoSRM systems. Condition monitoring data could be used inthe future to determine earthwork risk along significant lengths ofroute using physically based models; this has the potential to beupdated in near-real time with, for example, forecast weather toshow future probabilities for earthwork failure and thus disruptionto transport operations.
Although such systems are very desirable, there are of coursesignificant challenges to achieving these types of monitoringsystems. These can be summarized in three points.The assets: earthworks are difficult. They can be very variable interms of geometry and material properties, there can be local‘defects’, they are often covered with vegetation that can makeassessment and conditionmonitoring difficult, and there aremultiplemodes of failure, some of which are complex and not wellunderstood. Generally we need a much better understanding of thecondition of these assets and theway in which they perform (or fail).This is also needed for the development of more pervasivemonitoring approaches; for long lengths of asset what are theindicators of loss of performance? Instrumentation and monitoringdata fundamentally underpin themodels of physical asset behaviour,and risk, that are being explored further in other parts of the COSTAction. The collection, storage, analysis and dissemination andsharing of more and better quality monitoring data can provide theinformation andmodels to properly understand modes of failure anddeterioration, and the level at which to set thresholds forintervention. Any future automated system relying less on humaninput will be dependent on better models. The COST Actionprovides opportunities for closer collaboration and sharing of databetween, for example, asset owners and research bodies.The economics: new monitoring technologies and pervasivecondition monitoring approaches offer promise, but there must bea good economic case for their use. Investment in more widespreaduse of monitoring needs to be based on savings to the economy fromfewer failed earthworks and less disruption. It is doubtful that thusfar the case is made in its entirety; the technologies andunderstanding of earthworks required to make these monitoringapproaches work are incomplete, and asset owners often do not have
283Instrumentation and monitoring of engineered slopes
by guest on April 6, 2020http://qjegh.lyellcollection.org/Downloaded from
the needed data on delay costs. This will change, as the technologyand our expectations of ageing infrastructure systems also change.Regulatory bodies, government and public expectation will play arole in challenging operators to show continual improvement insafety and management systems. Many of the new instrumentationapproaches described above have also been developed usingnational government and European Union grants, with financialand other support from road and rail asset owners. Continued stronginvestment in the development of technology for monitoring ofearthworks, and a pro-active approach to seeking to prevent failure,will be critical.Technological and human systems: the paper has described thedevelopments in instrumentation for monitoring earthworks, withmany systems providing enhancements in monitoring ability,reliability, longevity, cost, and the quality and quantity of dataobtained. Several new techniques are very promising, but needfurther development for use in infrastructure slope monitoring. Theability to monitor more slopes at greater spatial and temporalresolution also requires handling, processing and analysis ofsignificantly more data. This follows the economic trend forunderstanding systems using ‘big data’. Automated systems thatanalyse large quantities of data are desirable, although theirapplication may have limits; it could still be best to have humanjudgement of the data in major decision-making processes(e.g. before stopping traffic). This introduces the need to haveenough suitably trained people to understand and review situationsand make good and consistent decisions, and, where appropriate,the use of standardized monitoring (avoiding having large numbersof highly bespoke systems) and centralized control. The humaninfluence in decision making requires careful processes and clearrisk, decision and response plans are an essential part of majormonitored systems.
These are all significant challenges, and it will require time andinvestment to achieve enhanced monitoring of European transportsystems. These challenges can be overcome more easily if wecollaborate, and share ideas and data as European partners,something the COST Action has been trying to achieve.
Conclusions
(1) This paper has explored the context and background toinstrumentation and monitoring of infrastructure slopes inEurope. It has considered typical applications formonitoring, ranging from systems to warn of imminentfailure, to monitoring for research to better understand thephysical processes that take place in slopes.
(2) A number of novel instrumentation approaches have beendescribed; some of these are gaining widespread use, andothers are at the research and development stage. Newtechnologies and systems are providing enhancements inmonitoring ability, reliability, longevity, cost, and thequality and quantity of data obtained.
(3) There is considerable potential for the changing demandsand expectations of infrastructure systems and newmonitoring technologies to completely change the waythat slopes are monitored in the future. It will probably bepossible to monitor greater lengths of earthwork, with theintention of providing warning of and reducing incidencesof unexpected failure (i.e. condition monitoring), rather thanthe fairly reactive monitoring approaches commonly seentoday.
(4) Several new techniques for monitoring longer lengths ofslope are promising, but need application-specificdevelopment before use for infrastructure slopemonitoring. These techniques include optical fibres,LiDAR and photogrammetry, and wireless sensor networks.
(5) The ability to monitor more slopes at greater spatial andtemporal resolution requires handling, processing andanalysis of significantly more data. Automated systemsthat analyse large quantities of data are desirable, althoughhuman judgements in conjunction with careful decision-making frameworks will still be required.
(6) Improved modelling of risk at the route scale, andimproving database and internet systems may allow thepossibility of hazard or risk maps that update continuallywith asset condition-monitoring data and current or forecastclimate. Such systems could prove invaluable to transportoperators, as well as in communicating risk to the travellingpublic. This paper has looked at examples of such systemsin use and in development.
(7) To allow more widespread monitoring and bettercommunication of risk, improved models of slopeperformance and failure are required, as well as a betterfinancial case. Parts of this are discussed in more detail inother papers from COST Action TU1202. Both will beunderpinned by improved quality, collection, analysis andcommunication ofmonitoring data from infrastructure slopes.
(8) Greater communication and sharing of data and ideasbetween European nations and continued investment inmonitoring technologies by European transport operatorsand governments is required to aid the monitoringchallenges elucidated above.
Acknowledgements This paper is an output of Working Group 2 of EUCOST Action TU1202 – Impacts of climate change on engineered slopes forinfrastructure. TU1202 comprises four working groups: WG1 – Slope numericalmodelling; WG2 – Field experimentation and monitoring; WG3 – Soil/vegetation/climate interactions; WG4 – Slope risk assessment. Outputs fromeach working group have been submitted to QJEGH and are intended to be readas a thematic set. The contributions of S. Uhlemann and J.E. Chambers arepublished with the permission of the Executive Director of the British GeologicalSurvey, NERC.
Funding The authors gratefully acknowledge the funding for COST ActionTU1202 through the EU Horizon 2020 programme, without which this WorkingGroup output would not have been possible. J. Smethurst was also supported bythe UK Engineering and Physical Sciences Research Council grant number EP/K027050/1. A. Smith was supported by the UK Engineering and PhysicalSciences Research Council via a PhD studentship, a Doctoral Prize Fellowship,and two grants, numbers EP/H007261/1 and EP/D035325.
Scientific editing by Nick Koor; Sophie Messerklinger
ReferencesAbbott, S., Power, C. & Mian, J. 2014. Presentation to the Slope Engineering &
Geotechnical Asset Management Conference, London, held on 19 November2014.
Abdoun, T., Bennett, V., Desrosiers, T., Simm, J. & Barendse, M. 2013. Assetmanagement and safety assessment of levees and earthen dams throughcomprehensive real-time field monitoring. Geotechnical and GeologicalEngineering, 31, 833–843.
Akca, D., Gruen, A., Askarinejad, A. & Springman, S. M. 2011.Photogrammetric monitoring of an artificially generated land slide.International Conference on Geo-information for Disaster Management(Gi4DM), Antalya, Turkey, 3–8 May 2011 [CD-ROM only].
Askarinejad, A., Casini, F., Bischof, P., Beck, A. & Springman, S.M. 2012.Rainfall induced instabilities: a field experiment on a silty sand slope innorthern Switzerland. Rivista Italiana di Geotecnica, 3/2012 (Iuglio–Settembre 2012), 9–30.
Bemis, S.P., Micklethwaite, S., Turner, D., James, M.R., Akciz, S., Thiele, S.T. &Bangash, H.I. 2014. Ground-based and UAV-based photogrammetry: a multi-scale, high-resolution mapping tool for structural geology and paleoseismol-ogy. Journal of Structural Geology, 69, 163–178, https://doi.org/10.1016/j.jsg.2014.10.007
Bles, T., Bassembinder, J., Chevreuil, M., Danielsson, P., Falemo, S. &Venmans,A. 2015. Roadapt. Roads for today, adapted for tomorrow. Guidelines. CEDRTransnational Road Research Programme, May 2015.
Boje, S., Devoli, G., Cepeda, J. & Colleuille H. 2014. Landslide thresholds atregional scale for an early warning system in Norway. Proceedings of theWorld Landslide Forum 3, 2–6 June 2014, Beijing.
284 J. A. Smethurst et al.
by guest on April 6, 2020http://qjegh.lyellcollection.org/Downloaded from
Briggs, K.M., Smethurst, J.A., Powrie, W. & O’Brien, A.S. 2013. Wet winterpore pressures in railway embankments. Proceedings of the Institution of CivilEngineers: Geotechnical Engineering, 166, 451–465, https://doi.org/10.1680/geng.11.00106
Briggs, K.M., Loveridge, F.A. & Glendinning, S. 2017. Failures in transportinfrastructure embankments. Engineering Geology, 219, 107–117.
BSI 2015. BS EN ISO 18674-1:2015. Geotechnical investigation and testing.Geotechnical monitoring by field instrumentation. General rules. BritishStandards Institution, London.
Buchli, T., Merz, K., Zhou, X., Kinzelbach, W. & Springman, S.M. 2013.Characterization and monitoring of the Furggwanghorn Rock Glacier, TurtmannValley, Switzerland: results from 2010 to 2012. Vadose Zone Journal, 12, 1–15.
Buchli, T., Laue, J. & Springman, S.M. 2016. Amendments to interpretations ofSAAF inclinometer data from the Furggwanghorn Rock Glacier, TurtmannValley, Switzerland: results from 2010 to 2012. Vadose Zone Journal, 15, 1–3.
Caduff, R., Schlunegger, F., Kos, A. & Wiesmann, A. 2014. A review ofterrestrial radar interferometry for measuring surface change in thegeosciences. Earth Surface Processes and Landforms, 40, 208–228.
Casini, F., Serri, V. & Springman, S.M. 2013. Hydromechanical behaviour of asilty sand from a steep slope triggered by artificial rainfall: from unsaturated tosaturated conditions. Canadian Geotechnical Journal, 50, 28–40, https://doi.org/10.1139/cgj-2012-0095
Castagnetti, C., Bertacchini, E., Corsini, A. & Capra, A. 2013. Multi-sensorsintegrated system for landslide monitoring: critical issues in system setup anddata management. European Journal of Remote Sensing, 46, 104–124.
CEDR 2011. Adaptation to climate change – Task 16 Report 2011. Conference ofEuropean Directors of Roads. www.cedr.fr/home/fileadmin/user_upload/Publications/2013/T16_Climate_change.pdf [last accessed 21 April 2016].
Chambers, J.E., Wilkinson, P.B. et al. 2011. Three-dimensional geophysicalanatomy of an active landslide in Lias Group mudrocks, Cleveland Basin, UK.Geomorphology, 125, 472–484.
Chambers, J.E., Gunn, D. et al. 2014. 4D electrical resistivity tomographymonitoring of soil moisture dynamics in an operational railway embankment.Near Surface Geophysics, 12, 61–72.
Chambers, J.E., Meldrum, P.I. et al. 2015. Spatial monitoring of groundwaterdrawdown and rebound associated with quarry dewatering using automatedtime-lapse electrical resistivity tomography and distribution guided clustering.Engineering Geology, 193, 412–420, https://doi.org/10.1016/j.enggeo.2015.05.015
Chapman, T., Skinner, H., Brown, M. & Burland, J. 2012. Institution of CivilEngineers Manual of Geotechnical Engineering. Institution of CivilEngineers, London.
Cigna, F., Jordan, H., Bateson, L., McCormack, H. & Roberts, C. 2015. Naturaland anthropogenic geohazards in greater London observed from geologicaland ERS-1/2 and ENVISAT persistent scatterers ground motion data: Resultsfrom the EC FP7-SPACE PanGeo project. Pure and Applied Geophysics, 172,2965–2995.
Clarke, D. & Smethurst, J.A. 2010. Effects of climate change on cycles of wettingand drying in engineered clay slopes in England. Quarterly Journal ofEngineering Geology and Hydrogeology, 43, 473–486, https://doi.org/10.1144/1470-9236/08-106
Dasenbrock, D. 2014. Performance observations of MEMS ShapeAccelArray(SAA) deformation sensors. Geotechnical Instrumentation News, June, 23–26. www.bitech.ca/pdf/GeoTechNews/2014/GIN%203202.pdf [last accessed23 April 2016].
Devoli, G., Kleivane, I. et al. 2015. Landslide early warning system and web toolsfor real-time scenarios and for distribution of warningmessages in Norway. In:Lollino, G., Giordan, D. et al. (eds) Engineering Geology for Society andTerritory, 2. Springer, Cham, 625–629.
Dijkstra, T. & Dixon, N. 2010. Climate change and slope stability in the UK:challenges and approaches. Quarterly Journal of Engineering Geology andHydrogeology, 43, 371–385, https://doi.org/10.1144/10.1144/1470-9236/09-036
Dijkstra, T., Dixon, N., Crosby, C., Frost, M., Gunn, D., Fleming, P. & Wilks, J.2014. Forecasting infrastructure resilience to climate change. Proceedings ofthe Institution of Civil Engineers: Transport., 167, 269–280.
Di Prinzio, M., Bittelli, M., Castellarin, A. & Pisa, P.R. 2010. Application of GPRto the monitoring of river embankments. Journal of Applied Geophysics, 71,53–61, https://doi.org/10.1016/j.jappgeo.2010.04.002
Dixon, N., Hill, R. & Kavanagh, J. 2003. Acoustic emission monitoring of slopeinstability: development of an active wave guide system. Proceeding of theInstitution of Civil Engineers: Geotechnical Engineering, 156, 83–95.
Dixon, N., Spriggs, M.P., Smith, A., Meldrum, P. & Haslam, E. 2014.Quantification of reactivated landslide behaviour using acoustic emissionmonitoring. Landslides, 1–12, https://doi.org/10.1007/s10346-014-0491-z
Dixon, N., Smith, A., Spriggs, M.P., Ridley, A., Meldrum, P. & Haslam, E. 2015.Stability monitoring of a rail slope using acoustic emission. Proceedings of theInstitution of Civil Engineers: Geotechnical Engineering, 168, 373–384.
Donohue, S., Gavin, K. & Tolooiyan, A. 2011. Geophysical and geotechnicalassessment of a railway embankment failure.Near Surface Geophysics, 9, 33–44.
Donohue, S., Gavin, K. & Tolooiyan, A. 2013. Railway earthwork stabilityassessment using geophysics. In: Coutinho, R.Q. & Mayne, P.W. (eds)Geotechnical and Geophysical Site Characterization 4, 2, Taylor & Francis,London, 1519–1525.
Dunnicliff, J. 1993. Geotechnical Instrumentation for Monitoring FieldPerformance. Wiley, New York.
Eastman, C., Fisher, D., Lafue, G., Lividini, J., Stoker, D. & Yessios, C. 1974. AnOutline of the Building Description System. Research Report No. 50. Instituteof Physical Planning, Carnegie–Mellon University, Pittsburgh, PA.
Eberhardt, E., Watson, A.D. & Leow, S. 2008. Improving the interpretation ofslope monitoring and early warning data through better understanding ofcomplex deep-seated landslide failure mechanisms. In: Chen, Z., Zhang, J.et al. (eds) Landslides and Engineered Slopes, Vol. 1. Taylor & Francis,London, 39–51.
Elia, G., Cotecchia, F. et al. 2017. Numerical modelling of slope–vegetation–atmosphere interaction: an overview. Quarterly Journal of EngineeringGeology and Hydrogeology, 50, First published online 29 June 2017, https://doi.org/10.1144/qjegh2016-079
ERA-NET 2010. Risk Management for Roads in a changing climate – a guide tothe RIMAROCC method. Road ERA-NET, Linköping, Sweden.
Fan, L., Powrie, W., Smethurst, J.A., Atkinson, P.M. & Einstein, H. 2014. Theeffect of short ground vegetation on terrestrial laser scans at a local scale.ISPRS Journal of Photogrammetry and Remote Sensing, 95, 42–52, https://doi.org/10.1016/j.isprsjprs.2014.06.003
Fookes, P.G. 1997. Geology for engineers: the geological model, prediction andperformance. Quarterly Journal of Engineering Geology, 30, 293–424,https://doi.org/10.1144/GSL.QJEG.1997.030.P4.02
Gavin, K., Martinovic, K. et al. in review. Use of risk assessment frameworks forthe management of European transport infrastructure networks. QuarterlyJournal of Engineering Geology and Hydrogeology.
Glendinning, S., Hall, J.W. & Manning, L.J. 2009. Asset-management strategiesfor infrastructure embankments. Proceedings of the Institution of CivilEngineers: Engineering Sustainability, 162, 111–120.
Glendinning, S., Hughes, P. et al. 2014. Construction, management andmaintenance of embankments used for road and rail infrastructure: implica-tions of weather induced pore water pressures. Acta Geotechnica, 9, 799–816.
Glendinning, S., Helm, P.R. et al. 2015. Research-informed design, managementand maintenance of infrastructure slopes: development of a multi-scalarapproach. IOP Conference Series: Earth and Environmental Science, 26,012005.
Glisic, B. & Inaudi, D. 2007. Fibre Optic Methods for Structural HealthMonitoring. Wiley, Chichester.
Gong, C., Zeng, G., Ge, L., Tan, C., Luo, Q., Liu, X. & Chen, M. 2013. Design oflong-distance and high-accuracy rail subgrade deformation monitoring systembased on Zigbee wireless network. Applied Mechanics and Materials,303–306, 676–684.
Gunn, D.A., Chambers, J.E. et al. 2015. Moisture monitoring in clayembankments using electrical resistivity tomography. Construction andBuilding Materials, 92, 82–94, https://doi.org/10.1016/j.conbuildmat.2014.06.007
Hardy, A.J., Barr, S.L., Mills, J.P. & Miller, P.E. 2012. Characterising soilmoisture in transport corridor environments using airborne LIDAR and CASIdata. Hydrological Processes, 26, 1925–1936.
Highways Agency 2010. A risk based framework for geotechnical assetmanagement – Phase 2 Report. Issue 1, November 2010.
Hooper, R., Armitage, R., Gallagher, A. & Osorio, T. 2009. Whole-lifeinfrastructure asset management: good practice guide for civil infrastructure.CIRIA Report C677. Construction Industry Research and InformationAssociation (CIRIA), London.
Hugenholtz, C., Walker, J., Brown, O. & Myshak, S. 2015. Earthworkvolumetrics with an unmanned aerial vehicle and softcopy photogrammetry.Journal of Surveying Engineering, 141, 06014003.
Hughes, D.A.B., Clarke, G.R.T., Harley, R.M.G. & Barbour, S.L. 2016. Theimpact of hydrogeology on the instability of a road cutting through a drumlinin Northern Ireland. Quarterly Journal of Engineering Geology andHydrogeology, 49, 92–104, https://doi.org/10.1144/qjegh2014-101
Hughes, P.N., Glendinning, S., Mendes, J., Parkin, G., Toll, D.G., Gallipoli, D. &Miller, P. 2009. Full-scale testing to assess climate effects on embankments.Proceedings of the Institution of Civil Engineers: Engineering Sustainability,162, 67–79.
Huisman, J.A., Hubbard, S.S., Redman, J.D. &Annan, A.P. 2003.Measuring soilwater content with ground penetrating radar, a review. Vadose Zone Journal,2, 476–491, https://doi.org/10.2113/2.4.476
Hutchinson, D. 2015. Presentation at COST Action TU1202 workshop.Ljubjiana, Slovenia, October 2015.
Intrieri, E., Gigli, G., Mugnai, F., Fanti, R. & Casagli, N. 2012. Design andimplementation of a landslide early warning system. Engineering Geology,147, 124–136.
IPWEA 2006. International infrastructure management manual. Institute ofPublic Works Engineering Australasia, Sydney, Australia.
Jang, H.S., Kim, C.K., Lee, J.C., Lee, Y.D. & Oh, H.W. 2008. The analysis of roadside slopes using RG helicopter photogrammetric system. Proceedings of theXXIst ISPRS Congress, Beijing. ISPRS Archives, XXXVII(Part B4), 395–398.
Kane, W.F., Beck, T.J. & Hughes, J.J. 2001. Applications of time domainreflectometry to landslide and slope monitoring. In: Second InternationalSymposium and Workshop on Time Domain Reflectometry for InnovativeGeotechnical Applications. Infrastructure Technology Institute atNorthwestern University, Evanston, IL, 305–314.
Kuras, O., Meldrum, P.I., Beamish, D., Ogilvy, R.D. & Lala, D. 2007. Capacitiveresistivity imaging with towed arrays. Journal of Environmental andEngineering Geophysics, 12, 267–279.
285Instrumentation and monitoring of engineered slopes
by guest on April 6, 2020http://qjegh.lyellcollection.org/Downloaded from
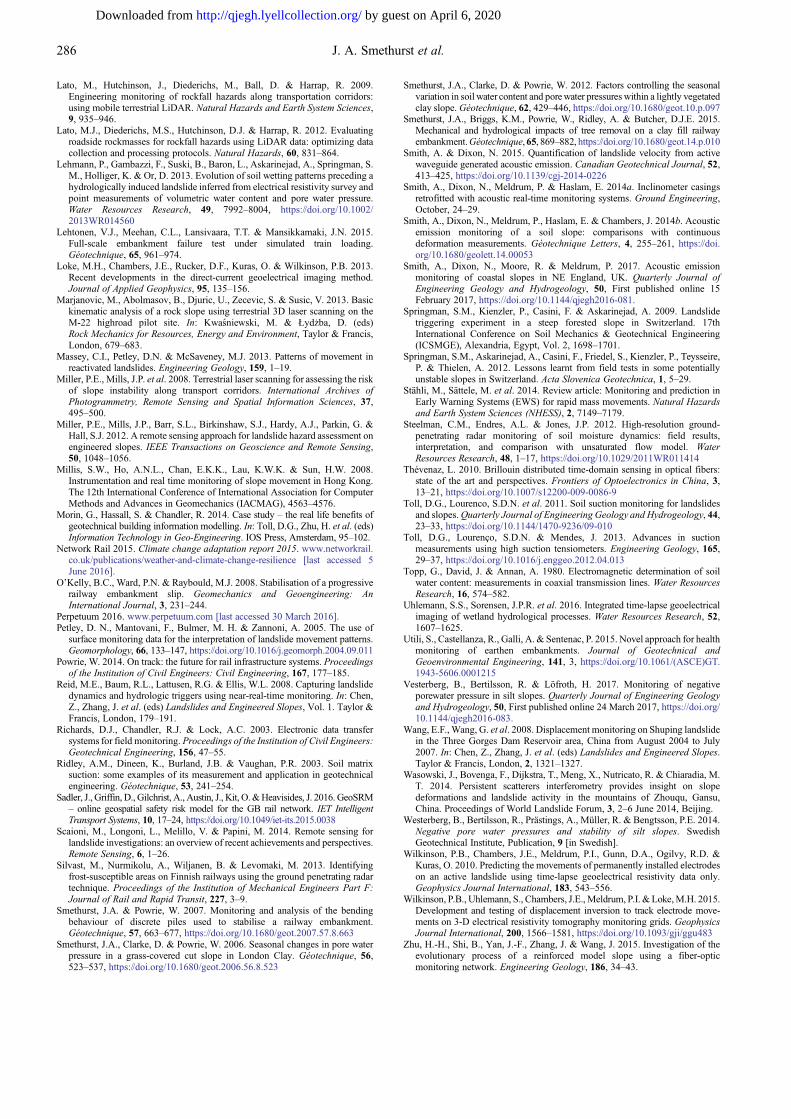
Lato, M., Hutchinson, J., Diederichs, M., Ball, D. & Harrap, R. 2009.Engineering monitoring of rockfall hazards along transportation corridors:using mobile terrestrial LiDAR. Natural Hazards and Earth System Sciences,9, 935–946.
Lato, M.J., Diederichs, M.S., Hutchinson, D.J. & Harrap, R. 2012. Evaluatingroadside rockmasses for rockfall hazards using LiDAR data: optimizing datacollection and processing protocols. Natural Hazards, 60, 831–864.
Lehmann, P., Gambazzi, F., Suski, B., Baron, L., Askarinejad, A., Springman, S.M., Holliger, K. & Or, D. 2013. Evolution of soil wetting patterns preceding ahydrologically induced landslide inferred from electrical resistivity survey andpoint measurements of volumetric water content and pore water pressure.Water Resources Research, 49, 7992–8004, https://doi.org/10.1002/2013WR014560
Lehtonen, V.J., Meehan, C.L., Lansivaara, T.T. & Mansikkamaki, J.N. 2015.Full-scale embankment failure test under simulated train loading.Géotechnique, 65, 961–974.
Loke, M.H., Chambers, J.E., Rucker, D.F., Kuras, O. & Wilkinson, P.B. 2013.Recent developments in the direct-current geoelectrical imaging method.Journal of Applied Geophysics, 95, 135–156.
Marjanovic, M., Abolmasov, B., Djuric, U., Zecevic, S. & Susic, V. 2013. Basickinematic analysis of a rock slope using terrestrial 3D laser scanning on theM-22 highroad pilot site. In: Kwasniewski, M. & Łydzba, D. (eds)Rock Mechanics for Resources, Energy and Environment, Taylor & Francis,London, 679–683.
Massey, C.I., Petley, D.N. & McSaveney, M.J. 2013. Patterns of movement inreactivated landslides. Engineering Geology, 159, 1–19.
Miller, P.E., Mills, J.P. et al. 2008. Terrestrial laser scanning for assessing the riskof slope instability along transport corridors. International Archives ofPhotogrammetry, Remote Sensing and Spatial Information Sciences, 37,495–500.
Miller, P.E., Mills, J.P., Barr, S.L., Birkinshaw, S.J., Hardy, A.J., Parkin, G. &Hall, S.J. 2012. A remote sensing approach for landslide hazard assessment onengineered slopes. IEEE Transactions on Geoscience and Remote Sensing,50, 1048–1056.
Millis, S.W., Ho, A.N.L., Chan, E.K.K., Lau, K.W.K. & Sun, H.W. 2008.Instrumentation and real time monitoring of slope movement in Hong Kong.The 12th International Conference of International Association for ComputerMethods and Advances in Geomechanics (IACMAG), 4563–4576.
Morin, G., Hassall, S. & Chandler, R. 2014. Case study – the real life benefits ofgeotechnical building information modelling. In: Toll, D.G., Zhu, H. et al. (eds)Information Technology in Geo-Engineering. IOS Press, Amsterdam, 95–102.
Network Rail 2015. Climate change adaptation report 2015. www.networkrail.co.uk/publications/weather-and-climate-change-resilience [last accessed 5June 2016].
O’Kelly, B.C., Ward, P.N. & Raybould, M.J. 2008. Stabilisation of a progressiverailway embankment slip. Geomechanics and Geoengineering: AnInternational Journal, 3, 231–244.
Perpetuum 2016. www.perpetuum.com [last accessed 30 March 2016].Petley, D. N., Mantovani, F., Bulmer, M. H. & Zannoni, A. 2005. The use of
surface monitoring data for the interpretation of landslide movement patterns.Geomorphology, 66, 133–147, https://doi.org/10.1016/j.geomorph.2004.09.011
Powrie, W. 2014. On track: the future for rail infrastructure systems. Proceedingsof the Institution of Civil Engineers: Civil Engineering, 167, 177–185.
Reid, M.E., Baum, R.L., Lattusen, R.G. & Ellis, W.L. 2008. Capturing landslidedynamics and hydrologic triggers using near-real-time monitoring. In: Chen,Z., Zhang, J. et al. (eds) Landslides and Engineered Slopes, Vol. 1. Taylor &Francis, London, 179–191.
Richards, D.J., Chandler, R.J. & Lock, A.C. 2003. Electronic data transfersystems for field monitoring. Proceedings of the Institution of Civil Engineers:Geotechnical Engineering, 156, 47–55.
Ridley, A.M., Dineen, K., Burland, J.B. & Vaughan, P.R. 2003. Soil matrixsuction: some examples of its measurement and application in geotechnicalengineering. Géotechnique, 53, 241–254.
Sadler, J., Griffin, D., Gilchrist, A., Austin, J., Kit, O.&Heavisides, J. 2016. GeoSRM– online geospatial safety risk model for the GB rail network. IET IntelligentTransport Systems, 10, 17–24, https://doi.org/10.1049/iet-its.2015.0038
Scaioni, M., Longoni, L., Melillo, V. & Papini, M. 2014. Remote sensing forlandslide investigations: an overview of recent achievements and perspectives.Remote Sensing, 6, 1–26.
Silvast, M., Nurmikolu, A., Wiljanen, B. & Levomaki, M. 2013. Identifyingfrost-susceptible areas on Finnish railways using the ground penetrating radartechnique. Proceedings of the Institution of Mechanical Engineers Part F:Journal of Rail and Rapid Transit, 227, 3–9.
Smethurst, J.A. & Powrie, W. 2007. Monitoring and analysis of the bendingbehaviour of discrete piles used to stabilise a railway embankment.Géotechnique, 57, 663–677, https://doi.org/10.1680/geot.2007.57.8.663
Smethurst, J.A., Clarke, D. & Powrie, W. 2006. Seasonal changes in pore waterpressure in a grass-covered cut slope in London Clay. Géotechnique, 56,523–537, https://doi.org/10.1680/geot.2006.56.8.523
Smethurst, J.A., Clarke, D. & Powrie, W. 2012. Factors controlling the seasonalvariation in soil water content and porewater pressures within a lightly vegetatedclay slope. Géotechnique, 62, 429–446, https://doi.org/10.1680/geot.10.p.097
Smethurst, J.A., Briggs, K.M., Powrie, W., Ridley, A. & Butcher, D.J.E. 2015.Mechanical and hydrological impacts of tree removal on a clay fill railwayembankment.Géotechnique,65, 869–882, https://doi.org/10.1680/geot.14.p.010
Smith, A. & Dixon, N. 2015. Quantification of landslide velocity from activewaveguide generated acoustic emission. Canadian Geotechnical Journal, 52,413–425, https://doi.org/10.1139/cgj-2014-0226
Smith, A., Dixon, N., Meldrum, P. & Haslam, E. 2014a. Inclinometer casingsretrofitted with acoustic real-time monitoring systems. Ground Engineering,October, 24–29.
Smith, A., Dixon, N., Meldrum, P., Haslam, E. & Chambers, J. 2014b. Acousticemission monitoring of a soil slope: comparisons with continuousdeformation measurements. Géotechnique Letters, 4, 255–261, https://doi.org/10.1680/geolett.14.00053
Smith, A., Dixon, N., Moore, R. & Meldrum, P. 2017. Acoustic emissionmonitoring of coastal slopes in NE England, UK. Quarterly Journal ofEngineering Geology and Hydrogeology, 50, First published online 15February 2017, https://doi.org/10.1144/qjegh2016-081.
Springman, S.M., Kienzler, P., Casini, F. & Askarinejad, A. 2009. Landslidetriggering experiment in a steep forested slope in Switzerland. 17thInternational Conference on Soil Mechanics & Geotechnical Engineering(ICSMGE), Alexandria, Egypt, Vol. 2, 1698–1701.
Springman, S.M., Askarinejad, A., Casini, F., Friedel, S., Kienzler, P., Teysseire,P. & Thielen, A. 2012. Lessons learnt from field tests in some potentiallyunstable slopes in Switzerland. Acta Slovenica Geotechnica, 1, 5–29.
Stähli, M., Sättele, M. et al. 2014. Review article: Monitoring and prediction inEarly Warning Systems (EWS) for rapid mass movements. Natural Hazardsand Earth System Sciences (NHESS), 2, 7149–7179.
Steelman, C.M., Endres, A.L. & Jones, J.P. 2012. High-resolution ground-penetrating radar monitoring of soil moisture dynamics: field results,interpretation, and comparison with unsaturated flow model. WaterResources Research, 48, 1–17, https://doi.org/10.1029/2011WR011414
Thévenaz, L. 2010. Brillouin distributed time-domain sensing in optical fibers:state of the art and perspectives. Frontiers of Optoelectronics in China, 3,13–21, https://doi.org/10.1007/s12200-009-0086-9
Toll, D.G., Lourenco, S.D.N. et al. 2011. Soil suction monitoring for landslidesand slopes.Quarterly Journal of Engineering Geology and Hydrogeology, 44,23–33, https://doi.org/10.1144/1470-9236/09-010
Toll, D.G., Lourenço, S.D.N. & Mendes, J. 2013. Advances in suctionmeasurements using high suction tensiometers. Engineering Geology, 165,29–37, https://doi.org/10.1016/j.enggeo.2012.04.013
Topp, G., David, J. & Annan, A. 1980. Electromagnetic determination of soilwater content: measurements in coaxial transmission lines. Water ResourcesResearch, 16, 574–582.
Uhlemann, S.S., Sorensen, J.P.R. et al. 2016. Integrated time-lapse geoelectricalimaging of wetland hydrological processes. Water Resources Research, 52,1607–1625.
Utili, S., Castellanza, R., Galli, A. & Sentenac, P. 2015. Novel approach for healthmonitoring of earthen embankments. Journal of Geotechnical andGeoenvironmental Engineering, 141, 3, https://doi.org/10.1061/(ASCE)GT.1943-5606.0001215
Vesterberg, B., Bertilsson, R. & Löfroth, H. 2017. Monitoring of negativeporewater pressure in silt slopes. Quarterly Journal of Engineering Geologyand Hydrogeology, 50, First published online 24 March 2017, https://doi.org/10.1144/qjegh2016-083.
Wang, E.F.,Wang, G. et al. 2008. Displacement monitoring on Shuping landslidein the Three Gorges Dam Reservoir area, China from August 2004 to July2007. In: Chen, Z., Zhang, J. et al. (eds) Landslides and Engineered Slopes.Taylor & Francis, London, 2, 1321–1327.
Wasowski, J., Bovenga, F., Dijkstra, T., Meng, X., Nutricato, R. & Chiaradia, M.T. 2014. Persistent scatterers interferometry provides insight on slopedeformations and landslide activity in the mountains of Zhouqu, Gansu,China. Proceedings of World Landslide Forum, 3, 2–6 June 2014, Beijing.
Westerberg, B., Bertilsson, R., Prästings, A., Müller, R. & Bengtsson, P.E. 2014.Negative pore water pressures and stability of silt slopes. SwedishGeotechnical Institute, Publication, 9 [in Swedish].
Wilkinson, P.B., Chambers, J.E., Meldrum, P.I., Gunn, D.A., Ogilvy, R.D. &Kuras, O. 2010. Predicting the movements of permanently installed electrodeson an active landslide using time-lapse geoelectrical resistivity data only.Geophysics Journal International, 183, 543–556.
Wilkinson, P.B., Uhlemann, S., Chambers, J.E.,Meldrum, P.I. & Loke,M.H. 2015.Development and testing of displacement inversion to track electrode move-ments on 3-D electrical resistivity tomography monitoring grids. GeophysicsJournal International, 200, 1566–1581, https://doi.org/10.1093/gji/ggu483
Zhu, H.-H., Shi, B., Yan, J.-F., Zhang, J. & Wang, J. 2015. Investigation of theevolutionary process of a reinforced model slope using a fiber-opticmonitoring network. Engineering Geology, 186, 34–43.
286 J. A. Smethurst et al.
by guest on April 6, 2020http://qjegh.lyellcollection.org/Downloaded from