Embed Size (px)
Citation preview
Global Research
Market focus pg 2
Since early 2011, AUD-NZD has fallen about 20% and for much of this year has been
trading close to the lowest levels seen since the currencies were both floated in the 1980s.
The fall in the cross rate reflects a combination of the AUD giving back ground and the
NZD continuing to trend higher. The recent jump in AUD-NZD following the RBNZ
meeting is not consistent with the fundamentals and we expect the fall to resume.
The main reason for the sustained fall in the cross has been the shift in relative interest
rate expectations. While the RBA has been on hold since its last rate cut in August 2013,
the RBNZ has raised rates by a total of 100bp since the beginning of this year. For the
next few months, both sets of policymakers are likely to keep rates on hold, and AUD-
NZD may continue to tread water for now. Both central banks are trying to talk their
respective currencies down.
Beyond the short term, we expect the cross to head lower again, and to challenge parity by
the end of the year. This view is based on three factors:
1. Relative growth prospects: The New Zealand economy continues to grow faster
than long-term potential, whereas higher unemployment suggests Australia still
has slack in the economy.
2. Relative commodity prices: Slower growth in China has hit Australia’s
commodity export prices much more than those in New Zealand. The Australian
mining investment boom is fading, and the rebalancing of growth has been very
slow.
3. Relative valuation: Although both currencies remain ‘overvalued’ relative to
PPP, and both central banks would like to see their currencies lower, AUD is
about 10% more ‘overvalued’ than NZD.
It may not yet be quite time to book your parity party, but you should at least be checking
out venues.
Quant indicators pg 10
Regular updates of our quantitative indicators. This includes an overview of the
correlations between all G10 exchange rates; a series of indicators that measure the
dominance of the ‘risk on – risk off’ phenomenon, including new emerging markets
RORO analysis; and indices that quantify the market’s appetite for risk.
24 July 2014
Currency Weekly
AUD-NZD: book your parity party, but not yet
Macro
Currency Strategy
David Bloom
Strategist
HSBC Bank plc
+44 20 7991 5969
Paul Mackel
Strategist
The Hongkong and Shanghai Banking
Corporation Limited
+852 2996 6565
Daragh Maher
Strategist
HSBC Bank plc
+44 20 7991 5968
Stacy Williams
Strategist
HSBC Bank plc
+44 20 7991 5967
Mark McDonald
Strategist
HSBC Bank plc
+44 20 7991 5966
Robert Lynch
Strategist
HSBC Securities (USA) Inc
+1 212 525 3159
Mark Austin
Consultant
View HSBC Global Research at: http://www.research.hsbc.com
Issuer of report: HSBC Bank plc
Disclaimer & Disclosures This report must be read with the disclosures and the analyst certifications in the Disclosure appendix, and with the Disclaimer, which forms part of it
2
Macro
Currency Strategy
24 July 2014
AUD-NZD: book your parity party, but not yet
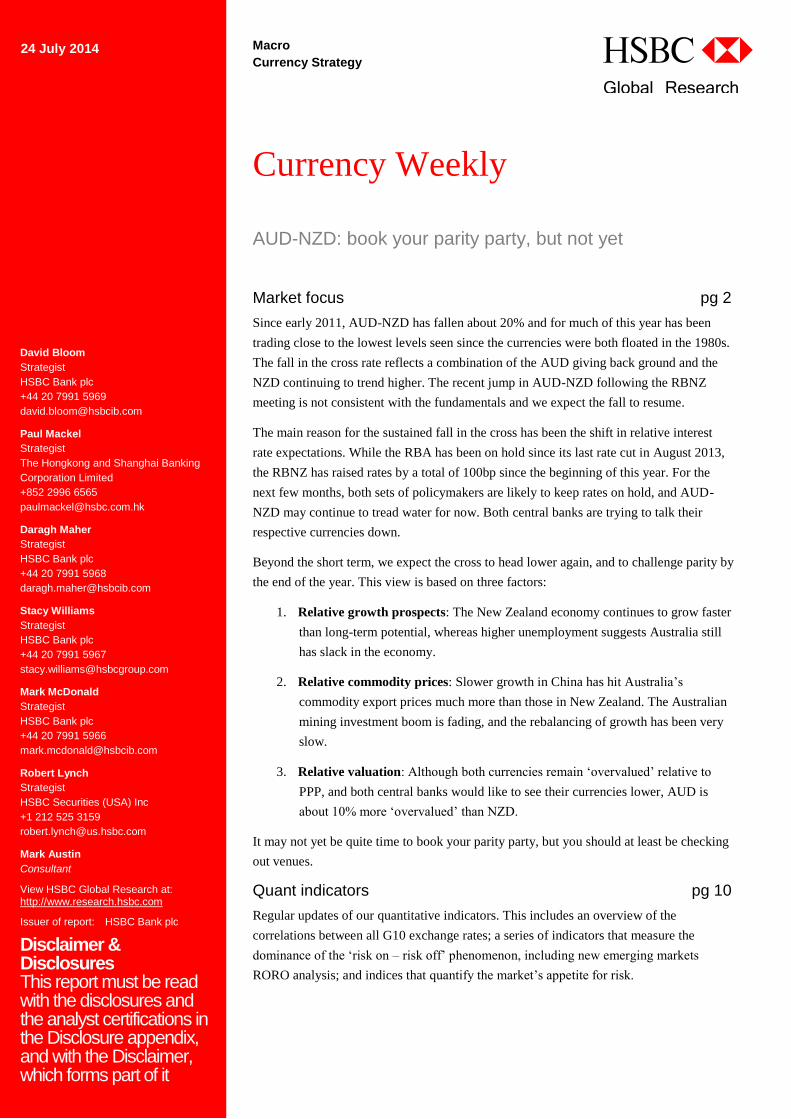
The weakness of the NZD in the immediate aftermath of the Christchurch earthquake took the AUD-NZD
cross to a high of about 1.38 in March 2011. Since then, as the New Zealand economy has bounced back
and Australia has seen its mining boom begin to fade, the cross has fallen by about 20%, getting close to
1.05 earlier this year (chart 1).
1. AUD-NZD down about 20% since early 2011
1.05
1.10
1.15
1.20
1.25
1.30
1.35
1.40
1.05
1.10
1.15
1.20
1.25
1.30
1.35
1.40
Jan-11 Apr-11 Jul-11 Oct-11 Jan-12 Apr-12 Jul-12 Oct-12 Jan-13 Apr-13 Jul-13 Oct-13 Jan-14 Apr-14 Jul-14
AUD-NZD
Source: Bloomberg, HSBC
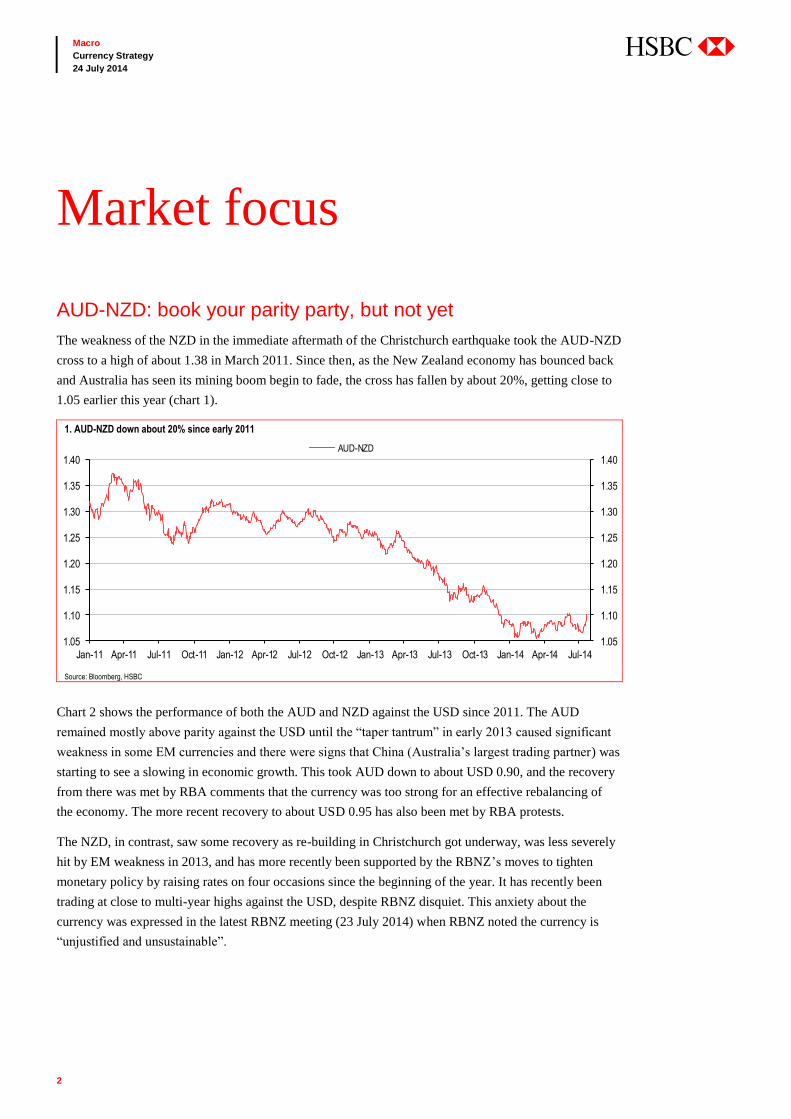
Chart 2 shows the performance of both the AUD and NZD against the USD since 2011. The AUD
remained mostly above parity against the USD until the “taper tantrum” in early 2013 caused significant
weakness in some EM currencies and there were signs that China (Australia’s largest trading partner) was
starting to see a slowing in economic growth. This took AUD down to about USD 0.90, and the recovery
from there was met by RBA comments that the currency was too strong for an effective rebalancing of
the economy. The more recent recovery to about USD 0.95 has also been met by RBA protests.
The NZD, in contrast, saw some recovery as re-building in Christchurch got underway, was less severely
hit by EM weakness in 2013, and has more recently been supported by the RBNZ’s moves to tighten
monetary policy by raising rates on four occasions since the beginning of the year. It has recently been
trading at close to multi-year highs against the USD, despite RBNZ disquiet. This anxiety about the
currency was expressed in the latest RBNZ meeting (23 July 2014) when RBNZ noted the currency is
“unjustified and unsustainable”.
Market focus
3
Macro
Currency Strategy
24 July 2014
2. AUD is well off its highs, but NZD is still trending up
0.70
0.75
0.80
0.85
0.90
0.95
1.00
1.05
1.10
0.70
0.75
0.80
0.85
0.90
0.95
1.00
1.05
1.10
Jan-11 Jul-11 Jan-12 Jul-12 Jan-13 Jul-13 Jan-14 Jul-14
AUD NZD
Source: Bloomberg, HSBC
Can the cross make new lows?
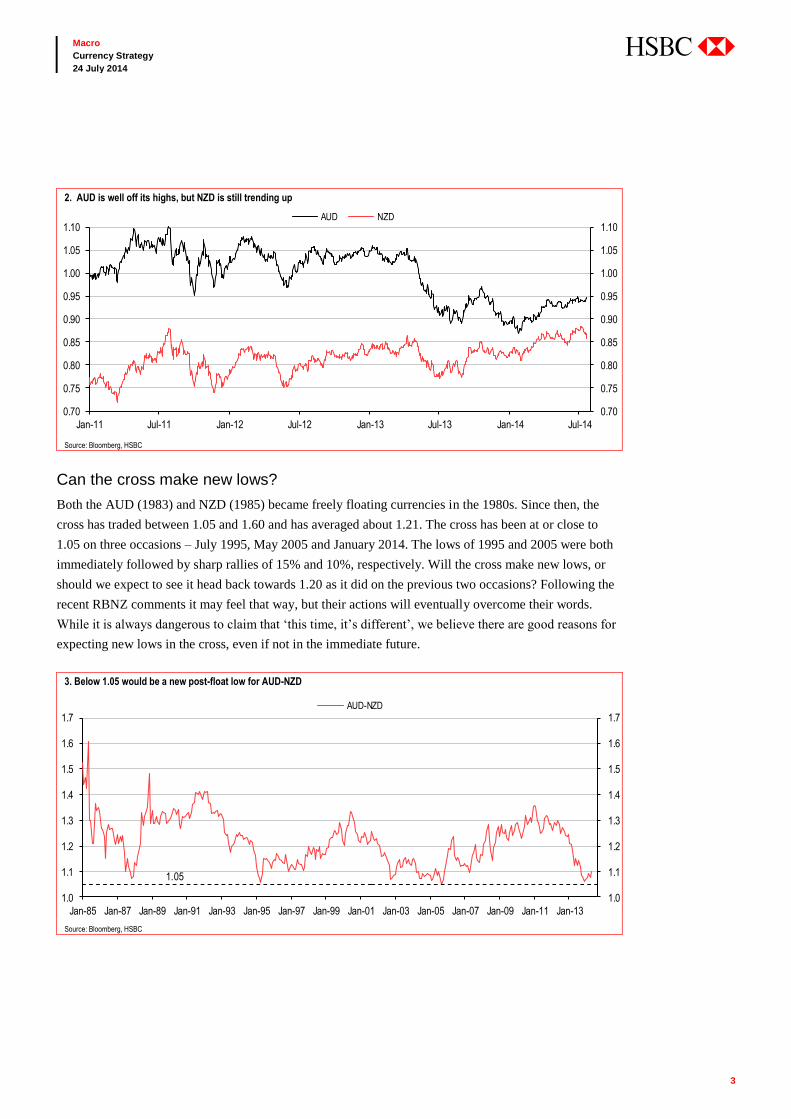
Both the AUD (1983) and NZD (1985) became freely floating currencies in the 1980s. Since then, the
cross has traded between 1.05 and 1.60 and has averaged about 1.21. The cross has been at or close to
1.05 on three occasions – July 1995, May 2005 and January 2014. The lows of 1995 and 2005 were both
immediately followed by sharp rallies of 15% and 10%, respectively. Will the cross make new lows, or
should we expect to see it head back towards 1.20 as it did on the previous two occasions? Following the
recent RBNZ comments it may feel that way, but their actions will eventually overcome their words.
While it is always dangerous to claim that ‘this time, it’s different’, we believe there are good reasons for
expecting new lows in the cross, even if not in the immediate future.
3. Below 1.05 would be a new post-float low for AUD-NZD
1.0
1.1
1.2
1.3
1.4
1.5
1.6
1.7
1.0
1.1
1.2
1.3
1.4
1.5
1.6
1.7
Jan-85 Jan-87 Jan-89 Jan-91 Jan-93 Jan-95 Jan-97 Jan-99 Jan-01 Jan-03 Jan-05 Jan-07 Jan-09 Jan-11 Jan-13
AUD-NZD
1.05
Source: Bloomberg, HSBC
4
Macro
Currency Strategy
24 July 2014
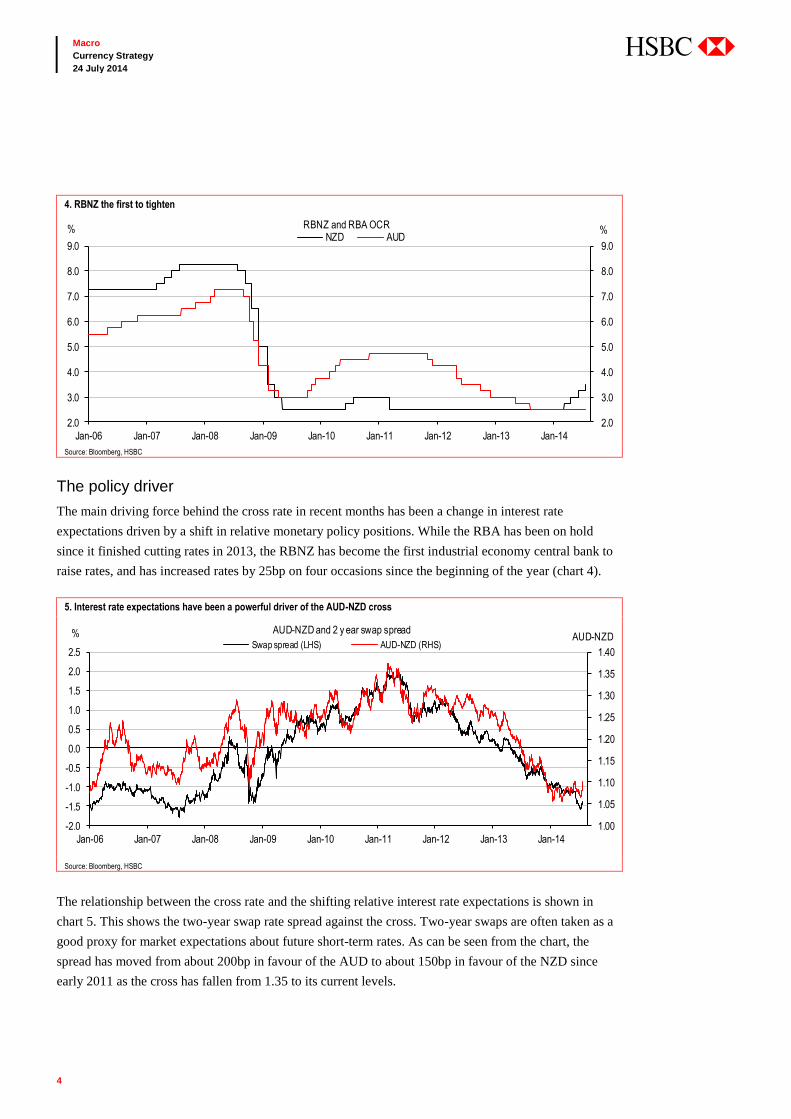
The policy driver
The main driving force behind the cross rate in recent months has been a change in interest rate
expectations driven by a shift in relative monetary policy positions. While the RBA has been on hold
since it finished cutting rates in 2013, the RBNZ has become the first industrial economy central bank to
raise rates, and has increased rates by 25bp on four occasions since the beginning of the year (chart 4).
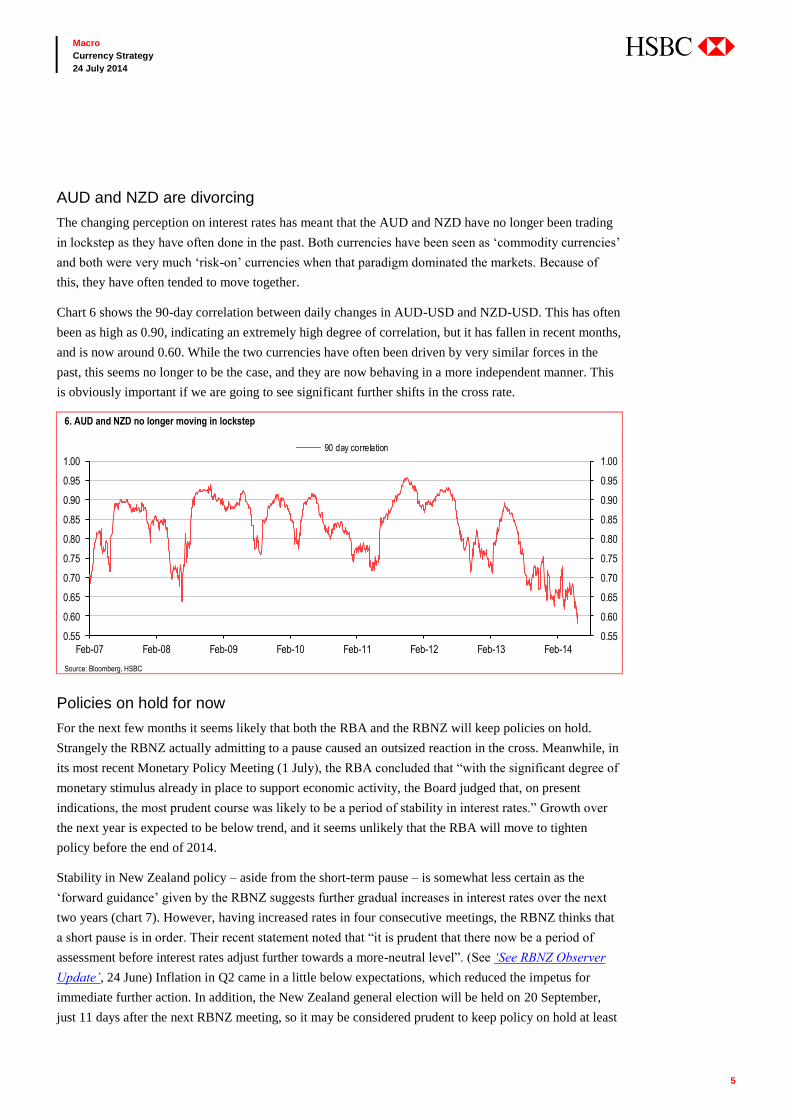
The relationship between the cross rate and the shifting relative interest rate expectations is shown in
chart 5. This shows the two-year swap rate spread against the cross. Two-year swaps are often taken as a
good proxy for market expectations about future short-term rates. As can be seen from the chart, the
spread has moved from about 200bp in favour of the AUD to about 150bp in favour of the NZD since
early 2011 as the cross has fallen from 1.35 to its current levels.
4. RBNZ the first to tighten
2.0
3.0
4.0
5.0
6.0
7.0
8.0
9.0
2.0
3.0
4.0
5.0
6.0
7.0
8.0
9.0
Jan-06 Jan-07 Jan-08 Jan-09 Jan-10 Jan-11 Jan-12 Jan-13 Jan-14
NZD AUD% %
RBNZ and RBA OCR
Source: Bloomberg, HSBC
5. Interest rate expectations have been a powerful driver of the AUD-NZD cross
1.00
1.05
1.10
1.15
1.20
1.25
1.30
1.35
1.40
-2.0
-1.5
-1.0
-0.5
0.0
0.5
1.0
1.5
2.0
2.5
Jan-06 Jan-07 Jan-08 Jan-09 Jan-10 Jan-11 Jan-12 Jan-13 Jan-14
Swap spread (LHS) AUD-NZD (RHS)% AUD-NZD
AUD-NZD and 2 y ear swap spread
Source: Bloomberg, HSBC
5
Macro
Currency Strategy
24 July 2014
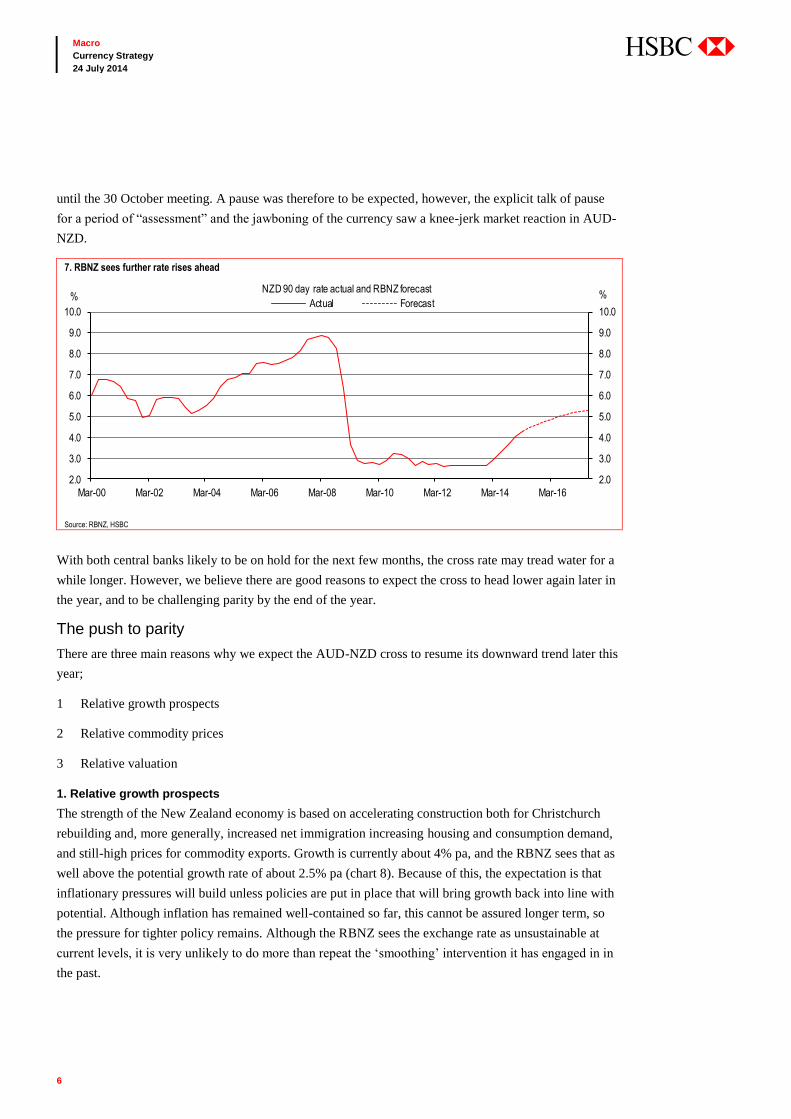
AUD and NZD are divorcing
The changing perception on interest rates has meant that the AUD and NZD have no longer been trading
in lockstep as they have often done in the past. Both currencies have been seen as ‘commodity currencies’
and both were very much ‘risk-on’ currencies when that paradigm dominated the markets. Because of
this, they have often tended to move together.
Chart 6 shows the 90-day correlation between daily changes in AUD-USD and NZD-USD. This has often
been as high as 0.90, indicating an extremely high degree of correlation, but it has fallen in recent months,
and is now around 0.60. While the two currencies have often been driven by very similar forces in the
past, this seems no longer to be the case, and they are now behaving in a more independent manner. This
is obviously important if we are going to see significant further shifts in the cross rate.
6. AUD and NZD no longer moving in lockstep
0.55
0.60
0.65
0.70
0.75
0.80
0.85
0.90
0.95
1.00
0.55
0.60
0.65
0.70
0.75
0.80
0.85
0.90
0.95
1.00
Feb-07 Feb-08 Feb-09 Feb-10 Feb-11 Feb-12 Feb-13 Feb-14
90 day correlation
Source: Bloomberg, HSBC
Policies on hold for now
For the next few months it seems likely that both the RBA and the RBNZ will keep policies on hold.
Strangely the RBNZ actually admitting to a pause caused an outsized reaction in the cross. Meanwhile, in
its most recent Monetary Policy Meeting (1 July), the RBA concluded that “with the significant degree of
monetary stimulus already in place to support economic activity, the Board judged that, on present
indications, the most prudent course was likely to be a period of stability in interest rates.” Growth over
the next year is expected to be below trend, and it seems unlikely that the RBA will move to tighten
policy before the end of 2014.
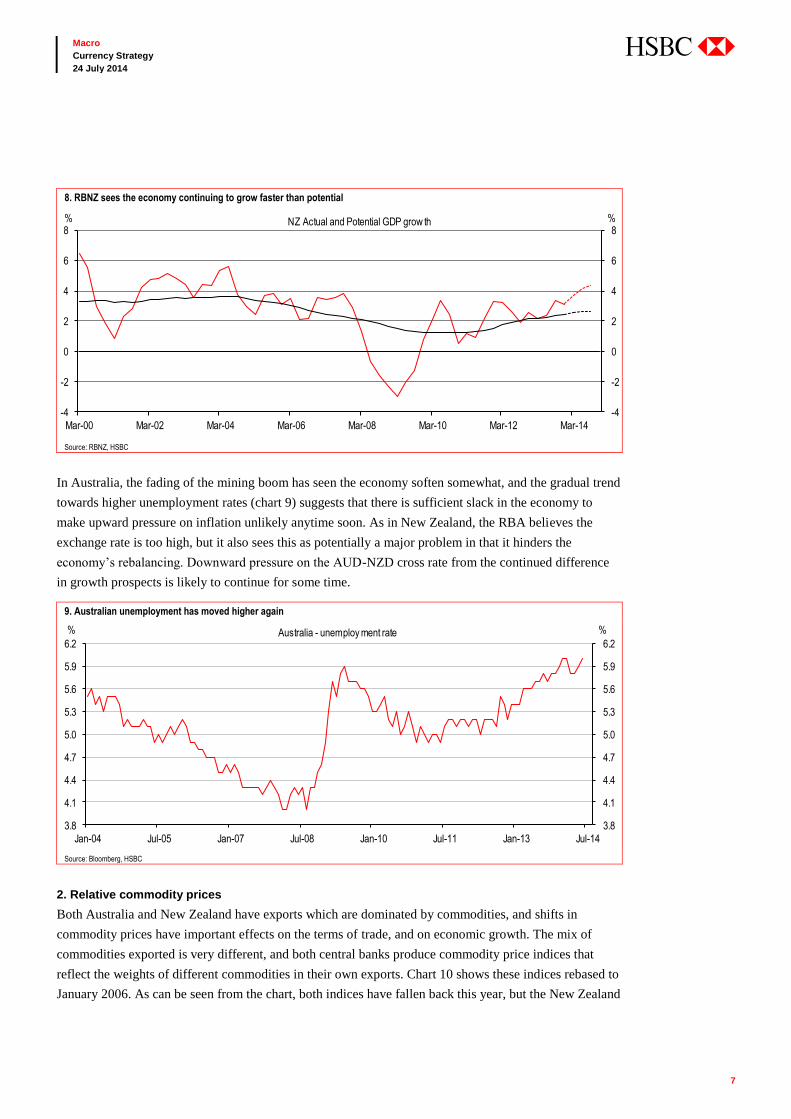
Stability in New Zealand policy – aside from the short-term pause – is somewhat less certain as the
‘forward guidance’ given by the RBNZ suggests further gradual increases in interest rates over the next
two years (chart 7). However, having increased rates in four consecutive meetings, the RBNZ thinks that
a short pause is in order. Their recent statement noted that “it is prudent that there now be a period of
assessment before interest rates adjust further towards a more-neutral level”. (See ‘See RBNZ Observer
Update’, 24 June) Inflation in Q2 came in a little below expectations, which reduced the impetus for
immediate further action. In addition, the New Zealand general election will be held on 20 September,
just 11 days after the next RBNZ meeting, so it may be considered prudent to keep policy on hold at least
6
Macro
Currency Strategy
24 July 2014
until the 30 October meeting. A pause was therefore to be expected, however, the explicit talk of pause
for a period of “assessment” and the jawboning of the currency saw a knee-jerk market reaction in AUD-
NZD.
7. RBNZ sees further rate rises ahead
2.0
3.0
4.0
5.0
6.0
7.0
8.0
9.0
10.0
2.0
3.0
4.0
5.0
6.0
7.0
8.0
9.0
10.0
Mar-00 Mar-02 Mar-04 Mar-06 Mar-08 Mar-10 Mar-12 Mar-14 Mar-16
NZD 90 day rate actual and RBNZ forecast
Actual Forecast% %
Source: RBNZ, HSBC
With both central banks likely to be on hold for the next few months, the cross rate may tread water for a
while longer. However, we believe there are good reasons to expect the cross to head lower again later in
the year, and to be challenging parity by the end of the year.
The push to parity
There are three main reasons why we expect the AUD-NZD cross to resume its downward trend later this
year;
1 Relative growth prospects
2 Relative commodity prices
3 Relative valuation
1. Relative growth prospects
The strength of the New Zealand economy is based on accelerating construction both for Christchurch
rebuilding and, more generally, increased net immigration increasing housing and consumption demand,
and still-high prices for commodity exports. Growth is currently about 4% pa, and the RBNZ sees that as
well above the potential growth rate of about 2.5% pa (chart 8). Because of this, the expectation is that
inflationary pressures will build unless policies are put in place that will bring growth back into line with
potential. Although inflation has remained well-contained so far, this cannot be assured longer term, so
the pressure for tighter policy remains. Although the RBNZ sees the exchange rate as unsustainable at
current levels, it is very unlikely to do more than repeat the ‘smoothing’ intervention it has engaged in in
the past.
7
Macro
Currency Strategy
24 July 2014
8. RBNZ sees the economy continuing to grow faster than potential
-4
-2
0
2
4
6
8
-4
-2
0
2
4
6
8
Mar-00 Mar-02 Mar-04 Mar-06 Mar-08 Mar-10 Mar-12 Mar-14
NZ Actual and Potential GDP grow th% %
Source: RBNZ, HSBC
In Australia, the fading of the mining boom has seen the economy soften somewhat, and the gradual trend
towards higher unemployment rates (chart 9) suggests that there is sufficient slack in the economy to
make upward pressure on inflation unlikely anytime soon. As in New Zealand, the RBA believes the
exchange rate is too high, but it also sees this as potentially a major problem in that it hinders the
economy’s rebalancing. Downward pressure on the AUD-NZD cross rate from the continued difference
in growth prospects is likely to continue for some time.
9. Australian unemployment has moved higher again
3.8
4.1
4.4
4.7
5.0
5.3
5.6
5.9
6.2
3.8
4.1
4.4
4.7
5.0
5.3
5.6
5.9
6.2
Jan-04 Jul-05 Jan-07 Jul-08 Jan-10 Jul-11 Jan-13 Jul-14
% % Australia - unemploy ment rate
Source: Bloomberg, HSBC
2. Relative commodity prices
Both Australia and New Zealand have exports which are dominated by commodities, and shifts in
commodity prices have important effects on the terms of trade, and on economic growth. The mix of
commodities exported is very different, and both central banks produce commodity price indices that
reflect the weights of different commodities in their own exports. Chart 10 shows these indices rebased to
January 2006. As can be seen from the chart, both indices have fallen back this year, but the New Zealand
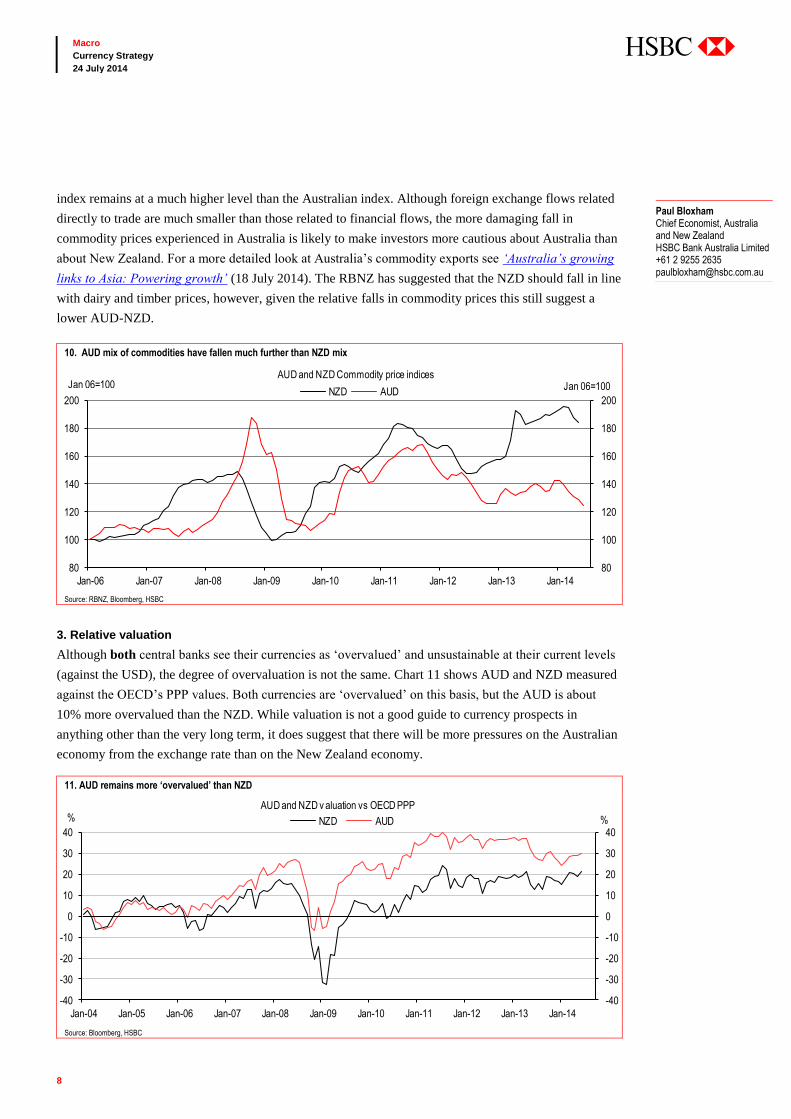
8
Macro
Currency Strategy
24 July 2014
index remains at a much higher level than the Australian index. Although foreign exchange flows related
directly to trade are much smaller than those related to financial flows, the more damaging fall in
commodity prices experienced in Australia is likely to make investors more cautious about Australia than
about New Zealand. For a more detailed look at Australia’s commodity exports see ‘Australia’s growing
links to Asia: Powering growth’ (18 July 2014). The RBNZ has suggested that the NZD should fall in line
with dairy and timber prices, however, given the relative falls in commodity prices this still suggest a
lower AUD-NZD.
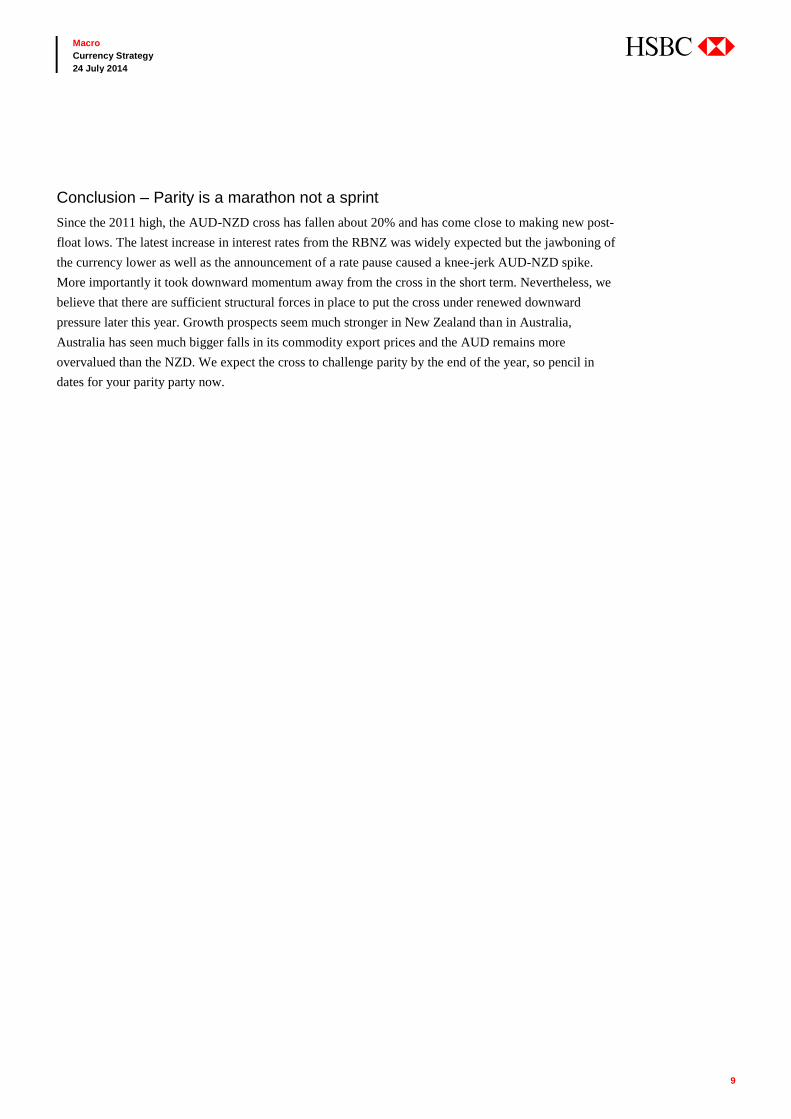
3. Relative valuation
Although both central banks see their currencies as ‘overvalued’ and unsustainable at their current levels
(against the USD), the degree of overvaluation is not the same. Chart 11 shows AUD and NZD measured
against the OECD’s PPP values. Both currencies are ‘overvalued’ on this basis, but the AUD is about
10% more overvalued than the NZD. While valuation is not a good guide to currency prospects in
anything other than the very long term, it does suggest that there will be more pressures on the Australian
economy from the exchange rate than on the New Zealand economy.
Paul Bloxham Chief Economist, Australia and New Zealand HSBC Bank Australia Limited +61 2 9255 2635 [email protected]
10. AUD mix of commodities have fallen much further than NZD mix
80
100
120
140
160
180
200
80
100
120
140
160
180
200
Jan-06 Jan-07 Jan-08 Jan-09 Jan-10 Jan-11 Jan-12 Jan-13 Jan-14
AUD and NZD Commodity price indices
NZD AUDJan 06=100 Jan 06=100
Source: RBNZ, Bloomberg, HSBC
11. AUD remains more ‘overvalued’ than NZD
-40
-30
-20
-10
0
10
20
30
40
-40
-30
-20
-10
0
10
20
30
40
Jan-04 Jan-05 Jan-06 Jan-07 Jan-08 Jan-09 Jan-10 Jan-11 Jan-12 Jan-13 Jan-14
NZD AUD
AUD and NZD v aluation vs OECD PPP% %
Source: Bloomberg, HSBC
9
Macro
Currency Strategy
24 July 2014
Conclusion – Parity is a marathon not a sprint
Since the 2011 high, the AUD-NZD cross has fallen about 20% and has come close to making new post-
float lows. The latest increase in interest rates from the RBNZ was widely expected but the jawboning of
the currency lower as well as the announcement of a rate pause caused a knee-jerk AUD-NZD spike.
More importantly it took downward momentum away from the cross in the short term. Nevertheless, we
believe that there are sufficient structural forces in place to put the cross under renewed downward
pressure later this year. Growth prospects seem much stronger in New Zealand than in Australia,
Australia has seen much bigger falls in its commodity export prices and the AUD remains more
overvalued than the NZD. We expect the cross to challenge parity by the end of the year, so pencil in
dates for your parity party now.
10
Macro
Currency Strategy
24 July 2014
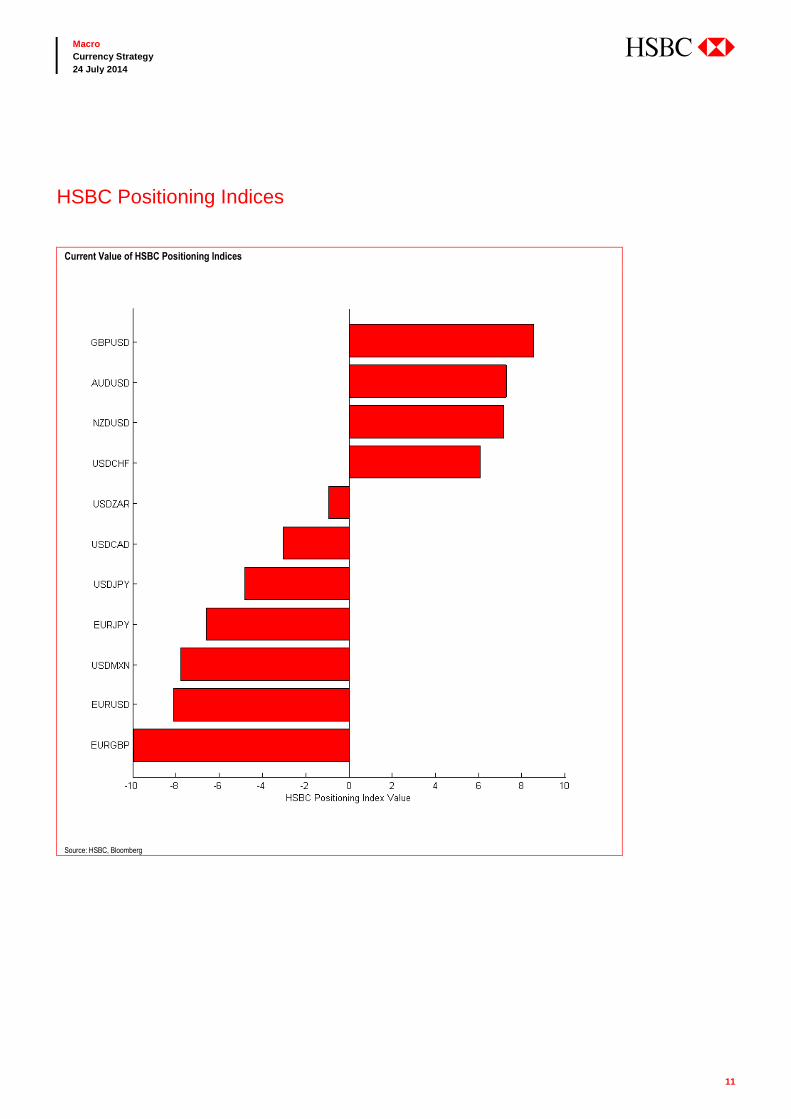
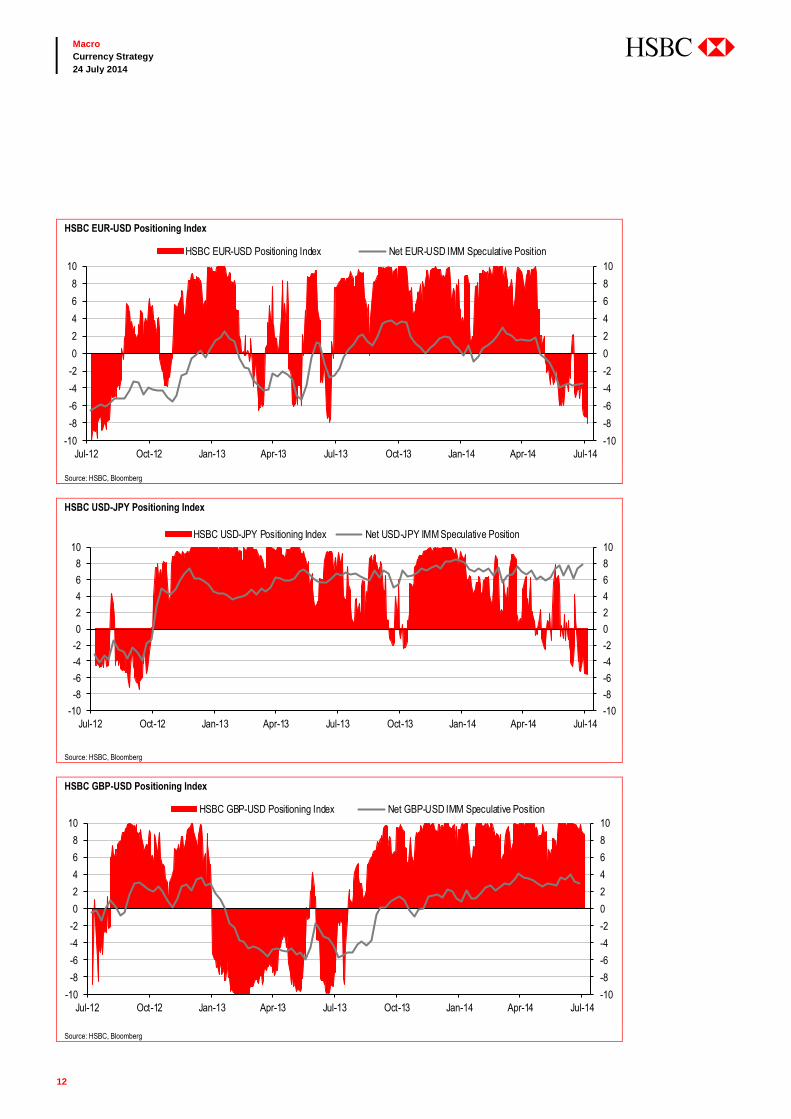
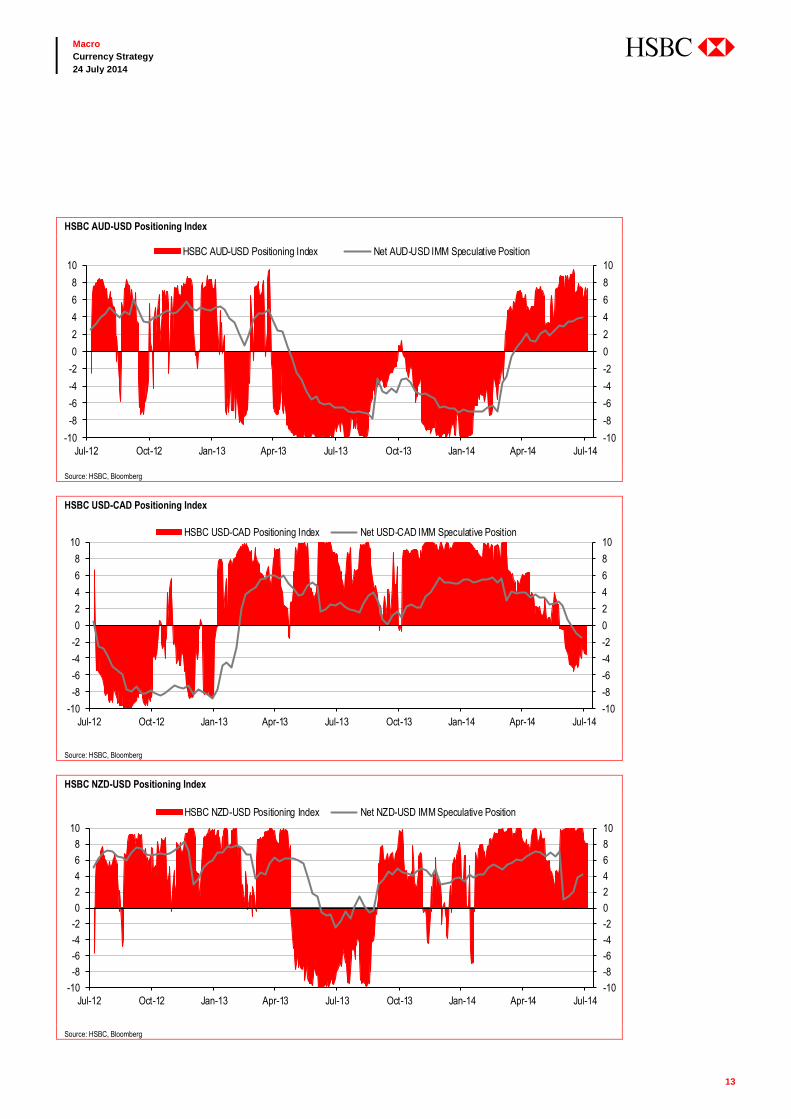
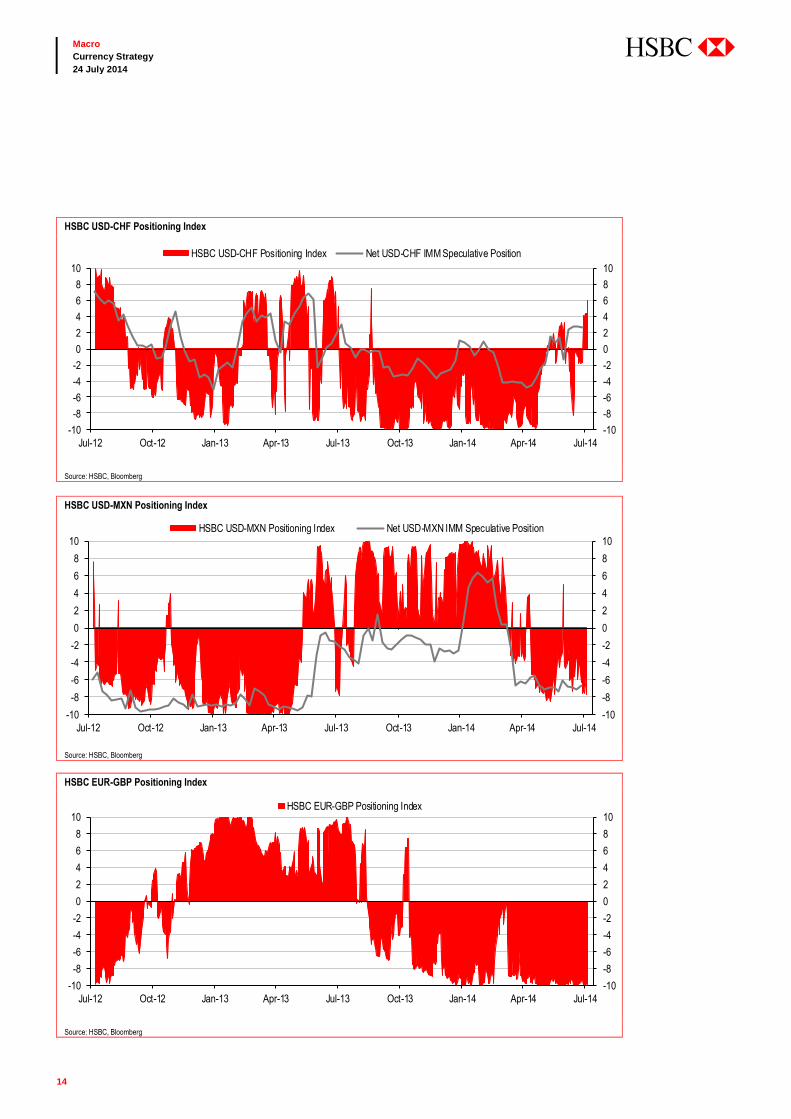
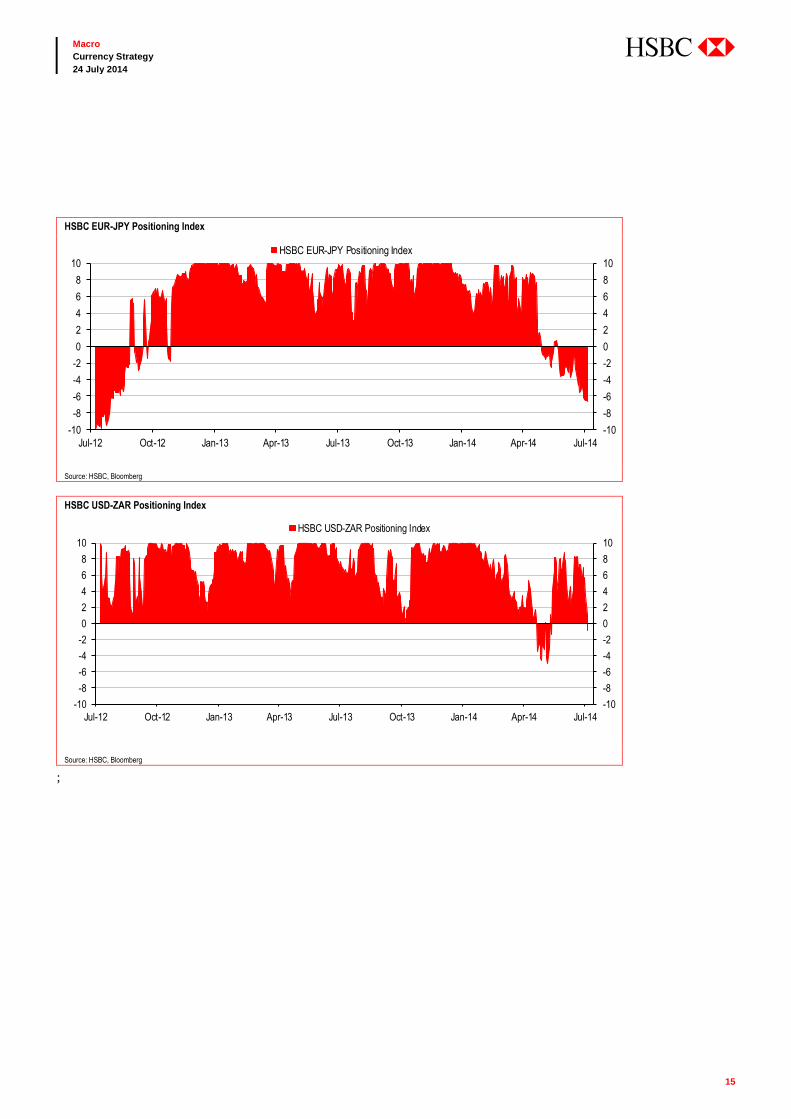
1. HSBC Positioning Indicators (pg 11)
The HSBC Positioning Indicators measure the degree to which the momentum community is either long
or short of a currency pair. For exchange rates where position data is available from the IMM, we
compare the two sources of data. Discrepancies between these two sources of data can be particularly
informative about positioning and sentiment of fundamental FX traders.
2. Correlation Analysis: Multi-Asset (RORO) & G10 FX (pg 16)
(a) RORO Index – multi-asset correlations
The RORO Index is at moderate levels. Correlations are higher than in pre-crisis times but far weaker
than was typical during the crisis.
(b) Emerging Market RORO Indices
Regional correlations within EM regions are at moderate levels. The regional EM-common-factors
remain risk-on but correlations within EM regions have weakened.
(c) Equity RORO Index
The Equity RORO index measures the strength of correlations within the main “risky” asset class
of equities. The Equity RORO Index is significantly lower than the all-time highs seen in late 2011, but is
still above pre-crisis levels.
(d) High-frequency G10 FX correlations
We show the strength of the correlations between all G10 exchange rates, calculated using hourly FX
price data.
3. Risk Appetite: OPRA Index and MRAI (pg 25)
The OPRA index measures risk appetite based on the positions held in contracts with varying degrees of
risk by speculative traders on US futures exchanges. The OPRA Index is in neutral territory; this
indicates that speculative traders on the US futures exchanges have shifted their exposure in a way
unrelated to the risk of holding them.
The MRAI has generally moved sideways with high volatility since May 2010. This is indicative of
neutral risk appetite and is consistent with the RORO phenomenon.
Quant Indicators
11
Macro
Currency Strategy
24 July 2014
HSBC Positioning Indices
Current Value of HSBC Positioning Indices
Source: HSBC, Bloomberg
12
Macro
Currency Strategy
24 July 2014
HSBC EUR-USD Positioning Index
-10
-8
-6
-4
-2
0
2
4
6
8
10
Jul-12 Oct-12 Jan-13 Apr-13 Jul-13 Oct-13 Jan-14 Apr-14 Jul-14
-10
-8
-6
-4
-2
0
2
4
6
8
10
HSBC EUR-USD Positioning Index Net EUR-USD IMM Speculative Position
Source: HSBC, Bloomberg
HSBC USD-JPY Positioning Index
-10
-8
-6
-4
-2
0
2
4
6
8
10
Jul-12 Oct-12 Jan-13 Apr-13 Jul-13 Oct-13 Jan-14 Apr-14 Jul-14
-10
-8
-6
-4
-2
0
2
4
6
8
10
HSBC USD-JPY Positioning Index Net USD-JPY IMM Speculative Position
Source: HSBC, Bloomberg
HSBC GBP-USD Positioning Index
-10
-8
-6
-4
-2
0
2
4
6
8
10
Jul-12 Oct-12 Jan-13 Apr-13 Jul-13 Oct-13 Jan-14 Apr-14 Jul-14
-10
-8
-6
-4
-2
0
2
4
6
8
10
HSBC GBP-USD Positioning Index Net GBP-USD IMM Speculative Position
Source: HSBC, Bloomberg
13
Macro
Currency Strategy
24 July 2014
HSBC AUD-USD Positioning Index
-10
-8
-6
-4
-2
0
2
4
6
8
10
Jul-12 Oct-12 Jan-13 Apr-13 Jul-13 Oct-13 Jan-14 Apr-14 Jul-14
-10
-8
-6
-4
-2
0
2
4
6
8
10
HSBC AUD-USD Positioning Index Net AUD-USD IMM Speculative Position
Source: HSBC, Bloomberg
HSBC USD-CAD Positioning Index
-10
-8
-6
-4
-2
0
2
4
6
8
10
Jul-12 Oct-12 Jan-13 Apr-13 Jul-13 Oct-13 Jan-14 Apr-14 Jul-14
-10
-8
-6
-4
-2
0
2
4
6
8
10HSBC USD-CAD Positioning Index Net USD-CAD IMM Speculative Position
Source: HSBC, Bloomberg
HSBC NZD-USD Positioning Index
-10
-8
-6
-4
-2
0
2
4
6
8
10
Jul-12 Oct-12 Jan-13 Apr-13 Jul-13 Oct-13 Jan-14 Apr-14 Jul-14
-10
-8
-6
-4
-2
0
2
4
6
8
10
HSBC NZD-USD Positioning Index Net NZD-USD IMM Speculative Position
Source: HSBC, Bloomberg
14
Macro
Currency Strategy
24 July 2014
HSBC USD-CHF Positioning Index
-10
-8
-6
-4
-2
0
2
4
6
8
10
Jul-12 Oct-12 Jan-13 Apr-13 Jul-13 Oct-13 Jan-14 Apr-14 Jul-14
-10
-8
-6
-4
-2
0
2
4
6
8
10
HSBC USD-CHF Positioning Index Net USD-CHF IMM Speculative Position
Source: HSBC, Bloomberg
HSBC USD-MXN Positioning Index
-10
-8
-6
-4
-2
0
2
4
6
8
10
Jul-12 Oct-12 Jan-13 Apr-13 Jul-13 Oct-13 Jan-14 Apr-14 Jul-14
-10
-8
-6
-4
-2
0
2
4
6
8
10
HSBC USD-MXN Positioning Index Net USD-MXN IMM Speculative Position
Source: HSBC, Bloomberg
HSBC EUR-GBP Positioning Index
-10
-8
-6
-4
-2
0
2
4
6
8
10
Jul-12 Oct-12 Jan-13 Apr-13 Jul-13 Oct-13 Jan-14 Apr-14 Jul-14
-10
-8
-6
-4
-2
0
2
4
6
8
10HSBC EUR-GBP Positioning Index
Source: HSBC, Bloomberg
15
Macro
Currency Strategy
24 July 2014
HSBC EUR-JPY Positioning Index
-10
-8
-6
-4
-2
0
2
4
6
8
10
Jul-12 Oct-12 Jan-13 Apr-13 Jul-13 Oct-13 Jan-14 Apr-14 Jul-14
-10
-8
-6
-4
-2
0
2
4
6
8
10
HSBC EUR-JPY Positioning Index
Source: HSBC, Bloomberg
HSBC USD-ZAR Positioning Index
-10
-8
-6
-4
-2
0
2
4
6
8
10
Jul-12 Oct-12 Jan-13 Apr-13 Jul-13 Oct-13 Jan-14 Apr-14 Jul-14
-10
-8
-6
-4
-2
0
2
4
6
8
10
HSBC USD-ZAR Positioning Index
Source: HSBC, Bloomberg
;
16
Macro
Currency Strategy
24 July 2014
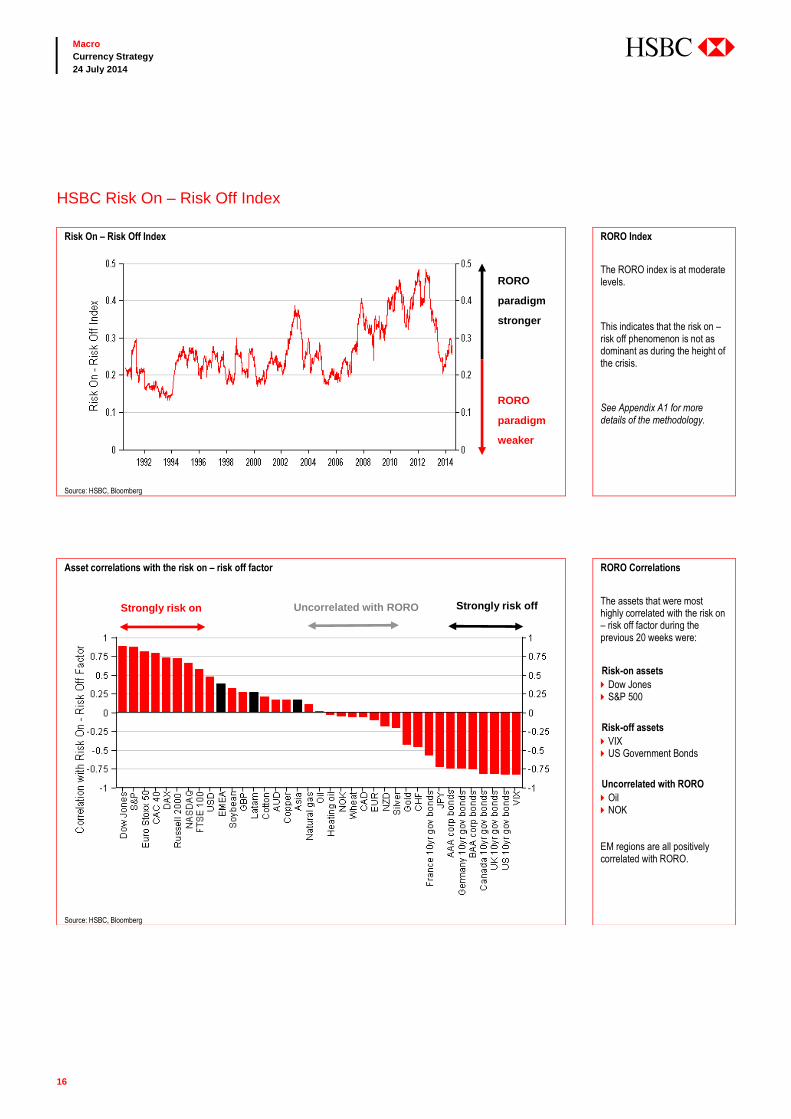
HSBC Risk On – Risk Off Index
Risk On – Risk Off Index RORO Index
The RORO index is at moderate levels.
This indicates that the risk on – risk off phenomenon is not as dominant as during the height of the crisis.
See Appendix A1 for more details of the methodology.
Source: HSBC, Bloomberg
Asset correlations with the risk on – risk off factor RORO Correlations
The assets that were most highly correlated with the risk on – risk off factor during the previous 20 weeks were:
Risk-on assets
Dow Jones S&P 500
Risk-off assets
VIX US Government Bonds
Uncorrelated with RORO
Oil NOK EM regions are all positively correlated with RORO.
Source: HSBC, Bloomberg
Uncorrelated with RORO
RORO
paradigm
stronger
Strongly risk on
RORO
paradigm
weaker
Strongly risk off
17
Macro
Currency Strategy
24 July 2014
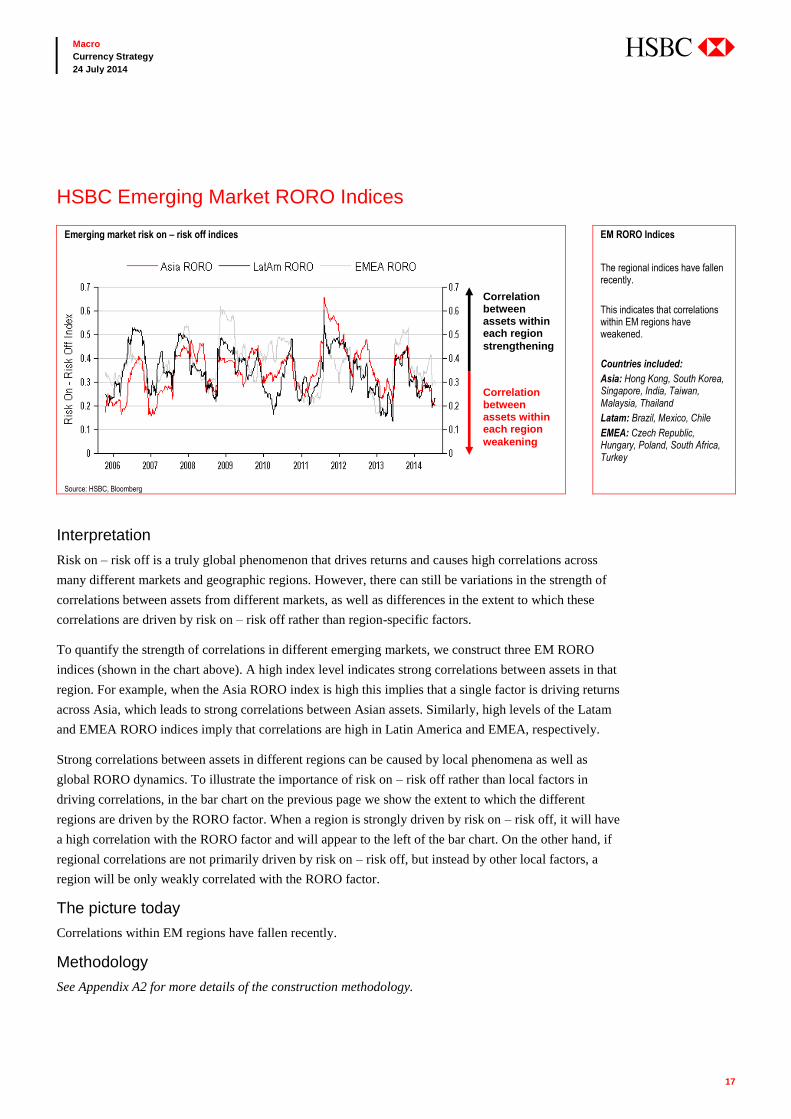
HSBC Emerging Market RORO Indices
Interpretation
Risk on – risk off is a truly global phenomenon that drives returns and causes high correlations across
many different markets and geographic regions. However, there can still be variations in the strength of
correlations between assets from different markets, as well as differences in the extent to which these
correlations are driven by risk on – risk off rather than region-specific factors.
To quantify the strength of correlations in different emerging markets, we construct three EM RORO
indices (shown in the chart above). A high index level indicates strong correlations between assets in that
region. For example, when the Asia RORO index is high this implies that a single factor is driving returns
across Asia, which leads to strong correlations between Asian assets. Similarly, high levels of the Latam
and EMEA RORO indices imply that correlations are high in Latin America and EMEA, respectively.
Strong correlations between assets in different regions can be caused by local phenomena as well as
global RORO dynamics. To illustrate the importance of risk on – risk off rather than local factors in
driving correlations, in the bar chart on the previous page we show the extent to which the different
regions are driven by the RORO factor. When a region is strongly driven by risk on – risk off, it will have
a high correlation with the RORO factor and will appear to the left of the bar chart. On the other hand, if
regional correlations are not primarily driven by risk on – risk off, but instead by other local factors, a
region will be only weakly correlated with the RORO factor.
The picture today
Correlations within EM regions have fallen recently.
Methodology
See Appendix A2 for more details of the construction methodology.
Emerging market risk on – risk off indices EM RORO Indices
The regional indices have fallen recently.
This indicates that correlations within EM regions have weakened.
Countries included:
Asia: Hong Kong, South Korea, Singapore, India, Taiwan, Malaysia, Thailand
Latam: Brazil, Mexico, Chile
EMEA: Czech Republic, Hungary, Poland, South Africa, Turkey
Source: HSBC, Bloomberg
Correlation between assets within each region
strengthening
Correlation between assets within each region
weakening
18
Macro
Currency Strategy
24 July 2014
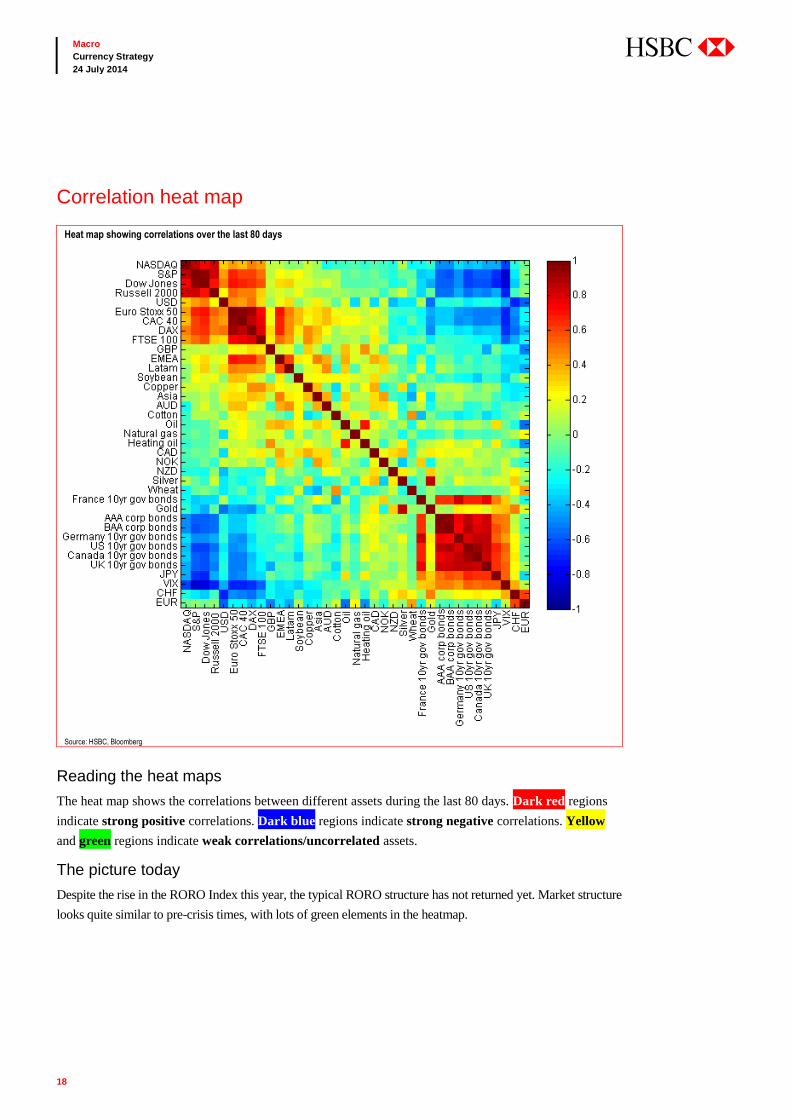
Correlation heat map
Reading the heat maps
The heat map shows the correlations between different assets during the last 80 days. Dark red regions
indicate strong positive correlations. Dark blue regions indicate strong negative correlations. Yellow
and green regions indicate weak correlations/uncorrelated assets.
The picture today
Despite the rise in the RORO Index this year, the typical RORO structure has not returned yet. Market structure
looks quite similar to pre-crisis times, with lots of green elements in the heatmap.
Heat map showing correlations over the last 80 days
Source: HSBC, Bloomberg
19
Macro
Currency Strategy
24 July 2014
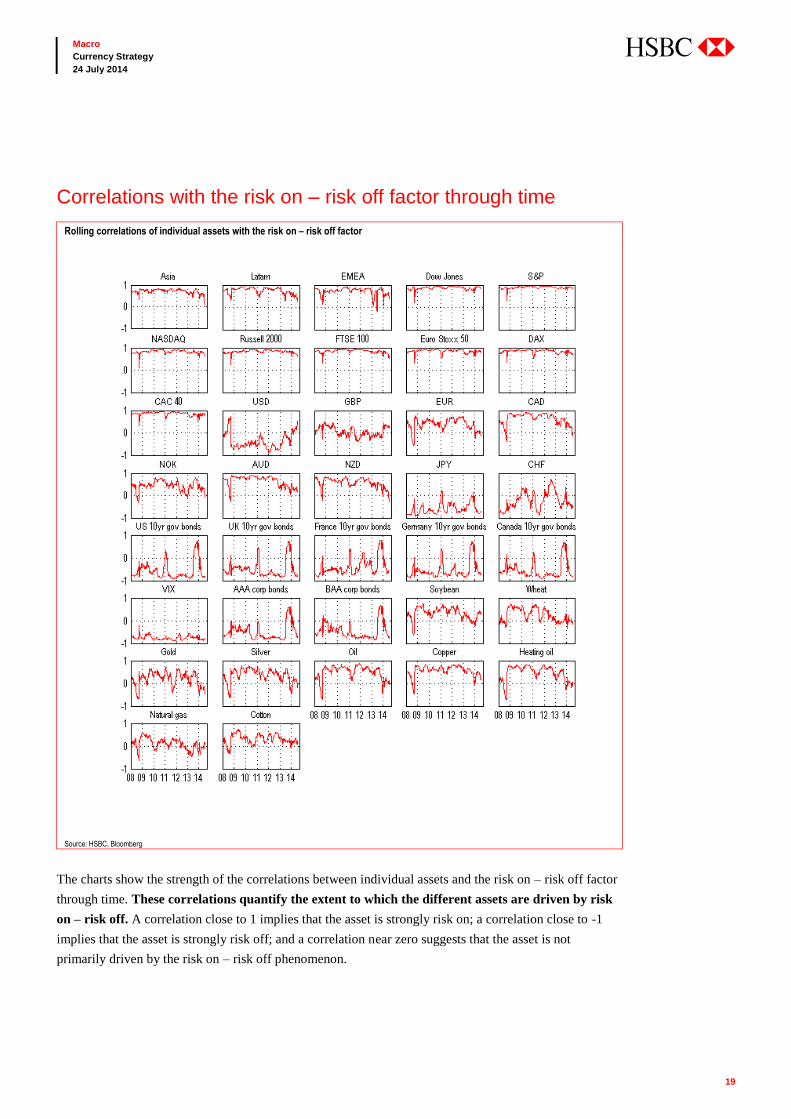
Correlations with the risk on – risk off factor through time
The charts show the strength of the correlations between individual assets and the risk on – risk off factor
through time. These correlations quantify the extent to which the different assets are driven by risk
on – risk off. A correlation close to 1 implies that the asset is strongly risk on; a correlation close to -1
implies that the asset is strongly risk off; and a correlation near zero suggests that the asset is not
primarily driven by the risk on – risk off phenomenon.
Rolling correlations of individual assets with the risk on – risk off factor
Source: HSBC, Bloomberg
20
Macro
Currency Strategy
24 July 2014
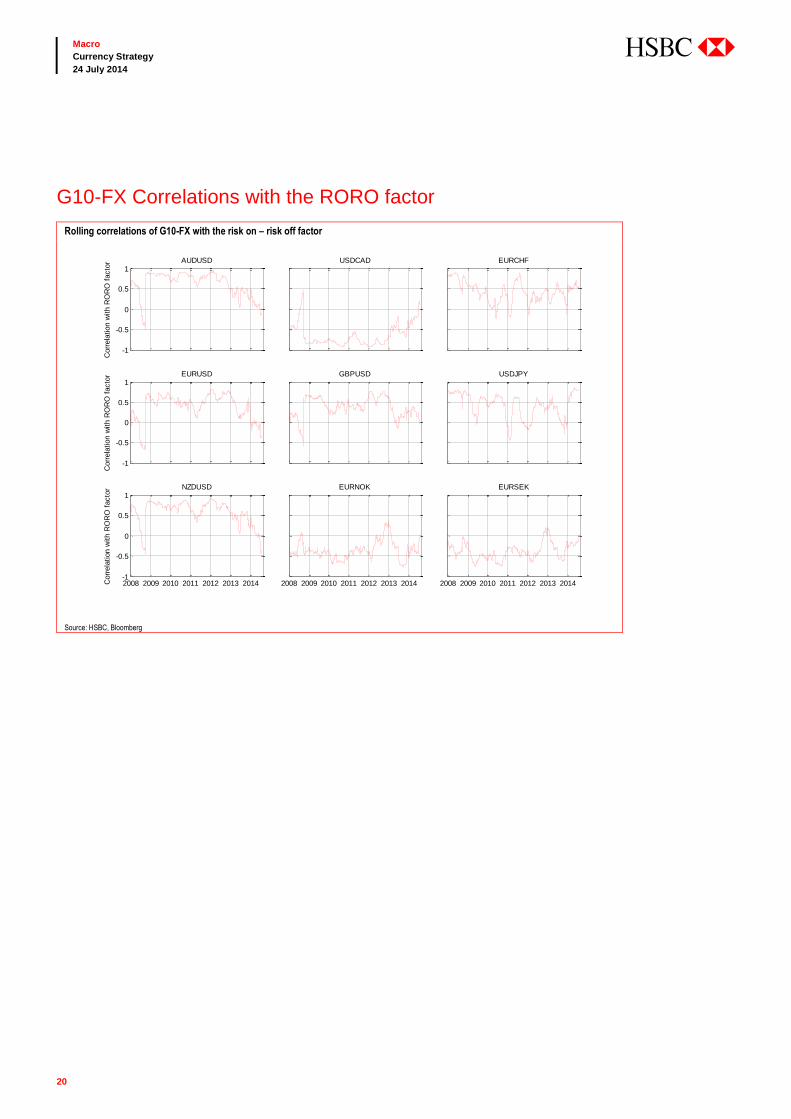
G10-FX Correlations with the RORO factor
Rolling correlations of G10-FX with the risk on – risk off factor
-1
-0.5
0
0.5
1
Corr
ela
tion w
ith R
OR
O f
acto
r AUDUSD USDCAD EURCHF
-1
-0.5
0
0.5
1
Corr
ela
tion w
ith R
OR
O f
acto
r EURUSD GBPUSD USDJPY
2008 2009 2010 2011 2012 2013 2014-1
-0.5
0
0.5
1
Corr
ela
tion w
ith R
OR
O f
acto
r NZDUSD
2008 2009 2010 2011 2012 2013 2014
EURNOK
2008 2009 2010 2011 2012 2013 2014
EURSEK
Source: HSBC, Bloomberg
21
Macro
Currency Strategy
24 July 2014
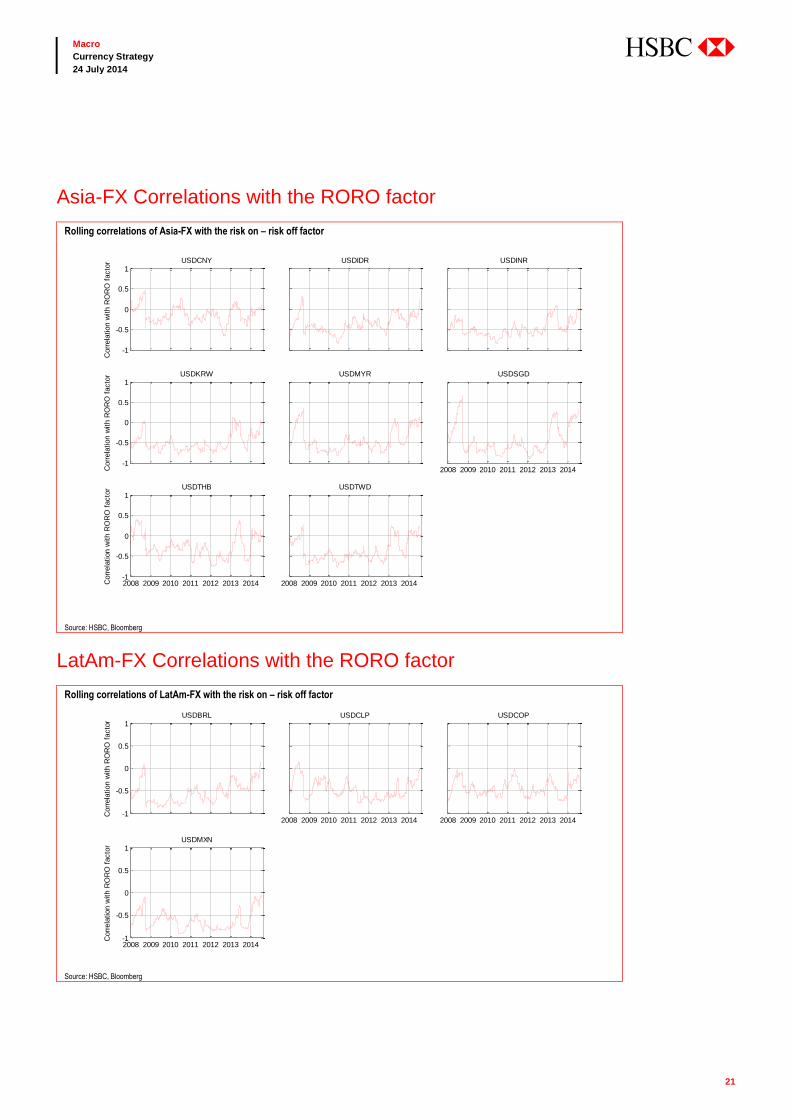
Asia-FX Correlations with the RORO factor
LatAm-FX Correlations with the RORO factor
Rolling correlations of Asia-FX with the risk on – risk off factor
-1
-0.5
0
0.5
1
Corr
ela
tion w
ith R
OR
O f
acto
r USDCNY USDIDR USDINR
-1
-0.5
0
0.5
1
Corr
ela
tion w
ith R
OR
O f
acto
r USDKRW USDMYR
2008 2009 2010 2011 2012 2013 2014
USDSGD
2008 2009 2010 2011 2012 2013 2014-1
-0.5
0
0.5
1
Corr
ela
tion w
ith R
OR
O f
acto
r USDTHB
2008 2009 2010 2011 2012 2013 2014
USDTWD
Source: HSBC, Bloomberg
Rolling correlations of LatAm-FX with the risk on – risk off factor
-1
-0.5
0
0.5
1
Corr
ela
tion w
ith R
OR
O f
acto
r
USDBRL
2008 2009 2010 2011 2012 2013 2014
USDCLP
2008 2009 2010 2011 2012 2013 2014
USDCOP
2008 2009 2010 2011 2012 2013 2014-1
-0.5
0
0.5
1
Corr
ela
tion w
ith R
OR
O f
acto
r
USDMXN
Source: HSBC, Bloomberg
22
Macro
Currency Strategy
24 July 2014
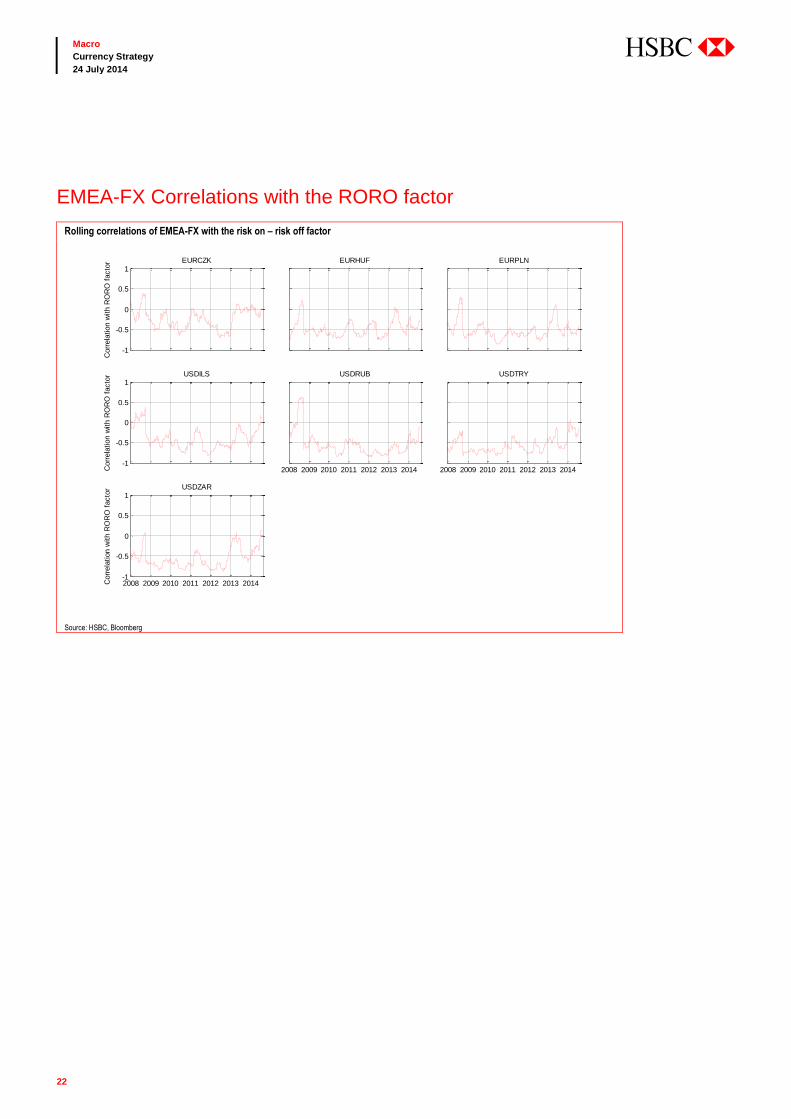
EMEA-FX Correlations with the RORO factor
Rolling correlations of EMEA-FX with the risk on – risk off factor
-1
-0.5
0
0.5
1
Corr
ela
tion w
ith R
OR
O f
acto
r EURCZK EURHUF EURPLN
-1
-0.5
0
0.5
1
Corr
ela
tion w
ith R
OR
O f
acto
r USDILS
2008 2009 2010 2011 2012 2013 2014
USDRUB
2008 2009 2010 2011 2012 2013 2014
USDTRY
2008 2009 2010 2011 2012 2013 2014-1
-0.5
0
0.5
1
Corr
ela
tion w
ith R
OR
O f
acto
r USDZAR
Source: HSBC, Bloomberg
23
Macro
Currency Strategy
24 July 2014
HSBC Equity RORO Index
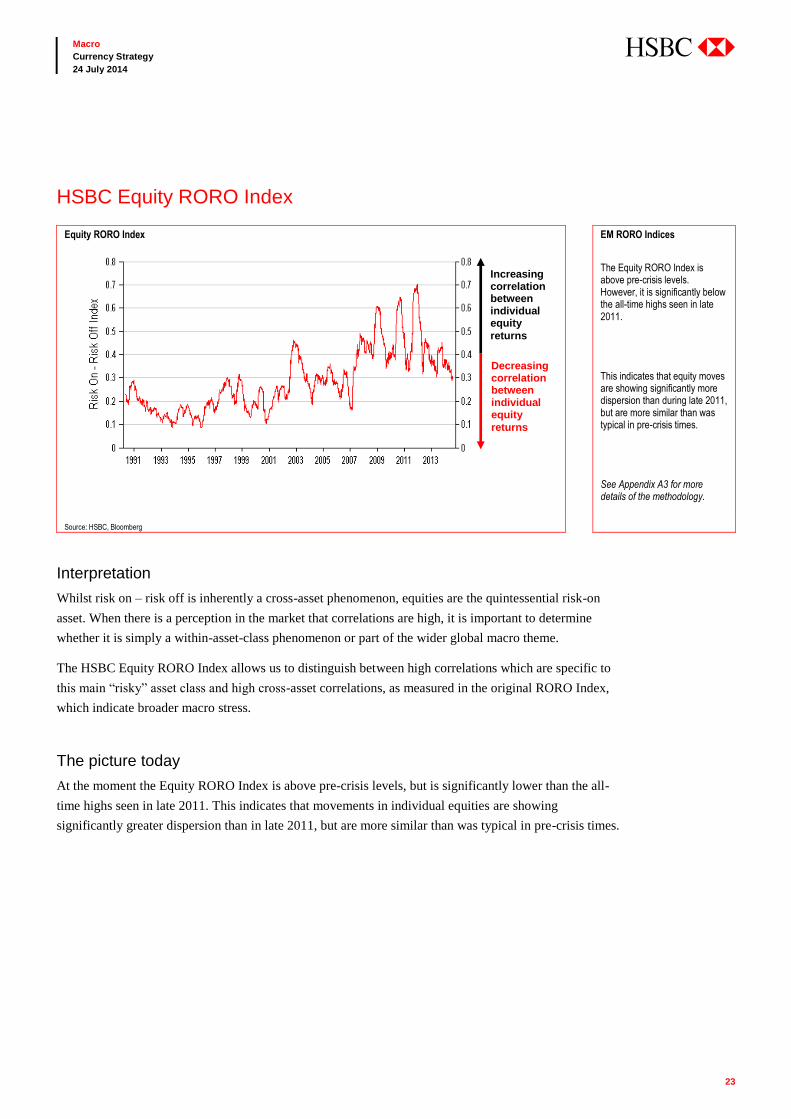
Interpretation
Whilst risk on – risk off is inherently a cross-asset phenomenon, equities are the quintessential risk-on
asset. When there is a perception in the market that correlations are high, it is important to determine
whether it is simply a within-asset-class phenomenon or part of the wider global macro theme.
The HSBC Equity RORO Index allows us to distinguish between high correlations which are specific to
this main “risky” asset class and high cross-asset correlations, as measured in the original RORO Index,
which indicate broader macro stress.
The picture today
At the moment the Equity RORO Index is above pre-crisis levels, but is significantly lower than the all-
time highs seen in late 2011. This indicates that movements in individual equities are showing
significantly greater dispersion than in late 2011, but are more similar than was typical in pre-crisis times.
Equity RORO Index EM RORO Indices
The Equity RORO Index is above pre-crisis levels. However, it is significantly below the all-time highs seen in late 2011.
This indicates that equity moves are showing significantly more dispersion than during late 2011, but are more similar than was typical in pre-crisis times.
See Appendix A3 for more details of the methodology.
Source: HSBC, Bloomberg
Increasing correlation between individual equity
returns
Decreasing correlation between individual equity
returns
24
Macro
Currency Strategy
24 July 2014
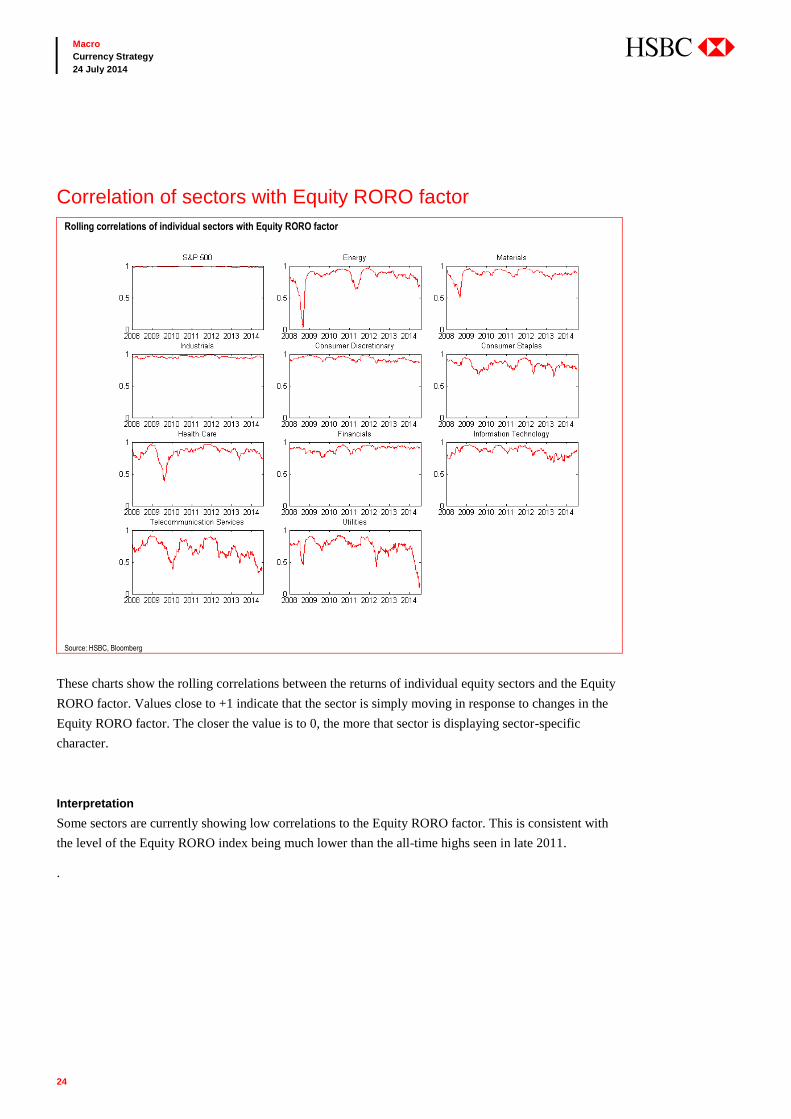
Correlation of sectors with Equity RORO factor Rolling correlations of individual sectors with Equity RORO factor
Source: HSBC, Bloomberg
These charts show the rolling correlations between the returns of individual equity sectors and the Equity
RORO factor. Values close to +1 indicate that the sector is simply moving in response to changes in the
Equity RORO factor. The closer the value is to 0, the more that sector is displaying sector-specific
character.
Interpretation
Some sectors are currently showing low correlations to the Equity RORO factor. This is consistent with
the level of the Equity RORO index being much lower than the all-time highs seen in late 2011.
.
25
Macro
Currency Strategy
24 July 2014
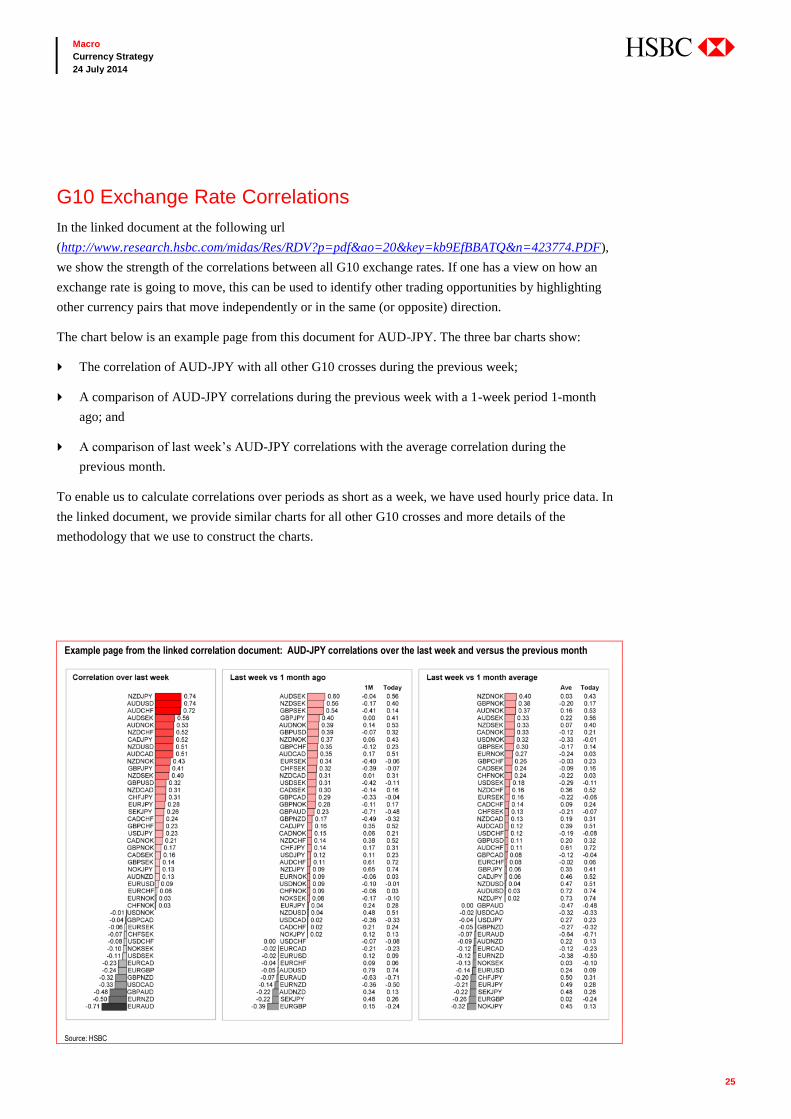
G10 Exchange Rate Correlations
In the linked document at the following url
(http://www.research.hsbc.com/midas/Res/RDV?p=pdf&ao=20&key=kb9EfBBATQ&n=423774.PDF),
we show the strength of the correlations between all G10 exchange rates. If one has a view on how an
exchange rate is going to move, this can be used to identify other trading opportunities by highlighting
other currency pairs that move independently or in the same (or opposite) direction.
The chart below is an example page from this document for AUD-JPY. The three bar charts show:
The correlation of AUD-JPY with all other G10 crosses during the previous week;
A comparison of AUD-JPY correlations during the previous week with a 1-week period 1-month
ago; and
A comparison of last week’s AUD-JPY correlations with the average correlation during the
previous month.
To enable us to calculate correlations over periods as short as a week, we have used hourly price data. In
the linked document, we provide similar charts for all other G10 crosses and more details of the
methodology that we use to construct the charts.
Example page from the linked correlation document: AUD-JPY correlations over the last week and versus the previous month
Source: HSBC
26
Macro
Currency Strategy
24 July 2014
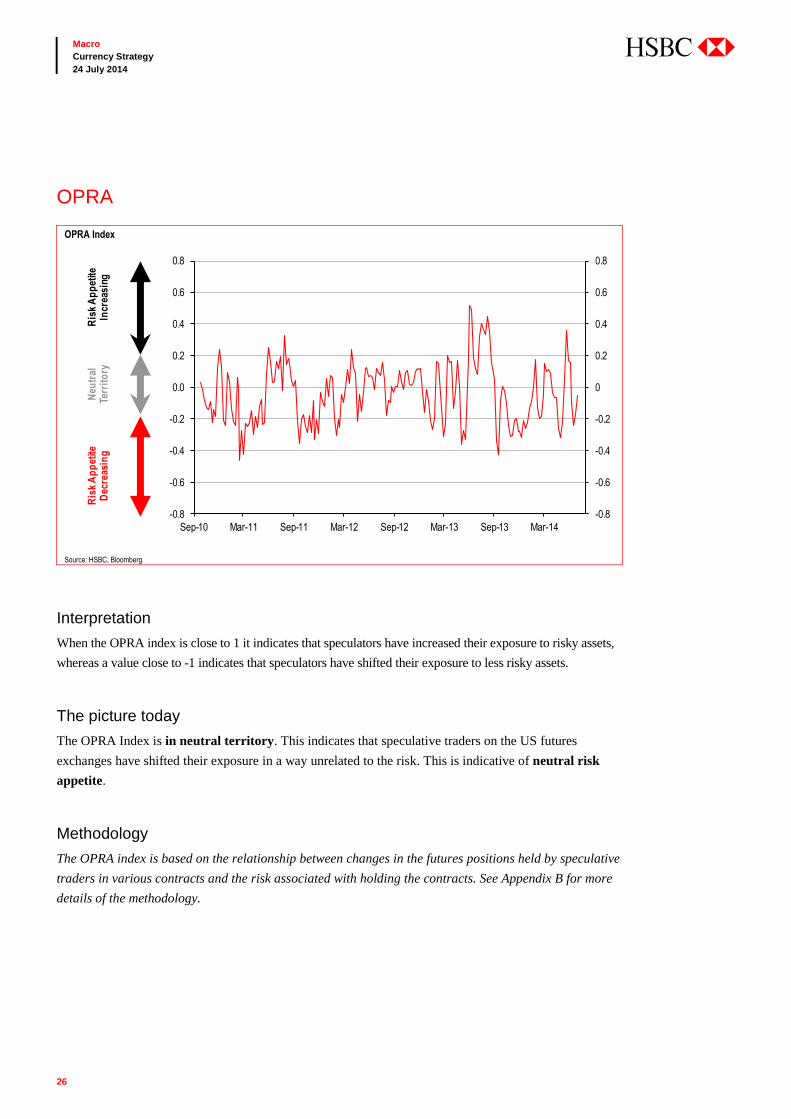
OPRA
Interpretation
When the OPRA index is close to 1 it indicates that speculators have increased their exposure to risky assets,
whereas a value close to -1 indicates that speculators have shifted their exposure to less risky assets.
The picture today
The OPRA Index is in neutral territory. This indicates that speculative traders on the US futures
exchanges have shifted their exposure in a way unrelated to the risk. This is indicative of neutral risk
appetite.
Methodology
The OPRA index is based on the relationship between changes in the futures positions held by speculative
traders in various contracts and the risk associated with holding the contracts. See Appendix B for more
details of the methodology.
OPRA Index
-0.8
-0.6
-0.4
-0.2
0
0.2
0.4
0.6
0.8
-0.8
-0.6
-0.4
-0.2
0.0
0.2
0.4
0.6
0.8
Sep-10 Mar-11 Sep-11 Mar-12 Sep-12 Mar-13 Sep-13 Mar-14
Ris
k A
pp
etite
Dec
reas
ing
Neu
tral
Terr
ito
ryR
isk
Ap
pet
iteIn
crea
sing
Source: HSBC, Bloomberg
27
Macro
Currency Strategy
24 July 2014
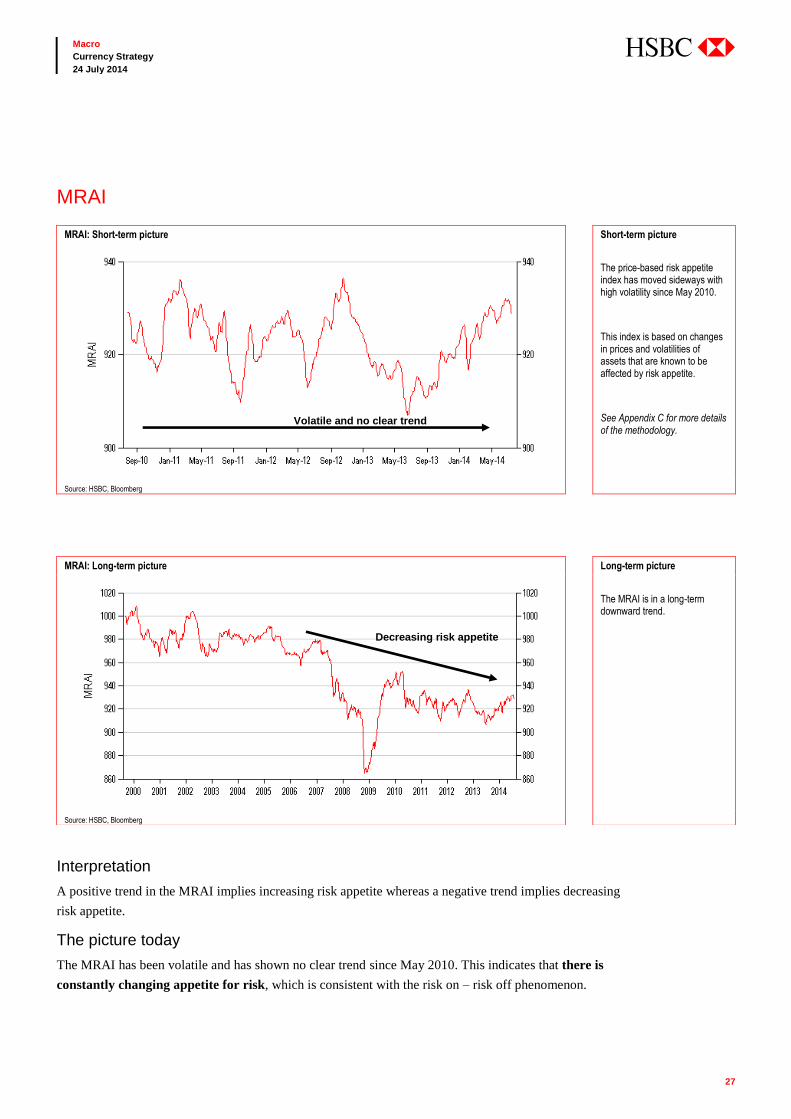
MRAI
Interpretation
A positive trend in the MRAI implies increasing risk appetite whereas a negative trend implies decreasing
risk appetite.
The picture today
The MRAI has been volatile and has shown no clear trend since May 2010. This indicates that there is
constantly changing appetite for risk, which is consistent with the risk on – risk off phenomenon.
MRAI: Short-term picture Short-term picture
The price-based risk appetite index has moved sideways with high volatility since May 2010.
This index is based on changes in prices and volatilities of assets that are known to be affected by risk appetite.
See Appendix C for more details of the methodology.
Source: HSBC, Bloomberg
MRAI: Long-term picture Long-term picture
The MRAI is in a long-term downward trend.
Source: HSBC, Bloomberg
Volatile and no clear trend
Decreasing risk appetite
28
Macro
Currency Strategy
24 July 2014
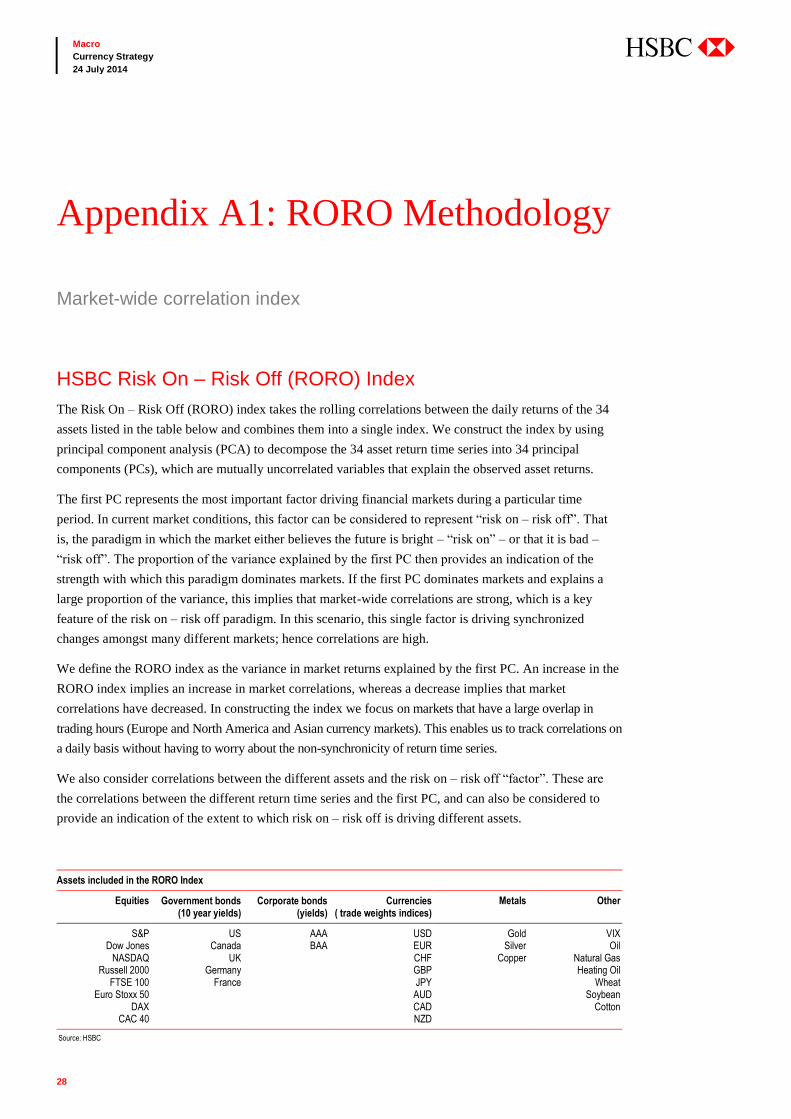
HSBC Risk On – Risk Off (RORO) Index
The Risk On – Risk Off (RORO) index takes the rolling correlations between the daily returns of the 34
assets listed in the table below and combines them into a single index. We construct the index by using
principal component analysis (PCA) to decompose the 34 asset return time series into 34 principal
components (PCs), which are mutually uncorrelated variables that explain the observed asset returns.
The first PC represents the most important factor driving financial markets during a particular time
period. In current market conditions, this factor can be considered to represent “risk on – risk off”. That
is, the paradigm in which the market either believes the future is bright – “risk on” – or that it is bad –
“risk off”. The proportion of the variance explained by the first PC then provides an indication of the
strength with which this paradigm dominates markets. If the first PC dominates markets and explains a
large proportion of the variance, this implies that market-wide correlations are strong, which is a key
feature of the risk on – risk off paradigm. In this scenario, this single factor is driving synchronized
changes amongst many different markets; hence correlations are high.
We define the RORO index as the variance in market returns explained by the first PC. An increase in the
RORO index implies an increase in market correlations, whereas a decrease implies that market
correlations have decreased. In constructing the index we focus on markets that have a large overlap in
trading hours (Europe and North America and Asian currency markets). This enables us to track correlations on
a daily basis without having to worry about the non-synchronicity of return time series.
We also consider correlations between the different assets and the risk on – risk off “factor”. These are
the correlations between the different return time series and the first PC, and can also be considered to
provide an indication of the extent to which risk on – risk off is driving different assets.
Appendix A1: RORO Methodology
Market-wide correlation index
Assets included in the RORO Index
Equities Government bonds (10 year yields)
Corporate bonds (yields)
Currencies ( trade weights indices)
Metals Other
S&P US AAA USD Gold VIX Dow Jones Canada BAA EUR Silver Oil
NASDAQ UK CHF Copper Natural Gas Russell 2000 Germany GBP Heating Oil
FTSE 100 France JPY Wheat Euro Stoxx 50 AUD Soybean
DAX CAD Cotton CAC 40 NZD
Source: HSBC
29
Macro
Currency Strategy
24 July 2014
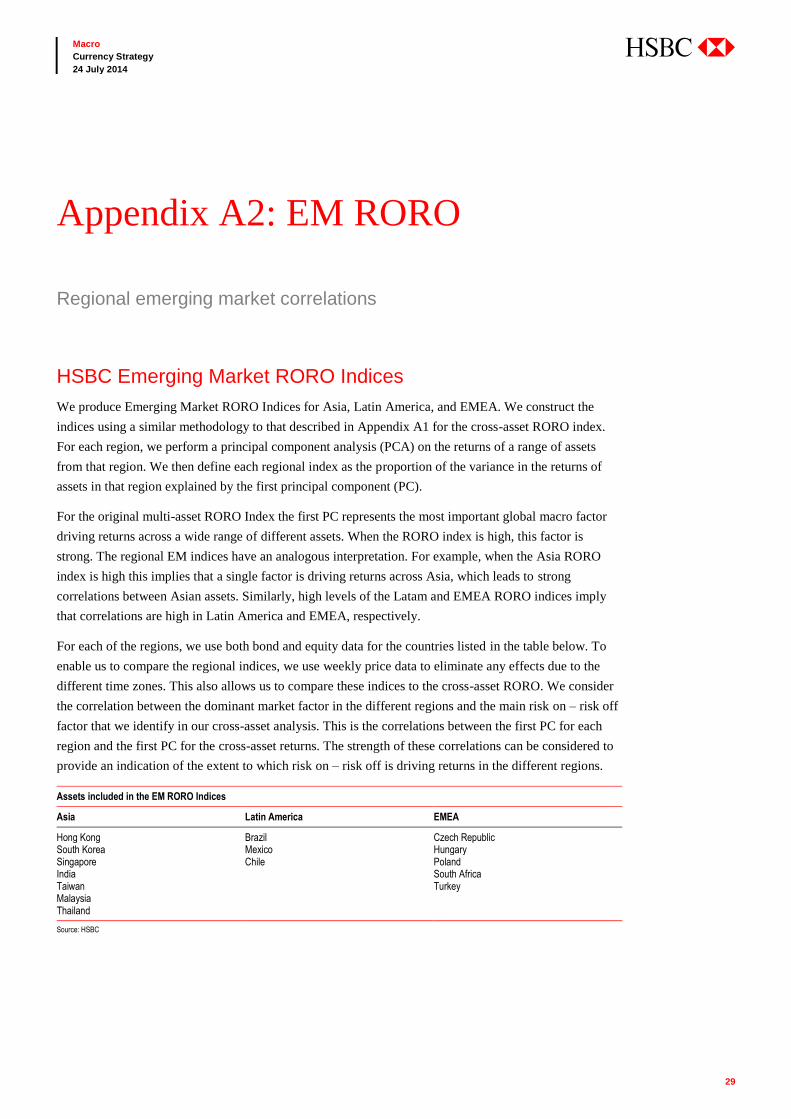
HSBC Emerging Market RORO Indices
We produce Emerging Market RORO Indices for Asia, Latin America, and EMEA. We construct the
indices using a similar methodology to that described in Appendix A1 for the cross-asset RORO index.
For each region, we perform a principal component analysis (PCA) on the returns of a range of assets
from that region. We then define each regional index as the proportion of the variance in the returns of
assets in that region explained by the first principal component (PC).
For the original multi-asset RORO Index the first PC represents the most important global macro factor
driving returns across a wide range of different assets. When the RORO index is high, this factor is
strong. The regional EM indices have an analogous interpretation. For example, when the Asia RORO
index is high this implies that a single factor is driving returns across Asia, which leads to strong
correlations between Asian assets. Similarly, high levels of the Latam and EMEA RORO indices imply
that correlations are high in Latin America and EMEA, respectively.
For each of the regions, we use both bond and equity data for the countries listed in the table below. To
enable us to compare the regional indices, we use weekly price data to eliminate any effects due to the
different time zones. This also allows us to compare these indices to the cross-asset RORO. We consider
the correlation between the dominant market factor in the different regions and the main risk on – risk off
factor that we identify in our cross-asset analysis. This is the correlations between the first PC for each
region and the first PC for the cross-asset returns. The strength of these correlations can be considered to
provide an indication of the extent to which risk on – risk off is driving returns in the different regions.
Appendix A2: EM RORO
Regional emerging market correlations
Assets included in the EM RORO Indices
Asia Latin America EMEA
Hong Kong Brazil Czech Republic South Korea Mexico Hungary Singapore Chile Poland India South Africa Taiwan Turkey Malaysia Thailand
Source: HSBC
30
Macro
Currency Strategy
24 July 2014
HSBC Equity RORO Index
The HSBC Equity RORO Index looks at all current members of the S&P 500 Index that have an
appropriate data history back to 1 January 1990. We use a similar construction methodology for this index
to the one described in Appendix A1 for the RORO Index.
To construct the Equity RORO Index we perform a principal component analysis (PCA) on the returns of
all of the equities that we consider. We define the index as the proportion of the variance in the returns of
these equities that can be explained by the first principal component (PC).
This first PC is the most important factor driving the returns at any time. For the original multi-asset
RORO Index the first PC represents the most important global macro factor driving returns across a wide
range of different assets. When the RORO index is high, this factor is strong.
For the Equity RORO, there is an analogous interpretation; however, in this case we are only looking at
the risky asset class of equities. When the Equity RORO index is high it indicates there is a
“supercharged” market beta dominating stocks – correlations are high and individual identity is reduced.
We use the two indices together to characterise the stress in the global macro environment. High
correlations are generally an indication of market strain and have consequences for most asset classes.
The two indices help understand the extent to which stress is confined to risky assets or is
more comprehensive.
Appendix A3: Equity RORO
Equity market correlations
31
Macro
Currency Strategy
24 July 2014
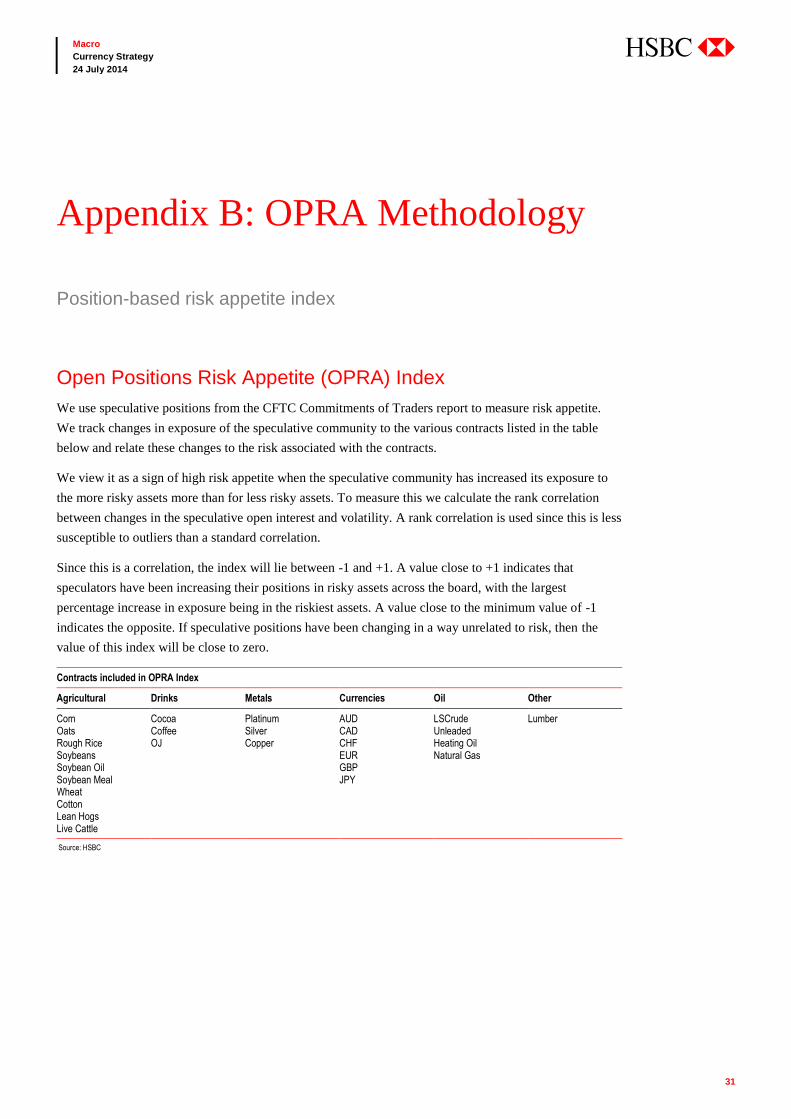
Open Positions Risk Appetite (OPRA) Index
We use speculative positions from the CFTC Commitments of Traders report to measure risk appetite.
We track changes in exposure of the speculative community to the various contracts listed in the table
below and relate these changes to the risk associated with the contracts.
We view it as a sign of high risk appetite when the speculative community has increased its exposure to
the more risky assets more than for less risky assets. To measure this we calculate the rank correlation
between changes in the speculative open interest and volatility. A rank correlation is used since this is less
susceptible to outliers than a standard correlation.
Since this is a correlation, the index will lie between -1 and +1. A value close to +1 indicates that
speculators have been increasing their positions in risky assets across the board, with the largest
percentage increase in exposure being in the riskiest assets. A value close to the minimum value of -1
indicates the opposite. If speculative positions have been changing in a way unrelated to risk, then the
value of this index will be close to zero.
Contracts included in OPRA Index
Agricultural Drinks Metals Currencies Oil Other
Corn Cocoa Platinum AUD LSCrude Lumber Oats Coffee Silver CAD Unleaded Rough Rice OJ Copper CHF Heating Oil Soybeans EUR Natural Gas Soybean Oil GBP Soybean Meal JPY Wheat Cotton Lean Hogs Live Cattle
Source: HSBC
Appendix B: OPRA Methodology
Position-based risk appetite index
32
Macro
Currency Strategy
24 July 2014
Market Risk Appetite Index (MRAI)
The MRAI measures the aggregate level of risk appetite in the financial system using risk premia from
various markets. The index is based on changes in price and volatility of several assets that are known to
be strongly affected by risk appetite. A positive trend in the MRAI implies an increasing appetite for risk
whereas a negative trend in the MRAI implies a decreasing appetite for risk.
We construct the index using equally weighted z-scores of changes in the level of six inputs: the VIX and
VDAX volatility indices; the Global Hazard Index, which aggregates the 3-month implied volatilities for
EURUSD, USDJPY, and EURJPY; BAA and AAA corporate bonds spreads; and interest rate swap spreads.
Appendix C: MRAI Methodology
Price-based risk appetite index
33
Macro
Currency Strategy
24 July 2014
Disclosure appendix
Analyst Certification
The following analyst(s), economist(s), and/or strategist(s) who is(are) primarily responsible for this report, certifies(y) that the
opinion(s) on the subject security(ies) or issuer(s) and/or any other views or forecasts expressed herein accurately reflect their
personal view(s) and that no part of their compensation was, is or will be directly or indirectly related to the specific
recommendation(s) or views contained in this research report: David Bloom, Paul Mackel, Daragh Maher, Stacy Williams,
Mark McDonald, Robert Lynch and Paul Bloxham
Important Disclosures
This document has been prepared and is being distributed by the Research Department of HSBC and is intended solely for the
clients of HSBC and is not for publication to other persons, whether through the press or by other means.
This document is for information purposes only and it should not be regarded as an offer to sell or as a solicitation of an offer
to buy the securities or other investment products mentioned in it and/or to participate in any trading strategy. Advice in this
document is general and should not be construed as personal advice, given it has been prepared without taking account of the
objectives, financial situation or needs of any particular investor. Accordingly, investors should, before acting on the advice,
consider the appropriateness of the advice, having regard to their objectives, financial situation and needs. If necessary, seek
professional investment and tax advice.
Certain investment products mentioned in this document may not be eligible for sale in some states or countries, and they may
not be suitable for all types of investors. Investors should consult with their HSBC representative regarding the suitability of
the investment products mentioned in this document and take into account their specific investment objectives, financial
situation or particular needs before making a commitment to purchase investment products.
The value of and the income produced by the investment products mentioned in this document may fluctuate, so that an
investor may get back less than originally invested. Certain high-volatility investments can be subject to sudden and large falls
in value that could equal or exceed the amount invested. Value and income from investment products may be adversely
affected by exchange rates, interest rates, or other factors. Past performance of a particular investment product is not indicative
of future results.
HSBC and its affiliates will from time to time sell to and buy from customers the securities/instruments (including derivatives)
of companies covered in HSBC Research on a principal or agency basis.
Analysts, economists, and strategists are paid in part by reference to the profitability of HSBC which includes investment
banking revenues.
Whether, or in what time frame, an update of this analysis will be published is not determined in advance.
For disclosures in respect of any company mentioned in this report, please see the most recently published report on that
company available at www.hsbcnet.com/research.
Additional disclosures
4 This report is dated as at 24 July 2014.
5 All market data included in this report are dated as at close 23 July 2014, unless otherwise indicated in the report.
6 HSBC has procedures in place to identify and manage any potential conflicts of interest that arise in connection with its
Research business. HSBC's analysts and its other staff who are involved in the preparation and dissemination of Research
operate and have a management reporting line independent of HSBC's Investment Banking business. Information Barrier
procedures are in place between the Investment Banking and Research businesses to ensure that any confidential and/or
price sensitive information is handled in an appropriate manner.
34
Macro
Currency Strategy
24 July 2014
Disclaimer
* Legal entities as at 30 May 2014
‘UAE’ HSBC Bank Middle East Limited, Dubai; ‘HK’ The Hongkong and Shanghai Banking Corporation Limited,
Hong Kong; ‘TW’ HSBC Securities (Taiwan) Corporation Limited; 'CA' HSBC Bank Canada, Toronto; HSBC Bank,
Paris Branch; HSBC France; ‘DE’ HSBC Trinkaus & Burkhardt AG, Düsseldorf; 000 HSBC Bank (RR), Moscow;
‘IN’ HSBC Securities and Capital Markets (India) Private Limited, Mumbai; ‘JP’ HSBC Securities (Japan) Limited,
Tokyo; ‘EG’ HSBC Securities Egypt SAE, Cairo; ‘CN’ HSBC Investment Bank Asia Limited, Beijing Representative
Office; The Hongkong and Shanghai Banking Corporation Limited, Singapore Branch; The Hongkong and Shanghai Banking Corporation Limited, Seoul Securities Branch; The Hongkong and Shanghai Banking
Corporation Limited, Seoul Branch; HSBC Securities (South Africa) (Pty) Ltd, Johannesburg; HSBC Bank plc,
London, Madrid, Milan, Stockholm, Tel Aviv; ‘US’ HSBC Securities (USA) Inc, New York; HSBC Yatirim Menkul
Degerler AS, Istanbul; HSBC México, SA, Institución de Banca Múltiple, Grupo Financiero HSBC; HSBC Bank
Brasil SA – Banco Múltiplo; HSBC Bank Australia Limited; HSBC Bank Argentina SA; HSBC Saudi Arabia
Limited; The Hongkong and Shanghai Banking Corporation Limited, New Zealand Branch incorporated in Hong
Kong SAR; The Hongkong and Shanghai Banking Corporation Limited, Bangkok Branch
Issuer of report
HSBC Bank plc
8 Canada Square, London
E14 5HQ, United Kingdom
Telephone: +44 20 7991 8888
Telex: 888866
Fax: +44 20 7992 4880
Website: www.research.hsbc.com
This document is issued and approved in the United Kingdom by HSBC Bank plc for the information of its Clients (as defined in the Rules of FCA) and those of its
affiliates only. If this research is received by a customer of an affiliate of HSBC, its provision to the recipient is subject to the terms of business in place between the recipient and such affiliate. In Australia, this publication has been distributed by The Hongkong and Shanghai Banking Corporation Limited (ABN 65 117 925 970, AFSL
301737) for the general information of its “wholesale” customers (as defined in the Corporations Act 2001). Where distributed to retail customers, this research is
distributed by HSBC Bank Australia Limited (AFSL No. 232595). These respective entities make no representations that the products or services mentioned in this
document are available to persons in Australia or are necessarily suitable for any particular person or appropriate in accordance with local law. No consideration has been
given to the particular investment objectives, financial situation or particular needs of any recipient.
The document is distributed in Hong Kong and Japan by The Hongkong and Shanghai Banking Corporation Limited and has been prepared for the New York office of
HSBC Bank USA, National Association. In Korea, this publication is distributed by either The Hongkong and Shanghai Banking Corporation Limited, Seoul Securities
Branch ("HBAP SLS") or The Hongkong and Shanghai Banking Corporation Limited, Seoul Branch ("HBAP SEL") for the general information of professional investors specified in Article 9 of the Financial Investment Services and Capital Markets Act (“FSCMA”). This publication is not a prospectus as defined in the FSCMA. It may not
be further distributed in whole or in part for any purpose. Both HBAP SLS and HBAP SEL are regulated by the Financial Services Commission and the Financial
Supervisory Service of Korea.
Each of the companies listed above (the “Participating Companies”) is a member of the HSBC Group of Companies, any member of which may trade for its own account
as Principal, may have underwritten an issue within the last 36 months or, together with its Directors, officers and employees, may have a long or short position in
securities or instruments or in any related instrument mentioned in the document. Brokerage or fees may be earned by the Participating Companies or persons associated
with them in respect of any business transacted by them in all or any of the securities or instruments referred to in this document. This publication is distributed in New
Zealand by The Hongkong and Shanghai Banking Corporation Limited, New Zealand Branch incorporated in Hong Kong SAR. The information in this document is derived from sources the Participating Companies believe to be reliable but which have not been independently verified. The
Participating Companies make no guarantee of its accuracy and completeness and are not responsible for errors of transmission of factual or analytical data, nor shall the
Participating Companies be liable for damages arising out of any person’s reliance upon this information. All charts and graphs are from publicly available sources or
proprietary data. The opinions in this document constitute the present judgement of the Participating Companies, which is subject to change without notice.
This document is neither an offer to sell, purchase or subscribe for any investment nor a solicitation of such an offer. HSBC Securities (USA) Inc. accepts responsibility
for the content of this research report prepared by its non-US foreign affiliate. All US persons receiving and/or accessing this report and intending to effect transactions in
any security discussed herein should do so with HSBC Securities (USA) Inc. in the United States and not with its non-US foreign affiliate, the issuer of this report. In Singapore, this publication is distributed by The Hongkong and Shanghai Banking Corporation Limited, Singapore Branch for the general information of institutional
investors or other persons specified in Sections 274 and 304 of the Securities and Futures Act (Chapter 289) (“SFA”) and accredited investors and other persons in
accordance with the conditions specified in Sections 275 and 305 of the SFA. This publication is not a prospectus as defined in the SFA. It may not be further distributed
in whole or in part for any purpose. The Hongkong and Shanghai Banking Corporation Limited Singapore Branch is regulated by the Monetary Authority of Singapore.
Recipients in Singapore should contact a "Hongkong and Shanghai Banking Corporation Limited, Singapore Branch" representative in respect of any matters arising from,
or in connection with this report. HSBC México, S.A., Institución de Banca Múltiple, Grupo Financiero HSBC is authorized and regulated by Secretaría de Hacienda y
Crédito Público and Comisión Nacional Bancaria y de Valores (CNBV). HSBC Bank (Panama) S.A. is regulated by Superintendencia de Bancos de Panama. Banco
HSBC Honduras S.A. is regulated by Comisión Nacional de Bancos y Seguros (CNBS). Banco HSBC Salvadoreño, S.A. is regulated by Superintendencia del Sistema Financiero (SSF). HSBC Colombia S.A. is regulated by Superintendencia Financiera de Colombia. Banco HSBC Costa Rica S.A. is supervised by Superintendencia
General de Entidades Financieras (SUGEF). Banistmo Nicaragua, S.A. is authorized and regulated by Superintendencia de Bancos y de Otras Instituciones Financieras
(SIBOIF).
The document is intended to be distributed in its entirety. Unless governing law permits otherwise, you must contact a HSBC Group member in your home jurisdiction if
you wish to use HSBC Group services in effecting a transaction in any investment mentioned in this document. HSBC Bank plc is registered in England No 14259, is
authorised by the Prudential Regulation Authority and regulated by the Financial Conduct Authority and the Prudential Regulation Authority and is a member of the
London Stock Exchange. (070905)
In Canada, this document has been distributed by HSBC Bank Canada and/or its affiliates. Where this document contains market updates/overviews, or similar materials (collectively deemed “Commentary” in Canada although other affiliate jurisdictions may term “Commentary” as either “macro-research” or “research”), the Commentary
is not an offer to sell, or a solicitation of an offer to sell or subscribe for, any financial product or instrument (including, without limitation, any currencies, securities,
commodities or other financial instruments).
© Copyright 2014, HSBC Bank plc, ALL RIGHTS RESERVED. No part of this publication may be reproduced, stored in a retrieval system, or transmitted, on any form
or by any means, electronic, mechanical, photocopying, recording, or otherwise, without the prior written permission of HSBC Bank plc. MICA (P) 157/06/2014, MICA
(P) 171/04/2014 and MICA (P) 077/01/2014
[000000]
Global
David Bloom Global Head of FX Research +44 20 7991 5969 [email protected]
Asia
Paul Mackel Head of FX Research, Asia-Pacific +852 2996 6565 [email protected]
Perry Kojodjojo +852 2996 6568 [email protected]
Dominic Bunning +852 2822 1672 [email protected]
Ju Wang +852 2822 4340 [email protected]
United Kingdom
Daragh Maher +44 20 7991 5968 [email protected]
Stacy Williams +44 20 7991 5967 [email protected]
Mark McDonald +44 20 7991 5966 [email protected]
Murat Toprak +44 20 7991 5415 [email protected]
Mark Austin Consultant
United States
Robert Lynch +1 212 525 3159 [email protected]
Clyde Wardle +1 212 525 3345 [email protected]
Marjorie Hernandez +1 212 525 4109 [email protected]
Technical Analysis
Murray Gunn +44 20 7991 6797 murray,[email protected]
Precious Metals
James Steel +1 212 525 3117 [email protected]
Howard Wen +1 212 525 3726 [email protected]
Global Currency Strategy Research Team