Embed Size (px)
Citation preview
IFCN Dairy Outlook 2030
CURIOUS? YOU SHOULD BE!
Per capita milk consumption:
Milk production:
Milk production per farm:
Until 2030, global population will increase by 16% to 8.7 billionpeople, so 1.2 billion more consumers will demand milk products.
Average milk yield:
THE DAIRY WORLD 2017 vs. 2030
+ 304 mill t
+ 54%
+ 16%
+ 23%
Approx. 3 times of thecurrent USA milk supply
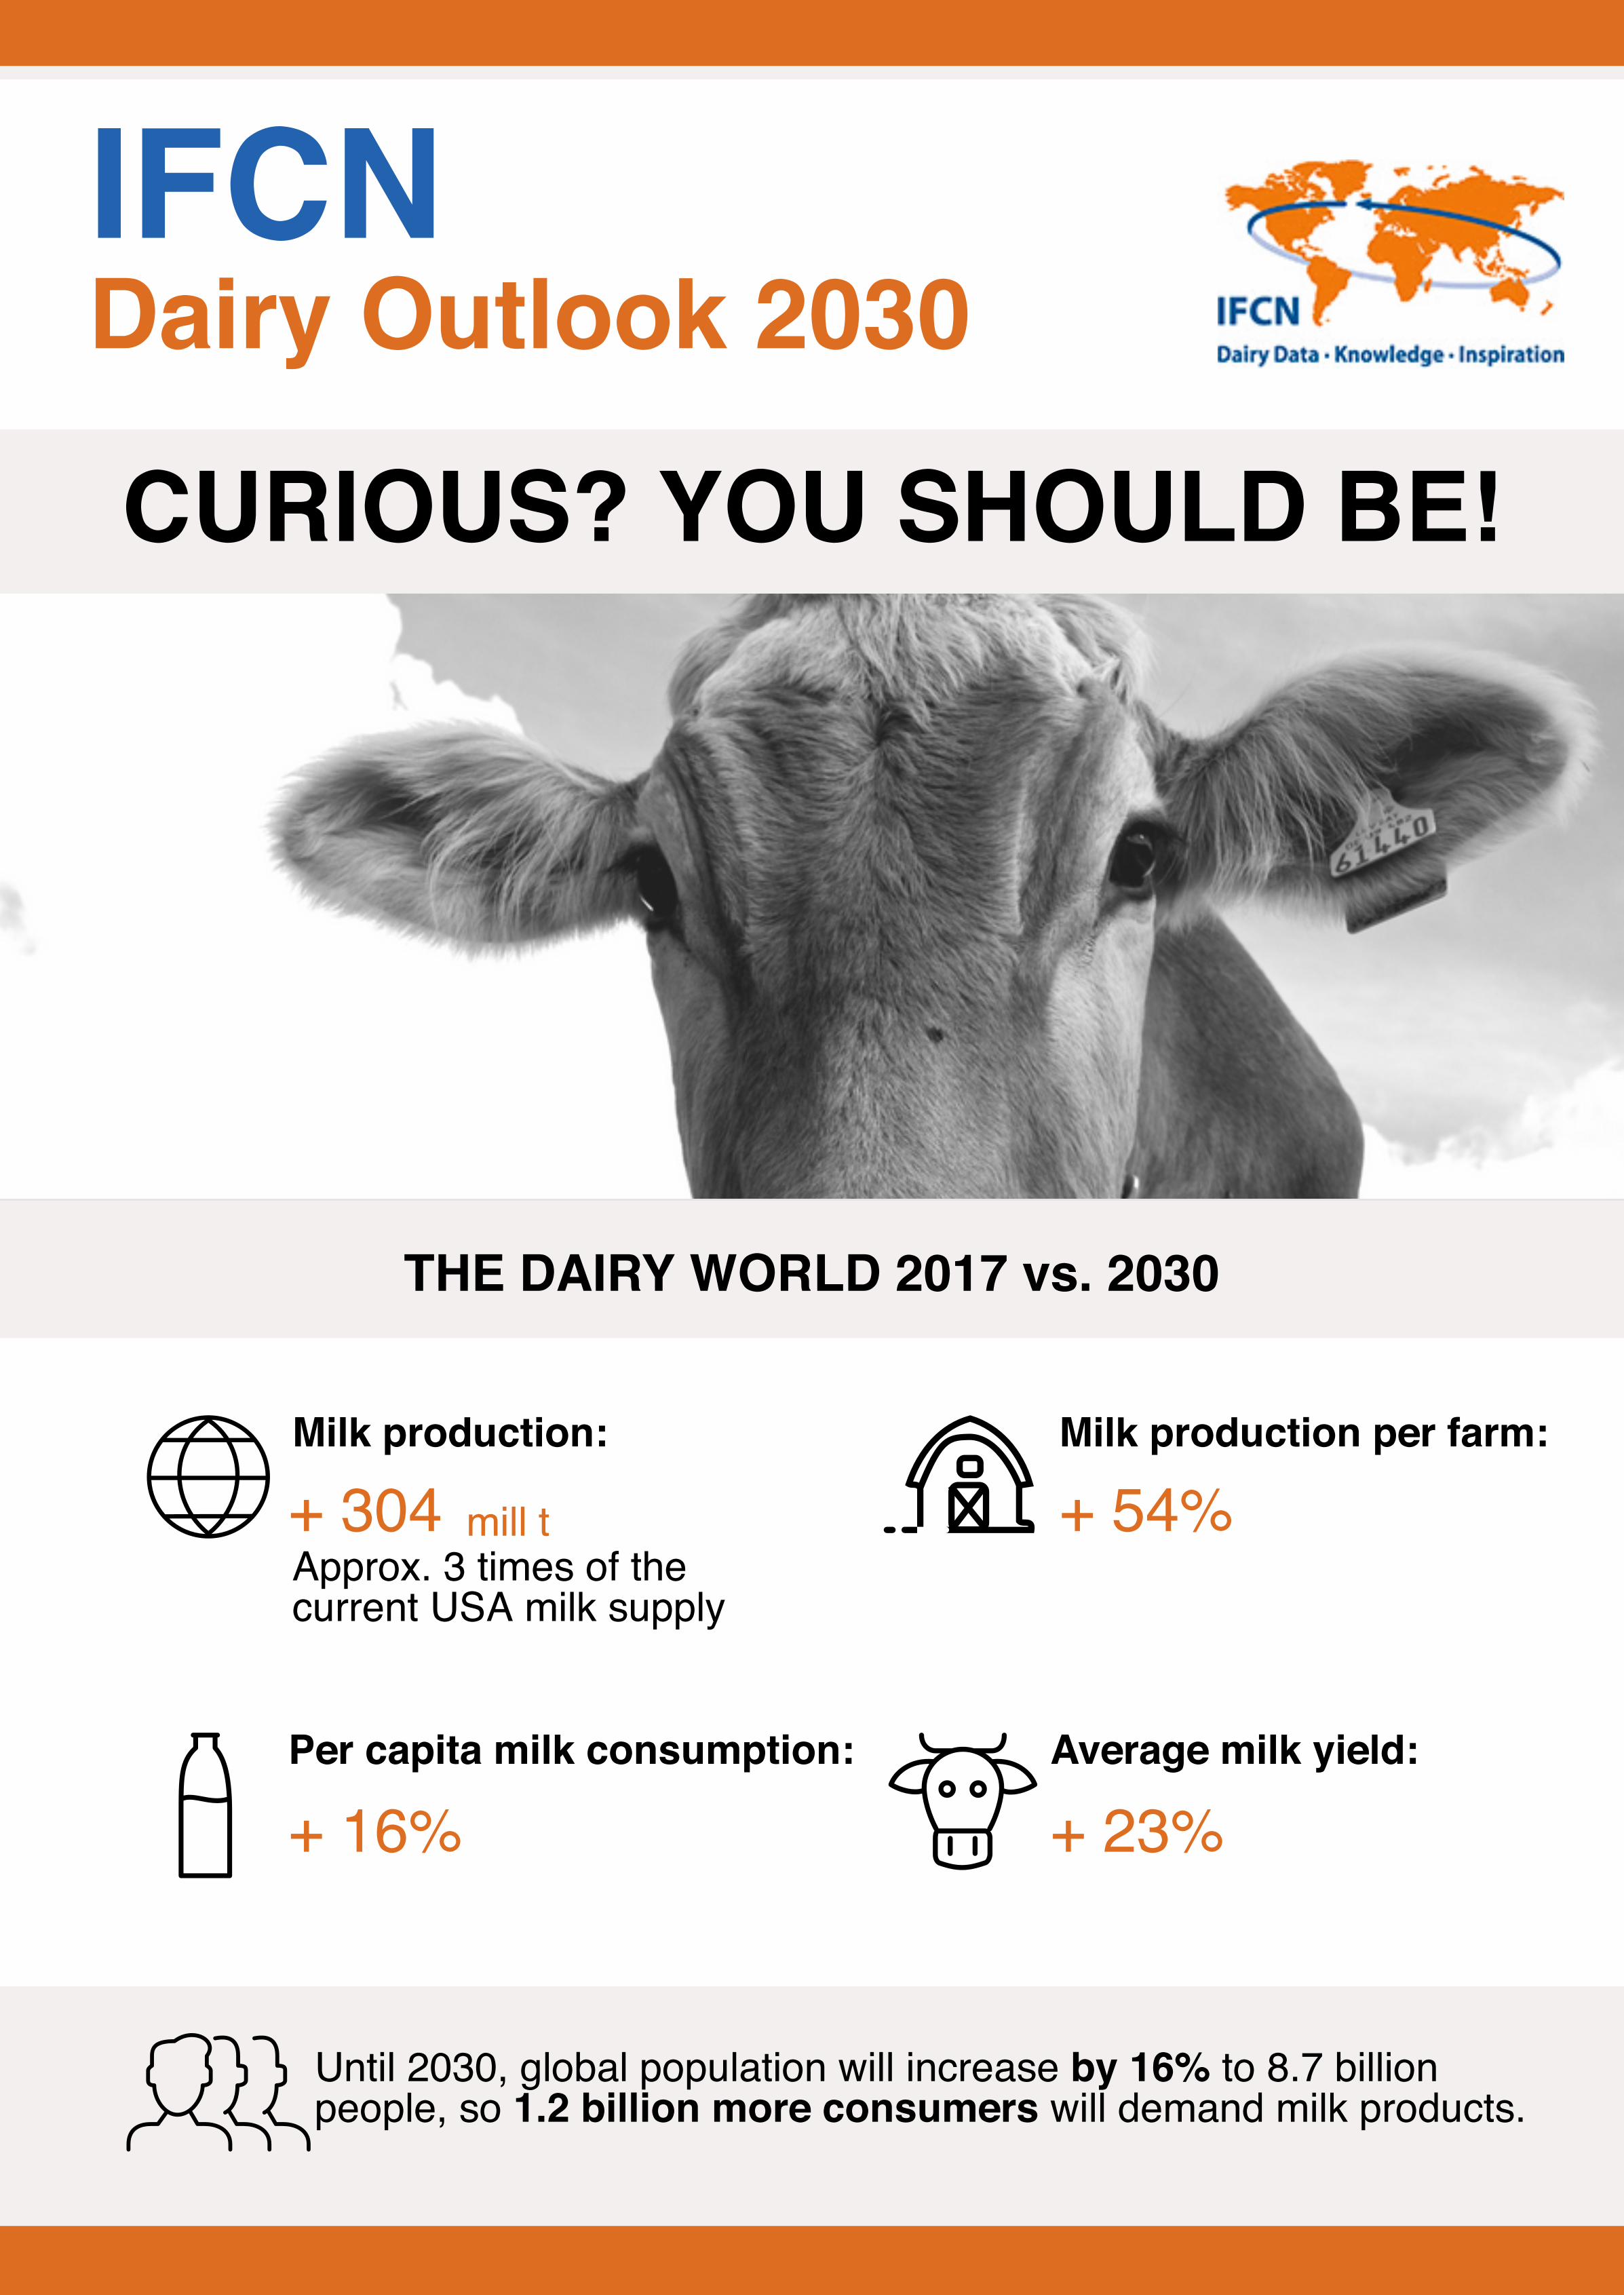
WORLD MILK PRODUCTION BY REGIONS
Sout
h As
ia
14%
Nor
thAm
eric
a
26%
Afr
ica
East
&So
uthe
ast
Asia
Nea
r &M
iddl
e Ea
st
Oce
ania
22%
This diagram shows the milk volume of the world regions in 2030 and % change in milk supply 2017 vs 2030.
KNOWLEDGE GIVES YOU A HEAD START
World milk production35% Growth
Today the dairy world is serving over 7 billion consumers and providing livelihoods for approximately 1 billion people involved in the dairy chain. The dairy sector with its complexity entails great challenges
due to its high rate of significant changes, influenced by economic and political decisions and drivers.
In response to this, IFCN aims to answer upcoming questions concerning the development of the dairyworld in the next 13 years and its crucial structural changes. The aim of producing a long-term outlook isto provide all stakeholders of the dairy value chain with a clearer understanding of future developments inthe dairy sector.
In the next 13 years, the number of dairy farms will decrease to 104 mill,hence 14 mill farm will be lost.
At the global level average, farm size will expand to 4 head / farm, whichcorresponds to a global increase of 29% in average farm sizes.
DAIRY FARM NUMBERS AND SIZE
Wes
tern
Euro
pe
64%
East
ern
Euro
pe &
CIS
36%
Latin
Amer
ica
24% 27%
22%
Global average dairy farm size 29% Growth
33%
100
400
200
300
mill ton ECM
Wes
tern
Euro
pe
Nor
th A
mer
ica
Latin
Amer
ica
East
&So
uthe
ast
Asia
East
ern
Euro
pe &
CIS
Oce
ania
Afric
a
Sout
h As
ia
Nea
r &M
iddl
e Ea
st
100
200
400
cows / farm
< 20
14%
82%
65%
22% 78%
6%
32%
9%
37%
414
340
98
16
10
5
4
4
3
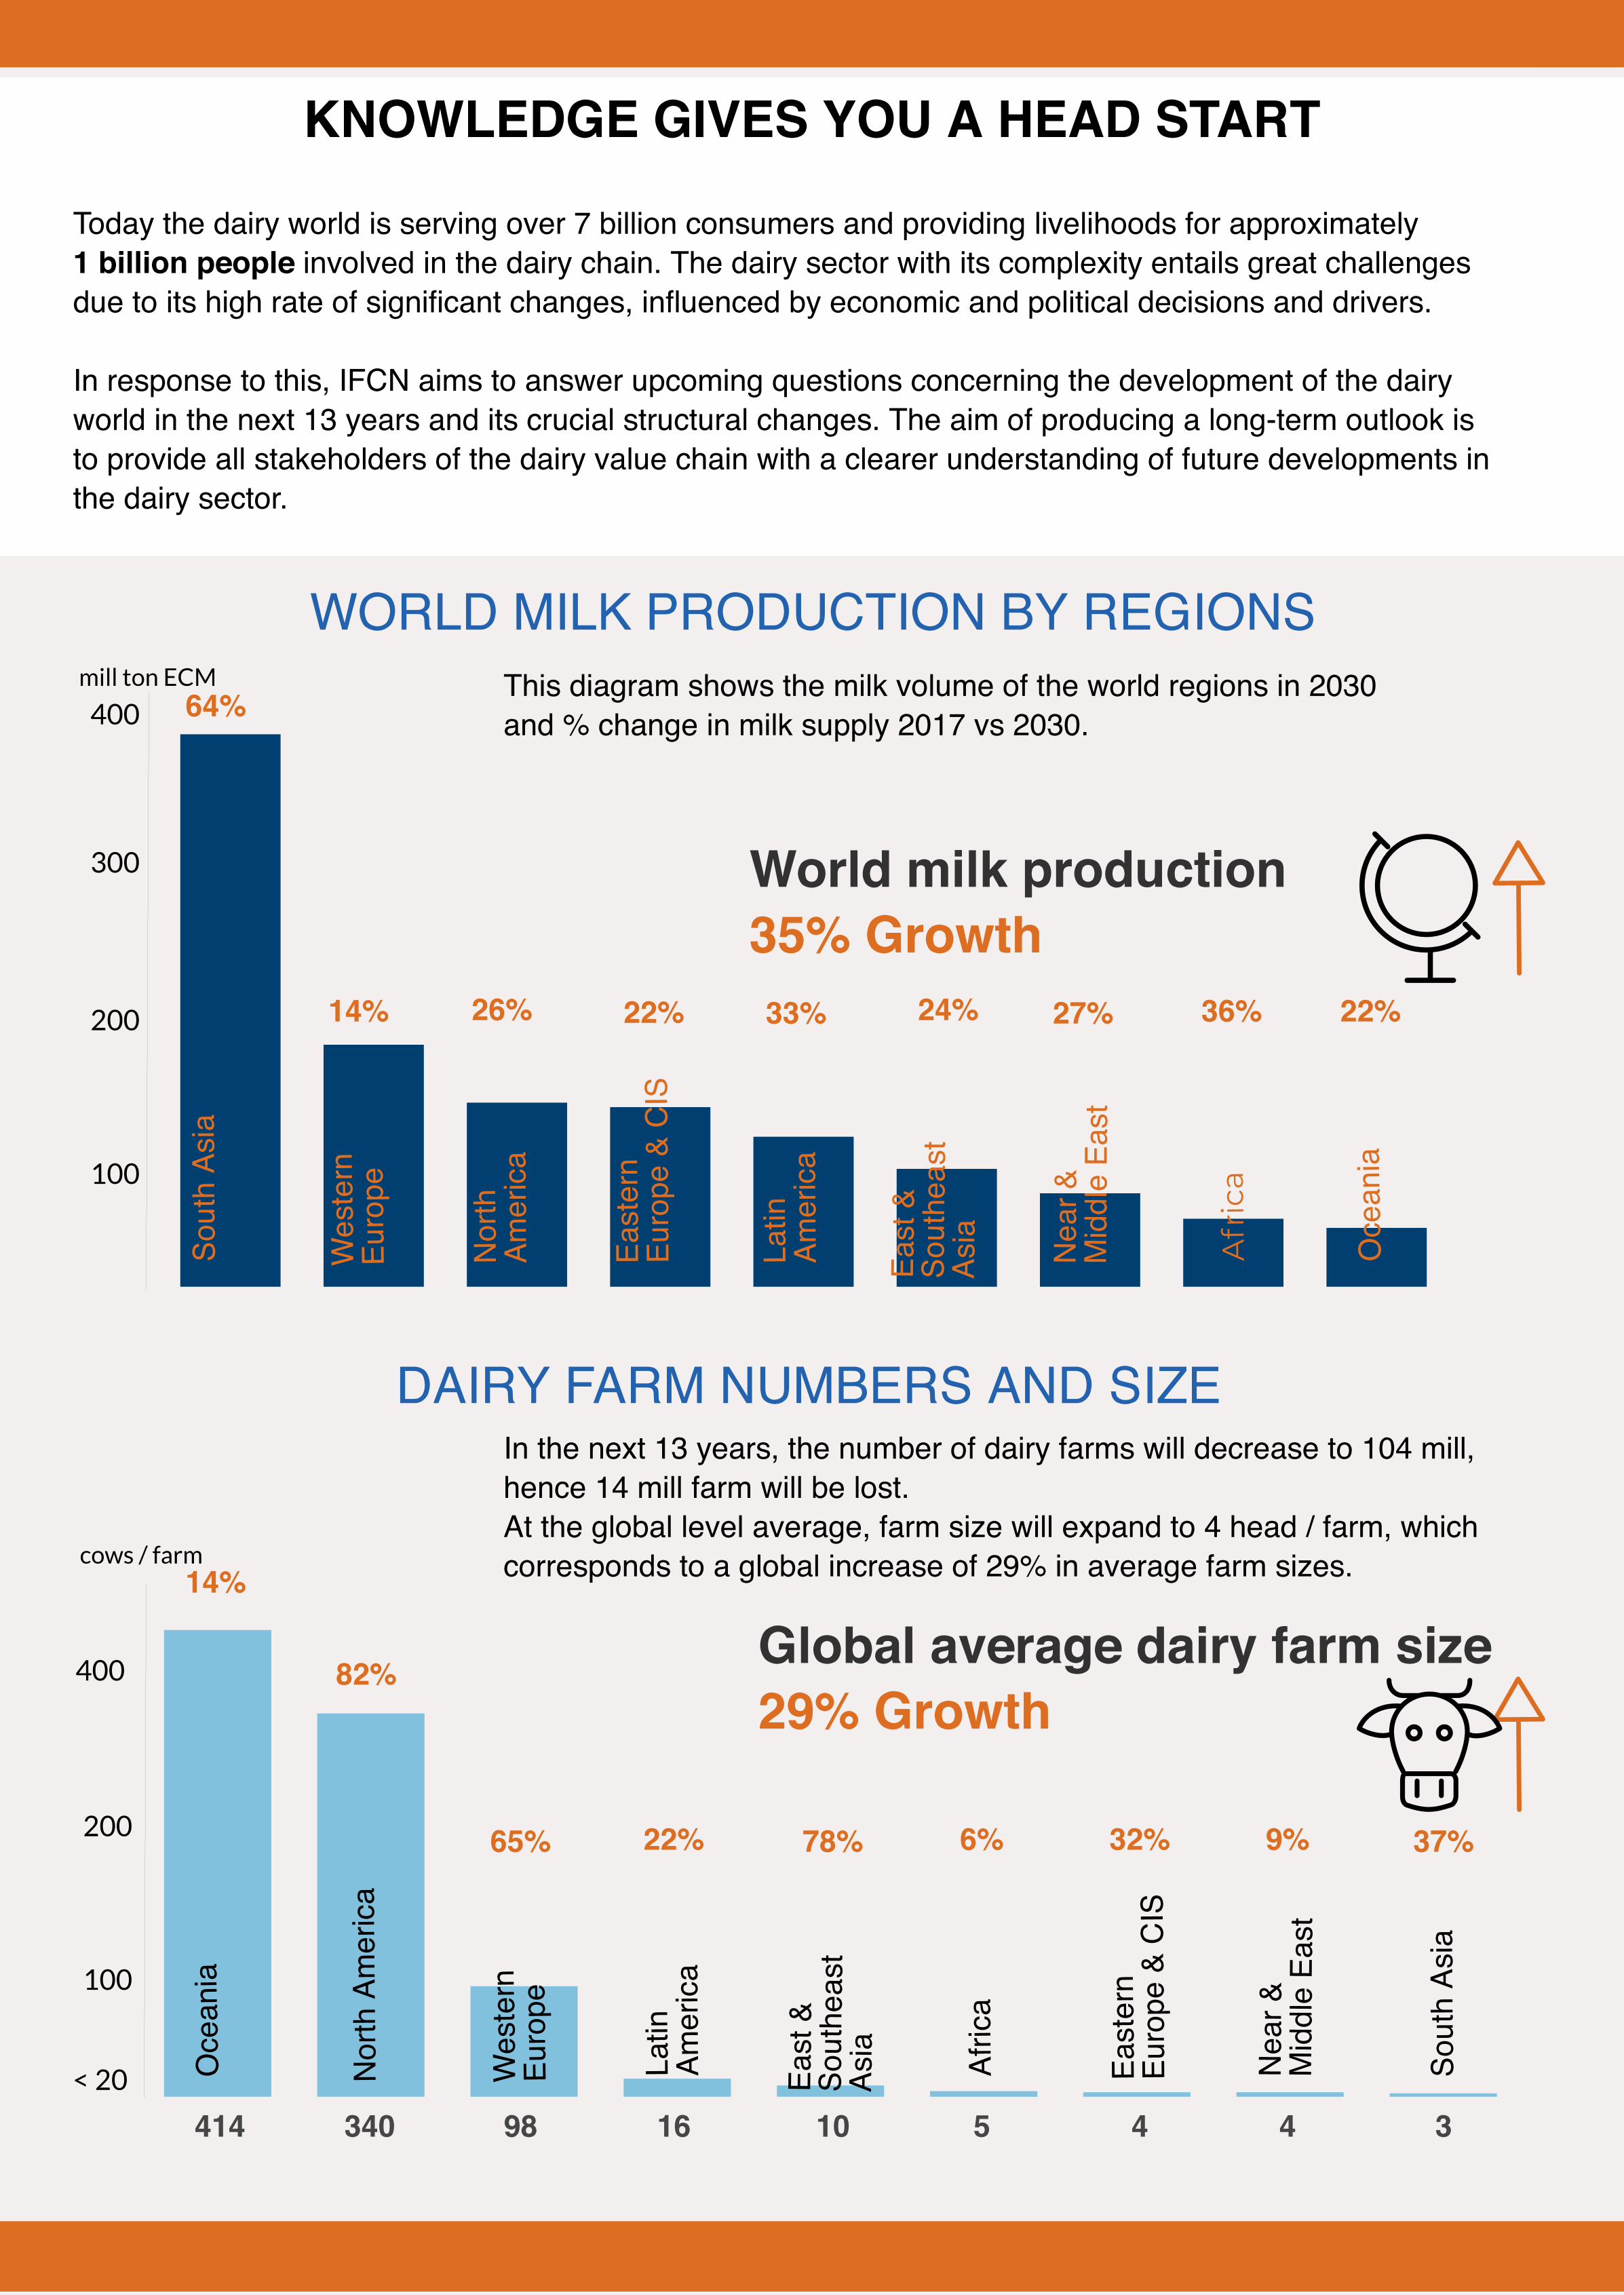
DAIRY WORLD METRICS 2007 / 2017 / 2030
FUTURE DRIVERS OF THE DAIRY WORLD
ABSOLUTE VOLUME CHANGE IN WORLD MILKPRODUCTION 2017 vs. 2030
CONTACT US
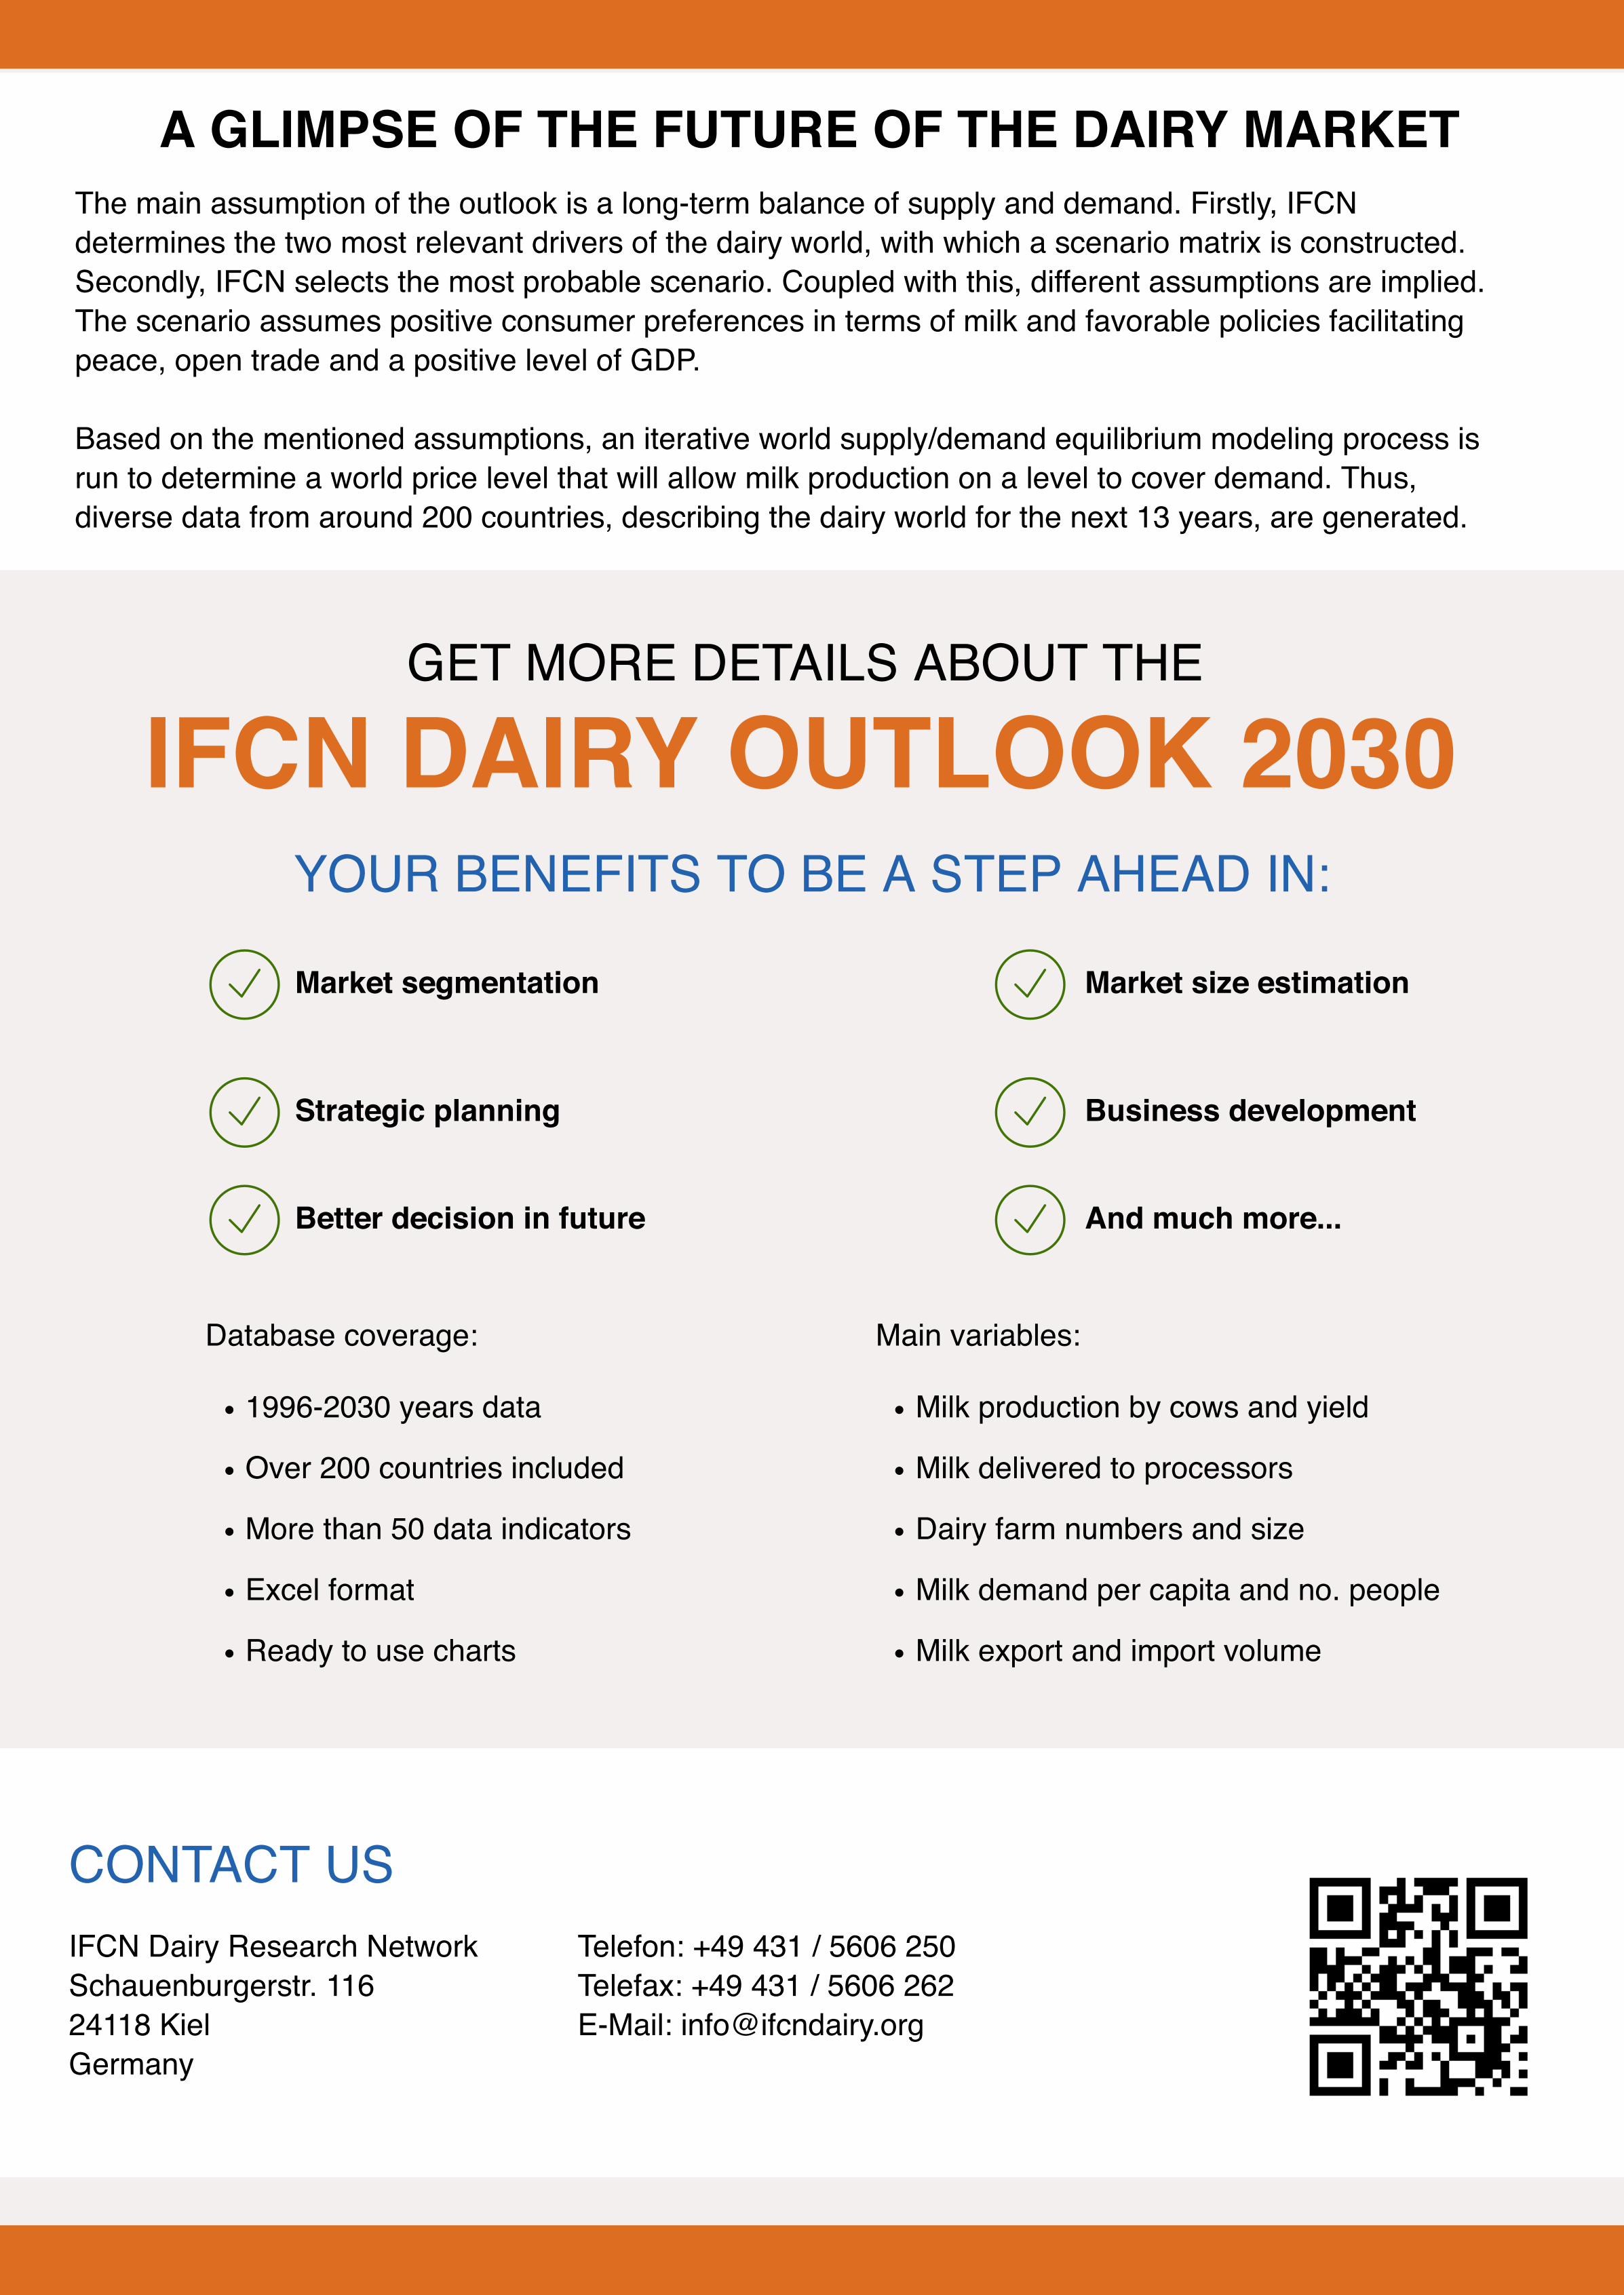
The main assumption of the outlook is a long-term balance of supply and demand. Firstly, IFCNdetermines the two most relevant drivers of the dairy world, with which a scenario matrix is constructed.Secondly, IFCN selects the most probable scenario. Coupled with this, different assumptions are implied.The scenario assumes positive consumer preferences in terms of milk and favorable policies facilitatingpeace, open trade and a positive level of GDP.
Based on the mentioned assumptions, an iterative world supply/demand equilibrium modeling process isrun to determine a world price level that will allow milk production on a level to cover demand. Thus,diverse data from around 200 countries, describing the dairy world for the next 13 years, are generated.
IFCN Dairy Research Network Schauenburgerstr. 116
24118 Kiel Germany
Telefon: +49 431 / 5606 250 Telefax: +49 431 / 5606 262 E-Mail: [email protected]
IFCN DAIRY OUTLOOK 2030 YOUR BENEFITS TO BE A STEP AHEAD IN:
Market segmentation
Market size estimation
Strategic planning
Better decision in future
Business development
And much more...
A GLIMPSE OF THE FUTURE OF THE DAIRY MARKET
GET MORE DETAILS ABOUT THE
Database coverage:
1996-2030 years data
Over 200 countries included
More than 50 data indicators
Excel format
Ready to use charts
Main variables:
Milk production by cows and yield
Milk delivered to processors
Dairy farm numbers and size
Milk demand per capita and no. people
Milk export and import volume