Embed Size (px)
Citation preview
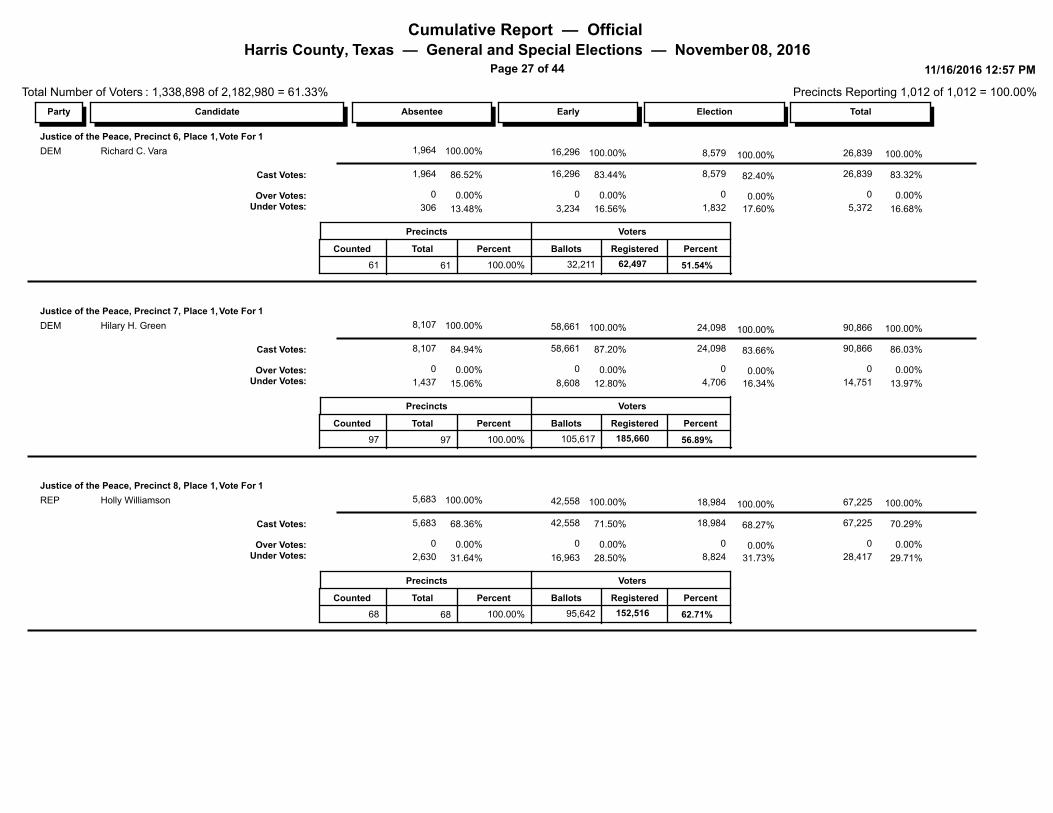
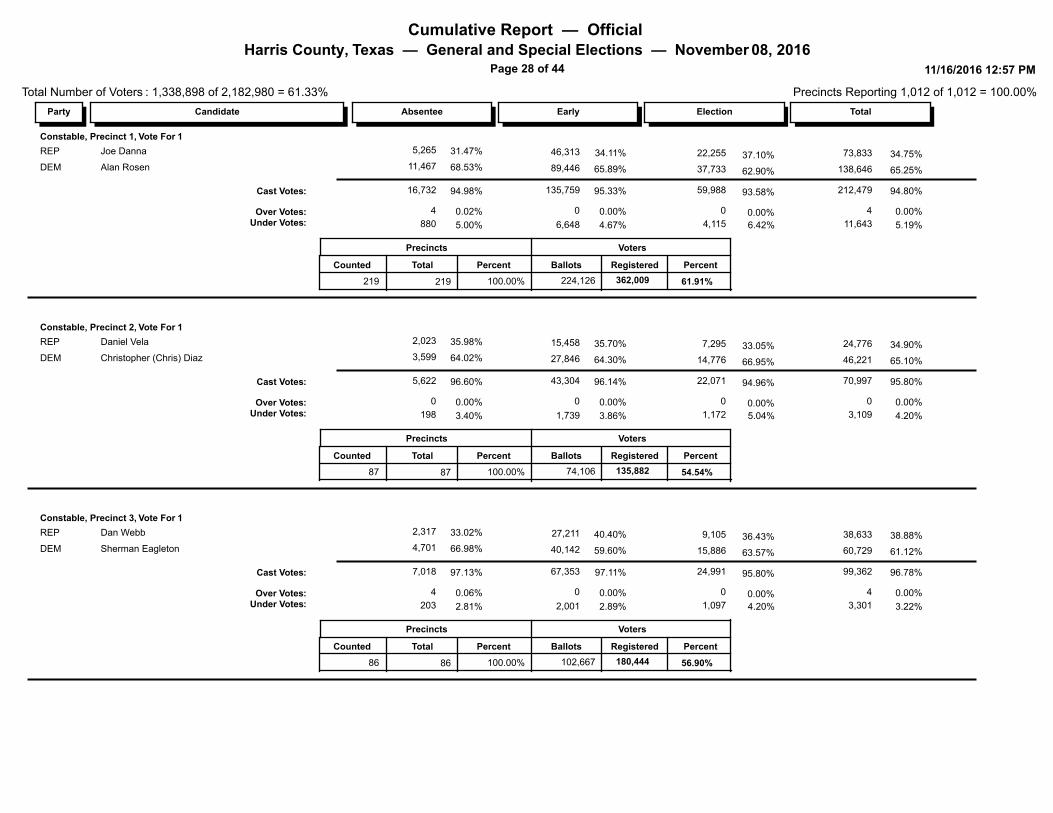
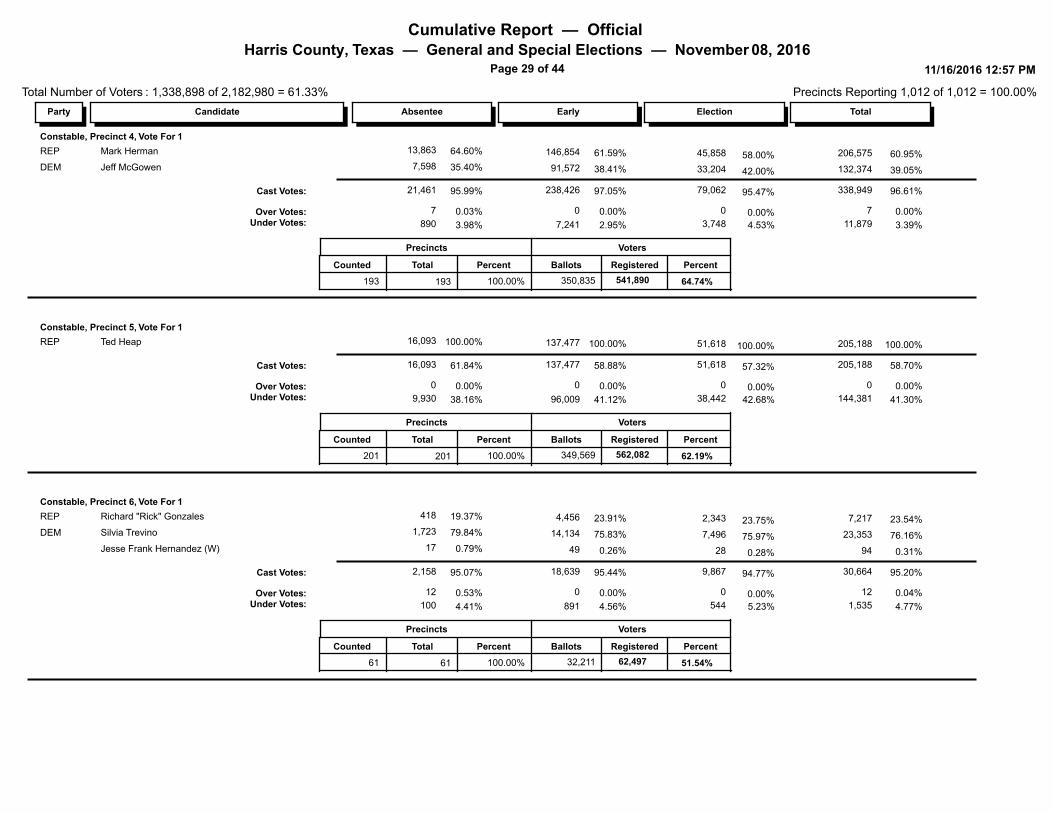
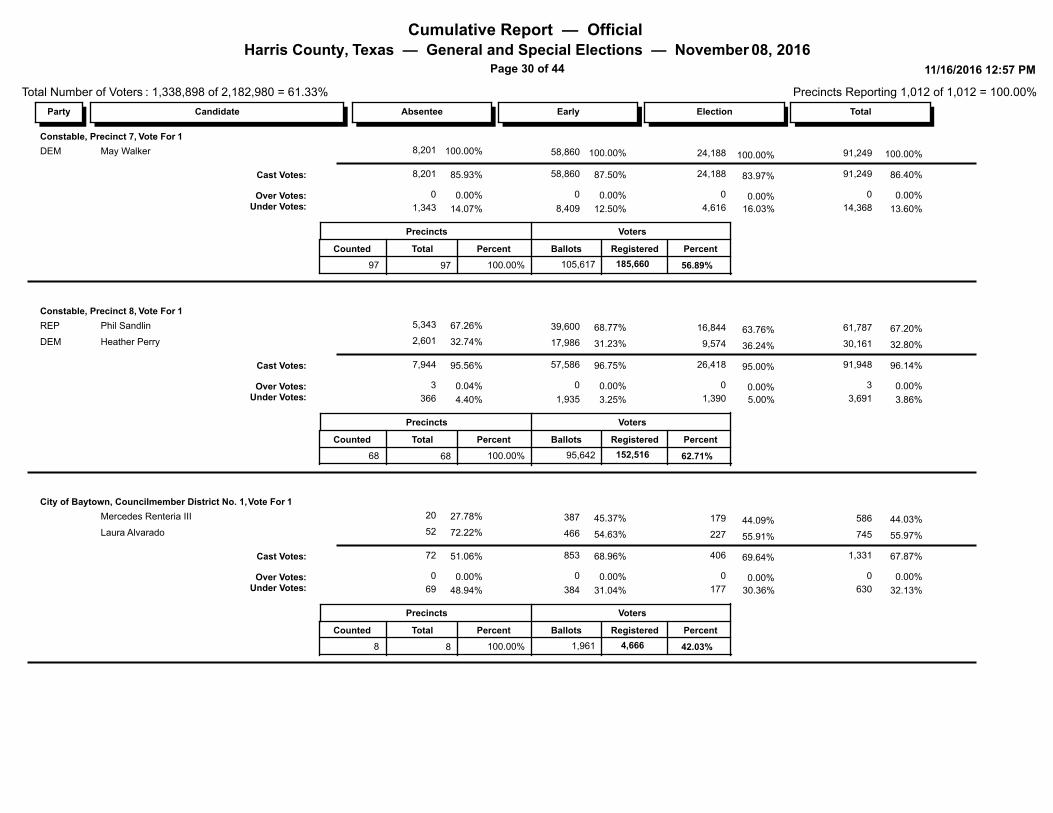
Cumulative Report — Official Harris County, Texas — General and Special Elections — November 08, 2016
Page 1 of 44
Total Number of Voters : 1,338,898 of 2,182,980 = 61.33%
11/16/2016 12:57 PM
Precincts Reporting 1,012 of 1,012 = 100.00%
ElectionEarlyAbsentee TotalParty Candidate
Straight Party, Vote For 1
93,63646.68% 45.28% 401,66347.14% 41.09% 32,592 275,435Republican Party
128,55352.09% 53.21% 472,03052.25% 56.41% 36,121 307,356Democratic Party
3,6980.82% 0.99% 8,7910.39% 1.62% 268 4,825Libertarian Party
2,0140.41% 0.52% 4,5870.23% 0.88% 156 2,417Green Party
227,901 887,071Cast Votes: 66.75% 66.25%68.05% 64.50% 69,137 590,033
451,754
73
125,426
0
Under Votes:Over Votes:
33.25%
0.00%
33.74%
0.01%
31.88%
0.07% 0.00%
35.50%
73
32,384
0
293,944
President and Vice President, Vote For 1
131,23842.90% 41.61% 545,95542.39% 38.12% 42,181 372,536REP Donald J. Trump / Mike Pence
190,86153.24% 53.95% 707,91455.04% 55.44% 54,765 462,288DEM Hillary Clinton / Tim Kaine
15,1452.64% 3.03% 39,7811.73% 4.40% 1,720 22,916LIB Gary Johnson / William Weld
4,8170.75% 0.90% 11,7840.43% 1.40% 430 6,537GRN Jill Stein / Ajamu Baraka
1760.03% 0.04% 4710.02% 0.05% 21 274Darrell L. Castle / Scott N. Bradley (W)
120.01% 0.01% 680.01% 0.00% 7 49Scott Cubbler / Michael Rodriguez (W)
10.00% 0.00% 10.00% 0.00% 0 0Cherunda Fox / Roger Kushner (W)
250.00% 0.00% 620.00% 0.01% 3 34Tom Hoefling / Steve Schulin (W)
450.01% 0.01% 1680.05% 0.01% 51 72Laurence Kotlikoff / Edward Leamer (W)
10.00% 0.00% 20.00% 0.00% 1 0Jonathan Lee / Jeffrey Erskine (W)
830.01% 0.02% 2080.01% 0.02% 13 112Michael A. Maturen / Juan A. Munoz (W)
1,8620.40% 0.43% 5,6470.30% 0.54% 303 3,482Evan McMullin / Nathan Johnson (W)
30.00% 0.00% 210.01% 0.00% 7 11Monica Moorehead / Lamont Lilly (W)
20.00% 0.00% 70.00% 0.00% 3 2Robert Morrow / Todd Sanders (W)
40.00% 0.00% 60.00% 0.00% 0 2Emidio Soltysik / Angela Walker (W)
40.00% 0.00% 90.00% 0.00% 2 3Dale Steffes / Paul E. Case (W)
40.00% 0.00% 80.00% 0.00% 0 4Tony Valdivia / Aaron Barriere (W)
344,283 1,312,112Cast Votes: 98.23% 98.00%97.95% 97.44% 99,507 868,322
26,622
164
9,044
0
Under Votes:Over Votes:
1.77%
0.00%
1.99%
0.01%
1.89%
0.16% 0.00%
2.56%
164
1,923
0
15,655
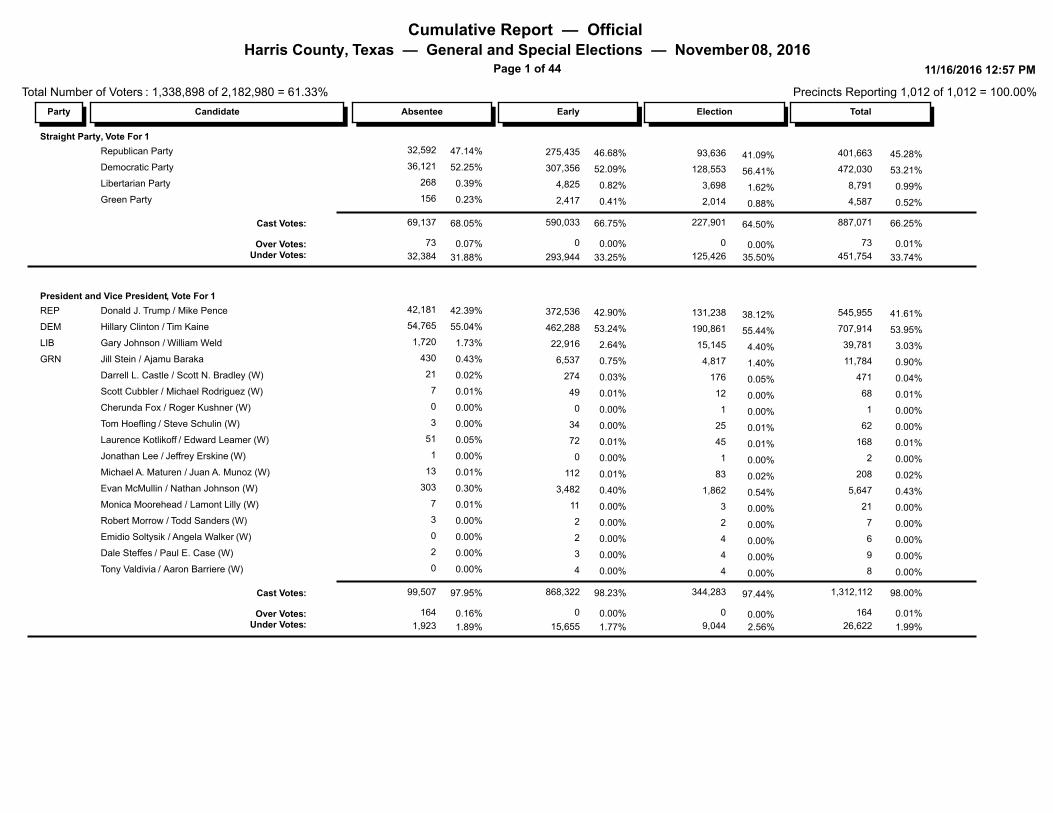
Cumulative Report — Official Harris County, Texas — General and Special Elections — November 08, 2016
Page 2 of 44
Total Number of Voters : 1,338,898 of 2,182,980 = 61.33%
11/16/2016 12:57 PM
Precincts Reporting 1,012 of 1,012 = 100.00%
ElectionEarlyAbsentee TotalParty Candidate
United States Representative, District 2, Vote For 1
39,63560.76% 60.63% 168,69263.79% 59.28% 13,026 116,031REP Ted Poe
23,72336.37% 36.02% 100,23134.59% 35.48% 7,063 69,445DEM Pat Bryan
2,3852.01% 2.31% 6,4291.00% 3.57% 205 3,839LIB James B. Veasaw
1,1160.86% 1.04% 2,8840.62% 1.67% 126 1,642GRN Joshua Darr
66,859 278,236Cast Votes: 97.78% 97.52%97.64% 96.75% 20,420 190,957
7,067
4
2,249
0
Under Votes:Over Votes:
2.22%
0.00%
2.48%
0.00%
2.34%
0.02% 0.00%
3.25%
4
489
0
4,329
Precincts
Counted
158
Total Percent
158
Voters
285,307
Ballots Registered Percent
66.46% 100.00% 429,260
United States Representative, District 7, Vote For 1
38,27555.34% 56.17% 143,54258.26% 57.58% 12,664 92,603REP John Culberson
28,19744.66% 43.83% 111,99141.74% 42.42% 9,072 74,722DEM James Cargas
66,472 255,533Cast Votes: 97.03% 96.70%96.65% 95.87% 21,736 167,325
8,734
0
2,867
0
Under Votes:Over Votes:
2.97%
0.00%
3.30%
0.00%
3.35%
0.00% 0.00%
4.13%
0
753
0
5,114
Precincts
Counted
152
Total Percent
152
Voters
264,267
Ballots Registered Percent
67.04% 100.00% 394,183
United States Representative, District 8, Vote For 1
4,804100.00% 100.00% 22,666100.00% 100.00% 1,129 16,733REP Kevin Brady
4,804 22,666Cast Votes: 73.64% 73.22%71.28% 72.24% 1,129 16,733
8,290
0
1,846
0
Under Votes:Over Votes:
26.36%
0.00%
26.78%
0.00%
28.72%
0.00% 0.00%
27.76%
0
455
0
5,989
Precincts
Counted
19
Total Percent
19
Voters
30,956
Ballots Registered Percent
69.10% 100.00% 44,797
Cumulative Report — Official Harris County, Texas — General and Special Elections — November 08, 2016
Page 3 of 44
Total Number of Voters : 1,338,898 of 2,182,980 = 61.33%
11/16/2016 12:57 PM
Precincts Reporting 1,012 of 1,012 = 100.00%
ElectionEarlyAbsentee TotalParty Candidate
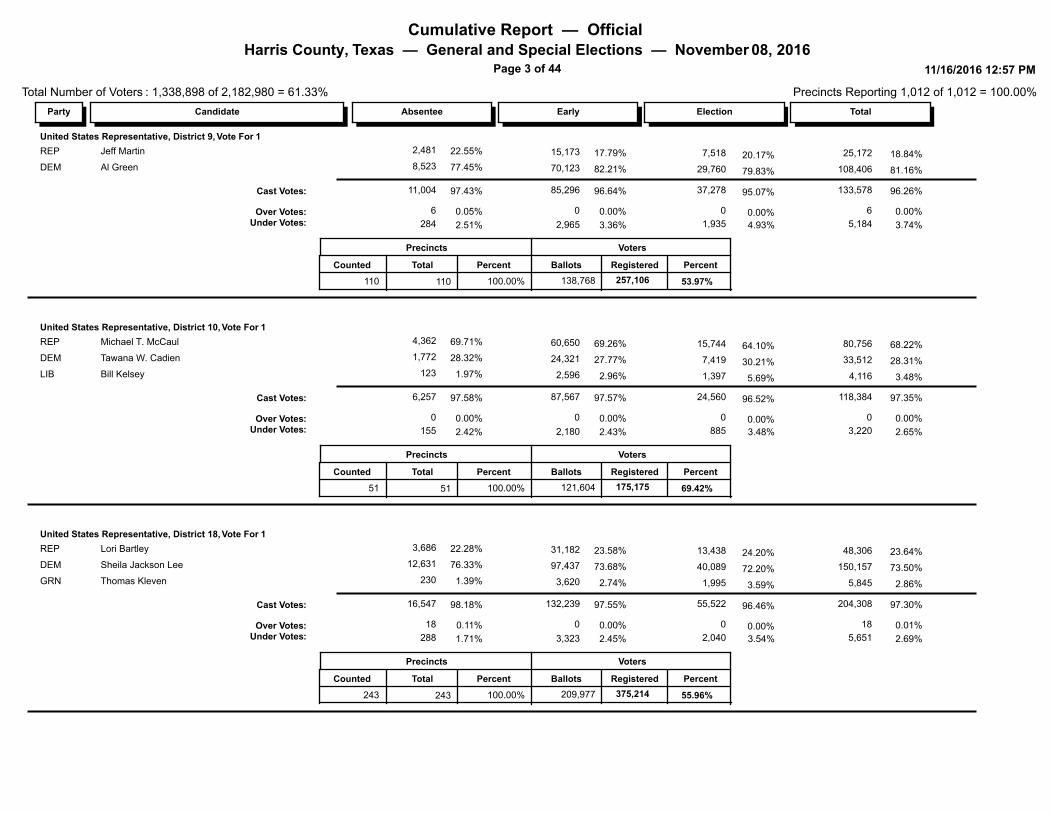
United States Representative, District 9, Vote For 1
7,51817.79% 18.84% 25,17222.55% 20.17% 2,481 15,173REP Jeff Martin
29,76082.21% 81.16% 108,40677.45% 79.83% 8,523 70,123DEM Al Green
37,278 133,578Cast Votes: 96.64% 96.26%97.43% 95.07% 11,004 85,296
5,184
6
1,935
0
Under Votes:Over Votes:
3.36%
0.00%
3.74%
0.00%
2.51%
0.05% 0.00%
4.93%
6
284
0
2,965
Precincts
Counted
110
Total Percent
110
Voters
138,768
Ballots Registered Percent
53.97% 100.00% 257,106
United States Representative, District 10, Vote For 1
15,74469.26% 68.22% 80,75669.71% 64.10% 4,362 60,650REP Michael T. McCaul
7,41927.77% 28.31% 33,51228.32% 30.21% 1,772 24,321DEM Tawana W. Cadien
1,3972.96% 3.48% 4,1161.97% 5.69% 123 2,596LIB Bill Kelsey
24,560 118,384Cast Votes: 97.57% 97.35%97.58% 96.52% 6,257 87,567
3,220
0
885
0
Under Votes:Over Votes:
2.43%
0.00%
2.65%
0.00%
2.42%
0.00% 0.00%
3.48%
0
155
0
2,180
Precincts
Counted
51
Total Percent
51
Voters
121,604
Ballots Registered Percent
69.42% 100.00% 175,175
United States Representative, District 18, Vote For 1
13,43823.58% 23.64% 48,30622.28% 24.20% 3,686 31,182REP Lori Bartley
40,08973.68% 73.50% 150,15776.33% 72.20% 12,631 97,437DEM Sheila Jackson Lee
1,9952.74% 2.86% 5,8451.39% 3.59% 230 3,620GRN Thomas Kleven
55,522 204,308Cast Votes: 97.55% 97.30%98.18% 96.46% 16,547 132,239
5,651
18
2,040
0
Under Votes:Over Votes:
2.45%
0.00%
2.69%
0.01%
1.71%
0.11% 0.00%
3.54%
18
288
0
3,323
Precincts
Counted
243
Total Percent
243
Voters
209,977
Ballots Registered Percent
55.96% 100.00% 375,214
Cumulative Report — Official Harris County, Texas — General and Special Elections — November 08, 2016
Page 4 of 44
Total Number of Voters : 1,338,898 of 2,182,980 = 61.33%
11/16/2016 12:57 PM
Precincts Reporting 1,012 of 1,012 = 100.00%
ElectionEarlyAbsentee TotalParty Candidate
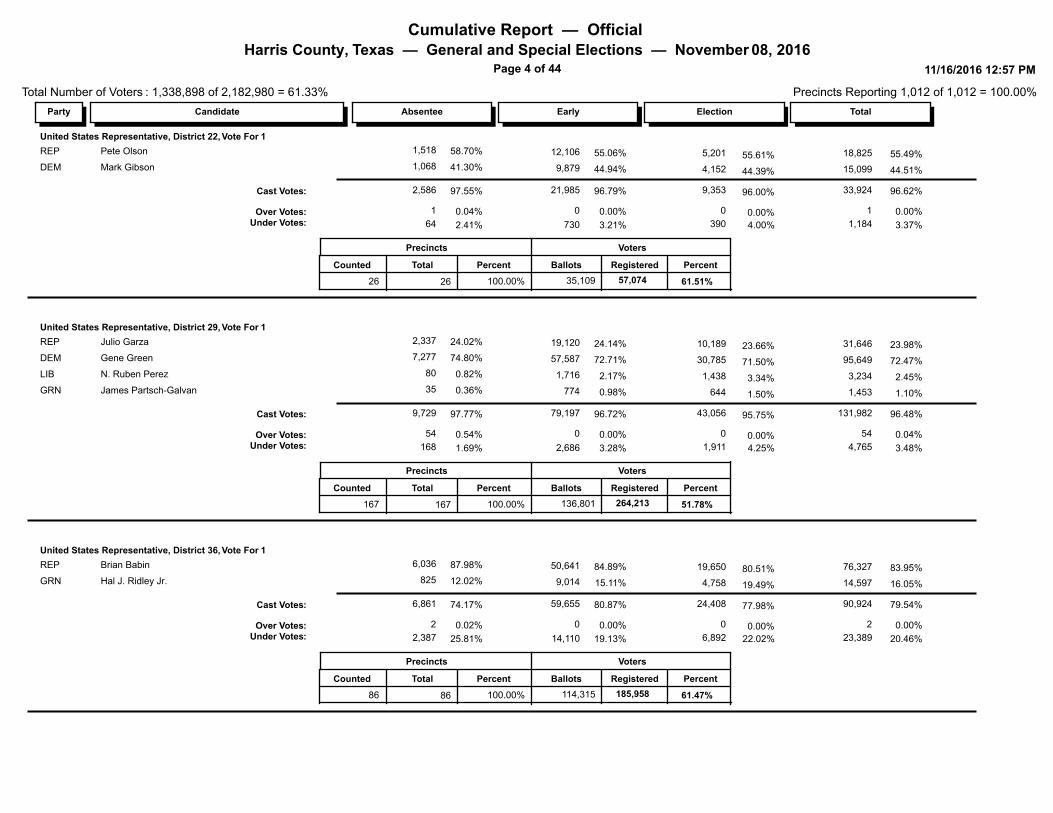
United States Representative, District 22, Vote For 1
5,20155.06% 55.49% 18,82558.70% 55.61% 1,518 12,106REP Pete Olson
4,15244.94% 44.51% 15,09941.30% 44.39% 1,068 9,879DEM Mark Gibson
9,353 33,924Cast Votes: 96.79% 96.62%97.55% 96.00% 2,586 21,985
1,184
1
390
0
Under Votes:Over Votes:
3.21%
0.00%
3.37%
0.00%
2.41%
0.04% 0.00%
4.00%
1
64
0
730
Precincts
Counted
26
Total Percent
26
Voters
35,109
Ballots Registered Percent
61.51% 100.00% 57,074
United States Representative, District 29, Vote For 1
10,18924.14% 23.98% 31,64624.02% 23.66% 2,337 19,120REP Julio Garza
30,78572.71% 72.47% 95,64974.80% 71.50% 7,277 57,587DEM Gene Green
1,4382.17% 2.45% 3,2340.82% 3.34% 80 1,716LIB N. Ruben Perez
6440.98% 1.10% 1,4530.36% 1.50% 35 774GRN James Partsch-Galvan
43,056 131,982Cast Votes: 96.72% 96.48%97.77% 95.75% 9,729 79,197
4,765
54
1,911
0
Under Votes:Over Votes:
3.28%
0.00%
3.48%
0.04%
1.69%
0.54% 0.00%
4.25%
54
168
0
2,686
Precincts
Counted
167
Total Percent
167
Voters
136,801
Ballots Registered Percent
51.78% 100.00% 264,213
United States Representative, District 36, Vote For 1
19,65084.89% 83.95% 76,32787.98% 80.51% 6,036 50,641REP Brian Babin
4,75815.11% 16.05% 14,59712.02% 19.49% 825 9,014GRN Hal J. Ridley Jr.
24,408 90,924Cast Votes: 80.87% 79.54%74.17% 77.98% 6,861 59,655
23,389
2
6,892
0
Under Votes:Over Votes:
19.13%
0.00%
20.46%
0.00%
25.81%
0.02% 0.00%
22.02%
2
2,387
0
14,110
Precincts
Counted
86
Total Percent
86
Voters
114,315
Ballots Registered Percent
61.47% 100.00% 185,958
Cumulative Report — Official Harris County, Texas — General and Special Elections — November 08, 2016
Page 5 of 44
Total Number of Voters : 1,338,898 of 2,182,980 = 61.33%
11/16/2016 12:57 PM
Precincts Reporting 1,012 of 1,012 = 100.00%
ElectionEarlyAbsentee TotalParty Candidate
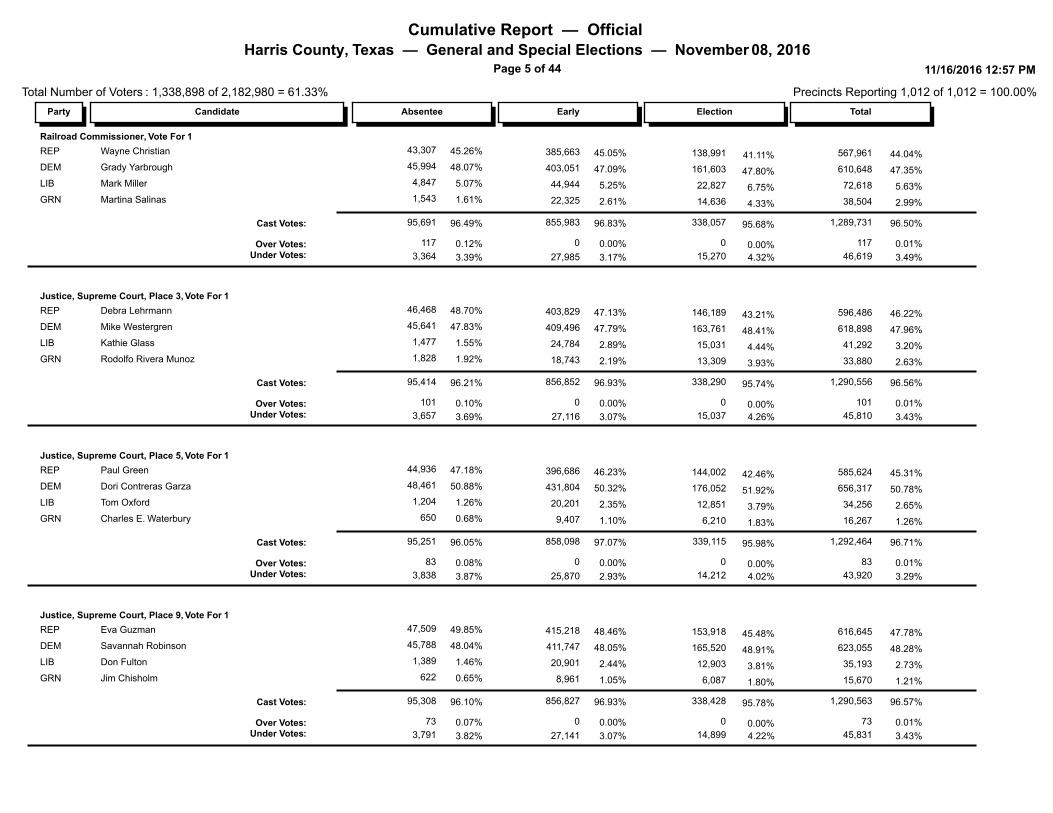
Railroad Commissioner, Vote For 1
138,99145.05% 44.04% 567,96145.26% 41.11% 43,307 385,663REP Wayne Christian
161,60347.09% 47.35% 610,64848.07% 47.80% 45,994 403,051DEM Grady Yarbrough
22,8275.25% 5.63% 72,6185.07% 6.75% 4,847 44,944LIB Mark Miller
14,6362.61% 2.99% 38,5041.61% 4.33% 1,543 22,325GRN Martina Salinas
338,057 1,289,731Cast Votes: 96.83% 96.50%96.49% 95.68% 95,691 855,983
46,619
117
15,270
0
Under Votes:Over Votes:
3.17%
0.00%
3.49%
0.01%
3.39%
0.12% 0.00%
4.32%
117
3,364
0
27,985
Justice, Supreme Court, Place 3, Vote For 1
146,18947.13% 46.22% 596,48648.70% 43.21% 46,468 403,829REP Debra Lehrmann
163,76147.79% 47.96% 618,89847.83% 48.41% 45,641 409,496DEM Mike Westergren
15,0312.89% 3.20% 41,2921.55% 4.44% 1,477 24,784LIB Kathie Glass
13,3092.19% 2.63% 33,8801.92% 3.93% 1,828 18,743GRN Rodolfo Rivera Munoz
338,290 1,290,556Cast Votes: 96.93% 96.56%96.21% 95.74% 95,414 856,852
45,810
101
15,037
0
Under Votes:Over Votes:
3.07%
0.00%
3.43%
0.01%
3.69%
0.10% 0.00%
4.26%
101
3,657
0
27,116
Justice, Supreme Court, Place 5, Vote For 1
144,00246.23% 45.31% 585,62447.18% 42.46% 44,936 396,686REP Paul Green
176,05250.32% 50.78% 656,31750.88% 51.92% 48,461 431,804DEM Dori Contreras Garza
12,8512.35% 2.65% 34,2561.26% 3.79% 1,204 20,201LIB Tom Oxford
6,2101.10% 1.26% 16,2670.68% 1.83% 650 9,407GRN Charles E. Waterbury
339,115 1,292,464Cast Votes: 97.07% 96.71%96.05% 95.98% 95,251 858,098
43,920
83
14,212
0
Under Votes:Over Votes:
2.93%
0.00%
3.29%
0.01%
3.87%
0.08% 0.00%
4.02%
83
3,838
0
25,870
Justice, Supreme Court, Place 9, Vote For 1
153,91848.46% 47.78% 616,64549.85% 45.48% 47,509 415,218REP Eva Guzman
165,52048.05% 48.28% 623,05548.04% 48.91% 45,788 411,747DEM Savannah Robinson
12,9032.44% 2.73% 35,1931.46% 3.81% 1,389 20,901LIB Don Fulton
6,0871.05% 1.21% 15,6700.65% 1.80% 622 8,961GRN Jim Chisholm
338,428 1,290,563Cast Votes: 96.93% 96.57%96.10% 95.78% 95,308 856,827
45,831
73
14,899
0
Under Votes:Over Votes:
3.07%
0.00%
3.43%
0.01%
3.82%
0.07% 0.00%
4.22%
73
3,791
0
27,141
Cumulative Report — Official Harris County, Texas — General and Special Elections — November 08, 2016
Page 6 of 44
Total Number of Voters : 1,338,898 of 2,182,980 = 61.33%
11/16/2016 12:57 PM
Precincts Reporting 1,012 of 1,012 = 100.00%
ElectionEarlyAbsentee TotalParty Candidate
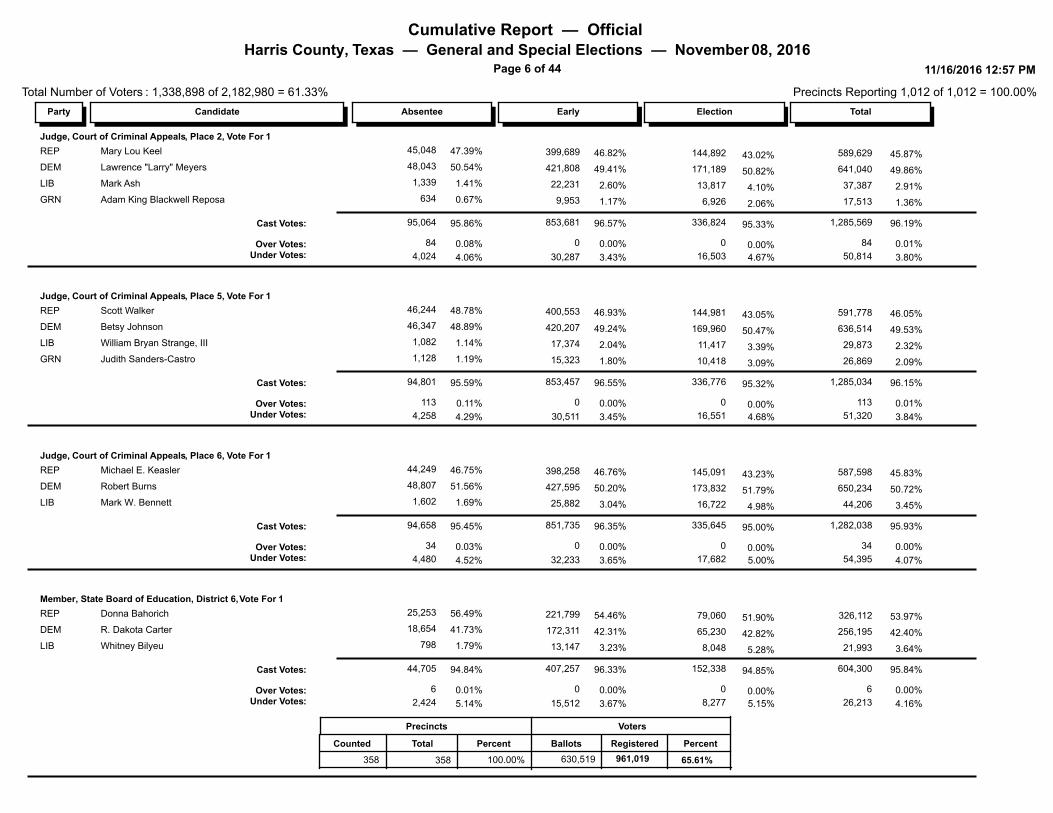
Judge, Court of Criminal Appeals, Place 2, Vote For 1
144,89246.82% 45.87% 589,62947.39% 43.02% 45,048 399,689REP Mary Lou Keel
171,18949.41% 49.86% 641,04050.54% 50.82% 48,043 421,808DEM Lawrence "Larry" Meyers
13,8172.60% 2.91% 37,3871.41% 4.10% 1,339 22,231LIB Mark Ash
6,9261.17% 1.36% 17,5130.67% 2.06% 634 9,953GRN Adam King Blackwell Reposa
336,824 1,285,569Cast Votes: 96.57% 96.19%95.86% 95.33% 95,064 853,681
50,814
84
16,503
0
Under Votes:Over Votes:
3.43%
0.00%
3.80%
0.01%
4.06%
0.08% 0.00%
4.67%
84
4,024
0
30,287
Judge, Court of Criminal Appeals, Place 5, Vote For 1
144,98146.93% 46.05% 591,77848.78% 43.05% 46,244 400,553REP Scott Walker
169,96049.24% 49.53% 636,51448.89% 50.47% 46,347 420,207DEM Betsy Johnson
11,4172.04% 2.32% 29,8731.14% 3.39% 1,082 17,374LIB William Bryan Strange, III
10,4181.80% 2.09% 26,8691.19% 3.09% 1,128 15,323GRN Judith Sanders-Castro
336,776 1,285,034Cast Votes: 96.55% 96.15%95.59% 95.32% 94,801 853,457
51,320
113
16,551
0
Under Votes:Over Votes:
3.45%
0.00%
3.84%
0.01%
4.29%
0.11% 0.00%
4.68%
113
4,258
0
30,511
Judge, Court of Criminal Appeals, Place 6, Vote For 1
145,09146.76% 45.83% 587,59846.75% 43.23% 44,249 398,258REP Michael E. Keasler
173,83250.20% 50.72% 650,23451.56% 51.79% 48,807 427,595DEM Robert Burns
16,7223.04% 3.45% 44,2061.69% 4.98% 1,602 25,882LIB Mark W. Bennett
335,645 1,282,038Cast Votes: 96.35% 95.93%95.45% 95.00% 94,658 851,735
54,395
34
17,682
0
Under Votes:Over Votes:
3.65%
0.00%
4.07%
0.00%
4.52%
0.03% 0.00%
5.00%
34
4,480
0
32,233
Member, State Board of Education, District 6, Vote For 1
79,06054.46% 53.97% 326,11256.49% 51.90% 25,253 221,799REP Donna Bahorich
65,23042.31% 42.40% 256,19541.73% 42.82% 18,654 172,311DEM R. Dakota Carter
8,0483.23% 3.64% 21,9931.79% 5.28% 798 13,147LIB Whitney Bilyeu
152,338 604,300Cast Votes: 96.33% 95.84%94.84% 94.85% 44,705 407,257
26,213
6
8,277
0
Under Votes:Over Votes:
3.67%
0.00%
4.16%
0.00%
5.14%
0.01% 0.00%
5.15%
6
2,424
0
15,512
Precincts
Counted
358
Total Percent
358
Voters
630,519
Ballots Registered Percent
65.61% 100.00% 961,019
Cumulative Report — Official Harris County, Texas — General and Special Elections — November 08, 2016
Page 7 of 44
Total Number of Voters : 1,338,898 of 2,182,980 = 61.33%
11/16/2016 12:57 PM
Precincts Reporting 1,012 of 1,012 = 100.00%
ElectionEarlyAbsentee TotalParty Candidate
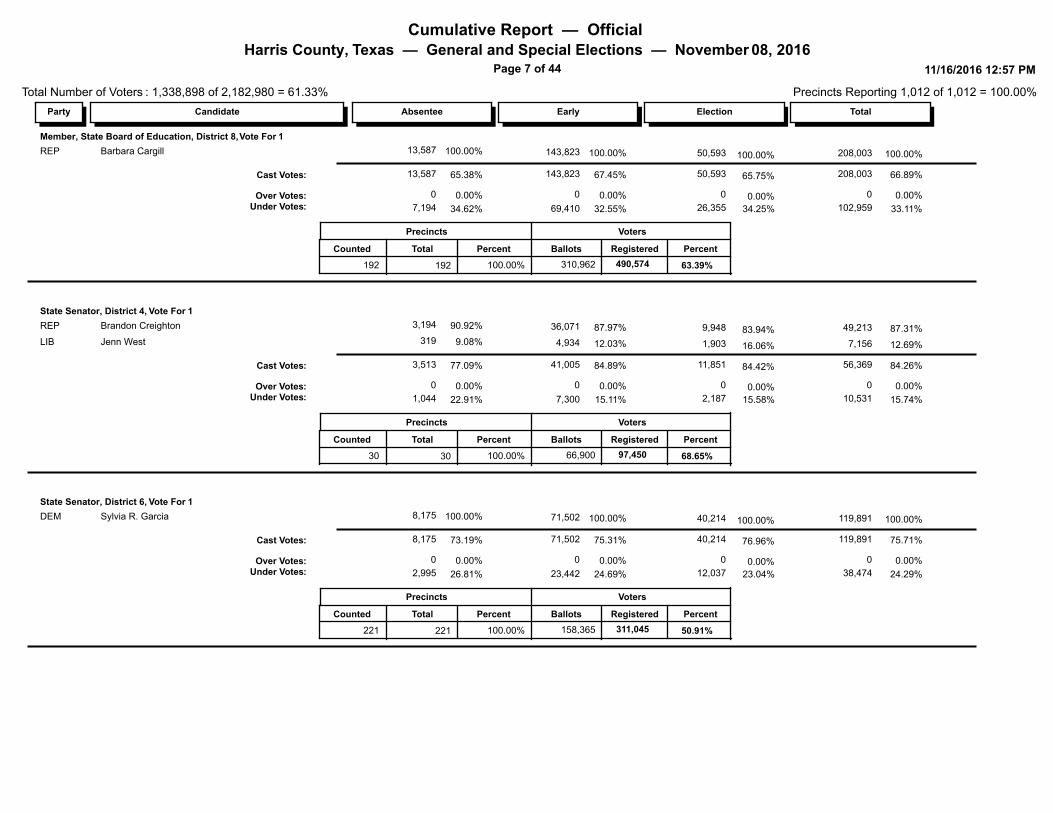
Member, State Board of Education, District 8, Vote For 1
50,593100.00% 100.00% 208,003100.00% 100.00% 13,587 143,823REP Barbara Cargill
50,593 208,003Cast Votes: 67.45% 66.89%65.38% 65.75% 13,587 143,823
102,959
0
26,355
0
Under Votes:Over Votes:
32.55%
0.00%
33.11%
0.00%
34.62%
0.00% 0.00%
34.25%
0
7,194
0
69,410
Precincts
Counted
192
Total Percent
192
Voters
310,962
Ballots Registered Percent
63.39% 100.00% 490,574
State Senator, District 4, Vote For 1
9,94887.97% 87.31% 49,21390.92% 83.94% 3,194 36,071REP Brandon Creighton
1,90312.03% 12.69% 7,1569.08% 16.06% 319 4,934LIB Jenn West
11,851 56,369Cast Votes: 84.89% 84.26%77.09% 84.42% 3,513 41,005
10,531
0
2,187
0
Under Votes:Over Votes:
15.11%
0.00%
15.74%
0.00%
22.91%
0.00% 0.00%
15.58%
0
1,044
0
7,300
Precincts
Counted
30
Total Percent
30
Voters
66,900
Ballots Registered Percent
68.65% 100.00% 97,450
State Senator, District 6, Vote For 1
40,214100.00% 100.00% 119,891100.00% 100.00% 8,175 71,502DEM Sylvia R. Garcia
40,214 119,891Cast Votes: 75.31% 75.71%73.19% 76.96% 8,175 71,502
38,474
0
12,037
0
Under Votes:Over Votes:
24.69%
0.00%
24.29%
0.00%
26.81%
0.00% 0.00%
23.04%
0
2,995
0
23,442
Precincts
Counted
221
Total Percent
221
Voters
158,365
Ballots Registered Percent
50.91% 100.00% 311,045
Cumulative Report — Official Harris County, Texas — General and Special Elections — November 08, 2016
Page 8 of 44
Total Number of Voters : 1,338,898 of 2,182,980 = 61.33%
11/16/2016 12:57 PM
Precincts Reporting 1,012 of 1,012 = 100.00%
ElectionEarlyAbsentee TotalParty Candidate
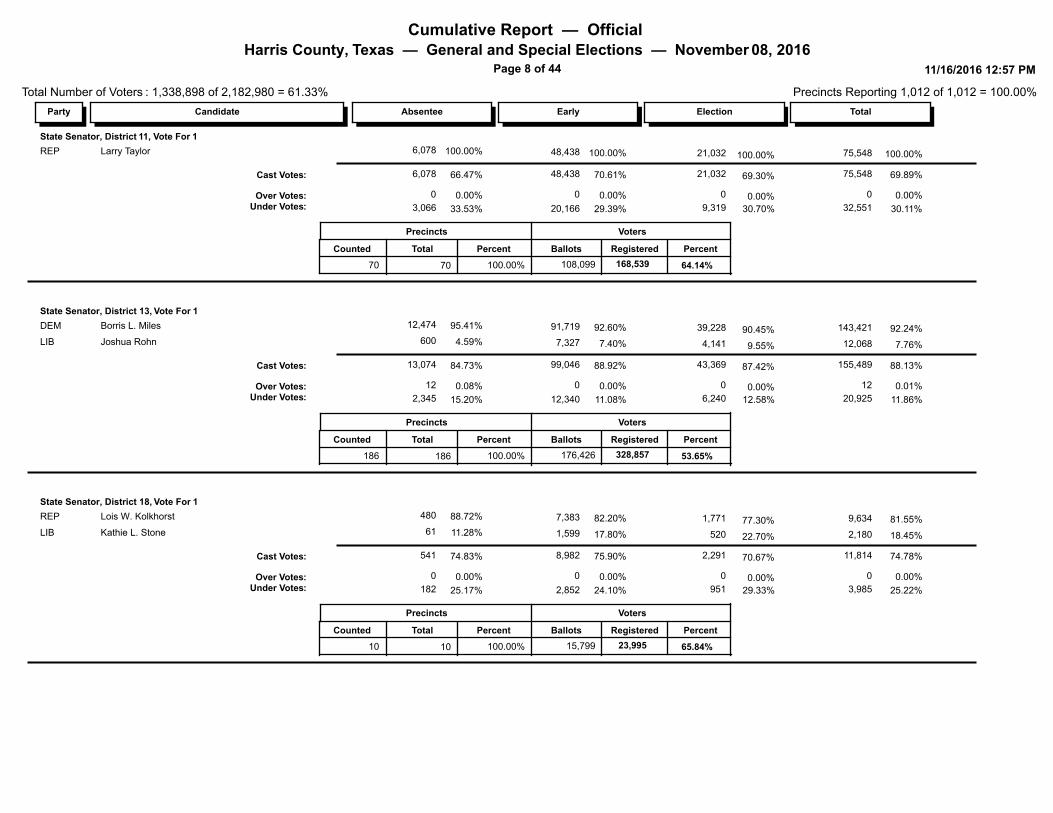
State Senator, District 11, Vote For 1
21,032100.00% 100.00% 75,548100.00% 100.00% 6,078 48,438REP Larry Taylor
21,032 75,548Cast Votes: 70.61% 69.89%66.47% 69.30% 6,078 48,438
32,551
0
9,319
0
Under Votes:Over Votes:
29.39%
0.00%
30.11%
0.00%
33.53%
0.00% 0.00%
30.70%
0
3,066
0
20,166
Precincts
Counted
70
Total Percent
70
Voters
108,099
Ballots Registered Percent
64.14% 100.00% 168,539
State Senator, District 13, Vote For 1
39,22892.60% 92.24% 143,42195.41% 90.45% 12,474 91,719DEM Borris L. Miles
4,1417.40% 7.76% 12,0684.59% 9.55% 600 7,327LIB Joshua Rohn
43,369 155,489Cast Votes: 88.92% 88.13%84.73% 87.42% 13,074 99,046
20,925
12
6,240
0
Under Votes:Over Votes:
11.08%
0.00%
11.86%
0.01%
15.20%
0.08% 0.00%
12.58%
12
2,345
0
12,340
Precincts
Counted
186
Total Percent
186
Voters
176,426
Ballots Registered Percent
53.65% 100.00% 328,857
State Senator, District 18, Vote For 1
1,77182.20% 81.55% 9,63488.72% 77.30% 480 7,383REP Lois W. Kolkhorst
52017.80% 18.45% 2,18011.28% 22.70% 61 1,599LIB Kathie L. Stone
2,291 11,814Cast Votes: 75.90% 74.78%74.83% 70.67% 541 8,982
3,985
0
951
0
Under Votes:Over Votes:
24.10%
0.00%
25.22%
0.00%
25.17%
0.00% 0.00%
29.33%
0
182
0
2,852
Precincts
Counted
10
Total Percent
10
Voters
15,799
Ballots Registered Percent
65.84% 100.00% 23,995
Cumulative Report — Official Harris County, Texas — General and Special Elections — November 08, 2016
Page 9 of 44
Total Number of Voters : 1,338,898 of 2,182,980 = 61.33%
11/16/2016 12:57 PM
Precincts Reporting 1,012 of 1,012 = 100.00%
ElectionEarlyAbsentee TotalParty Candidate
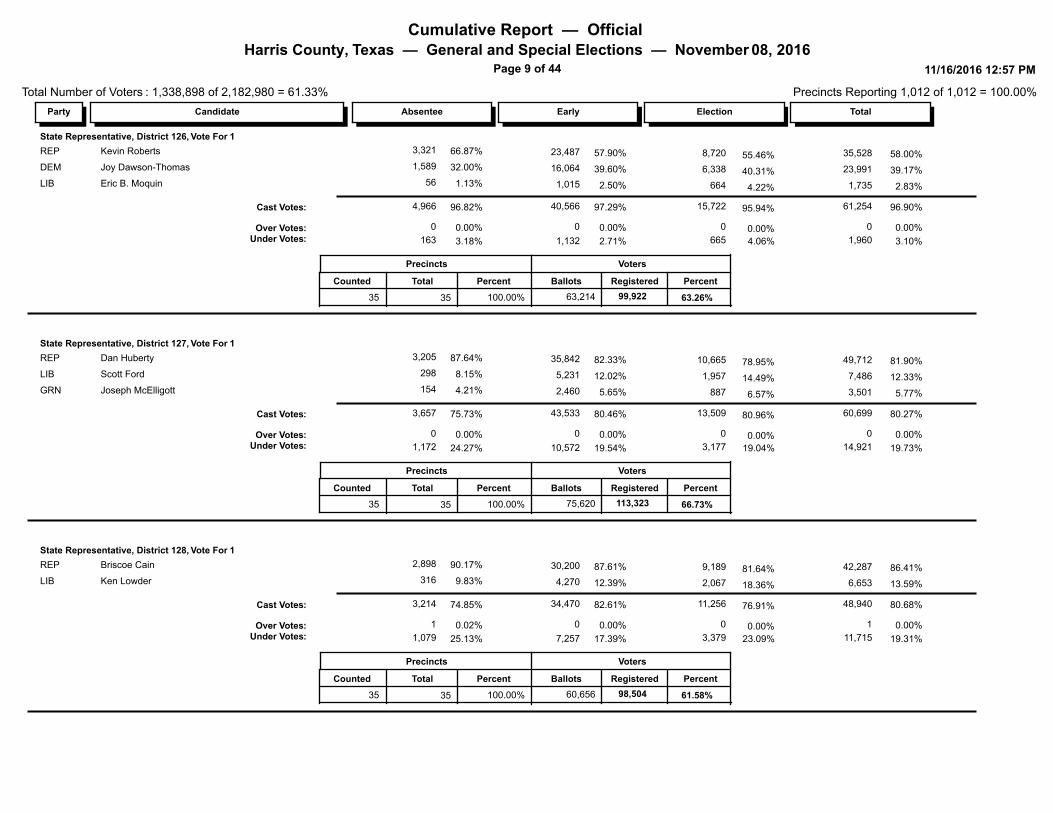
State Representative, District 126, Vote For 1
8,72057.90% 58.00% 35,52866.87% 55.46% 3,321 23,487REP Kevin Roberts
6,33839.60% 39.17% 23,99132.00% 40.31% 1,589 16,064DEM Joy Dawson-Thomas
6642.50% 2.83% 1,7351.13% 4.22% 56 1,015LIB Eric B. Moquin
15,722 61,254Cast Votes: 97.29% 96.90%96.82% 95.94% 4,966 40,566
1,960
0
665
0
Under Votes:Over Votes:
2.71%
0.00%
3.10%
0.00%
3.18%
0.00% 0.00%
4.06%
0
163
0
1,132
Precincts
Counted
35
Total Percent
35
Voters
63,214
Ballots Registered Percent
63.26% 100.00% 99,922
State Representative, District 127, Vote For 1
10,66582.33% 81.90% 49,71287.64% 78.95% 3,205 35,842REP Dan Huberty
1,95712.02% 12.33% 7,4868.15% 14.49% 298 5,231LIB Scott Ford
8875.65% 5.77% 3,5014.21% 6.57% 154 2,460GRN Joseph McElligott
13,509 60,699Cast Votes: 80.46% 80.27%75.73% 80.96% 3,657 43,533
14,921
0
3,177
0
Under Votes:Over Votes:
19.54%
0.00%
19.73%
0.00%
24.27%
0.00% 0.00%
19.04%
0
1,172
0
10,572
Precincts
Counted
35
Total Percent
35
Voters
75,620
Ballots Registered Percent
66.73% 100.00% 113,323
State Representative, District 128, Vote For 1
9,18987.61% 86.41% 42,28790.17% 81.64% 2,898 30,200REP Briscoe Cain
2,06712.39% 13.59% 6,6539.83% 18.36% 316 4,270LIB Ken Lowder
11,256 48,940Cast Votes: 82.61% 80.68%74.85% 76.91% 3,214 34,470
11,715
1
3,379
0
Under Votes:Over Votes:
17.39%
0.00%
19.31%
0.00%
25.13%
0.02% 0.00%
23.09%
1
1,079
0
7,257
Precincts
Counted
35
Total Percent
35
Voters
60,656
Ballots Registered Percent
61.58% 100.00% 98,504
Cumulative Report — Official Harris County, Texas — General and Special Elections — November 08, 2016
Page 10 of 44
Total Number of Voters : 1,338,898 of 2,182,980 = 61.33%
11/16/2016 12:57 PM
Precincts Reporting 1,012 of 1,012 = 100.00%
ElectionEarlyAbsentee TotalParty Candidate
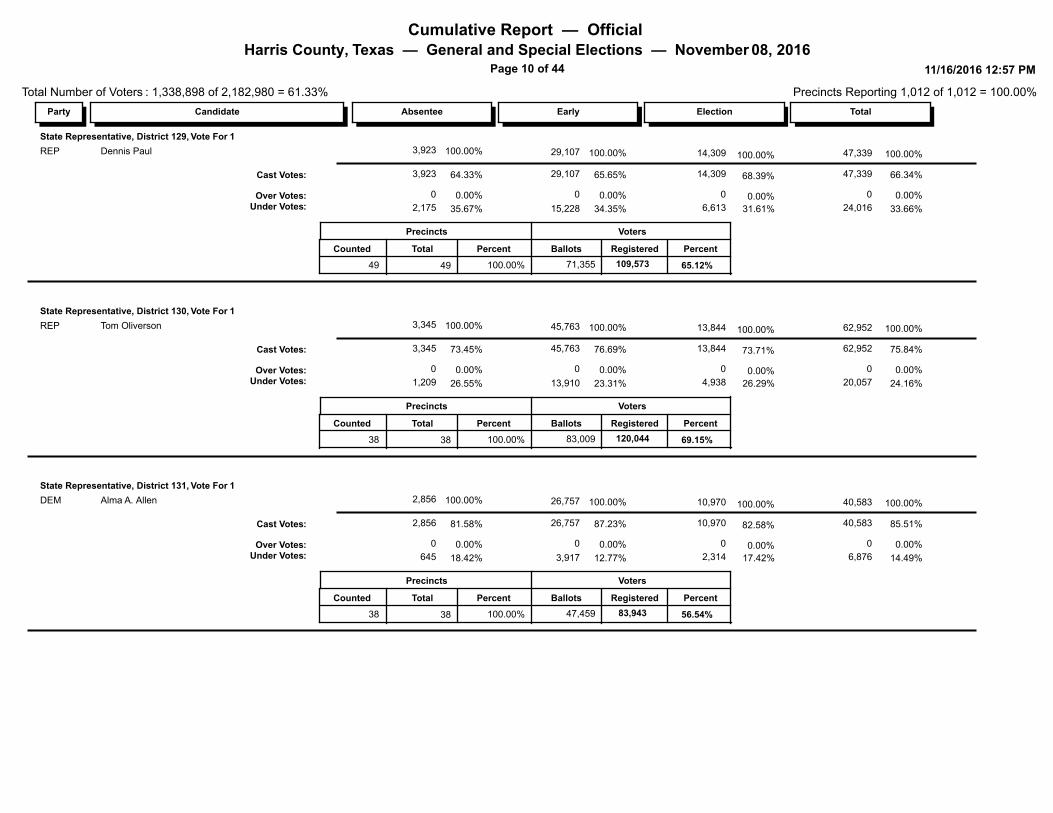
State Representative, District 129, Vote For 1
14,309100.00% 100.00% 47,339100.00% 100.00% 3,923 29,107REP Dennis Paul
14,309 47,339Cast Votes: 65.65% 66.34%64.33% 68.39% 3,923 29,107
24,016
0
6,613
0
Under Votes:Over Votes:
34.35%
0.00%
33.66%
0.00%
35.67%
0.00% 0.00%
31.61%
0
2,175
0
15,228
Precincts
Counted
49
Total Percent
49
Voters
71,355
Ballots Registered Percent
65.12% 100.00% 109,573
State Representative, District 130, Vote For 1
13,844100.00% 100.00% 62,952100.00% 100.00% 3,345 45,763REP Tom Oliverson
13,844 62,952Cast Votes: 76.69% 75.84%73.45% 73.71% 3,345 45,763
20,057
0
4,938
0
Under Votes:Over Votes:
23.31%
0.00%
24.16%
0.00%
26.55%
0.00% 0.00%
26.29%
0
1,209
0
13,910
Precincts
Counted
38
Total Percent
38
Voters
83,009
Ballots Registered Percent
69.15% 100.00% 120,044
State Representative, District 131, Vote For 1
10,970100.00% 100.00% 40,583100.00% 100.00% 2,856 26,757DEM Alma A. Allen
10,970 40,583Cast Votes: 87.23% 85.51%81.58% 82.58% 2,856 26,757
6,876
0
2,314
0
Under Votes:Over Votes:
12.77%
0.00%
14.49%
0.00%
18.42%
0.00% 0.00%
17.42%
0
645
0
3,917
Precincts
Counted
38
Total Percent
38
Voters
47,459
Ballots Registered Percent
56.54% 100.00% 83,943
Cumulative Report — Official Harris County, Texas — General and Special Elections — November 08, 2016
Page 11 of 44
Total Number of Voters : 1,338,898 of 2,182,980 = 61.33%
11/16/2016 12:57 PM
Precincts Reporting 1,012 of 1,012 = 100.00%
ElectionEarlyAbsentee TotalParty Candidate
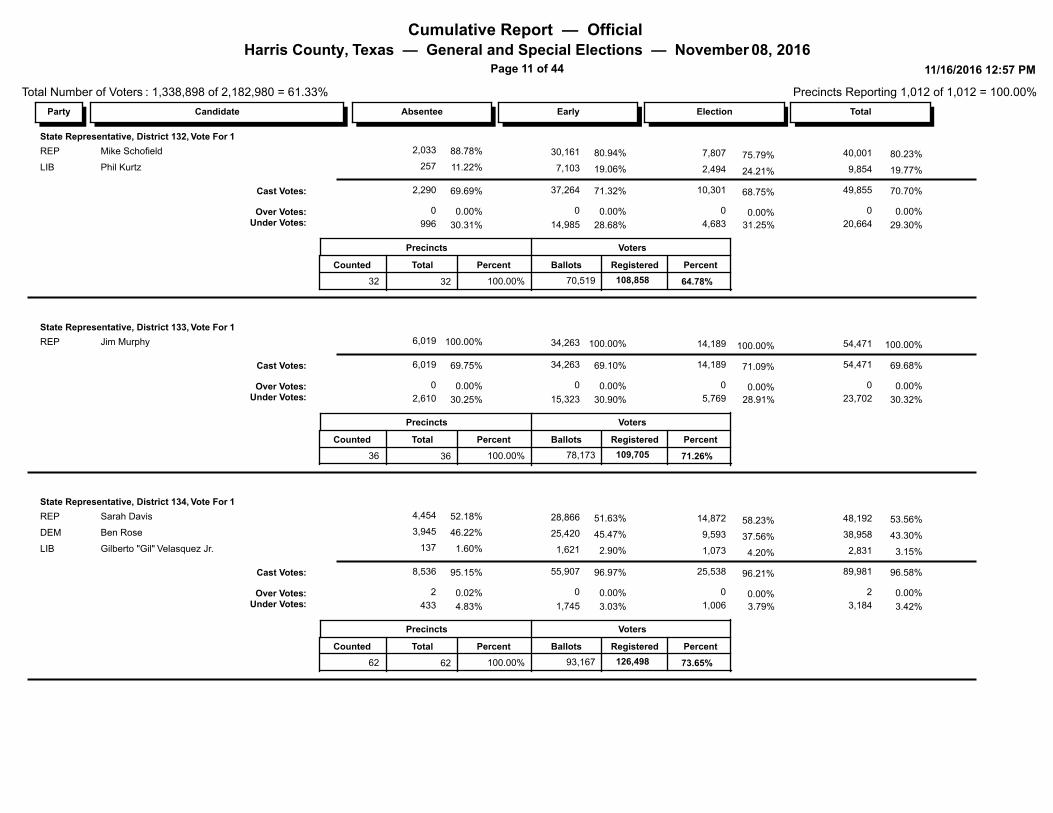
State Representative, District 132, Vote For 1
7,80780.94% 80.23% 40,00188.78% 75.79% 2,033 30,161REP Mike Schofield
2,49419.06% 19.77% 9,85411.22% 24.21% 257 7,103LIB Phil Kurtz
10,301 49,855Cast Votes: 71.32% 70.70%69.69% 68.75% 2,290 37,264
20,664
0
4,683
0
Under Votes:Over Votes:
28.68%
0.00%
29.30%
0.00%
30.31%
0.00% 0.00%
31.25%
0
996
0
14,985
Precincts
Counted
32
Total Percent
32
Voters
70,519
Ballots Registered Percent
64.78% 100.00% 108,858
State Representative, District 133, Vote For 1
14,189100.00% 100.00% 54,471100.00% 100.00% 6,019 34,263REP Jim Murphy
14,189 54,471Cast Votes: 69.10% 69.68%69.75% 71.09% 6,019 34,263
23,702
0
5,769
0
Under Votes:Over Votes:
30.90%
0.00%
30.32%
0.00%
30.25%
0.00% 0.00%
28.91%
0
2,610
0
15,323
Precincts
Counted
36
Total Percent
36
Voters
78,173
Ballots Registered Percent
71.26% 100.00% 109,705
State Representative, District 134, Vote For 1
14,87251.63% 53.56% 48,19252.18% 58.23% 4,454 28,866REP Sarah Davis
9,59345.47% 43.30% 38,95846.22% 37.56% 3,945 25,420DEM Ben Rose
1,0732.90% 3.15% 2,8311.60% 4.20% 137 1,621LIB Gilberto "Gil" Velasquez Jr.
25,538 89,981Cast Votes: 96.97% 96.58%95.15% 96.21% 8,536 55,907
3,184
2
1,006
0
Under Votes:Over Votes:
3.03%
0.00%
3.42%
0.00%
4.83%
0.02% 0.00%
3.79%
2
433
0
1,745
Precincts
Counted
62
Total Percent
62
Voters
93,167
Ballots Registered Percent
73.65% 100.00% 126,498
Cumulative Report — Official Harris County, Texas — General and Special Elections — November 08, 2016
Page 12 of 44
Total Number of Voters : 1,338,898 of 2,182,980 = 61.33%
11/16/2016 12:57 PM
Precincts Reporting 1,012 of 1,012 = 100.00%
ElectionEarlyAbsentee TotalParty Candidate
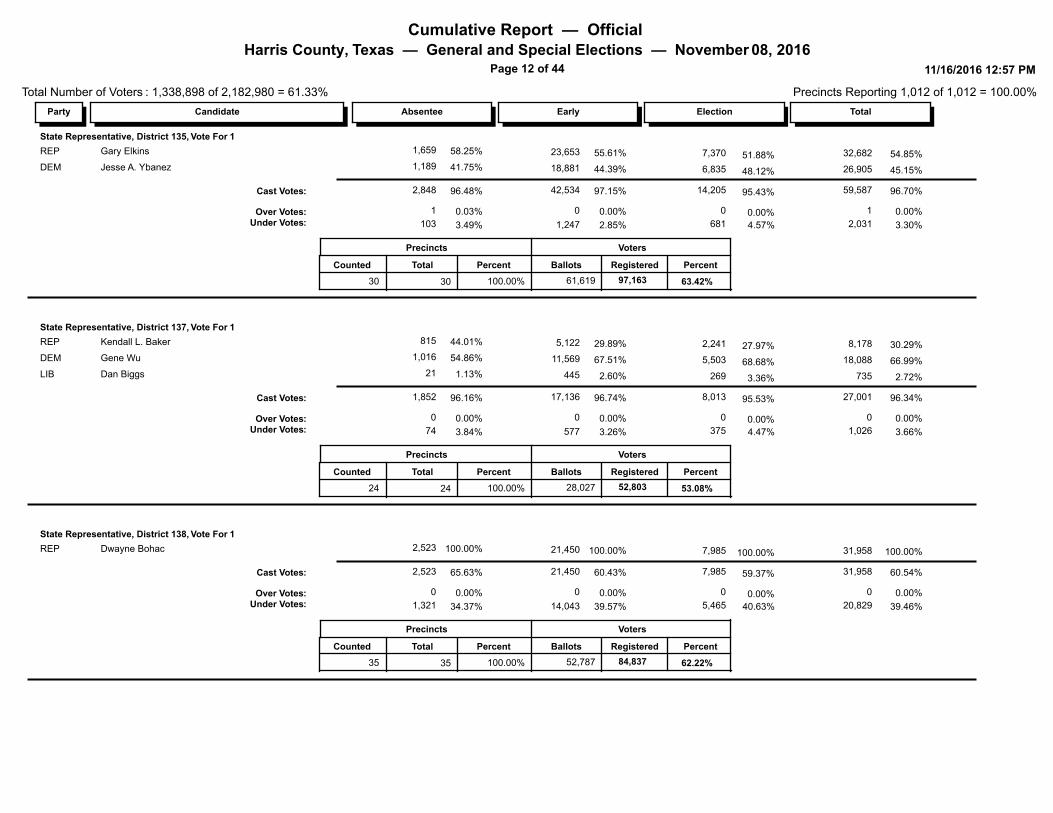
State Representative, District 135, Vote For 1
7,37055.61% 54.85% 32,68258.25% 51.88% 1,659 23,653REP Gary Elkins
6,83544.39% 45.15% 26,90541.75% 48.12% 1,189 18,881DEM Jesse A. Ybanez
14,205 59,587Cast Votes: 97.15% 96.70%96.48% 95.43% 2,848 42,534
2,031
1
681
0
Under Votes:Over Votes:
2.85%
0.00%
3.30%
0.00%
3.49%
0.03% 0.00%
4.57%
1
103
0
1,247
Precincts
Counted
30
Total Percent
30
Voters
61,619
Ballots Registered Percent
63.42% 100.00% 97,163
State Representative, District 137, Vote For 1
2,24129.89% 30.29% 8,17844.01% 27.97% 815 5,122REP Kendall L. Baker
5,50367.51% 66.99% 18,08854.86% 68.68% 1,016 11,569DEM Gene Wu
2692.60% 2.72% 7351.13% 3.36% 21 445LIB Dan Biggs
8,013 27,001Cast Votes: 96.74% 96.34%96.16% 95.53% 1,852 17,136
1,026
0
375
0
Under Votes:Over Votes:
3.26%
0.00%
3.66%
0.00%
3.84%
0.00% 0.00%
4.47%
0
74
0
577
Precincts
Counted
24
Total Percent
24
Voters
28,027
Ballots Registered Percent
53.08% 100.00% 52,803
State Representative, District 138, Vote For 1
7,985100.00% 100.00% 31,958100.00% 100.00% 2,523 21,450REP Dwayne Bohac
7,985 31,958Cast Votes: 60.43% 60.54%65.63% 59.37% 2,523 21,450
20,829
0
5,465
0
Under Votes:Over Votes:
39.57%
0.00%
39.46%
0.00%
34.37%
0.00% 0.00%
40.63%
0
1,321
0
14,043
Precincts
Counted
35
Total Percent
35
Voters
52,787
Ballots Registered Percent
62.22% 100.00% 84,837
Cumulative Report — Official Harris County, Texas — General and Special Elections — November 08, 2016
Page 13 of 44
Total Number of Voters : 1,338,898 of 2,182,980 = 61.33%
11/16/2016 12:57 PM
Precincts Reporting 1,012 of 1,012 = 100.00%
ElectionEarlyAbsentee TotalParty Candidate
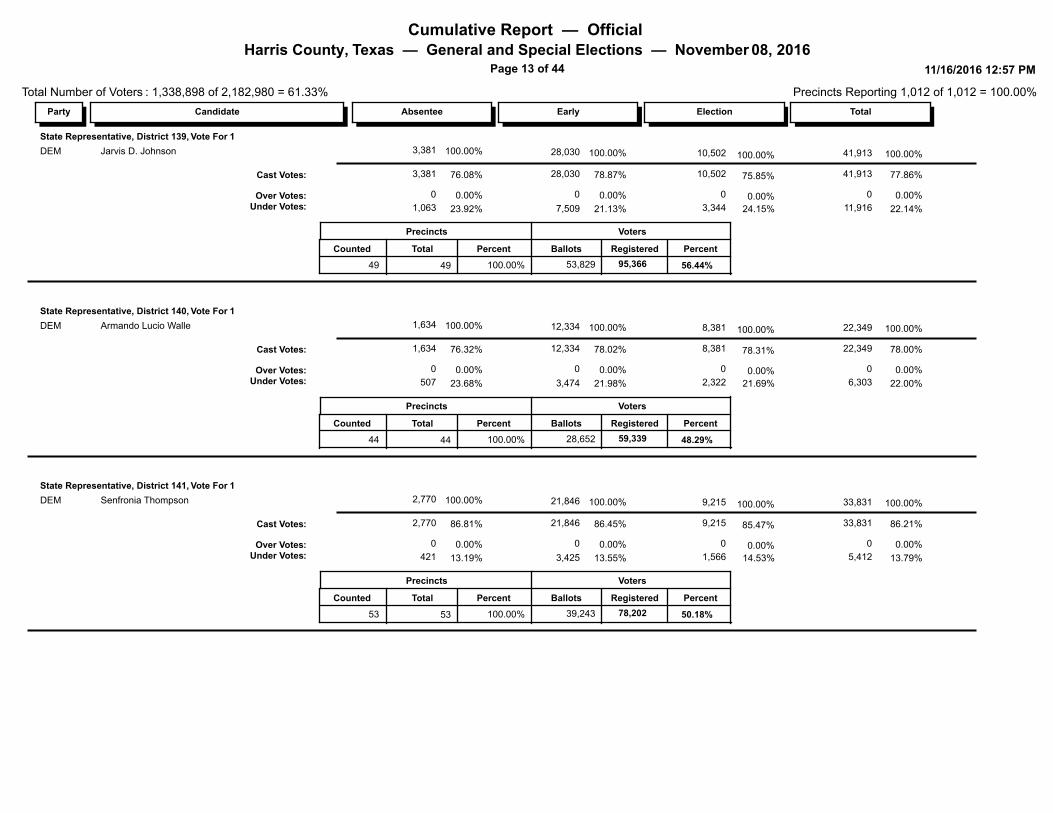
State Representative, District 139, Vote For 1
10,502100.00% 100.00% 41,913100.00% 100.00% 3,381 28,030DEM Jarvis D. Johnson
10,502 41,913Cast Votes: 78.87% 77.86%76.08% 75.85% 3,381 28,030
11,916
0
3,344
0
Under Votes:Over Votes:
21.13%
0.00%
22.14%
0.00%
23.92%
0.00% 0.00%
24.15%
0
1,063
0
7,509
Precincts
Counted
49
Total Percent
49
Voters
53,829
Ballots Registered Percent
56.44% 100.00% 95,366
State Representative, District 140, Vote For 1
8,381100.00% 100.00% 22,349100.00% 100.00% 1,634 12,334DEM Armando Lucio Walle
8,381 22,349Cast Votes: 78.02% 78.00%76.32% 78.31% 1,634 12,334
6,303
0
2,322
0
Under Votes:Over Votes:
21.98%
0.00%
22.00%
0.00%
23.68%
0.00% 0.00%
21.69%
0
507
0
3,474
Precincts
Counted
44
Total Percent
44
Voters
28,652
Ballots Registered Percent
48.29% 100.00% 59,339
State Representative, District 141, Vote For 1
9,215100.00% 100.00% 33,831100.00% 100.00% 2,770 21,846DEM Senfronia Thompson
9,215 33,831Cast Votes: 86.45% 86.21%86.81% 85.47% 2,770 21,846
5,412
0
1,566
0
Under Votes:Over Votes:
13.55%
0.00%
13.79%
0.00%
13.19%
0.00% 0.00%
14.53%
0
421
0
3,425
Precincts
Counted
53
Total Percent
53
Voters
39,243
Ballots Registered Percent
50.18% 100.00% 78,202
Cumulative Report — Official Harris County, Texas — General and Special Elections — November 08, 2016
Page 14 of 44
Total Number of Voters : 1,338,898 of 2,182,980 = 61.33%
11/16/2016 12:57 PM
Precincts Reporting 1,012 of 1,012 = 100.00%
ElectionEarlyAbsentee TotalParty Candidate
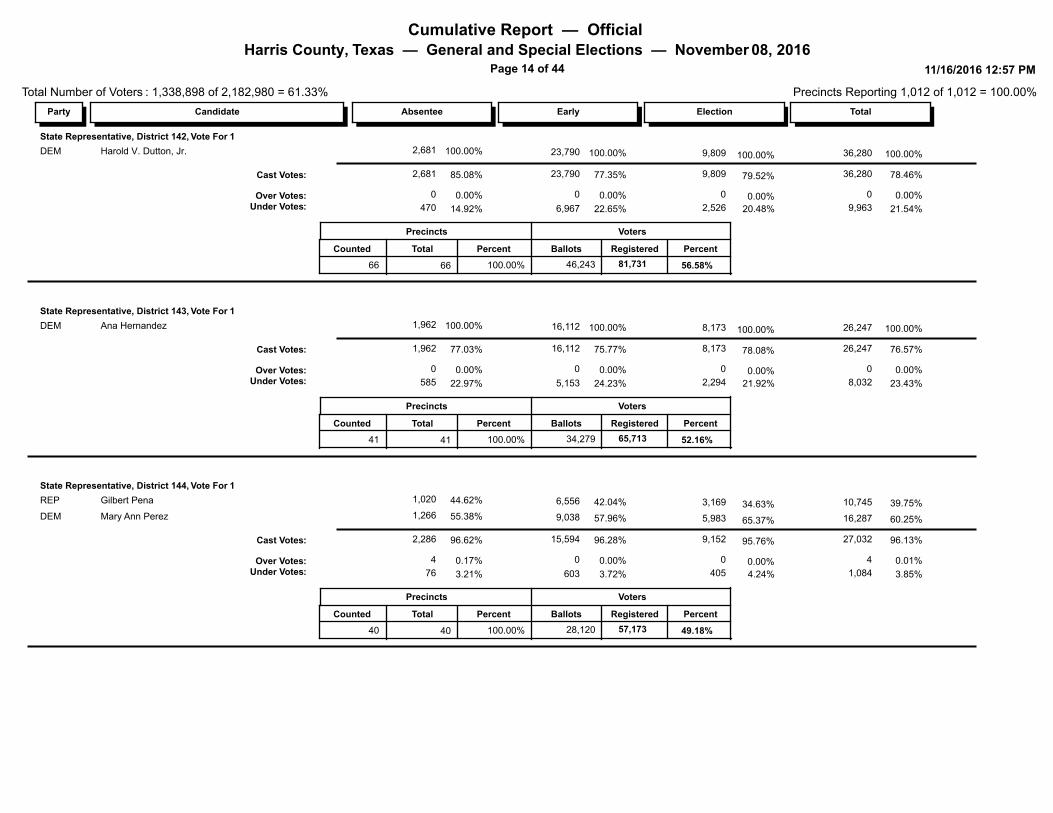
State Representative, District 142, Vote For 1
9,809100.00% 100.00% 36,280100.00% 100.00% 2,681 23,790DEM Harold V. Dutton, Jr.
9,809 36,280Cast Votes: 77.35% 78.46%85.08% 79.52% 2,681 23,790
9,963
0
2,526
0
Under Votes:Over Votes:
22.65%
0.00%
21.54%
0.00%
14.92%
0.00% 0.00%
20.48%
0
470
0
6,967
Precincts
Counted
66
Total Percent
66
Voters
46,243
Ballots Registered Percent
56.58% 100.00% 81,731
State Representative, District 143, Vote For 1
8,173100.00% 100.00% 26,247100.00% 100.00% 1,962 16,112DEM Ana Hernandez
8,173 26,247Cast Votes: 75.77% 76.57%77.03% 78.08% 1,962 16,112
8,032
0
2,294
0
Under Votes:Over Votes:
24.23%
0.00%
23.43%
0.00%
22.97%
0.00% 0.00%
21.92%
0
585
0
5,153
Precincts
Counted
41
Total Percent
41
Voters
34,279
Ballots Registered Percent
52.16% 100.00% 65,713
State Representative, District 144, Vote For 1
3,16942.04% 39.75% 10,74544.62% 34.63% 1,020 6,556REP Gilbert Pena
5,98357.96% 60.25% 16,28755.38% 65.37% 1,266 9,038DEM Mary Ann Perez
9,152 27,032Cast Votes: 96.28% 96.13%96.62% 95.76% 2,286 15,594
1,084
4
405
0
Under Votes:Over Votes:
3.72%
0.00%
3.85%
0.01%
3.21%
0.17% 0.00%
4.24%
4
76
0
603
Precincts
Counted
40
Total Percent
40
Voters
28,120
Ballots Registered Percent
49.18% 100.00% 57,173
Cumulative Report — Official Harris County, Texas — General and Special Elections — November 08, 2016
Page 15 of 44
Total Number of Voters : 1,338,898 of 2,182,980 = 61.33%
11/16/2016 12:57 PM
Precincts Reporting 1,012 of 1,012 = 100.00%
ElectionEarlyAbsentee TotalParty Candidate
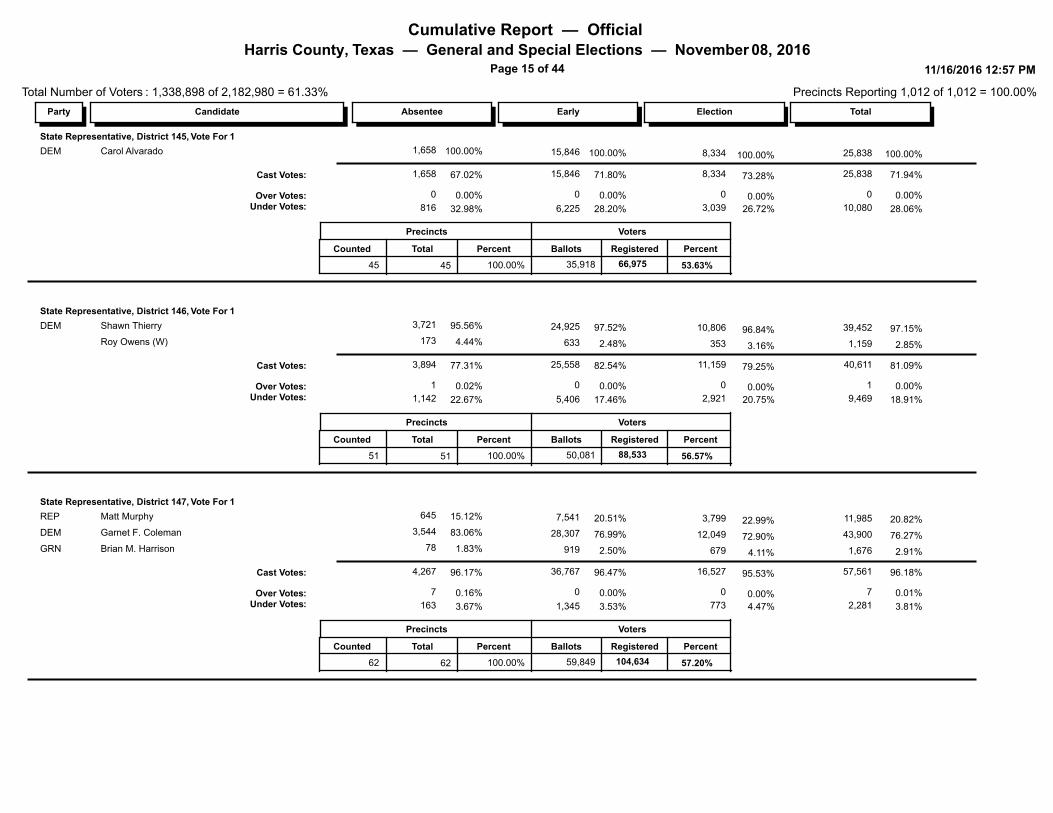
State Representative, District 145, Vote For 1
8,334100.00% 100.00% 25,838100.00% 100.00% 1,658 15,846DEM Carol Alvarado
8,334 25,838Cast Votes: 71.80% 71.94%67.02% 73.28% 1,658 15,846
10,080
0
3,039
0
Under Votes:Over Votes:
28.20%
0.00%
28.06%
0.00%
32.98%
0.00% 0.00%
26.72%
0
816
0
6,225
Precincts
Counted
45
Total Percent
45
Voters
35,918
Ballots Registered Percent
53.63% 100.00% 66,975
State Representative, District 146, Vote For 1
10,80697.52% 97.15% 39,45295.56% 96.84% 3,721 24,925DEM Shawn Thierry
3532.48% 2.85% 1,1594.44% 3.16% 173 633Roy Owens (W)
11,159 40,611Cast Votes: 82.54% 81.09%77.31% 79.25% 3,894 25,558
9,469
1
2,921
0
Under Votes:Over Votes:
17.46%
0.00%
18.91%
0.00%
22.67%
0.02% 0.00%
20.75%
1
1,142
0
5,406
Precincts
Counted
51
Total Percent
51
Voters
50,081
Ballots Registered Percent
56.57% 100.00% 88,533
State Representative, District 147, Vote For 1
3,79920.51% 20.82% 11,98515.12% 22.99% 645 7,541REP Matt Murphy
12,04976.99% 76.27% 43,90083.06% 72.90% 3,544 28,307DEM Garnet F. Coleman
6792.50% 2.91% 1,6761.83% 4.11% 78 919GRN Brian M. Harrison
16,527 57,561Cast Votes: 96.47% 96.18%96.17% 95.53% 4,267 36,767
2,281
7
773
0
Under Votes:Over Votes:
3.53%
0.00%
3.81%
0.01%
3.67%
0.16% 0.00%
4.47%
7
163
0
1,345
Precincts
Counted
62
Total Percent
62
Voters
59,849
Ballots Registered Percent
57.20% 100.00% 104,634
Cumulative Report — Official Harris County, Texas — General and Special Elections — November 08, 2016
Page 16 of 44
Total Number of Voters : 1,338,898 of 2,182,980 = 61.33%
11/16/2016 12:57 PM
Precincts Reporting 1,012 of 1,012 = 100.00%
ElectionEarlyAbsentee TotalParty Candidate
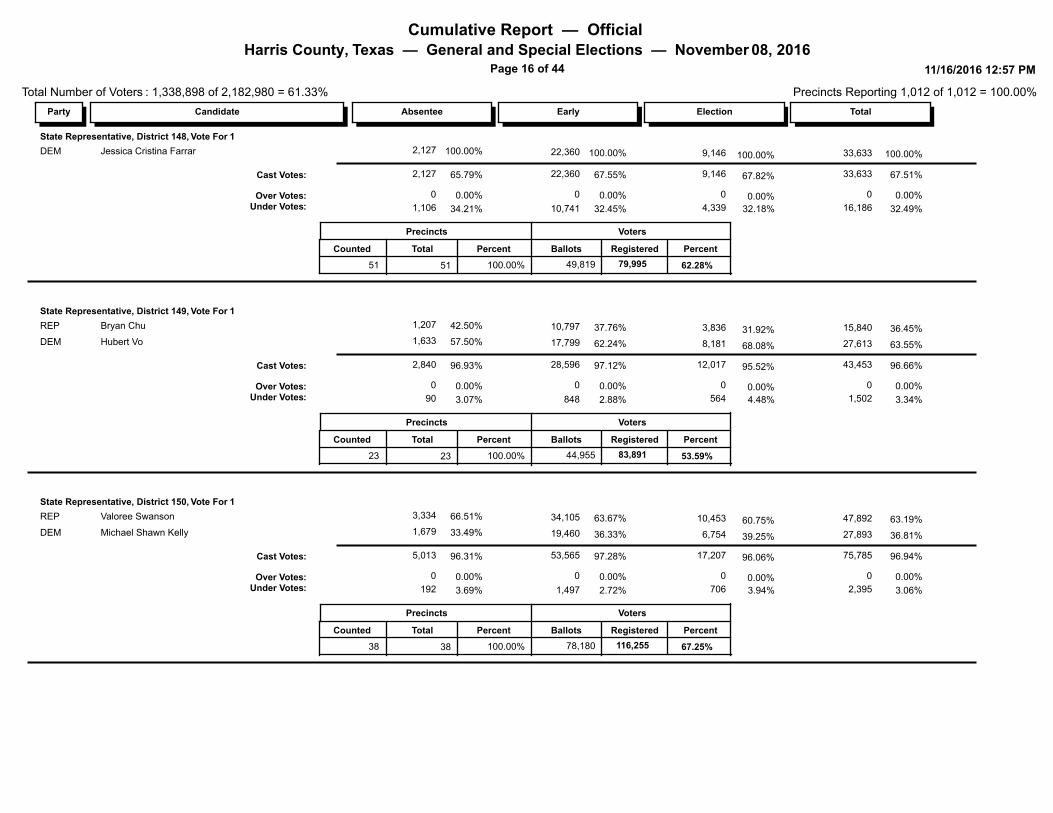
State Representative, District 148, Vote For 1
9,146100.00% 100.00% 33,633100.00% 100.00% 2,127 22,360DEM Jessica Cristina Farrar
9,146 33,633Cast Votes: 67.55% 67.51%65.79% 67.82% 2,127 22,360
16,186
0
4,339
0
Under Votes:Over Votes:
32.45%
0.00%
32.49%
0.00%
34.21%
0.00% 0.00%
32.18%
0
1,106
0
10,741
Precincts
Counted
51
Total Percent
51
Voters
49,819
Ballots Registered Percent
62.28% 100.00% 79,995
State Representative, District 149, Vote For 1
3,83637.76% 36.45% 15,84042.50% 31.92% 1,207 10,797REP Bryan Chu
8,18162.24% 63.55% 27,61357.50% 68.08% 1,633 17,799DEM Hubert Vo
12,017 43,453Cast Votes: 97.12% 96.66%96.93% 95.52% 2,840 28,596
1,502
0
564
0
Under Votes:Over Votes:
2.88%
0.00%
3.34%
0.00%
3.07%
0.00% 0.00%
4.48%
0
90
0
848
Precincts
Counted
23
Total Percent
23
Voters
44,955
Ballots Registered Percent
53.59% 100.00% 83,891
State Representative, District 150, Vote For 1
10,45363.67% 63.19% 47,89266.51% 60.75% 3,334 34,105REP Valoree Swanson
6,75436.33% 36.81% 27,89333.49% 39.25% 1,679 19,460DEM Michael Shawn Kelly
17,207 75,785Cast Votes: 97.28% 96.94%96.31% 96.06% 5,013 53,565
2,395
0
706
0
Under Votes:Over Votes:
2.72%
0.00%
3.06%
0.00%
3.69%
0.00% 0.00%
3.94%
0
192
0
1,497
Precincts
Counted
38
Total Percent
38
Voters
78,180
Ballots Registered Percent
67.25% 100.00% 116,255
Cumulative Report — Official Harris County, Texas — General and Special Elections — November 08, 2016
Page 17 of 44
Total Number of Voters : 1,338,898 of 2,182,980 = 61.33%
11/16/2016 12:57 PM
Precincts Reporting 1,012 of 1,012 = 100.00%
ElectionEarlyAbsentee TotalParty Candidate
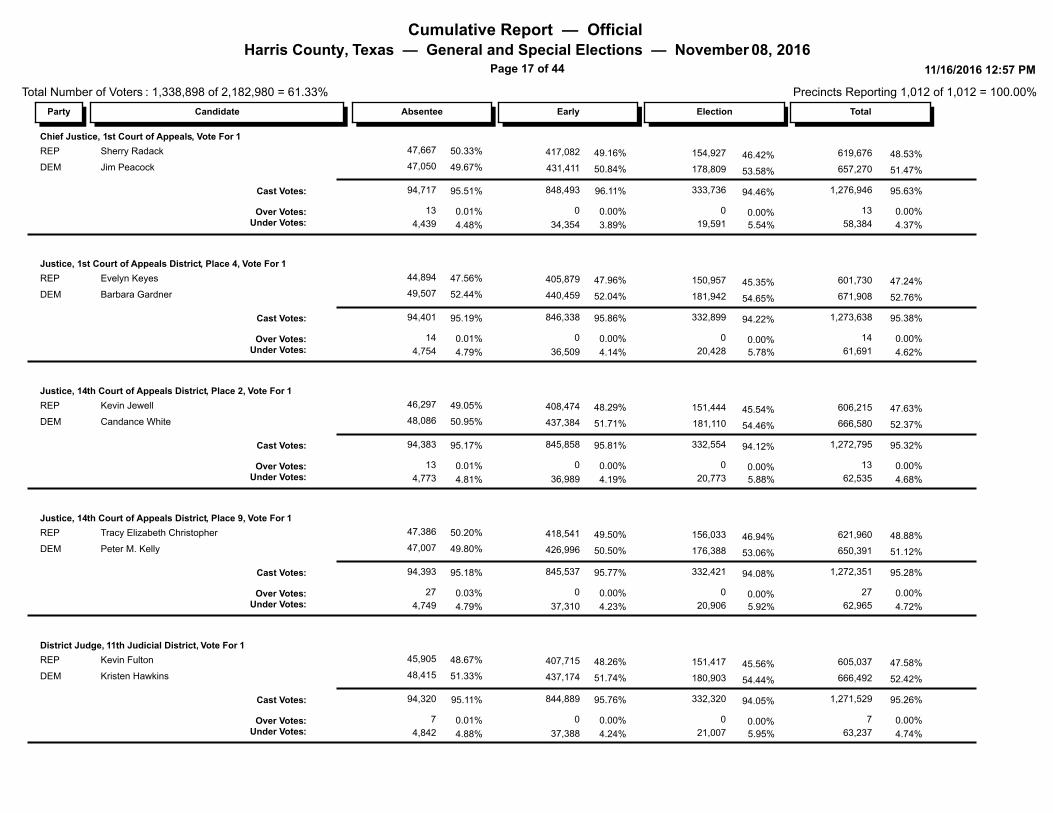
Chief Justice, 1st Court of Appeals, Vote For 1
154,92749.16% 48.53% 619,67650.33% 46.42% 47,667 417,082REP Sherry Radack
178,80950.84% 51.47% 657,27049.67% 53.58% 47,050 431,411DEM Jim Peacock
333,736 1,276,946Cast Votes: 96.11% 95.63%95.51% 94.46% 94,717 848,493
58,384
13
19,591
0
Under Votes:Over Votes:
3.89%
0.00%
4.37%
0.00%
4.48%
0.01% 0.00%
5.54%
13
4,439
0
34,354
Justice, 1st Court of Appeals District, Place 4, Vote For 1
150,95747.96% 47.24% 601,73047.56% 45.35% 44,894 405,879REP Evelyn Keyes
181,94252.04% 52.76% 671,90852.44% 54.65% 49,507 440,459DEM Barbara Gardner
332,899 1,273,638Cast Votes: 95.86% 95.38%95.19% 94.22% 94,401 846,338
61,691
14
20,428
0
Under Votes:Over Votes:
4.14%
0.00%
4.62%
0.00%
4.79%
0.01% 0.00%
5.78%
14
4,754
0
36,509
Justice, 14th Court of Appeals District, Place 2, Vote For 1
151,44448.29% 47.63% 606,21549.05% 45.54% 46,297 408,474REP Kevin Jewell
181,11051.71% 52.37% 666,58050.95% 54.46% 48,086 437,384DEM Candance White
332,554 1,272,795Cast Votes: 95.81% 95.32%95.17% 94.12% 94,383 845,858
62,535
13
20,773
0
Under Votes:Over Votes:
4.19%
0.00%
4.68%
0.00%
4.81%
0.01% 0.00%
5.88%
13
4,773
0
36,989
Justice, 14th Court of Appeals District, Place 9, Vote For 1
156,03349.50% 48.88% 621,96050.20% 46.94% 47,386 418,541REP Tracy Elizabeth Christopher
176,38850.50% 51.12% 650,39149.80% 53.06% 47,007 426,996DEM Peter M. Kelly
332,421 1,272,351Cast Votes: 95.77% 95.28%95.18% 94.08% 94,393 845,537
62,965
27
20,906
0
Under Votes:Over Votes:
4.23%
0.00%
4.72%
0.00%
4.79%
0.03% 0.00%
5.92%
27
4,749
0
37,310
District Judge, 11th Judicial District, Vote For 1
151,41748.26% 47.58% 605,03748.67% 45.56% 45,905 407,715REP Kevin Fulton
180,90351.74% 52.42% 666,49251.33% 54.44% 48,415 437,174DEM Kristen Hawkins
332,320 1,271,529Cast Votes: 95.76% 95.26%95.11% 94.05% 94,320 844,889
63,237
7
21,007
0
Under Votes:Over Votes:
4.24%
0.00%
4.74%
0.00%
4.88%
0.01% 0.00%
5.95%
7
4,842
0
37,388
Cumulative Report — Official Harris County, Texas — General and Special Elections — November 08, 2016
Page 18 of 44
Total Number of Voters : 1,338,898 of 2,182,980 = 61.33%
11/16/2016 12:57 PM
Precincts Reporting 1,012 of 1,012 = 100.00%
ElectionEarlyAbsentee TotalParty Candidate
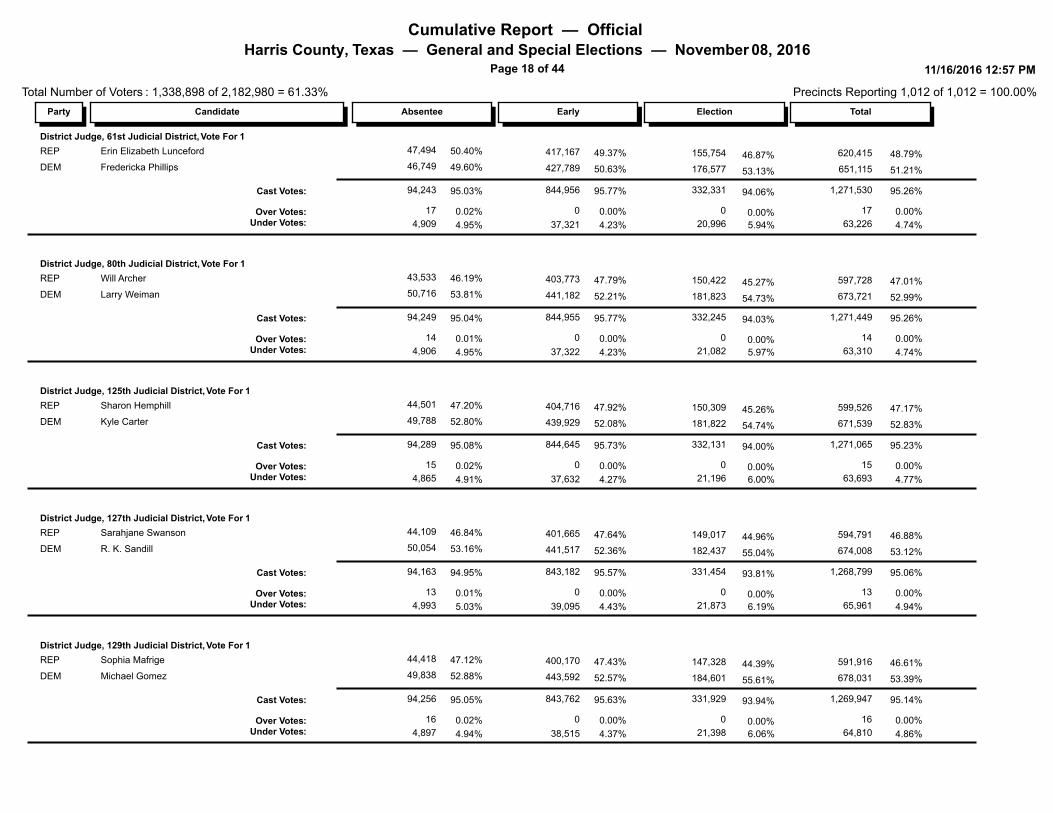
District Judge, 61st Judicial District, Vote For 1
155,75449.37% 48.79% 620,41550.40% 46.87% 47,494 417,167REP Erin Elizabeth Lunceford
176,57750.63% 51.21% 651,11549.60% 53.13% 46,749 427,789DEM Fredericka Phillips
332,331 1,271,530Cast Votes: 95.77% 95.26%95.03% 94.06% 94,243 844,956
63,226
17
20,996
0
Under Votes:Over Votes:
4.23%
0.00%
4.74%
0.00%
4.95%
0.02% 0.00%
5.94%
17
4,909
0
37,321
District Judge, 80th Judicial District, Vote For 1
150,42247.79% 47.01% 597,72846.19% 45.27% 43,533 403,773REP Will Archer
181,82352.21% 52.99% 673,72153.81% 54.73% 50,716 441,182DEM Larry Weiman
332,245 1,271,449Cast Votes: 95.77% 95.26%95.04% 94.03% 94,249 844,955
63,310
14
21,082
0
Under Votes:Over Votes:
4.23%
0.00%
4.74%
0.00%
4.95%
0.01% 0.00%
5.97%
14
4,906
0
37,322
District Judge, 125th Judicial District, Vote For 1
150,30947.92% 47.17% 599,52647.20% 45.26% 44,501 404,716REP Sharon Hemphill
181,82252.08% 52.83% 671,53952.80% 54.74% 49,788 439,929DEM Kyle Carter
332,131 1,271,065Cast Votes: 95.73% 95.23%95.08% 94.00% 94,289 844,645
63,693
15
21,196
0
Under Votes:Over Votes:
4.27%
0.00%
4.77%
0.00%
4.91%
0.02% 0.00%
6.00%
15
4,865
0
37,632
District Judge, 127th Judicial District, Vote For 1
149,01747.64% 46.88% 594,79146.84% 44.96% 44,109 401,665REP Sarahjane Swanson
182,43752.36% 53.12% 674,00853.16% 55.04% 50,054 441,517DEM R. K. Sandill
331,454 1,268,799Cast Votes: 95.57% 95.06%94.95% 93.81% 94,163 843,182
65,961
13
21,873
0
Under Votes:Over Votes:
4.43%
0.00%
4.94%
0.00%
5.03%
0.01% 0.00%
6.19%
13
4,993
0
39,095
District Judge, 129th Judicial District, Vote For 1
147,32847.43% 46.61% 591,91647.12% 44.39% 44,418 400,170REP Sophia Mafrige
184,60152.57% 53.39% 678,03152.88% 55.61% 49,838 443,592DEM Michael Gomez
331,929 1,269,947Cast Votes: 95.63% 95.14%95.05% 93.94% 94,256 843,762
64,810
16
21,398
0
Under Votes:Over Votes:
4.37%
0.00%
4.86%
0.00%
4.94%
0.02% 0.00%
6.06%
16
4,897
0
38,515
Cumulative Report — Official Harris County, Texas — General and Special Elections — November 08, 2016
Page 19 of 44
Total Number of Voters : 1,338,898 of 2,182,980 = 61.33%
11/16/2016 12:57 PM
Precincts Reporting 1,012 of 1,012 = 100.00%
ElectionEarlyAbsentee TotalParty Candidate
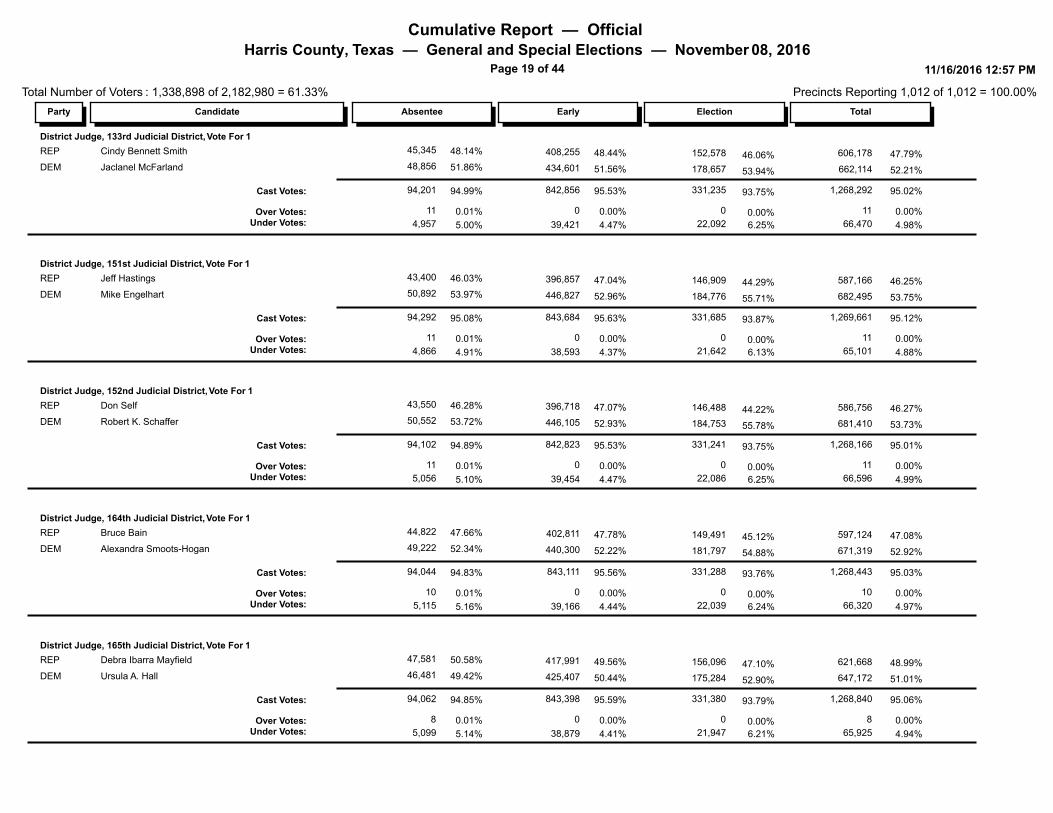
District Judge, 133rd Judicial District, Vote For 1
152,57848.44% 47.79% 606,17848.14% 46.06% 45,345 408,255REP Cindy Bennett Smith
178,65751.56% 52.21% 662,11451.86% 53.94% 48,856 434,601DEM Jaclanel McFarland
331,235 1,268,292Cast Votes: 95.53% 95.02%94.99% 93.75% 94,201 842,856
66,470
11
22,092
0
Under Votes:Over Votes:
4.47%
0.00%
4.98%
0.00%
5.00%
0.01% 0.00%
6.25%
11
4,957
0
39,421
District Judge, 151st Judicial District, Vote For 1
146,90947.04% 46.25% 587,16646.03% 44.29% 43,400 396,857REP Jeff Hastings
184,77652.96% 53.75% 682,49553.97% 55.71% 50,892 446,827DEM Mike Engelhart
331,685 1,269,661Cast Votes: 95.63% 95.12%95.08% 93.87% 94,292 843,684
65,101
11
21,642
0
Under Votes:Over Votes:
4.37%
0.00%
4.88%
0.00%
4.91%
0.01% 0.00%
6.13%
11
4,866
0
38,593
District Judge, 152nd Judicial District, Vote For 1
146,48847.07% 46.27% 586,75646.28% 44.22% 43,550 396,718REP Don Self
184,75352.93% 53.73% 681,41053.72% 55.78% 50,552 446,105DEM Robert K. Schaffer
331,241 1,268,166Cast Votes: 95.53% 95.01%94.89% 93.75% 94,102 842,823
66,596
11
22,086
0
Under Votes:Over Votes:
4.47%
0.00%
4.99%
0.00%
5.10%
0.01% 0.00%
6.25%
11
5,056
0
39,454
District Judge, 164th Judicial District, Vote For 1
149,49147.78% 47.08% 597,12447.66% 45.12% 44,822 402,811REP Bruce Bain
181,79752.22% 52.92% 671,31952.34% 54.88% 49,222 440,300DEM Alexandra Smoots-Hogan
331,288 1,268,443Cast Votes: 95.56% 95.03%94.83% 93.76% 94,044 843,111
66,320
10
22,039
0
Under Votes:Over Votes:
4.44%
0.00%
4.97%
0.00%
5.16%
0.01% 0.00%
6.24%
10
5,115
0
39,166
District Judge, 165th Judicial District, Vote For 1
156,09649.56% 48.99% 621,66850.58% 47.10% 47,581 417,991REP Debra Ibarra Mayfield
175,28450.44% 51.01% 647,17249.42% 52.90% 46,481 425,407DEM Ursula A. Hall
331,380 1,268,840Cast Votes: 95.59% 95.06%94.85% 93.79% 94,062 843,398
65,925
8
21,947
0
Under Votes:Over Votes:
4.41%
0.00%
4.94%
0.00%
5.14%
0.01% 0.00%
6.21%
8
5,099
0
38,879
Cumulative Report — Official Harris County, Texas — General and Special Elections — November 08, 2016
Page 20 of 44
Total Number of Voters : 1,338,898 of 2,182,980 = 61.33%
11/16/2016 12:57 PM
Precincts Reporting 1,012 of 1,012 = 100.00%
ElectionEarlyAbsentee TotalParty Candidate
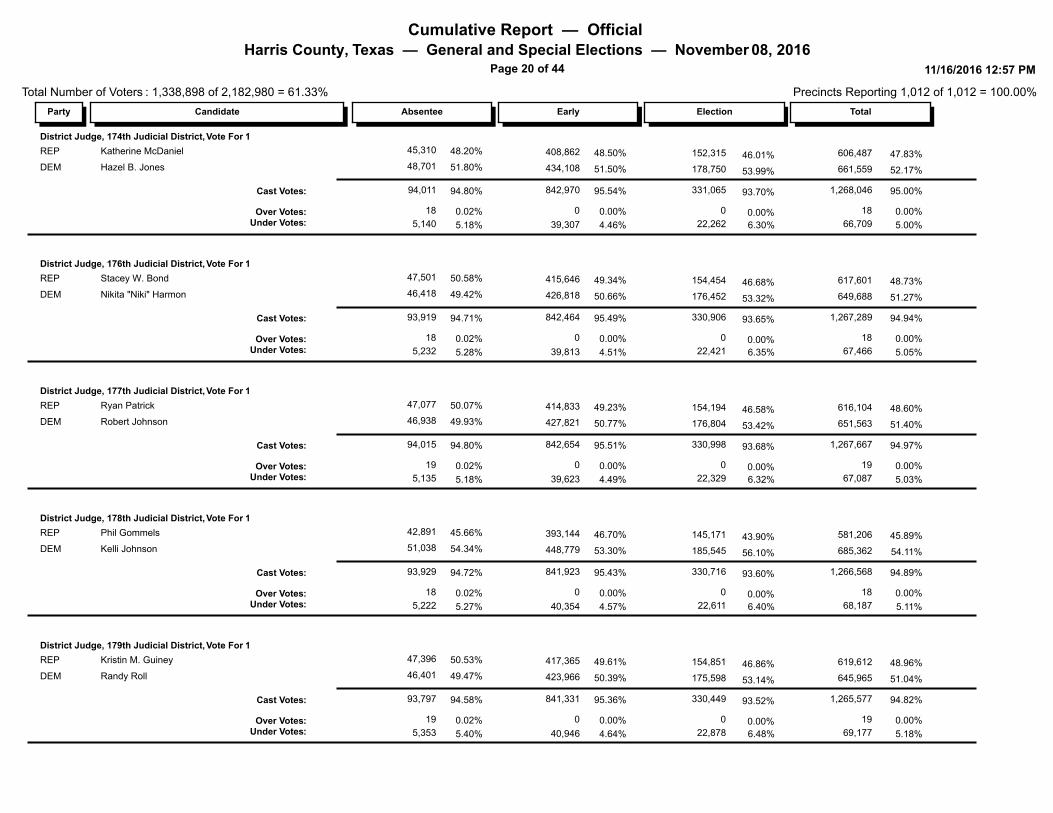
District Judge, 174th Judicial District, Vote For 1
152,31548.50% 47.83% 606,48748.20% 46.01% 45,310 408,862REP Katherine McDaniel
178,75051.50% 52.17% 661,55951.80% 53.99% 48,701 434,108DEM Hazel B. Jones
331,065 1,268,046Cast Votes: 95.54% 95.00%94.80% 93.70% 94,011 842,970
66,709
18
22,262
0
Under Votes:Over Votes:
4.46%
0.00%
5.00%
0.00%
5.18%
0.02% 0.00%
6.30%
18
5,140
0
39,307
District Judge, 176th Judicial District, Vote For 1
154,45449.34% 48.73% 617,60150.58% 46.68% 47,501 415,646REP Stacey W. Bond
176,45250.66% 51.27% 649,68849.42% 53.32% 46,418 426,818DEM Nikita "Niki" Harmon
330,906 1,267,289Cast Votes: 95.49% 94.94%94.71% 93.65% 93,919 842,464
67,466
18
22,421
0
Under Votes:Over Votes:
4.51%
0.00%
5.05%
0.00%
5.28%
0.02% 0.00%
6.35%
18
5,232
0
39,813
District Judge, 177th Judicial District, Vote For 1
154,19449.23% 48.60% 616,10450.07% 46.58% 47,077 414,833REP Ryan Patrick
176,80450.77% 51.40% 651,56349.93% 53.42% 46,938 427,821DEM Robert Johnson
330,998 1,267,667Cast Votes: 95.51% 94.97%94.80% 93.68% 94,015 842,654
67,087
19
22,329
0
Under Votes:Over Votes:
4.49%
0.00%
5.03%
0.00%
5.18%
0.02% 0.00%
6.32%
19
5,135
0
39,623
District Judge, 178th Judicial District, Vote For 1
145,17146.70% 45.89% 581,20645.66% 43.90% 42,891 393,144REP Phil Gommels
185,54553.30% 54.11% 685,36254.34% 56.10% 51,038 448,779DEM Kelli Johnson
330,716 1,266,568Cast Votes: 95.43% 94.89%94.72% 93.60% 93,929 841,923
68,187
18
22,611
0
Under Votes:Over Votes:
4.57%
0.00%
5.11%
0.00%
5.27%
0.02% 0.00%
6.40%
18
5,222
0
40,354
District Judge, 179th Judicial District, Vote For 1
154,85149.61% 48.96% 619,61250.53% 46.86% 47,396 417,365REP Kristin M. Guiney
175,59850.39% 51.04% 645,96549.47% 53.14% 46,401 423,966DEM Randy Roll
330,449 1,265,577Cast Votes: 95.36% 94.82%94.58% 93.52% 93,797 841,331
69,177
19
22,878
0
Under Votes:Over Votes:
4.64%
0.00%
5.18%
0.00%
5.40%
0.02% 0.00%
6.48%
19
5,353
0
40,946
Cumulative Report — Official Harris County, Texas — General and Special Elections — November 08, 2016
Page 21 of 44
Total Number of Voters : 1,338,898 of 2,182,980 = 61.33%
11/16/2016 12:57 PM
Precincts Reporting 1,012 of 1,012 = 100.00%
ElectionEarlyAbsentee TotalParty Candidate
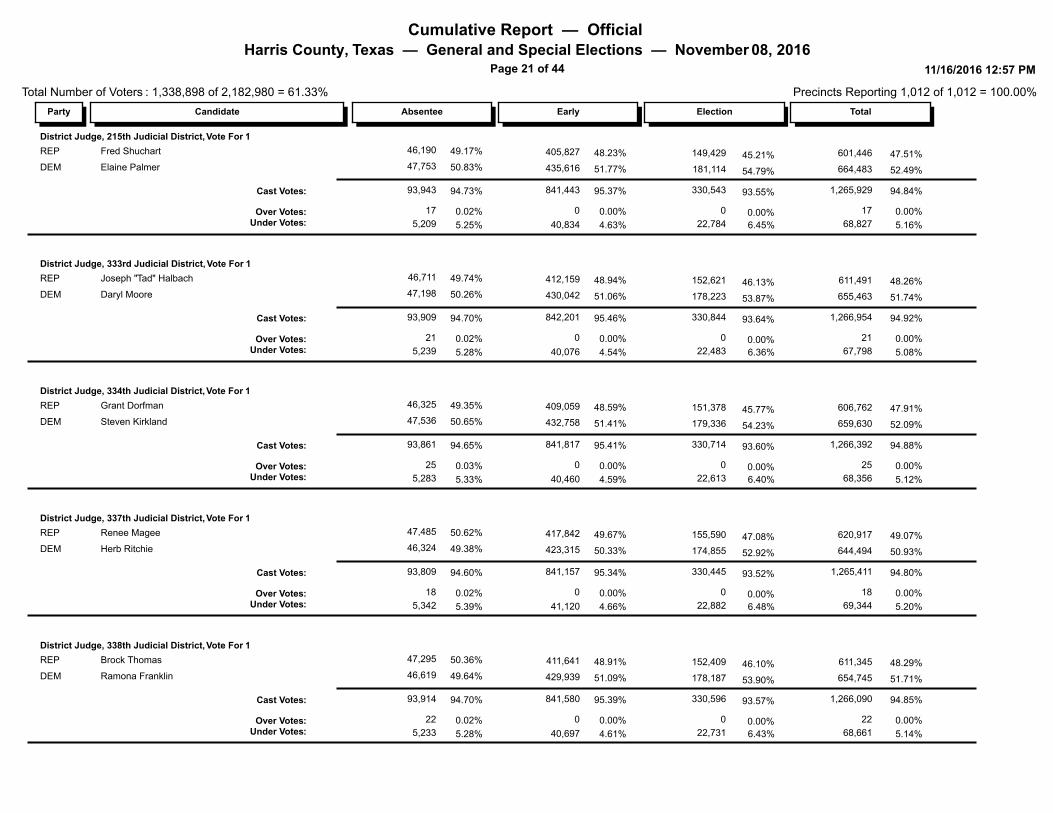
District Judge, 215th Judicial District, Vote For 1
149,42948.23% 47.51% 601,44649.17% 45.21% 46,190 405,827REP Fred Shuchart
181,11451.77% 52.49% 664,48350.83% 54.79% 47,753 435,616DEM Elaine Palmer
330,543 1,265,929Cast Votes: 95.37% 94.84%94.73% 93.55% 93,943 841,443
68,827
17
22,784
0
Under Votes:Over Votes:
4.63%
0.00%
5.16%
0.00%
5.25%
0.02% 0.00%
6.45%
17
5,209
0
40,834
District Judge, 333rd Judicial District, Vote For 1
152,62148.94% 48.26% 611,49149.74% 46.13% 46,711 412,159REP Joseph "Tad" Halbach
178,22351.06% 51.74% 655,46350.26% 53.87% 47,198 430,042DEM Daryl Moore
330,844 1,266,954Cast Votes: 95.46% 94.92%94.70% 93.64% 93,909 842,201
67,798
21
22,483
0
Under Votes:Over Votes:
4.54%
0.00%
5.08%
0.00%
5.28%
0.02% 0.00%
6.36%
21
5,239
0
40,076
District Judge, 334th Judicial District, Vote For 1
151,37848.59% 47.91% 606,76249.35% 45.77% 46,325 409,059REP Grant Dorfman
179,33651.41% 52.09% 659,63050.65% 54.23% 47,536 432,758DEM Steven Kirkland
330,714 1,266,392Cast Votes: 95.41% 94.88%94.65% 93.60% 93,861 841,817
68,356
25
22,613
0
Under Votes:Over Votes:
4.59%
0.00%
5.12%
0.00%
5.33%
0.03% 0.00%
6.40%
25
5,283
0
40,460
District Judge, 337th Judicial District, Vote For 1
155,59049.67% 49.07% 620,91750.62% 47.08% 47,485 417,842REP Renee Magee
174,85550.33% 50.93% 644,49449.38% 52.92% 46,324 423,315DEM Herb Ritchie
330,445 1,265,411Cast Votes: 95.34% 94.80%94.60% 93.52% 93,809 841,157
69,344
18
22,882
0
Under Votes:Over Votes:
4.66%
0.00%
5.20%
0.00%
5.39%
0.02% 0.00%
6.48%
18
5,342
0
41,120
District Judge, 338th Judicial District, Vote For 1
152,40948.91% 48.29% 611,34550.36% 46.10% 47,295 411,641REP Brock Thomas
178,18751.09% 51.71% 654,74549.64% 53.90% 46,619 429,939DEM Ramona Franklin
330,596 1,266,090Cast Votes: 95.39% 94.85%94.70% 93.57% 93,914 841,580
68,661
22
22,731
0
Under Votes:Over Votes:
4.61%
0.00%
5.14%
0.00%
5.28%
0.02% 0.00%
6.43%
22
5,233
0
40,697
Cumulative Report — Official Harris County, Texas — General and Special Elections — November 08, 2016
Page 22 of 44
Total Number of Voters : 1,338,898 of 2,182,980 = 61.33%
11/16/2016 12:57 PM
Precincts Reporting 1,012 of 1,012 = 100.00%
ElectionEarlyAbsentee TotalParty Candidate
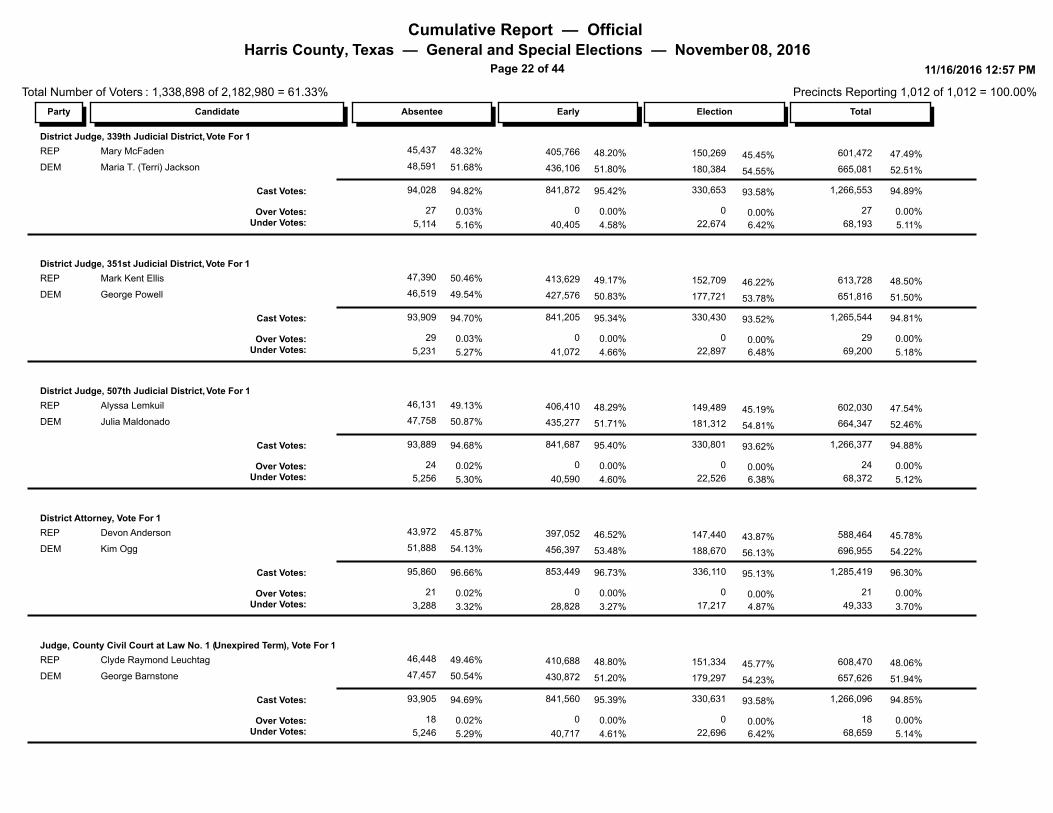
District Judge, 339th Judicial District, Vote For 1
150,26948.20% 47.49% 601,47248.32% 45.45% 45,437 405,766REP Mary McFaden
180,38451.80% 52.51% 665,08151.68% 54.55% 48,591 436,106DEM Maria T. (Terri) Jackson
330,653 1,266,553Cast Votes: 95.42% 94.89%94.82% 93.58% 94,028 841,872
68,193
27
22,674
0
Under Votes:Over Votes:
4.58%
0.00%
5.11%
0.00%
5.16%
0.03% 0.00%
6.42%
27
5,114
0
40,405
District Judge, 351st Judicial District, Vote For 1
152,70949.17% 48.50% 613,72850.46% 46.22% 47,390 413,629REP Mark Kent Ellis
177,72150.83% 51.50% 651,81649.54% 53.78% 46,519 427,576DEM George Powell
330,430 1,265,544Cast Votes: 95.34% 94.81%94.70% 93.52% 93,909 841,205
69,200
29
22,897
0
Under Votes:Over Votes:
4.66%
0.00%
5.18%
0.00%
5.27%
0.03% 0.00%
6.48%
29
5,231
0
41,072
District Judge, 507th Judicial District, Vote For 1
149,48948.29% 47.54% 602,03049.13% 45.19% 46,131 406,410REP Alyssa Lemkuil
181,31251.71% 52.46% 664,34750.87% 54.81% 47,758 435,277DEM Julia Maldonado
330,801 1,266,377Cast Votes: 95.40% 94.88%94.68% 93.62% 93,889 841,687
68,372
24
22,526
0
Under Votes:Over Votes:
4.60%
0.00%
5.12%
0.00%
5.30%
0.02% 0.00%
6.38%
24
5,256
0
40,590
District Attorney, Vote For 1
147,44046.52% 45.78% 588,46445.87% 43.87% 43,972 397,052REP Devon Anderson
188,67053.48% 54.22% 696,95554.13% 56.13% 51,888 456,397DEM Kim Ogg
336,110 1,285,419Cast Votes: 96.73% 96.30%96.66% 95.13% 95,860 853,449
49,333
21
17,217
0
Under Votes:Over Votes:
3.27%
0.00%
3.70%
0.00%
3.32%
0.02% 0.00%
4.87%
21
3,288
0
28,828
Judge, County Civil Court at Law No. 1 (Unexpired Term), Vote For 1
151,33448.80% 48.06% 608,47049.46% 45.77% 46,448 410,688REP Clyde Raymond Leuchtag
179,29751.20% 51.94% 657,62650.54% 54.23% 47,457 430,872DEM George Barnstone
330,631 1,266,096Cast Votes: 95.39% 94.85%94.69% 93.58% 93,905 841,560
68,659
18
22,696
0
Under Votes:Over Votes:
4.61%
0.00%
5.14%
0.00%
5.29%
0.02% 0.00%
6.42%
18
5,246
0
40,717
Cumulative Report — Official Harris County, Texas — General and Special Elections — November 08, 2016
Page 23 of 44
Total Number of Voters : 1,338,898 of 2,182,980 = 61.33%
11/16/2016 12:57 PM
Precincts Reporting 1,012 of 1,012 = 100.00%
ElectionEarlyAbsentee TotalParty Candidate
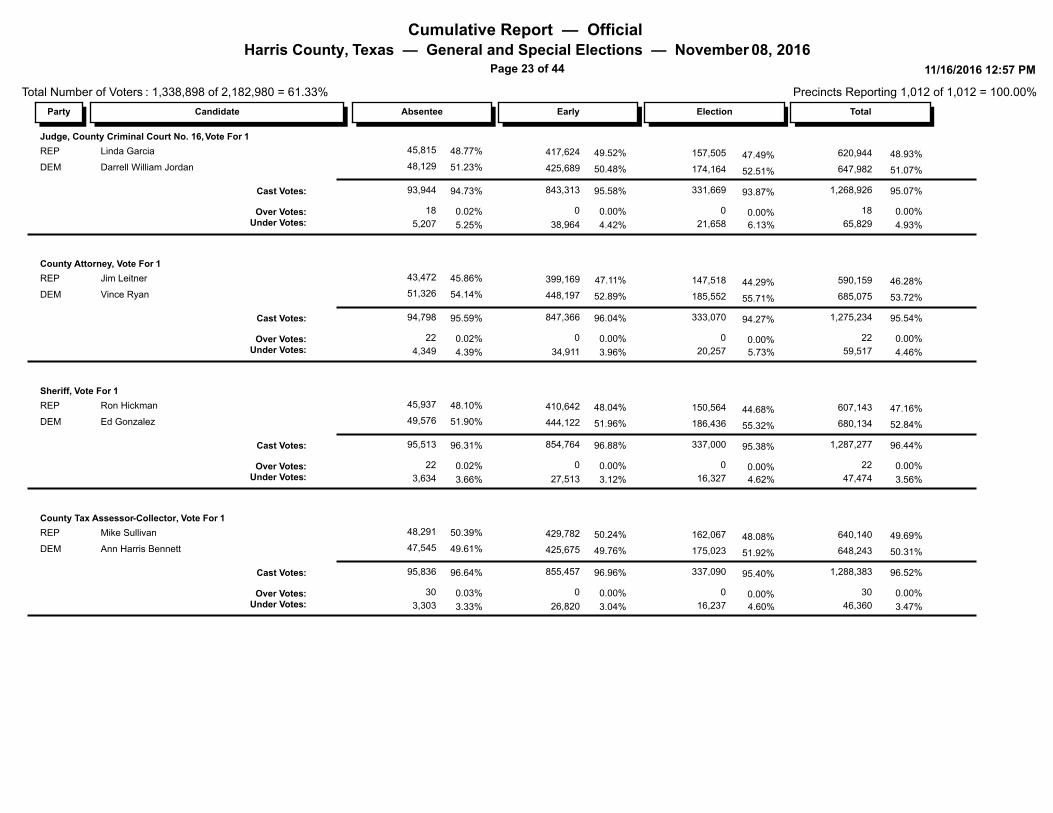
Judge, County Criminal Court No. 16, Vote For 1
157,50549.52% 48.93% 620,94448.77% 47.49% 45,815 417,624REP Linda Garcia
174,16450.48% 51.07% 647,98251.23% 52.51% 48,129 425,689DEM Darrell William Jordan
331,669 1,268,926Cast Votes: 95.58% 95.07%94.73% 93.87% 93,944 843,313
65,829
18
21,658
0
Under Votes:Over Votes:
4.42%
0.00%
4.93%
0.00%
5.25%
0.02% 0.00%
6.13%
18
5,207
0
38,964
County Attorney, Vote For 1
147,51847.11% 46.28% 590,15945.86% 44.29% 43,472 399,169REP Jim Leitner
185,55252.89% 53.72% 685,07554.14% 55.71% 51,326 448,197DEM Vince Ryan
333,070 1,275,234Cast Votes: 96.04% 95.54%95.59% 94.27% 94,798 847,366
59,517
22
20,257
0
Under Votes:Over Votes:
3.96%
0.00%
4.46%
0.00%
4.39%
0.02% 0.00%
5.73%
22
4,349
0
34,911
Sheriff, Vote For 1
150,56448.04% 47.16% 607,14348.10% 44.68% 45,937 410,642REP Ron Hickman
186,43651.96% 52.84% 680,13451.90% 55.32% 49,576 444,122DEM Ed Gonzalez
337,000 1,287,277Cast Votes: 96.88% 96.44%96.31% 95.38% 95,513 854,764
47,474
22
16,327
0
Under Votes:Over Votes:
3.12%
0.00%
3.56%
0.00%
3.66%
0.02% 0.00%
4.62%
22
3,634
0
27,513
County Tax Assessor-Collector, Vote For 1
162,06750.24% 49.69% 640,14050.39% 48.08% 48,291 429,782REP Mike Sullivan
175,02349.76% 50.31% 648,24349.61% 51.92% 47,545 425,675DEM Ann Harris Bennett
337,090 1,288,383Cast Votes: 96.96% 96.52%96.64% 95.40% 95,836 855,457
46,360
30
16,237
0
Under Votes:Over Votes:
3.04%
0.00%
3.47%
0.00%
3.33%
0.03% 0.00%
4.60%
30
3,303
0
26,820
Cumulative Report — Official Harris County, Texas — General and Special Elections — November 08, 2016
Page 24 of 44
Total Number of Voters : 1,338,898 of 2,182,980 = 61.33%
11/16/2016 12:57 PM
Precincts Reporting 1,012 of 1,012 = 100.00%
ElectionEarlyAbsentee TotalParty Candidate
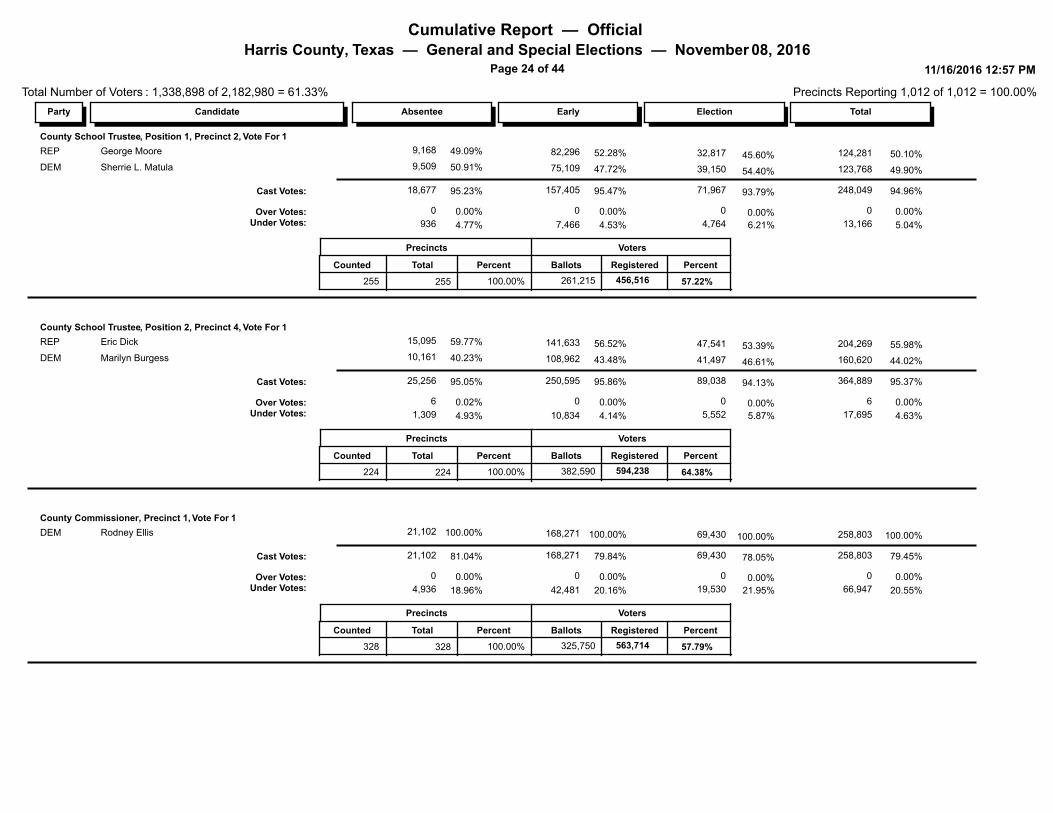
County School Trustee, Position 1, Precinct 2, Vote For 1
32,81752.28% 50.10% 124,28149.09% 45.60% 9,168 82,296REP George Moore
39,15047.72% 49.90% 123,76850.91% 54.40% 9,509 75,109DEM Sherrie L. Matula
71,967 248,049Cast Votes: 95.47% 94.96%95.23% 93.79% 18,677 157,405
13,166
0
4,764
0
Under Votes:Over Votes:
4.53%
0.00%
5.04%
0.00%
4.77%
0.00% 0.00%
6.21%
0
936
0
7,466
Precincts
Counted
255
Total Percent
255
Voters
261,215
Ballots Registered Percent
57.22% 100.00% 456,516
County School Trustee, Position 2, Precinct 4, Vote For 1
47,54156.52% 55.98% 204,26959.77% 53.39% 15,095 141,633REP Eric Dick
41,49743.48% 44.02% 160,62040.23% 46.61% 10,161 108,962DEM Marilyn Burgess
89,038 364,889Cast Votes: 95.86% 95.37%95.05% 94.13% 25,256 250,595
17,695
6
5,552
0
Under Votes:Over Votes:
4.14%
0.00%
4.63%
0.00%
4.93%
0.02% 0.00%
5.87%
6
1,309
0
10,834
Precincts
Counted
224
Total Percent
224
Voters
382,590
Ballots Registered Percent
64.38% 100.00% 594,238
County Commissioner, Precinct 1, Vote For 1
69,430100.00% 100.00% 258,803100.00% 100.00% 21,102 168,271DEM Rodney Ellis
69,430 258,803Cast Votes: 79.84% 79.45%81.04% 78.05% 21,102 168,271
66,947
0
19,530
0
Under Votes:Over Votes:
20.16%
0.00%
20.55%
0.00%
18.96%
0.00% 0.00%
21.95%
0
4,936
0
42,481
Precincts
Counted
328
Total Percent
328
Voters
325,750
Ballots Registered Percent
57.79% 100.00% 563,714
Cumulative Report — Official Harris County, Texas — General and Special Elections — November 08, 2016
Page 25 of 44
Total Number of Voters : 1,338,898 of 2,182,980 = 61.33%
11/16/2016 12:57 PM
Precincts Reporting 1,012 of 1,012 = 100.00%
ElectionEarlyAbsentee TotalParty Candidate
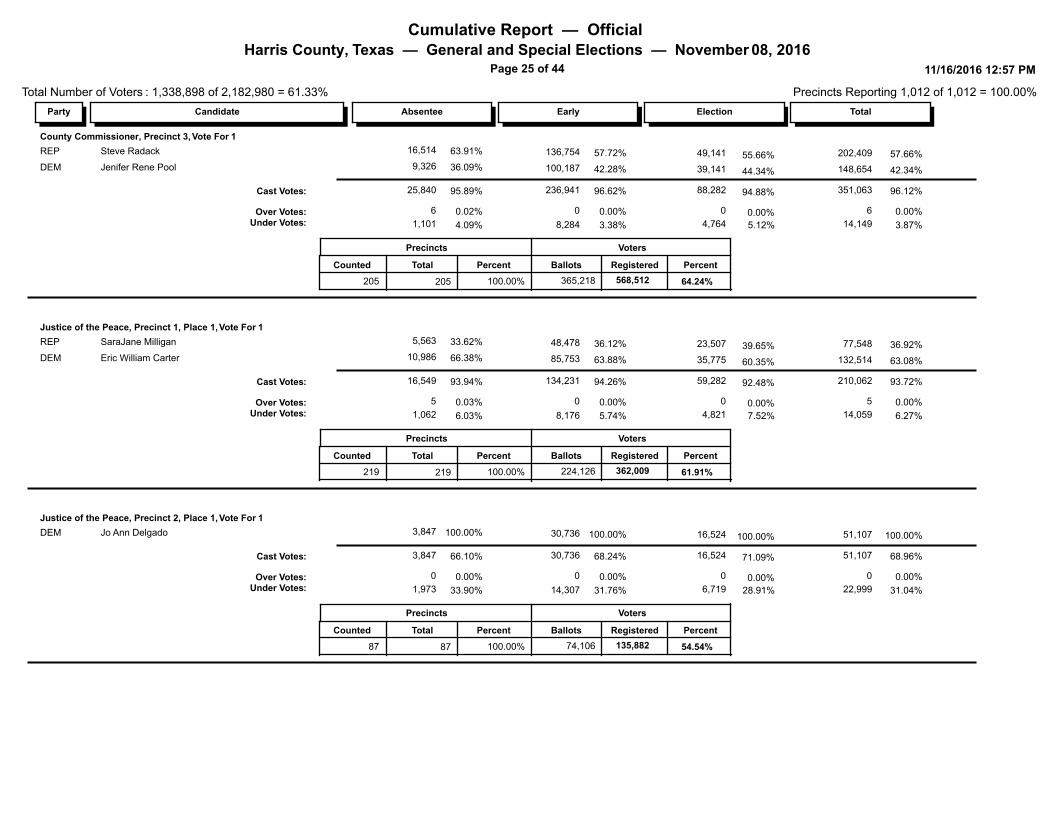
County Commissioner, Precinct 3, Vote For 1
49,14157.72% 57.66% 202,40963.91% 55.66% 16,514 136,754REP Steve Radack
39,14142.28% 42.34% 148,65436.09% 44.34% 9,326 100,187DEM Jenifer Rene Pool
88,282 351,063Cast Votes: 96.62% 96.12%95.89% 94.88% 25,840 236,941
14,149
6
4,764
0
Under Votes:Over Votes:
3.38%
0.00%
3.87%
0.00%
4.09%
0.02% 0.00%
5.12%
6
1,101
0
8,284
Precincts
Counted
205
Total Percent
205
Voters
365,218
Ballots Registered Percent
64.24% 100.00% 568,512
Justice of the Peace, Precinct 1, Place 1, Vote For 1
23,50736.12% 36.92% 77,54833.62% 39.65% 5,563 48,478REP SaraJane Milligan
35,77563.88% 63.08% 132,51466.38% 60.35% 10,986 85,753DEM Eric William Carter
59,282 210,062Cast Votes: 94.26% 93.72%93.94% 92.48% 16,549 134,231
14,059
5
4,821
0
Under Votes:Over Votes:
5.74%
0.00%
6.27%
0.00%
6.03%
0.03% 0.00%
7.52%
5
1,062
0
8,176
Precincts
Counted
219
Total Percent
219
Voters
224,126
Ballots Registered Percent
61.91% 100.00% 362,009
Justice of the Peace, Precinct 2, Place 1, Vote For 1
16,524100.00% 100.00% 51,107100.00% 100.00% 3,847 30,736DEM Jo Ann Delgado
16,524 51,107Cast Votes: 68.24% 68.96%66.10% 71.09% 3,847 30,736
22,999
0
6,719
0
Under Votes:Over Votes:
31.76%
0.00%
31.04%
0.00%
33.90%
0.00% 0.00%
28.91%
0
1,973
0
14,307
Precincts
Counted
87
Total Percent
87
Voters
74,106
Ballots Registered Percent
54.54% 100.00% 135,882
Cumulative Report — Official Harris County, Texas — General and Special Elections — November 08, 2016
Page 26 of 44
Total Number of Voters : 1,338,898 of 2,182,980 = 61.33%
11/16/2016 12:57 PM
Precincts Reporting 1,012 of 1,012 = 100.00%
ElectionEarlyAbsentee TotalParty Candidate
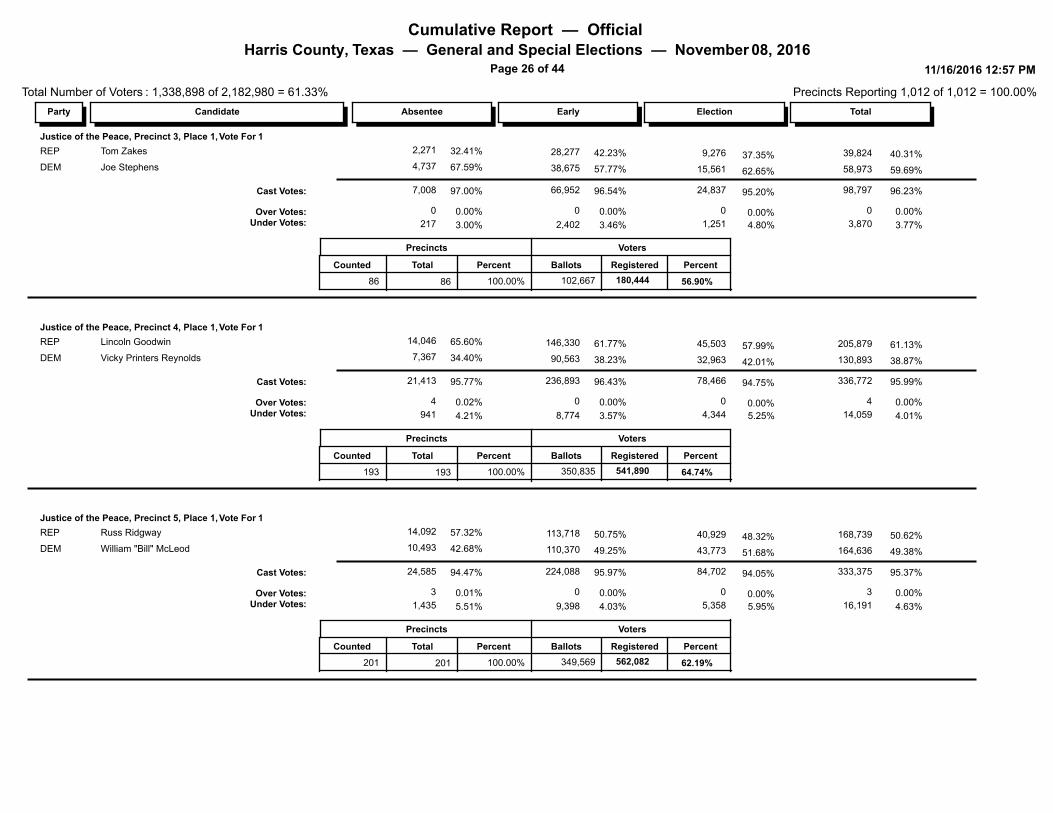
Justice of the Peace, Precinct 3, Place 1, Vote For 1
9,27642.23% 40.31% 39,82432.41% 37.35% 2,271 28,277REP Tom Zakes
15,56157.77% 59.69% 58,97367.59% 62.65% 4,737 38,675DEM Joe Stephens
24,837 98,797Cast Votes: 96.54% 96.23%97.00% 95.20% 7,008 66,952
3,870
0
1,251
0
Under Votes:Over Votes:
3.46%
0.00%
3.77%
0.00%
3.00%
0.00% 0.00%
4.80%
0
217
0
2,402
Precincts
Counted
86
Total Percent
86
Voters
102,667
Ballots Registered Percent
56.90% 100.00% 180,444
Justice of the Peace, Precinct 4, Place 1, Vote For 1
45,50361.77% 61.13% 205,87965.60% 57.99% 14,046 146,330REP Lincoln Goodwin
32,96338.23% 38.87% 130,89334.40% 42.01% 7,367 90,563DEM Vicky Printers Reynolds
78,466 336,772Cast Votes: 96.43% 95.99%95.77% 94.75% 21,413 236,893
14,059
4
4,344
0
Under Votes:Over Votes:
3.57%
0.00%
4.01%
0.00%
4.21%
0.02% 0.00%
5.25%
4
941
0
8,774
Precincts
Counted
193
Total Percent
193
Voters
350,835
Ballots Registered Percent
64.74% 100.00% 541,890
Justice of the Peace, Precinct 5, Place 1, Vote For 1
40,92950.75% 50.62% 168,73957.32% 48.32% 14,092 113,718REP Russ Ridgway
43,77349.25% 49.38% 164,63642.68% 51.68% 10,493 110,370DEM William "Bill" McLeod
84,702 333,375Cast Votes: 95.97% 95.37%94.47% 94.05% 24,585 224,088
16,191
3
5,358
0
Under Votes:Over Votes:
4.03%
0.00%
4.63%
0.00%
5.51%
0.01% 0.00%
5.95%
3
1,435
0
9,398
Precincts
Counted
201
Total Percent
201
Voters
349,569
Ballots Registered Percent
62.19% 100.00% 562,082
Cumulative Report — Official Harris County, Texas — General and Special Elections — November 08, 2016
Page 27 of 44
Total Number of Voters : 1,338,898 of 2,182,980 = 61.33%
11/16/2016 12:57 PM
Precincts Reporting 1,012 of 1,012 = 100.00%
ElectionEarlyAbsentee TotalParty Candidate
Justice of the Peace, Precinct 6, Place 1, Vote For 1
8,579100.00% 100.00% 26,839100.00% 100.00% 1,964 16,296DEM Richard C. Vara
8,579 26,839Cast Votes: 83.44% 83.32%86.52% 82.40% 1,964 16,296
5,372
0
1,832
0
Under Votes:Over Votes:
16.56%
0.00%
16.68%
0.00%
13.48%
0.00% 0.00%
17.60%
0
306
0
3,234
Precincts
Counted
61
Total Percent
61
Voters
32,211
Ballots Registered Percent
51.54% 100.00% 62,497
Justice of the Peace, Precinct 7, Place 1, Vote For 1
24,098100.00% 100.00% 90,866100.00% 100.00% 8,107 58,661DEM Hilary H. Green
24,098 90,866Cast Votes: 87.20% 86.03%84.94% 83.66% 8,107 58,661
14,751
0
4,706
0
Under Votes:Over Votes:
12.80%
0.00%
13.97%
0.00%
15.06%
0.00% 0.00%
16.34%
0
1,437
0
8,608
Precincts
Counted
97
Total Percent
97
Voters
105,617
Ballots Registered Percent
56.89% 100.00% 185,660
Justice of the Peace, Precinct 8, Place 1, Vote For 1
18,984100.00% 100.00% 67,225100.00% 100.00% 5,683 42,558REP Holly Williamson
18,984 67,225Cast Votes: 71.50% 70.29%68.36% 68.27% 5,683 42,558
28,417
0
8,824
0
Under Votes:Over Votes:
28.50%
0.00%
29.71%
0.00%
31.64%
0.00% 0.00%
31.73%
0
2,630
0
16,963
Precincts
Counted
68
Total Percent
68
Voters
95,642
Ballots Registered Percent
62.71% 100.00% 152,516
Cumulative Report — Official Harris County, Texas — General and Special Elections — November 08, 2016
Page 28 of 44
Total Number of Voters : 1,338,898 of 2,182,980 = 61.33%
11/16/2016 12:57 PM
Precincts Reporting 1,012 of 1,012 = 100.00%
ElectionEarlyAbsentee TotalParty Candidate
Constable, Precinct 1, Vote For 1
22,25534.11% 34.75% 73,83331.47% 37.10% 5,265 46,313REP Joe Danna
37,73365.89% 65.25% 138,64668.53% 62.90% 11,467 89,446DEM Alan Rosen
59,988 212,479Cast Votes: 95.33% 94.80%94.98% 93.58% 16,732 135,759
11,643
4
4,115
0
Under Votes:Over Votes:
4.67%
0.00%
5.19%
0.00%
5.00%
0.02% 0.00%
6.42%
4
880
0
6,648
Precincts
Counted
219
Total Percent
219
Voters
224,126
Ballots Registered Percent
61.91% 100.00% 362,009
Constable, Precinct 2, Vote For 1
7,29535.70% 34.90% 24,77635.98% 33.05% 2,023 15,458REP Daniel Vela
14,77664.30% 65.10% 46,22164.02% 66.95% 3,599 27,846DEM Christopher (Chris) Diaz
22,071 70,997Cast Votes: 96.14% 95.80%96.60% 94.96% 5,622 43,304
3,109
0
1,172
0
Under Votes:Over Votes:
3.86%
0.00%
4.20%
0.00%
3.40%
0.00% 0.00%
5.04%
0
198
0
1,739
Precincts
Counted
87
Total Percent
87
Voters
74,106
Ballots Registered Percent
54.54% 100.00% 135,882
Constable, Precinct 3, Vote For 1
9,10540.40% 38.88% 38,63333.02% 36.43% 2,317 27,211REP Dan Webb
15,88659.60% 61.12% 60,72966.98% 63.57% 4,701 40,142DEM Sherman Eagleton
24,991 99,362Cast Votes: 97.11% 96.78%97.13% 95.80% 7,018 67,353
3,301
4
1,097
0
Under Votes:Over Votes:
2.89%
0.00%
3.22%
0.00%
2.81%
0.06% 0.00%
4.20%
4
203
0
2,001
Precincts
Counted
86
Total Percent
86
Voters
102,667
Ballots Registered Percent
56.90% 100.00% 180,444
Cumulative Report — Official Harris County, Texas — General and Special Elections — November 08, 2016
Page 29 of 44
Total Number of Voters : 1,338,898 of 2,182,980 = 61.33%
11/16/2016 12:57 PM
Precincts Reporting 1,012 of 1,012 = 100.00%
ElectionEarlyAbsentee TotalParty Candidate
Constable, Precinct 4, Vote For 1
45,85861.59% 60.95% 206,57564.60% 58.00% 13,863 146,854REP Mark Herman
33,20438.41% 39.05% 132,37435.40% 42.00% 7,598 91,572DEM Jeff McGowen
79,062 338,949Cast Votes: 97.05% 96.61%95.99% 95.47% 21,461 238,426
11,879
7
3,748
0
Under Votes:Over Votes:
2.95%
0.00%
3.39%
0.00%
3.98%
0.03% 0.00%
4.53%
7
890
0
7,241
Precincts
Counted
193
Total Percent
193
Voters
350,835
Ballots Registered Percent
64.74% 100.00% 541,890
Constable, Precinct 5, Vote For 1
51,618100.00% 100.00% 205,188100.00% 100.00% 16,093 137,477REP Ted Heap
51,618 205,188Cast Votes: 58.88% 58.70%61.84% 57.32% 16,093 137,477
144,381
0
38,442
0
Under Votes:Over Votes:
41.12%
0.00%
41.30%
0.00%
38.16%
0.00% 0.00%
42.68%
0
9,930
0
96,009
Precincts
Counted
201
Total Percent
201
Voters
349,569
Ballots Registered Percent
62.19% 100.00% 562,082
Constable, Precinct 6, Vote For 1
2,34323.91% 23.54% 7,21719.37% 23.75% 418 4,456REP Richard "Rick" Gonzales
7,49675.83% 76.16% 23,35379.84% 75.97% 1,723 14,134DEM Silvia Trevino
280.26% 0.31% 940.79% 0.28% 17 49Jesse Frank Hernandez (W)
9,867 30,664Cast Votes: 95.44% 95.20%95.07% 94.77% 2,158 18,639
1,535
12
544
0
Under Votes:Over Votes:
4.56%
0.00%
4.77%
0.04%
4.41%
0.53% 0.00%
5.23%
12
100
0
891
Precincts
Counted
61
Total Percent
61
Voters
32,211
Ballots Registered Percent
51.54% 100.00% 62,497
Cumulative Report — Official Harris County, Texas — General and Special Elections — November 08, 2016
Page 30 of 44
Total Number of Voters : 1,338,898 of 2,182,980 = 61.33%
11/16/2016 12:57 PM
Precincts Reporting 1,012 of 1,012 = 100.00%
ElectionEarlyAbsentee TotalParty Candidate
Constable, Precinct 7, Vote For 1
24,188100.00% 100.00% 91,249100.00% 100.00% 8,201 58,860DEM May Walker
24,188 91,249Cast Votes: 87.50% 86.40%85.93% 83.97% 8,201 58,860
14,368
0
4,616
0
Under Votes:Over Votes:
12.50%
0.00%
13.60%
0.00%
14.07%
0.00% 0.00%
16.03%
0
1,343
0
8,409
Precincts
Counted
97
Total Percent
97
Voters
105,617
Ballots Registered Percent
56.89% 100.00% 185,660
Constable, Precinct 8, Vote For 1
16,84468.77% 67.20% 61,78767.26% 63.76% 5,343 39,600REP Phil Sandlin
9,57431.23% 32.80% 30,16132.74% 36.24% 2,601 17,986DEM Heather Perry
26,418 91,948Cast Votes: 96.75% 96.14%95.56% 95.00% 7,944 57,586
3,691
3
1,390
0
Under Votes:Over Votes:
3.25%
0.00%
3.86%
0.00%
4.40%
0.04% 0.00%
5.00%
3
366
0
1,935
Precincts
Counted
68
Total Percent
68
Voters
95,642
Ballots Registered Percent
62.71% 100.00% 152,516
City of Baytown, Councilmember District No. 1, Vote For 1
17945.37% 44.03% 58627.78% 44.09% 20 387Mercedes Renteria III
22754.63% 55.97% 74572.22% 55.91% 52 466Laura Alvarado
406 1,331Cast Votes: 68.96% 67.87%51.06% 69.64% 72 853
630
0
177
0
Under Votes:Over Votes:
31.04%
0.00%
32.13%
0.00%
48.94%
0.00% 0.00%
30.36%
0
69
0
384
Precincts
Counted
8
Total Percent
8
Voters
1,961
Ballots Registered Percent
42.03% 100.00% 4,666
Cumulative Report — Official Harris County, Texas — General and Special Elections — November 08, 2016
Page 31 of 44
Total Number of Voters : 1,338,898 of 2,182,980 = 61.33%
11/16/2016 12:57 PM
Precincts Reporting 1,012 of 1,012 = 100.00%
ElectionEarlyAbsentee TotalParty Candidate
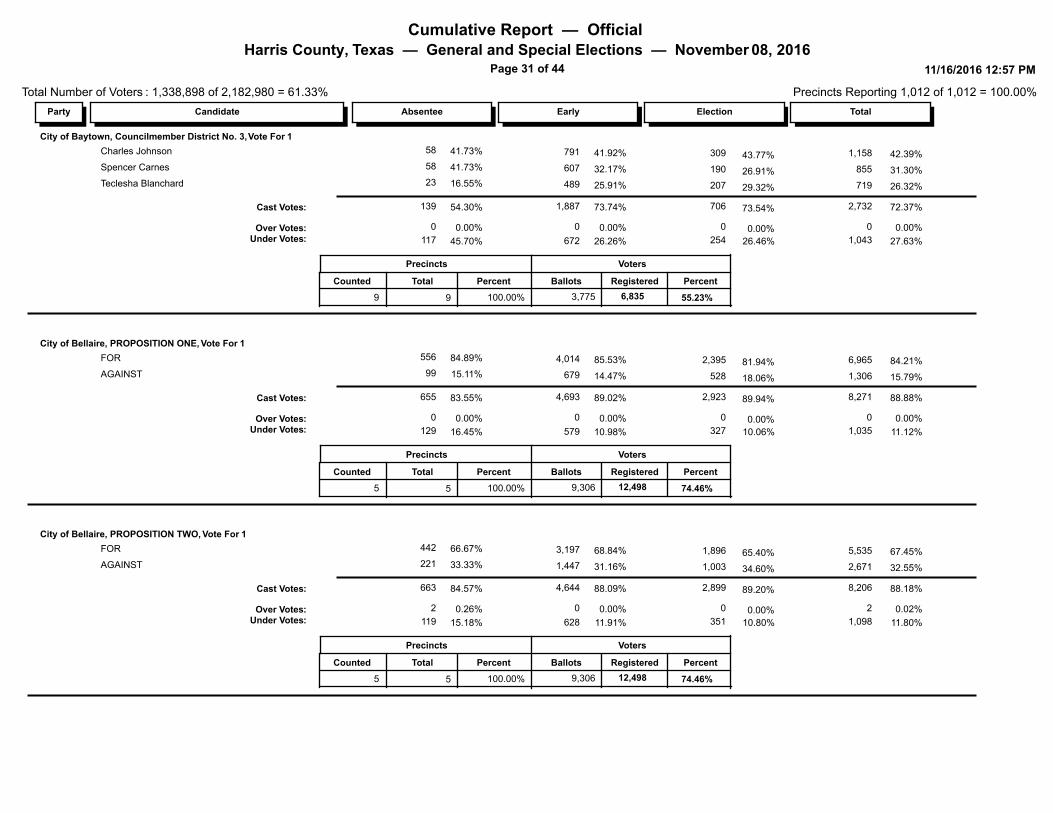
City of Baytown, Councilmember District No. 3, Vote For 1
30941.92% 42.39% 1,15841.73% 43.77% 58 791Charles Johnson
19032.17% 31.30% 85541.73% 26.91% 58 607Spencer Carnes
20725.91% 26.32% 71916.55% 29.32% 23 489Teclesha Blanchard
706 2,732Cast Votes: 73.74% 72.37%54.30% 73.54% 139 1,887
1,043
0
254
0
Under Votes:Over Votes:
26.26%
0.00%
27.63%
0.00%
45.70%
0.00% 0.00%
26.46%
0
117
0
672
Precincts
Counted
9
Total Percent
9
Voters
3,775
Ballots Registered Percent
55.23% 100.00% 6,835
City of Bellaire, PROPOSITION ONE, Vote For 1
2,39585.53% 84.21% 6,96584.89% 81.94% 556 4,014FOR
52814.47% 15.79% 1,30615.11% 18.06% 99 679AGAINST
2,923 8,271Cast Votes: 89.02% 88.88%83.55% 89.94% 655 4,693
1,035
0
327
0
Under Votes:Over Votes:
10.98%
0.00%
11.12%
0.00%
16.45%
0.00% 0.00%
10.06%
0
129
0
579
Precincts
Counted
5
Total Percent
5
Voters
9,306
Ballots Registered Percent
74.46% 100.00% 12,498
City of Bellaire, PROPOSITION TWO, Vote For 1
1,89668.84% 67.45% 5,53566.67% 65.40% 442 3,197FOR
1,00331.16% 32.55% 2,67133.33% 34.60% 221 1,447AGAINST
2,899 8,206Cast Votes: 88.09% 88.18%84.57% 89.20% 663 4,644
1,098
2
351
0
Under Votes:Over Votes:
11.91%
0.00%
11.80%
0.02%
15.18%
0.26% 0.00%
10.80%
2
119
0
628
Precincts
Counted
5
Total Percent
5
Voters
9,306
Ballots Registered Percent
74.46% 100.00% 12,498
Cumulative Report — Official Harris County, Texas — General and Special Elections — November 08, 2016
Page 32 of 44
Total Number of Voters : 1,338,898 of 2,182,980 = 61.33%
11/16/2016 12:57 PM
Precincts Reporting 1,012 of 1,012 = 100.00%
ElectionEarlyAbsentee TotalParty Candidate
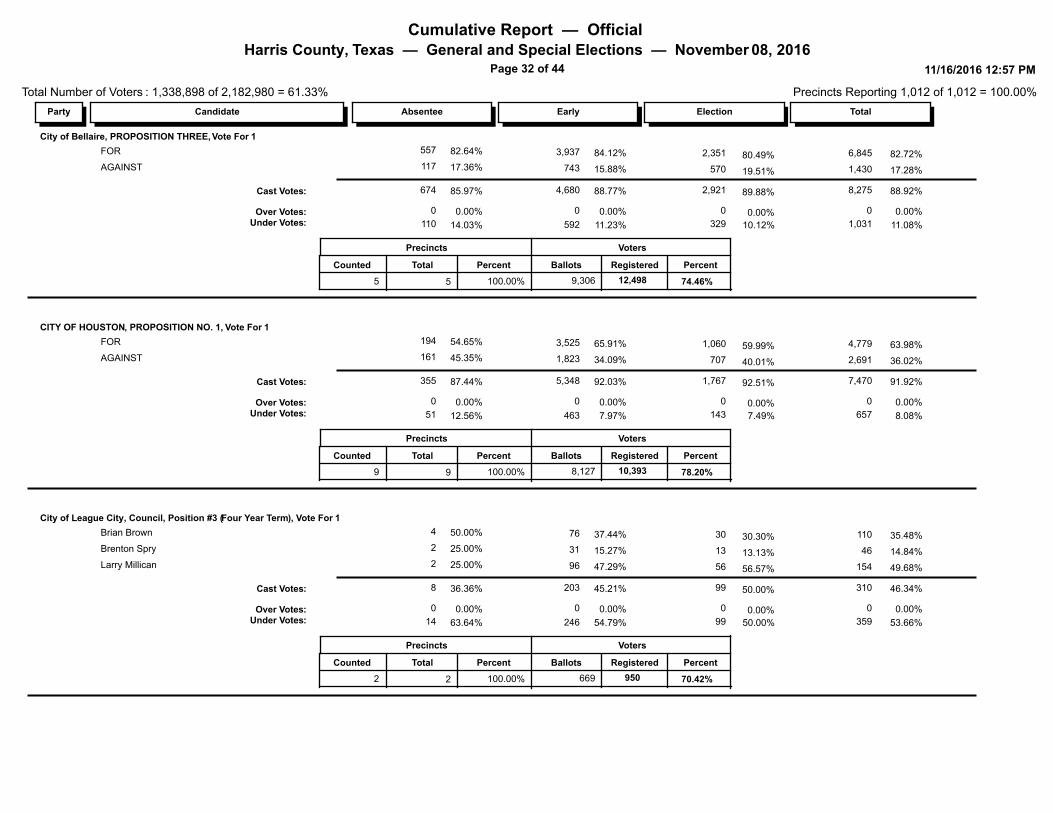
City of Bellaire, PROPOSITION THREE, Vote For 1
2,35184.12% 82.72% 6,84582.64% 80.49% 557 3,937FOR
57015.88% 17.28% 1,43017.36% 19.51% 117 743AGAINST
2,921 8,275Cast Votes: 88.77% 88.92%85.97% 89.88% 674 4,680
1,031
0
329
0
Under Votes:Over Votes:
11.23%
0.00%
11.08%
0.00%
14.03%
0.00% 0.00%
10.12%
0
110
0
592
Precincts
Counted
5
Total Percent
5
Voters
9,306
Ballots Registered Percent
74.46% 100.00% 12,498
CITY OF HOUSTON, PROPOSITION NO. 1, Vote For 1
1,06065.91% 63.98% 4,77954.65% 59.99% 194 3,525FOR
70734.09% 36.02% 2,69145.35% 40.01% 161 1,823AGAINST
1,767 7,470Cast Votes: 92.03% 91.92%87.44% 92.51% 355 5,348
657
0
143
0
Under Votes:Over Votes:
7.97%
0.00%
8.08%
0.00%
12.56%
0.00% 0.00%
7.49%
0
51
0
463
Precincts
Counted
9
Total Percent
9
Voters
8,127
Ballots Registered Percent
78.20% 100.00% 10,393
City of League City, Council, Position #3 (Four Year Term), Vote For 1
3037.44% 35.48% 11050.00% 30.30% 4 76Brian Brown
1315.27% 14.84% 4625.00% 13.13% 2 31Brenton Spry
5647.29% 49.68% 15425.00% 56.57% 2 96Larry Millican
99 310Cast Votes: 45.21% 46.34%36.36% 50.00% 8 203
359
0
99
0
Under Votes:Over Votes:
54.79%
0.00%
53.66%
0.00%
63.64%
0.00% 0.00%
50.00%
0
14
0
246
Precincts
Counted
2
Total Percent
2
Voters
669
Ballots Registered Percent
70.42% 100.00% 950
Cumulative Report — Official Harris County, Texas — General and Special Elections — November 08, 2016
Page 33 of 44
Total Number of Voters : 1,338,898 of 2,182,980 = 61.33%
11/16/2016 12:57 PM
Precincts Reporting 1,012 of 1,012 = 100.00%
ElectionEarlyAbsentee TotalParty Candidate
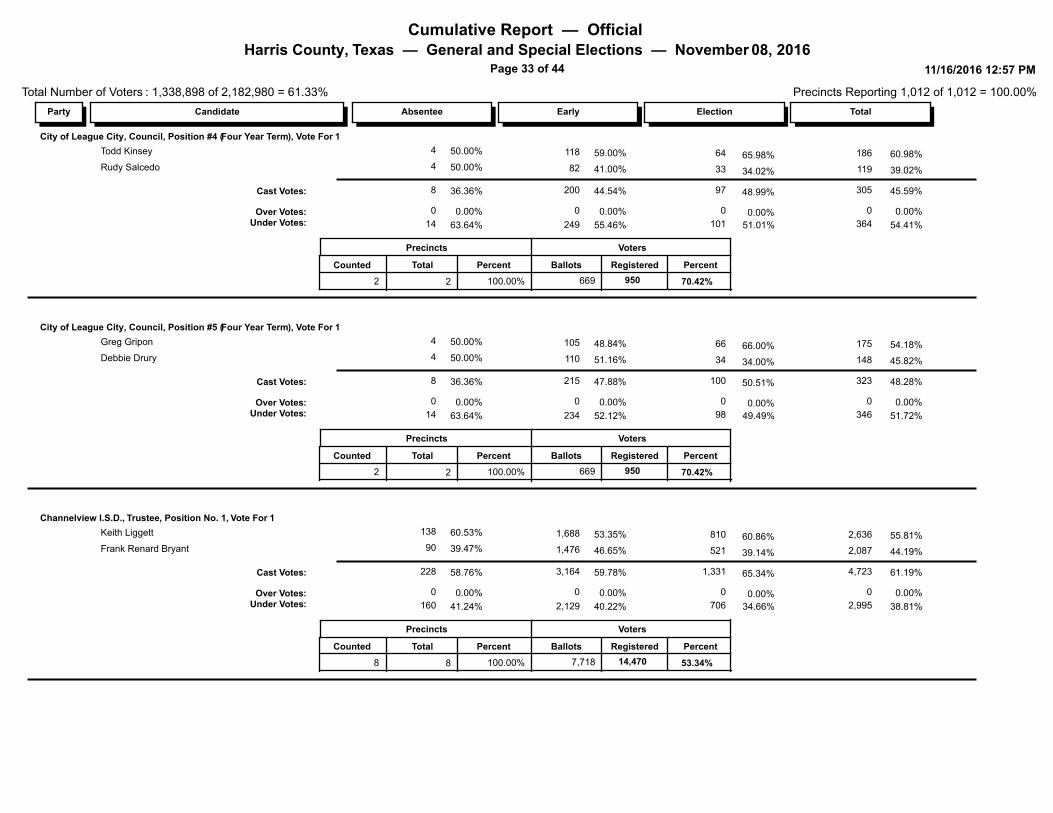
City of League City, Council, Position #4 (Four Year Term), Vote For 1
6459.00% 60.98% 18650.00% 65.98% 4 118Todd Kinsey
3341.00% 39.02% 11950.00% 34.02% 4 82Rudy Salcedo
97 305Cast Votes: 44.54% 45.59%36.36% 48.99% 8 200
364
0
101
0
Under Votes:Over Votes:
55.46%
0.00%
54.41%
0.00%
63.64%
0.00% 0.00%
51.01%
0
14
0
249
Precincts
Counted
2
Total Percent
2
Voters
669
Ballots Registered Percent
70.42% 100.00% 950
City of League City, Council, Position #5 (Four Year Term), Vote For 1
6648.84% 54.18% 17550.00% 66.00% 4 105Greg Gripon
3451.16% 45.82% 14850.00% 34.00% 4 110Debbie Drury
100 323Cast Votes: 47.88% 48.28%36.36% 50.51% 8 215
346
0
98
0
Under Votes:Over Votes:
52.12%
0.00%
51.72%
0.00%
63.64%
0.00% 0.00%
49.49%
0
14
0
234
Precincts
Counted
2
Total Percent
2
Voters
669
Ballots Registered Percent
70.42% 100.00% 950
Channelview I.S.D., Trustee, Position No. 1, Vote For 1
81053.35% 55.81% 2,63660.53% 60.86% 138 1,688Keith Liggett
52146.65% 44.19% 2,08739.47% 39.14% 90 1,476Frank Renard Bryant
1,331 4,723Cast Votes: 59.78% 61.19%58.76% 65.34% 228 3,164
2,995
0
706
0
Under Votes:Over Votes:
40.22%
0.00%
38.81%
0.00%
41.24%
0.00% 0.00%
34.66%
0
160
0
2,129
Precincts
Counted
8
Total Percent
8
Voters
7,718
Ballots Registered Percent
53.34% 100.00% 14,470
Cumulative Report — Official Harris County, Texas — General and Special Elections — November 08, 2016
Page 34 of 44
Total Number of Voters : 1,338,898 of 2,182,980 = 61.33%
11/16/2016 12:57 PM
Precincts Reporting 1,012 of 1,012 = 100.00%
ElectionEarlyAbsentee TotalParty Candidate
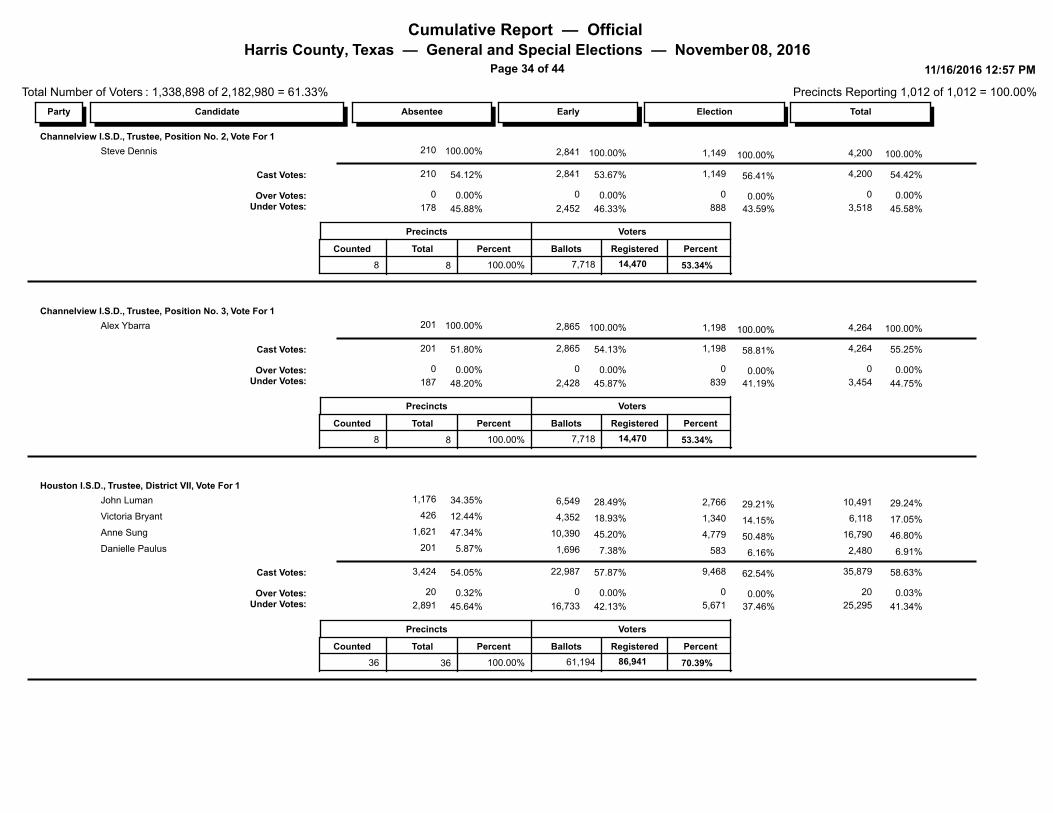
Channelview I.S.D., Trustee, Position No. 2, Vote For 1
1,149100.00% 100.00% 4,200100.00% 100.00% 210 2,841Steve Dennis
1,149 4,200Cast Votes: 53.67% 54.42%54.12% 56.41% 210 2,841
3,518
0
888
0
Under Votes:Over Votes:
46.33%
0.00%
45.58%
0.00%
45.88%
0.00% 0.00%
43.59%
0
178
0
2,452
Precincts
Counted
8
Total Percent
8
Voters
7,718
Ballots Registered Percent
53.34% 100.00% 14,470
Channelview I.S.D., Trustee, Position No. 3, Vote For 1
1,198100.00% 100.00% 4,264100.00% 100.00% 201 2,865Alex Ybarra
1,198 4,264Cast Votes: 54.13% 55.25%51.80% 58.81% 201 2,865
3,454
0
839
0
Under Votes:Over Votes:
45.87%
0.00%
44.75%
0.00%
48.20%
0.00% 0.00%
41.19%
0
187
0
2,428
Precincts
Counted
8
Total Percent
8
Voters
7,718
Ballots Registered Percent
53.34% 100.00% 14,470
Houston I.S.D., Trustee, District VII, Vote For 1
2,76628.49% 29.24% 10,49134.35% 29.21% 1,176 6,549John Luman
1,34018.93% 17.05% 6,11812.44% 14.15% 426 4,352Victoria Bryant
4,77945.20% 46.80% 16,79047.34% 50.48% 1,621 10,390Anne Sung
5837.38% 6.91% 2,4805.87% 6.16% 201 1,696Danielle Paulus
9,468 35,879Cast Votes: 57.87% 58.63%54.05% 62.54% 3,424 22,987
25,295
20
5,671
0
Under Votes:Over Votes:
42.13%
0.00%
41.34%
0.03%
45.64%
0.32% 0.00%
37.46%
20
2,891
0
16,733
Precincts
Counted
36
Total Percent
36
Voters
61,194
Ballots Registered Percent
70.39% 100.00% 86,941
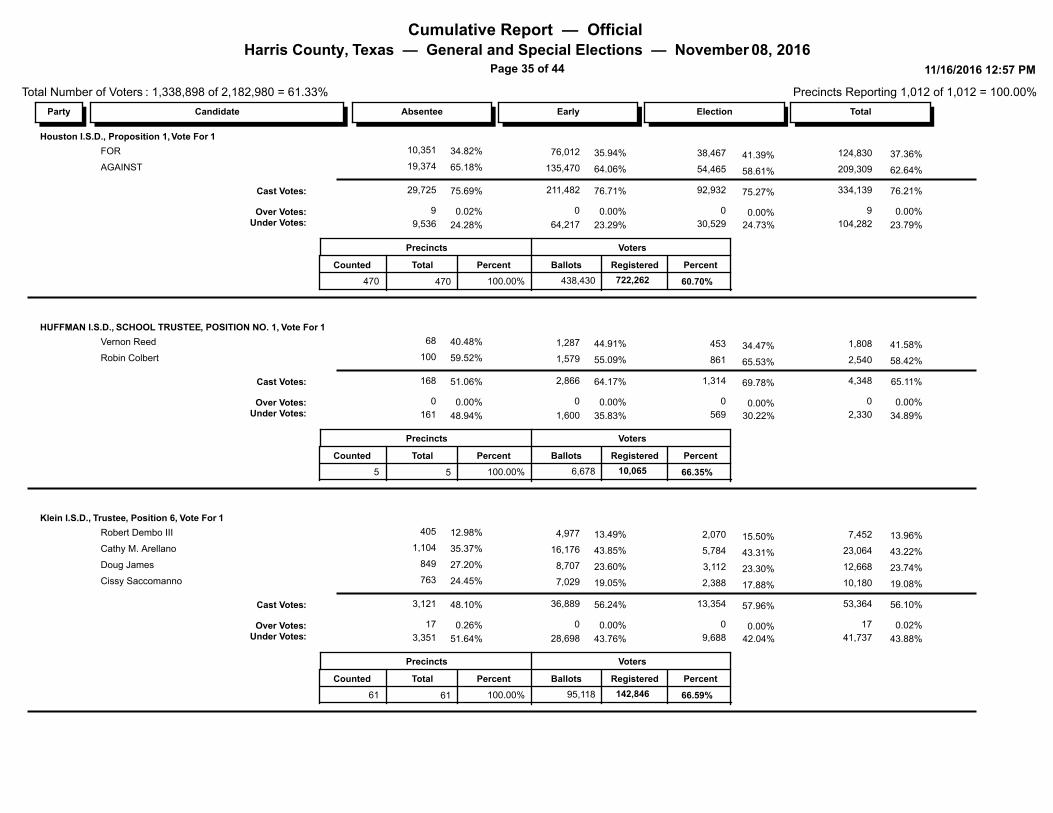
Cumulative Report — Official Harris County, Texas — General and Special Elections — November 08, 2016
Page 35 of 44
Total Number of Voters : 1,338,898 of 2,182,980 = 61.33%
11/16/2016 12:57 PM
Precincts Reporting 1,012 of 1,012 = 100.00%
ElectionEarlyAbsentee TotalParty Candidate
Houston I.S.D., Proposition 1, Vote For 1
38,46735.94% 37.36% 124,83034.82% 41.39% 10,351 76,012FOR
54,46564.06% 62.64% 209,30965.18% 58.61% 19,374 135,470AGAINST
92,932 334,139Cast Votes: 76.71% 76.21%75.69% 75.27% 29,725 211,482
104,282
9
30,529
0
Under Votes:Over Votes:
23.29%
0.00%
23.79%
0.00%
24.28%
0.02% 0.00%
24.73%
9
9,536
0
64,217
Precincts
Counted
470
Total Percent
470
Voters
438,430
Ballots Registered Percent
60.70% 100.00% 722,262
HUFFMAN I.S.D., SCHOOL TRUSTEE, POSITION NO. 1, Vote For 1
45344.91% 41.58% 1,80840.48% 34.47% 68 1,287Vernon Reed
86155.09% 58.42% 2,54059.52% 65.53% 100 1,579Robin Colbert
1,314 4,348Cast Votes: 64.17% 65.11%51.06% 69.78% 168 2,866
2,330
0
569
0
Under Votes:Over Votes:
35.83%
0.00%
34.89%
0.00%
48.94%
0.00% 0.00%
30.22%
0
161
0
1,600
Precincts
Counted
5
Total Percent
5
Voters
6,678
Ballots Registered Percent
66.35% 100.00% 10,065
Klein I.S.D., Trustee, Position 6, Vote For 1
2,07013.49% 13.96% 7,45212.98% 15.50% 405 4,977Robert Dembo III
5,78443.85% 43.22% 23,06435.37% 43.31% 1,104 16,176Cathy M. Arellano
3,11223.60% 23.74% 12,66827.20% 23.30% 849 8,707Doug James
2,38819.05% 19.08% 10,18024.45% 17.88% 763 7,029Cissy Saccomanno
13,354 53,364Cast Votes: 56.24% 56.10%48.10% 57.96% 3,121 36,889
41,737
17
9,688
0
Under Votes:Over Votes:
43.76%
0.00%
43.88%
0.02%
51.64%
0.26% 0.00%
42.04%
17
3,351
0
28,698
Precincts
Counted
61
Total Percent
61
Voters
95,118
Ballots Registered Percent
66.59% 100.00% 142,846
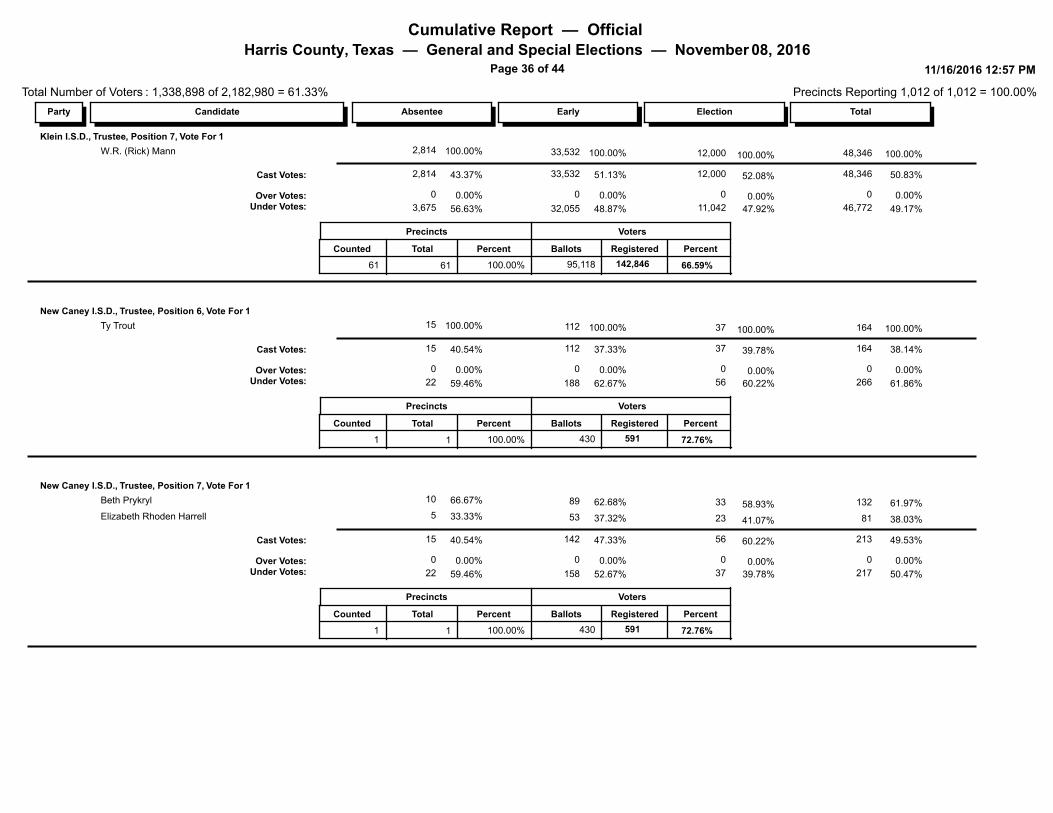
Cumulative Report — Official Harris County, Texas — General and Special Elections — November 08, 2016
Page 36 of 44
Total Number of Voters : 1,338,898 of 2,182,980 = 61.33%
11/16/2016 12:57 PM
Precincts Reporting 1,012 of 1,012 = 100.00%
ElectionEarlyAbsentee TotalParty Candidate
Klein I.S.D., Trustee, Position 7, Vote For 1
12,000100.00% 100.00% 48,346100.00% 100.00% 2,814 33,532W.R. (Rick) Mann
12,000 48,346Cast Votes: 51.13% 50.83%43.37% 52.08% 2,814 33,532
46,772
0
11,042
0
Under Votes:Over Votes:
48.87%
0.00%
49.17%
0.00%
56.63%
0.00% 0.00%
47.92%
0
3,675
0
32,055
Precincts
Counted
61
Total Percent
61
Voters
95,118
Ballots Registered Percent
66.59% 100.00% 142,846
New Caney I.S.D., Trustee, Position 6, Vote For 1
37100.00% 100.00% 164100.00% 100.00% 15 112Ty Trout
37 164Cast Votes: 37.33% 38.14%40.54% 39.78% 15 112
266
0
56
0
Under Votes:Over Votes:
62.67%
0.00%
61.86%
0.00%
59.46%
0.00% 0.00%
60.22%
0
22
0
188
Precincts
Counted
1
Total Percent
1
Voters
430
Ballots Registered Percent
72.76% 100.00% 591
New Caney I.S.D., Trustee, Position 7, Vote For 1
3362.68% 61.97% 13266.67% 58.93% 10 89Beth Prykryl
2337.32% 38.03% 8133.33% 41.07% 5 53Elizabeth Rhoden Harrell
56 213Cast Votes: 47.33% 49.53%40.54% 60.22% 15 142
217
0
37
0
Under Votes:Over Votes:
52.67%
0.00%
50.47%
0.00%
59.46%
0.00% 0.00%
39.78%
0
22
0
158
Precincts
Counted
1
Total Percent
1
Voters
430
Ballots Registered Percent
72.76% 100.00% 591
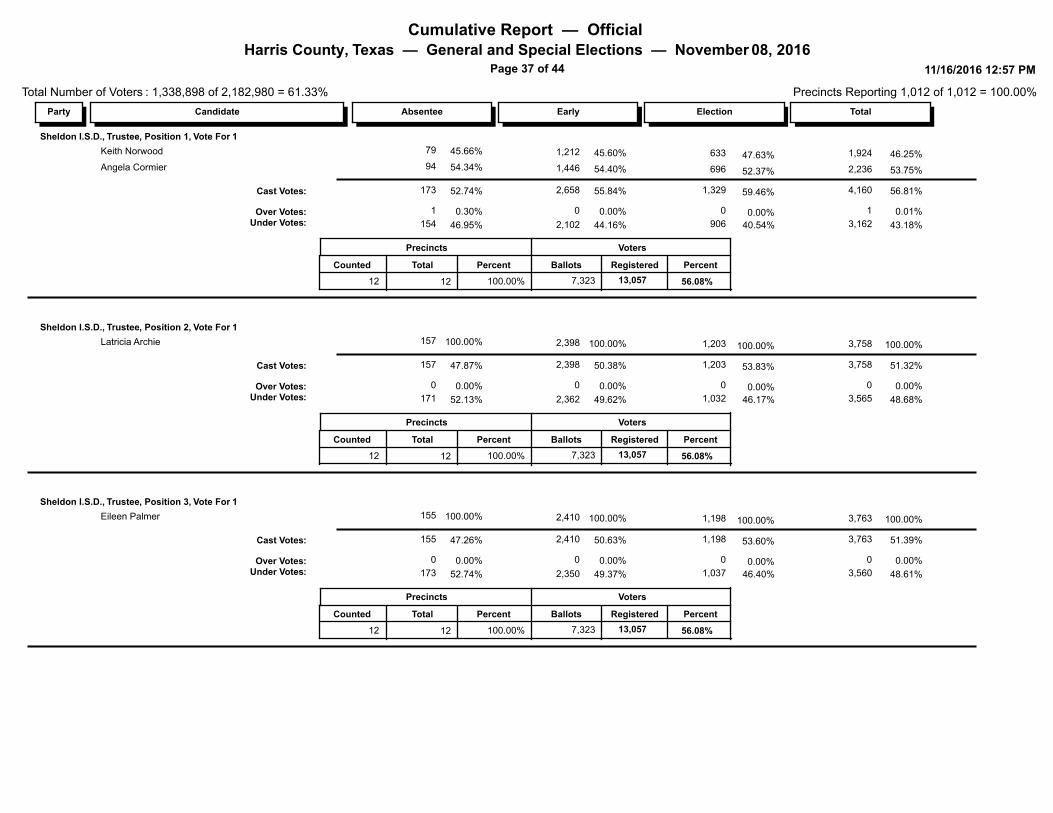
Cumulative Report — Official Harris County, Texas — General and Special Elections — November 08, 2016
Page 37 of 44
Total Number of Voters : 1,338,898 of 2,182,980 = 61.33%
11/16/2016 12:57 PM
Precincts Reporting 1,012 of 1,012 = 100.00%
ElectionEarlyAbsentee TotalParty Candidate
Sheldon I.S.D., Trustee, Position 1, Vote For 1
63345.60% 46.25% 1,92445.66% 47.63% 79 1,212Keith Norwood
69654.40% 53.75% 2,23654.34% 52.37% 94 1,446Angela Cormier
1,329 4,160Cast Votes: 55.84% 56.81%52.74% 59.46% 173 2,658
3,162
1
906
0
Under Votes:Over Votes:
44.16%
0.00%
43.18%
0.01%
46.95%
0.30% 0.00%
40.54%
1
154
0
2,102
Precincts
Counted
12
Total Percent
12
Voters
7,323
Ballots Registered Percent
56.08% 100.00% 13,057
Sheldon I.S.D., Trustee, Position 2, Vote For 1
1,203100.00% 100.00% 3,758100.00% 100.00% 157 2,398Latricia Archie
1,203 3,758Cast Votes: 50.38% 51.32%47.87% 53.83% 157 2,398
3,565
0
1,032
0
Under Votes:Over Votes:
49.62%
0.00%
48.68%
0.00%
52.13%
0.00% 0.00%
46.17%
0
171
0
2,362
Precincts
Counted
12
Total Percent
12
Voters
7,323
Ballots Registered Percent
56.08% 100.00% 13,057
Sheldon I.S.D., Trustee, Position 3, Vote For 1
1,198100.00% 100.00% 3,763100.00% 100.00% 155 2,410Eileen Palmer
1,198 3,763Cast Votes: 50.63% 51.39%47.26% 53.60% 155 2,410
3,560
0
1,037
0
Under Votes:Over Votes:
49.37%
0.00%
48.61%
0.00%
52.74%
0.00% 0.00%
46.40%
0
173
0
2,350
Precincts
Counted
12
Total Percent
12
Voters
7,323
Ballots Registered Percent
56.08% 100.00% 13,057
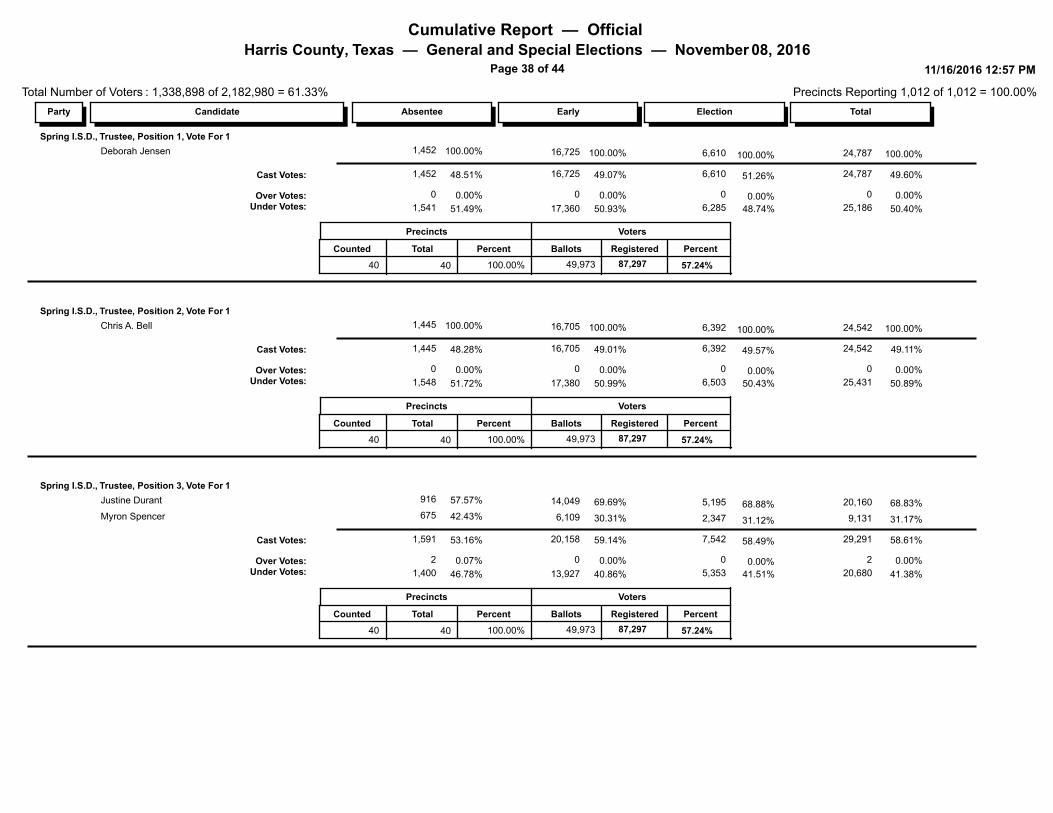
Cumulative Report — Official Harris County, Texas — General and Special Elections — November 08, 2016
Page 38 of 44
Total Number of Voters : 1,338,898 of 2,182,980 = 61.33%
11/16/2016 12:57 PM
Precincts Reporting 1,012 of 1,012 = 100.00%
ElectionEarlyAbsentee TotalParty Candidate
Spring I.S.D., Trustee, Position 1, Vote For 1
6,610100.00% 100.00% 24,787100.00% 100.00% 1,452 16,725Deborah Jensen
6,610 24,787Cast Votes: 49.07% 49.60%48.51% 51.26% 1,452 16,725
25,186
0
6,285
0
Under Votes:Over Votes:
50.93%
0.00%
50.40%
0.00%
51.49%
0.00% 0.00%
48.74%
0
1,541
0
17,360
Precincts
Counted
40
Total Percent
40
Voters
49,973
Ballots Registered Percent
57.24% 100.00% 87,297
Spring I.S.D., Trustee, Position 2, Vote For 1
6,392100.00% 100.00% 24,542100.00% 100.00% 1,445 16,705Chris A. Bell
6,392 24,542Cast Votes: 49.01% 49.11%48.28% 49.57% 1,445 16,705
25,431
0
6,503
0
Under Votes:Over Votes:
50.99%
0.00%
50.89%
0.00%
51.72%
0.00% 0.00%
50.43%
0
1,548
0
17,380
Precincts
Counted
40
Total Percent
40
Voters
49,973
Ballots Registered Percent
57.24% 100.00% 87,297
Spring I.S.D., Trustee, Position 3, Vote For 1
5,19569.69% 68.83% 20,16057.57% 68.88% 916 14,049Justine Durant
2,34730.31% 31.17% 9,13142.43% 31.12% 675 6,109Myron Spencer
7,542 29,291Cast Votes: 59.14% 58.61%53.16% 58.49% 1,591 20,158
20,680
2
5,353
0
Under Votes:Over Votes:
40.86%
0.00%
41.38%
0.00%
46.78%
0.07% 0.00%
41.51%
2
1,400
0
13,927
Precincts
Counted
40
Total Percent
40
Voters
49,973
Ballots Registered Percent
57.24% 100.00% 87,297
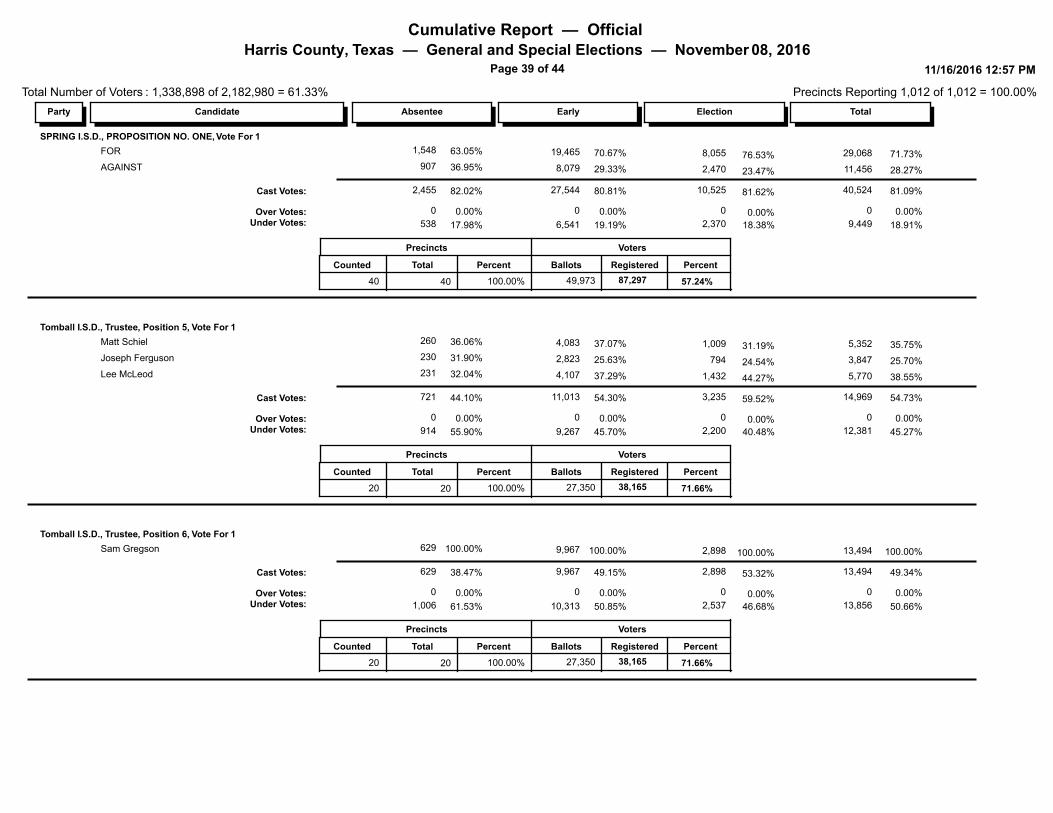
Cumulative Report — Official Harris County, Texas — General and Special Elections — November 08, 2016
Page 39 of 44
Total Number of Voters : 1,338,898 of 2,182,980 = 61.33%
11/16/2016 12:57 PM
Precincts Reporting 1,012 of 1,012 = 100.00%
ElectionEarlyAbsentee TotalParty Candidate
SPRING I.S.D., PROPOSITION NO. ONE, Vote For 1
8,05570.67% 71.73% 29,06863.05% 76.53% 1,548 19,465FOR
2,47029.33% 28.27% 11,45636.95% 23.47% 907 8,079AGAINST
10,525 40,524Cast Votes: 80.81% 81.09%82.02% 81.62% 2,455 27,544
9,449
0
2,370
0
Under Votes:Over Votes:
19.19%
0.00%
18.91%
0.00%
17.98%
0.00% 0.00%
18.38%
0
538
0
6,541
Precincts
Counted
40
Total Percent
40
Voters
49,973
Ballots Registered Percent
57.24% 100.00% 87,297
Tomball I.S.D., Trustee, Position 5, Vote For 1
1,00937.07% 35.75% 5,35236.06% 31.19% 260 4,083Matt Schiel
79425.63% 25.70% 3,84731.90% 24.54% 230 2,823Joseph Ferguson
1,43237.29% 38.55% 5,77032.04% 44.27% 231 4,107Lee McLeod
3,235 14,969Cast Votes: 54.30% 54.73%44.10% 59.52% 721 11,013
12,381
0
2,200
0
Under Votes:Over Votes:
45.70%
0.00%
45.27%
0.00%
55.90%
0.00% 0.00%
40.48%
0
914
0
9,267
Precincts
Counted
20
Total Percent
20
Voters
27,350
Ballots Registered Percent
71.66% 100.00% 38,165
Tomball I.S.D., Trustee, Position 6, Vote For 1
2,898100.00% 100.00% 13,494100.00% 100.00% 629 9,967Sam Gregson
2,898 13,494Cast Votes: 49.15% 49.34%38.47% 53.32% 629 9,967
13,856
0
2,537
0
Under Votes:Over Votes:
50.85%
0.00%
50.66%
0.00%
61.53%
0.00% 0.00%
46.68%
0
1,006
0
10,313
Precincts
Counted
20
Total Percent
20
Voters
27,350
Ballots Registered Percent
71.66% 100.00% 38,165
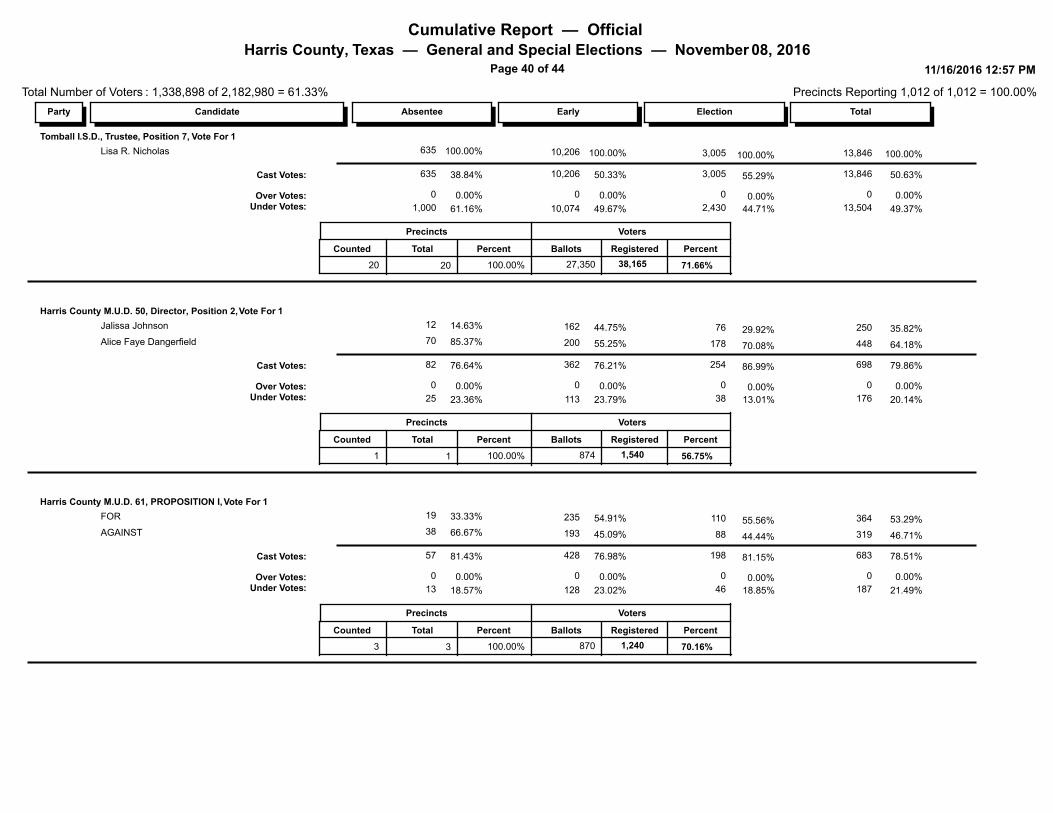
Cumulative Report — Official Harris County, Texas — General and Special Elections — November 08, 2016
Page 40 of 44
Total Number of Voters : 1,338,898 of 2,182,980 = 61.33%
11/16/2016 12:57 PM
Precincts Reporting 1,012 of 1,012 = 100.00%
ElectionEarlyAbsentee TotalParty Candidate
Tomball I.S.D., Trustee, Position 7, Vote For 1
3,005100.00% 100.00% 13,846100.00% 100.00% 635 10,206Lisa R. Nicholas
3,005 13,846Cast Votes: 50.33% 50.63%38.84% 55.29% 635 10,206
13,504
0
2,430
0
Under Votes:Over Votes:
49.67%
0.00%
49.37%
0.00%
61.16%
0.00% 0.00%
44.71%
0
1,000
0
10,074
Precincts
Counted
20
Total Percent
20
Voters
27,350
Ballots Registered Percent
71.66% 100.00% 38,165
Harris County M.U.D. 50, Director, Position 2, Vote For 1
7644.75% 35.82% 25014.63% 29.92% 12 162Jalissa Johnson
17855.25% 64.18% 44885.37% 70.08% 70 200Alice Faye Dangerfield
254 698Cast Votes: 76.21% 79.86%76.64% 86.99% 82 362
176
0
38
0
Under Votes:Over Votes:
23.79%
0.00%
20.14%
0.00%
23.36%
0.00% 0.00%
13.01%
0
25
0
113
Precincts
Counted
1
Total Percent
1
Voters
874
Ballots Registered Percent
56.75% 100.00% 1,540
Harris County M.U.D. 61, PROPOSITION I, Vote For 1
11054.91% 53.29% 36433.33% 55.56% 19 235FOR
8845.09% 46.71% 31966.67% 44.44% 38 193AGAINST
198 683Cast Votes: 76.98% 78.51%81.43% 81.15% 57 428
187
0
46
0
Under Votes:Over Votes:
23.02%
0.00%
21.49%
0.00%
18.57%
0.00% 0.00%
18.85%
0
13
0
128
Precincts
Counted
3
Total Percent
3
Voters
870
Ballots Registered Percent
70.16% 100.00% 1,240
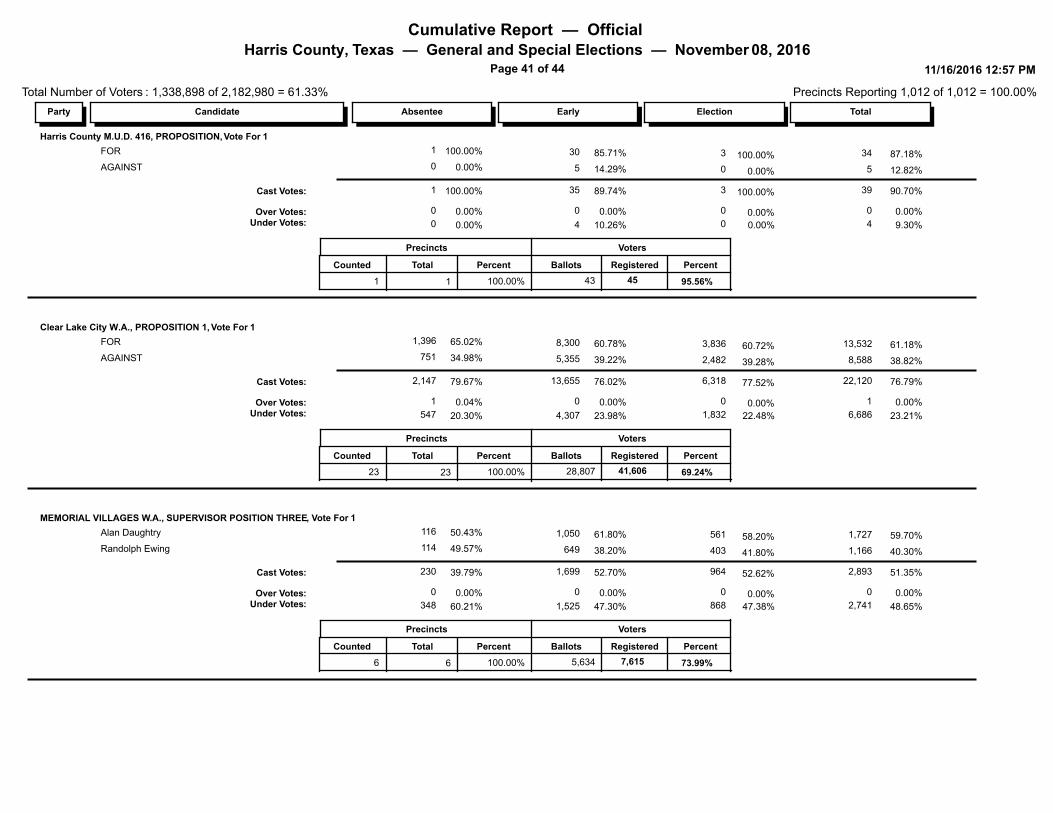
Cumulative Report — Official Harris County, Texas — General and Special Elections — November 08, 2016
Page 41 of 44
Total Number of Voters : 1,338,898 of 2,182,980 = 61.33%
11/16/2016 12:57 PM
Precincts Reporting 1,012 of 1,012 = 100.00%
ElectionEarlyAbsentee TotalParty Candidate
Harris County M.U.D. 416, PROPOSITION, Vote For 1
385.71% 87.18% 34100.00% 100.00% 1 30FOR
014.29% 12.82% 50.00% 0.00% 0 5AGAINST
3 39Cast Votes: 89.74% 90.70%100.00% 100.00% 1 35
4
0
0
0
Under Votes:Over Votes:
10.26%
0.00%
9.30%
0.00%
0.00%
0.00% 0.00%
0.00%
0
0
0
4
Precincts
Counted
1
Total Percent
1
Voters
43
Ballots Registered Percent
95.56% 100.00% 45
Clear Lake City W.A., PROPOSITION 1, Vote For 1
3,83660.78% 61.18% 13,53265.02% 60.72% 1,396 8,300FOR
2,48239.22% 38.82% 8,58834.98% 39.28% 751 5,355AGAINST
6,318 22,120Cast Votes: 76.02% 76.79%79.67% 77.52% 2,147 13,655
6,686
1
1,832
0
Under Votes:Over Votes:
23.98%
0.00%
23.21%
0.00%
20.30%
0.04% 0.00%
22.48%
1
547
0
4,307
Precincts
Counted
23
Total Percent
23
Voters
28,807
Ballots Registered Percent
69.24% 100.00% 41,606
MEMORIAL VILLAGES W.A., SUPERVISOR POSITION THREE, Vote For 1
56161.80% 59.70% 1,72750.43% 58.20% 116 1,050Alan Daughtry
40338.20% 40.30% 1,16649.57% 41.80% 114 649Randolph Ewing
964 2,893Cast Votes: 52.70% 51.35%39.79% 52.62% 230 1,699
2,741
0
868
0
Under Votes:Over Votes:
47.30%
0.00%
48.65%
0.00%
60.21%
0.00% 0.00%
47.38%
0
348
0
1,525
Precincts
Counted
6
Total Percent
6
Voters
5,634
Ballots Registered Percent
73.99% 100.00% 7,615

Cumulative Report — Official Harris County, Texas — General and Special Elections — November 08, 2016
Page 42 of 44
Total Number of Voters : 1,338,898 of 2,182,980 = 61.33%
11/16/2016 12:57 PM
Precincts Reporting 1,012 of 1,012 = 100.00%
ElectionEarlyAbsentee TotalParty Candidate
Old Town Spring I.D., Board of Directors, Position 4, Vote For 1
1069.23% 70.37% 190.00% 71.43% 0 9Kelly Ann Spear
430.77% 29.63% 80.00% 28.57% 0 4Ronald Krueger
14 27Cast Votes: 86.67% 84.38%0.00% 82.35% 0 13
5
0
3
0
Under Votes:Over Votes:
13.33%
0.00%
15.63%
0.00%
0.00%
0.00% 0.00%
17.65%
0
0
0
2
Precincts
Counted
2
Total Percent
2
Voters
32
Ballots Registered Percent
62.75% 100.00% 51
SAINT GEORGE PLACE MANAGEMENT DISTRICT PROPOSITION, Vote For 1
12163.97% 61.88% 32356.00% 60.50% 28 174FOR
7936.03% 38.12% 19944.00% 39.50% 22 98AGAINST
200 522Cast Votes: 88.31% 87.15%90.91% 84.75% 50 272
77
0
36
0
Under Votes:Over Votes:
11.69%
0.00%
12.85%
0.00%
9.09%
0.00% 0.00%
15.25%
0
5
0
36
Precincts
Counted
2
Total Percent
2
Voters
599
Ballots Registered Percent
78.82% 100.00% 760
THE WOODLANDS TOWNSHIP, Position No. 1, Vote For 1
16337.39% 38.19% 1,07744.06% 40.65% 63 851Amy Lampman
20350.70% 50.14% 1,41439.86% 50.62% 57 1,154Gordy Bunch
3511.91% 11.67% 32916.08% 8.73% 23 271Bob Leilich
401 2,820Cast Votes: 70.03% 70.17%64.71% 73.18% 143 2,276
1,199
0
147
0
Under Votes:Over Votes:
29.97%
0.00%
29.83%
0.00%
35.29%
0.00% 0.00%
26.82%
0
78
0
974
Precincts
Counted
2
Total Percent
2
Voters
4,019
Ballots Registered Percent
81.00% 100.00% 4,962
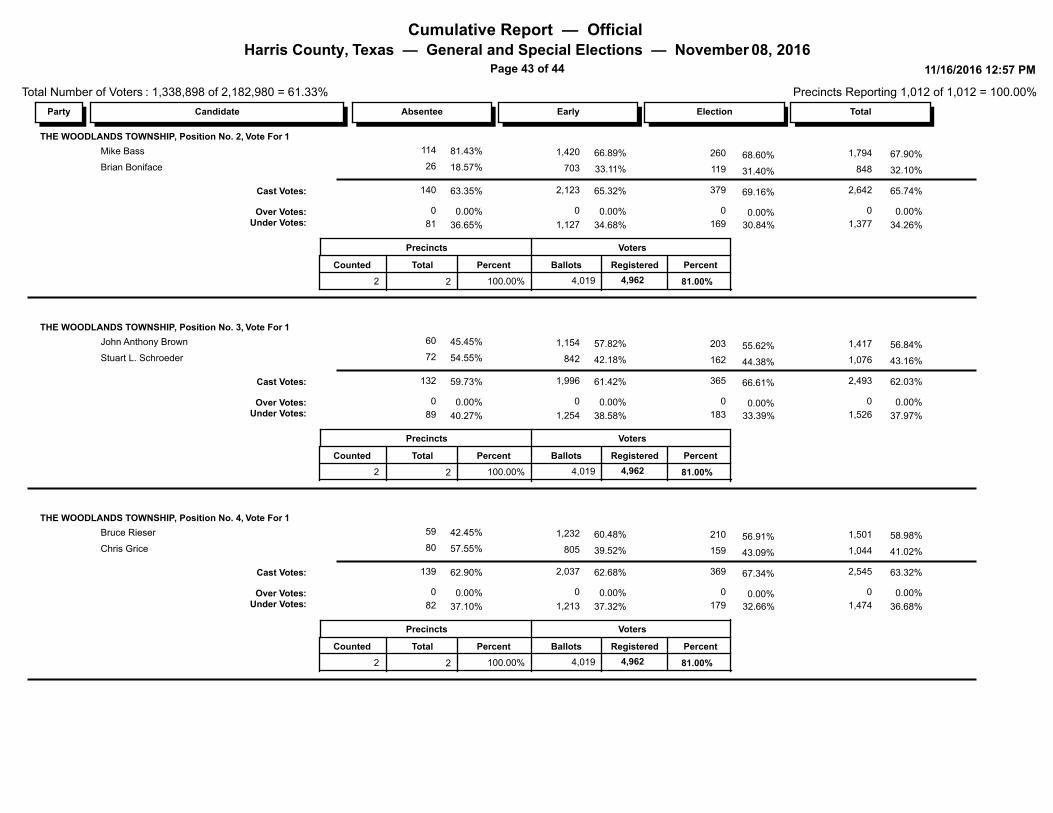
Cumulative Report — Official Harris County, Texas — General and Special Elections — November 08, 2016
Page 43 of 44
Total Number of Voters : 1,338,898 of 2,182,980 = 61.33%
11/16/2016 12:57 PM
Precincts Reporting 1,012 of 1,012 = 100.00%
ElectionEarlyAbsentee TotalParty Candidate
THE WOODLANDS TOWNSHIP, Position No. 2, Vote For 1
26066.89% 67.90% 1,79481.43% 68.60% 114 1,420Mike Bass
11933.11% 32.10% 84818.57% 31.40% 26 703Brian Boniface
379 2,642Cast Votes: 65.32% 65.74%63.35% 69.16% 140 2,123
1,377
0
169
0
Under Votes:Over Votes:
34.68%
0.00%
34.26%
0.00%
36.65%
0.00% 0.00%
30.84%
0
81
0
1,127
Precincts
Counted
2
Total Percent
2
Voters
4,019
Ballots Registered Percent
81.00% 100.00% 4,962
THE WOODLANDS TOWNSHIP, Position No. 3, Vote For 1
20357.82% 56.84% 1,41745.45% 55.62% 60 1,154John Anthony Brown
16242.18% 43.16% 1,07654.55% 44.38% 72 842Stuart L. Schroeder
365 2,493Cast Votes: 61.42% 62.03%59.73% 66.61% 132 1,996
1,526
0
183
0
Under Votes:Over Votes:
38.58%
0.00%
37.97%
0.00%
40.27%
0.00% 0.00%
33.39%
0
89
0
1,254
Precincts
Counted
2
Total Percent
2
Voters
4,019
Ballots Registered Percent
81.00% 100.00% 4,962
THE WOODLANDS TOWNSHIP, Position No. 4, Vote For 1
21060.48% 58.98% 1,50142.45% 56.91% 59 1,232Bruce Rieser
15939.52% 41.02% 1,04457.55% 43.09% 80 805Chris Grice
369 2,545Cast Votes: 62.68% 63.32%62.90% 67.34% 139 2,037
1,474
0
179
0
Under Votes:Over Votes:
37.32%
0.00%
36.68%
0.00%
37.10%
0.00% 0.00%
32.66%
0
82
0
1,213
Precincts
Counted
2
Total Percent
2
Voters
4,019
Ballots Registered Percent
81.00% 100.00% 4,962
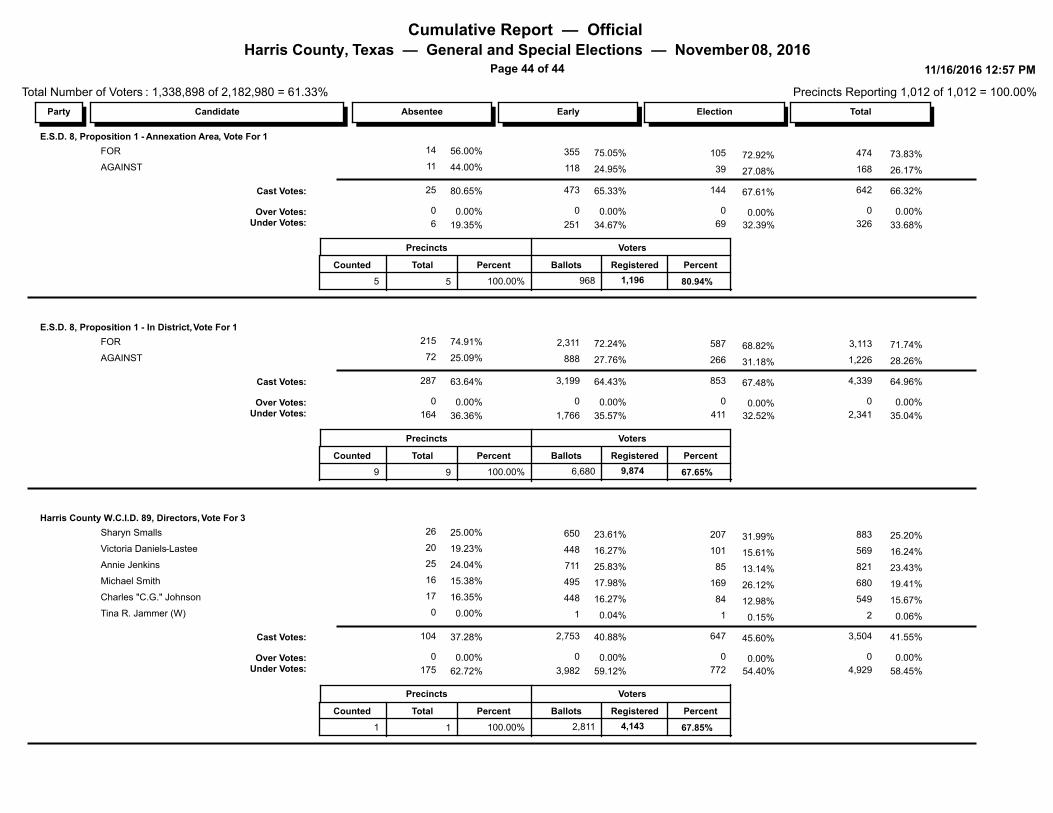
Cumulative Report — Official Harris County, Texas — General and Special Elections — November 08, 2016
Page 44 of 44
Total Number of Voters : 1,338,898 of 2,182,980 = 61.33%
11/16/2016 12:57 PM
Precincts Reporting 1,012 of 1,012 = 100.00%
ElectionEarlyAbsentee TotalParty Candidate
E.S.D. 8, Proposition 1 - Annexation Area, Vote For 1
10575.05% 73.83% 47456.00% 72.92% 14 355FOR
3924.95% 26.17% 16844.00% 27.08% 11 118AGAINST
144 642Cast Votes: 65.33% 66.32%80.65% 67.61% 25 473
326
0
69
0
Under Votes:Over Votes:
34.67%
0.00%
33.68%
0.00%
19.35%
0.00% 0.00%
32.39%
0
6
0
251
Precincts
Counted
5
Total Percent
5
Voters
968
Ballots Registered Percent
80.94% 100.00% 1,196
E.S.D. 8, Proposition 1 - In District, Vote For 1
58772.24% 71.74% 3,11374.91% 68.82% 215 2,311FOR
26627.76% 28.26% 1,22625.09% 31.18% 72 888AGAINST
853 4,339Cast Votes: 64.43% 64.96%63.64% 67.48% 287 3,199
2,341
0
411
0
Under Votes:Over Votes:
35.57%
0.00%
35.04%
0.00%
36.36%
0.00% 0.00%
32.52%
0
164
0
1,766
Precincts
Counted
9
Total Percent
9
Voters
6,680
Ballots Registered Percent
67.65% 100.00% 9,874
Harris County W.C.I.D. 89, Directors, Vote For 3
20723.61% 25.20% 88325.00% 31.99% 26 650Sharyn Smalls
10116.27% 16.24% 56919.23% 15.61% 20 448Victoria Daniels-Lastee
8525.83% 23.43% 82124.04% 13.14% 25 711Annie Jenkins
16917.98% 19.41% 68015.38% 26.12% 16 495Michael Smith
8416.27% 15.67% 54916.35% 12.98% 17 448Charles "C.G." Johnson
10.04% 0.06% 20.00% 0.15% 0 1Tina R. Jammer (W)
647 3,504Cast Votes: 40.88% 41.55%37.28% 45.60% 104 2,753
4,929
0
772
0
Under Votes:Over Votes:
59.12%
0.00%
58.45%
0.00%
62.72%
0.00% 0.00%
54.40%
0
175
0
3,982
Precincts
Counted
1
Total Percent
1
Voters
2,811
Ballots Registered Percent
67.85% 100.00% 4,143