Embed Size (px)
Citation preview
A—70
culvert Scour Assessment
Deadwood Creek Tributary North
Deadwood creek Tributary North
Site Information
Site Location: Coast Range, S Willamette Valley, Deadwood Road
Year Installed: 2000
Lat/Long: 123°40”54.12”W Watershed Area (mi2): 0.43
44°13’21.62”N
Stream Slope (ft/ft)1: 0.0618 Channel Type: Step-pool
Bankfull Width (ft): 16 Survey Date: March 6, 20071Water surface slope extending up to 20 channel widths up and downstream of crossing.
Culvert Information
Culvert Type: open-bottom arch Culvert Material: Annular CMP
Culvert Width: 8 ft Outlet Type: Mitered
Culvert Length: 56 ft Inlet Type: Mitered
Pipe Slope (structure slope): 0.066
Culvert Bed Slope: 0.063
(First hydraulic control upstream of inlet to first hydraulic control downstream of outlet.)
Culvert width as a percentage of bankfull width: 0.51
Alignment Conditions: Culvert aligned to minimize length under road, thus creating greater slope and necessitatingriprapdeflectoronrightbankatinletandalsorequiringariprapstepdownstreamofoutletto control grade.
Bed Conditions: Large material (larger than natural channel) placed in culvert during construction. Large rock step present at inlet.
Pipe Condition: Good condition.
Hydrology
Discharge (cfs) for indicated recurrence interval
25% 2-yr 2-year Qbf
2 5-year 10-year 50-year 100-year
10 40 40 58 70 99 1112Bankfull flow estimated by matching modeled water surface elevations to field-identified bankfull elevations.
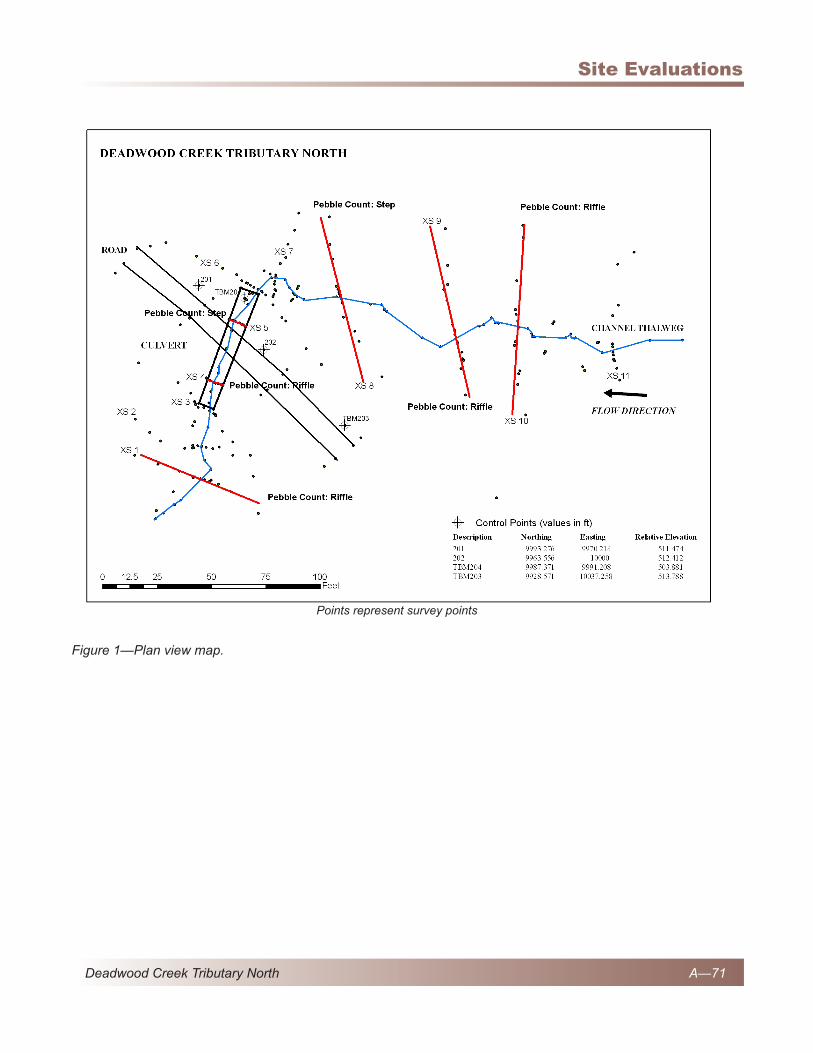
A—71
Site Evaluations
Deadwood Creek Tributary North
Figure 1—Plan view map.
Points represent survey points
A—72
culvert Scour Assessment
Deadwood Creek Tributary North
HISTOrY
The Deadwood Tributary North culvert was installed in August 2000. Material was placed and “packed” in the culvert using an excavator. The material was 8-inch minus, well-graded, and consistedofafullrangeofsizes.Nosignificantmaterial sorting or bedform construction was conducted, except for the creation of a minor (3 to 4 inch) thalweg.
The preexisting alignment was considered “stable” with a short culvert. Realignment with the upstream channel to remove the sharp bend at the inlet was considered but the structure would have been steeper and about 120 feet long. The designers chose to avoid lengthening the structureandplacedariprapreflectoragainsttheinletbanktodissipateenergyandreflectflowtowards the inlet.
The crossing was located at a grade break and had a deep scour pool at the outlet. The channel traveled over root wads dropping 2 to 3 feet in one spot. The designers smoothed the downstreamlongprofiletoremovethelargedrop and placed some 12-inch +/- boulders downstreamtoimprovefishpathwayintotheculvert.
Since construction, the inlet riprap has been damaged (undermined?) and has failed into the inletareadisruptingandconcentratingflow.Thedownstreamchannelwasnotwelldefinedafterconstruction and is believed to create potential fishpassageissues.
Maintenance at the site includes foot kicking and hand rolling of material into the downstream channel in an effort to improve channel conditions forfishbyconcentratingflowandcreatinga
deeper thalweg. There has been minor foot adjustment of material inside the culvert for the same purpose. Small pieces of debris have been removed from the inlet.
The above information furnished by Kim Johansen, USFS.
Thefloodhistoryatanearbygaugewithadrainage area of 5.7 square miles (USGS #14306340) indicates that the largest event since construction was an approximately 2-year recurrence interval event in 2006.
SITE DESCrIPTIOn
The Deadwood Tributary (north) culvert is a bottomless arch that is mitered to conform to theroadfill.Theculverthasexposedconcretefootings. The culvert is out of line with the natural channel alignment judging from the valley alignment. Just upstream of the inlet to the culvert, the channel takes a sharp turn to the left, an artifact of the construction of the road and stream crossing. Riprap was placed along the bank here to protect the bank from erosion and to deflectflowintotheculvert.Someofthismaterialhas failed and has entered the culvert inlet contributing to a large rock step near the inlet (Kim Johansen, USFS, personal communication). After the large rock step at the inlet, the channel dropsintoarifflethatrunstherestofthelengthof the culvert. The entirety of the stream through the culvert is made up of highly angular oversized materialwithaslightfiningtowardstheoutlet.Rock steps in the culvert are bigger and more frequent than those found in the reference channel.
A—73
Site Evaluations
Deadwood Creek Tributary North
The upstream representative channel consisted of a high-gradient step-pool channel with a low activeflood-plainsurface.Thechannelsitsinafairlyconfinedandnarrowvalleybuttheflood-plain valley width is approximately 2 to 3 channel widths.Evenlygradedriffleswereinterspersedby four steps and plunge pools. Thick vegetation (salmonberry) was encroaching on the channel adding roughness and providing cover and shade.
Downstream of the culvert, there was a steep riprapstepandtheabilityforfishtopassthisstep is unknown but based on visual observation may be a concern. Below the step, the stream levelsoffasitentersthefloodplainofDeadwoodCreek. Large quantities of brush from roadside clearing were present downstream of the crossing.
SurvEY SuMMArY
Elevencrosssectionsandalongitudinalprofilewere surveyed along Deadwood Tributary North in March 2007 to characterize the culvert and an upstream representative reach. No downstream reference reach was established due to the proximityofthecrossingwiththeconfluenceofDeadwoodCreek.Intheculvert,referencecrosssectionsweretakenthroughtheriffle,oneatthedownstream end of the step and the other in the downstream third of the culvert. Two additional cross sections were surveyed downstream of the culvert to characterize the outlet as well as the expansionofflow.Anothertwocrosssectionswere surveyed upstream to characterize the inlet aswellasthecontractionofflow.
Five cross sections were surveyed to characterize the upstream reach; one at the upstream and downstream end, one through a step and two throughriffles.
A single representative cross section and pebble count were taken downstream of the riprap step but it was not used in the analysis because of potentialbackwaterinfluencefromDeadwoodCreek.
PrOfILE AnALYSIS SEgMEnT SuMMArY
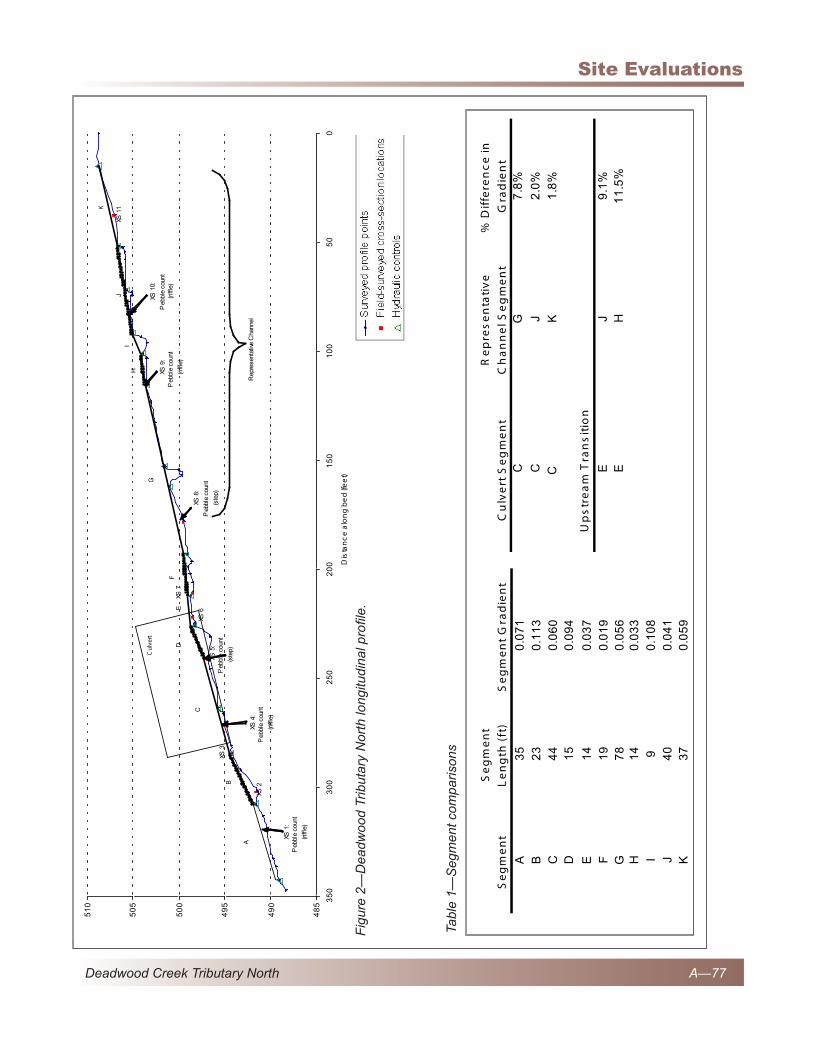
Theprofileanalysisresultedinatotalof11profilesegments.Theculvertconsistedoftwoprofilesegments.Thedownstreamsegmentin the culvert was compared to three different representativeprofilesegmentsintheupstreamchannel. There was no suitable comparison segment for the upstream segment in the culvert. The upstream transition segment was comparedtotworepresentativeprofilesegmentsin the upstream channel. There was no suitable comparison segment for the downstream transitionsegment.Seefigure2andtable1.
SCOur COnDITIOnS
Observed conditions
Footing scour – There was no observed scour undermining footings or threatening structure integrity.
Culvert bed adjustment – A step (just downstream of the inlet) has formed from large angular material sourced from riprap that was placed on the right bank upstream of the inlet at construction. There is a scour pool downstream of the step. This step and scour pool have developed since construction of the bed. Angular material is still visible throughout the culvert, suggesting that much of the originally placed material has remained in the pipe.
Profile characteristics–Theprofilehasaconvexshape(figure2).Thisshapereflectsagraduallysteepeningprofileinthedownstreamdirection.The structure is not placed in alignment with the stream valley and instead takes a more direct
A—74
culvert Scour Assessment
Deadwood Creek Tributary North
line perpendicular across the roadway straight to Deadwood Creek. This shortens the channel lengthandsteepenstheprofileattheculvertsiteand downstream.
Residual depths – The one residual depth in the culvert is 0.3 feet, which was in the upstream profilesegmentthathasnocomparableslope segment in the representative channel. Nevertheless, the 0.3 feet is within the range of the total population of residual depths from all the representative channel segments, which ranged from0.06to1.3feet(figure21).Thissuggestsnosignificantscourbeyondwhatisfoundinthechannel outside of the crossing.
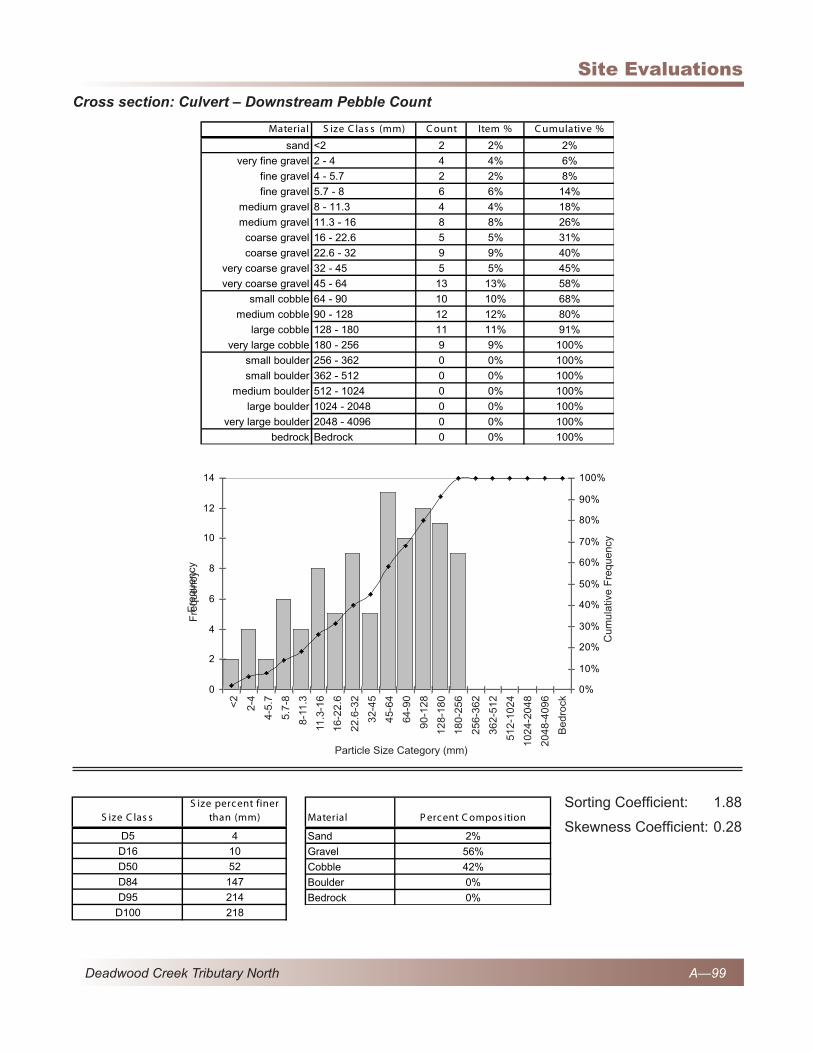
Substrate – The culvert has more bed material in larger size classes than the natural channel. The natural channel has very few clasts greater than cobble size, whereas the culvert has material up to the “medium boulder” size (greater than 512 millimeters). Greater D
84 values in the culvert
reflectthegreaterabundanceoflargematerial.Sorting values are within the range of the natural channel, but the upstream cross section in the culvert has a lower skewness value than the any skewness value in the natural channel. Pebble counts are provided at the end of the site summary.
Predicted conditions
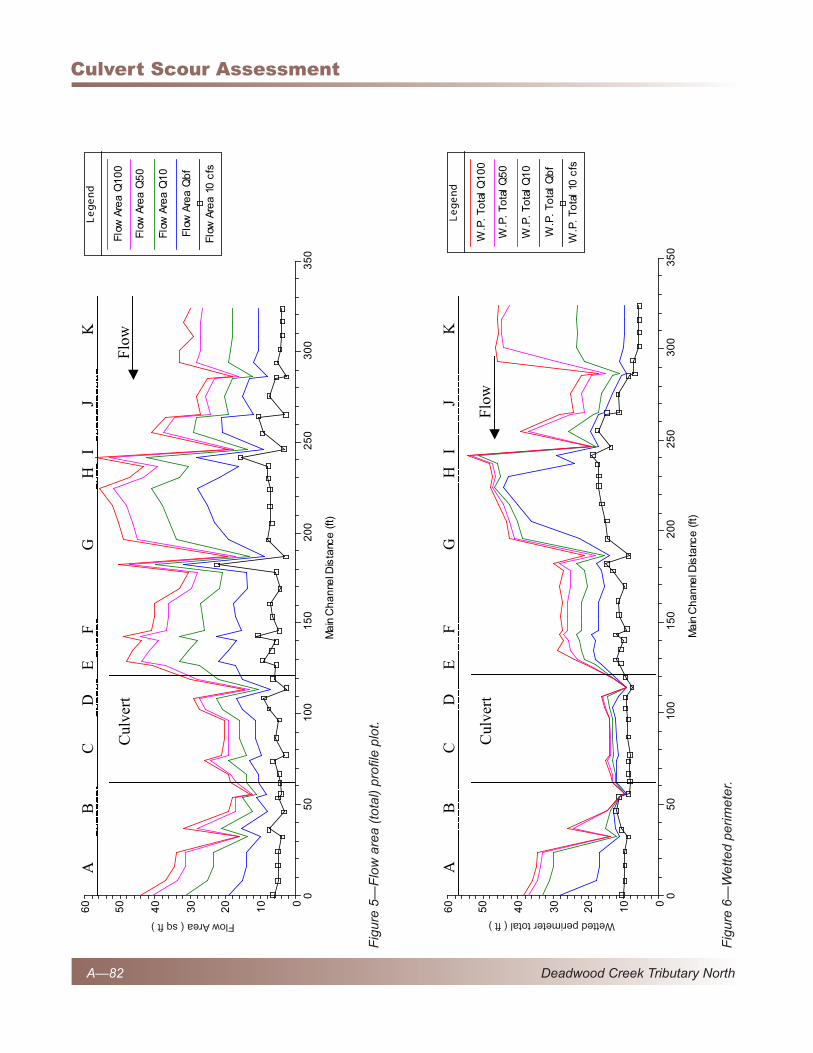
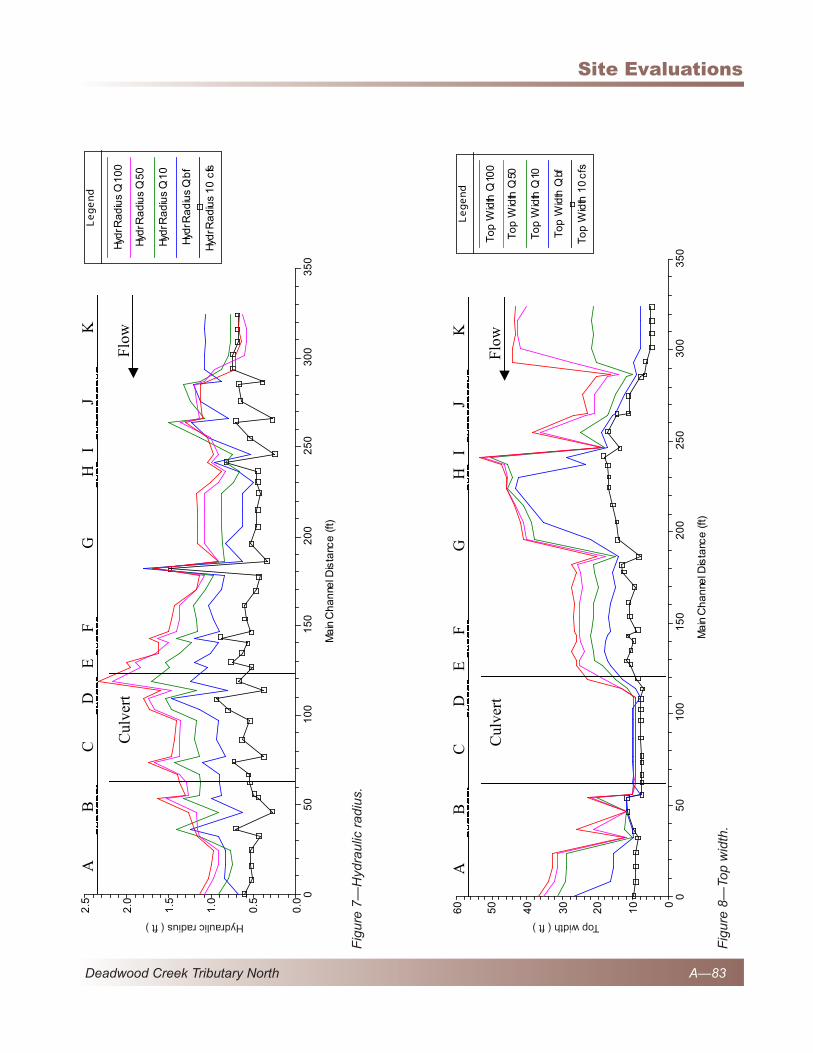
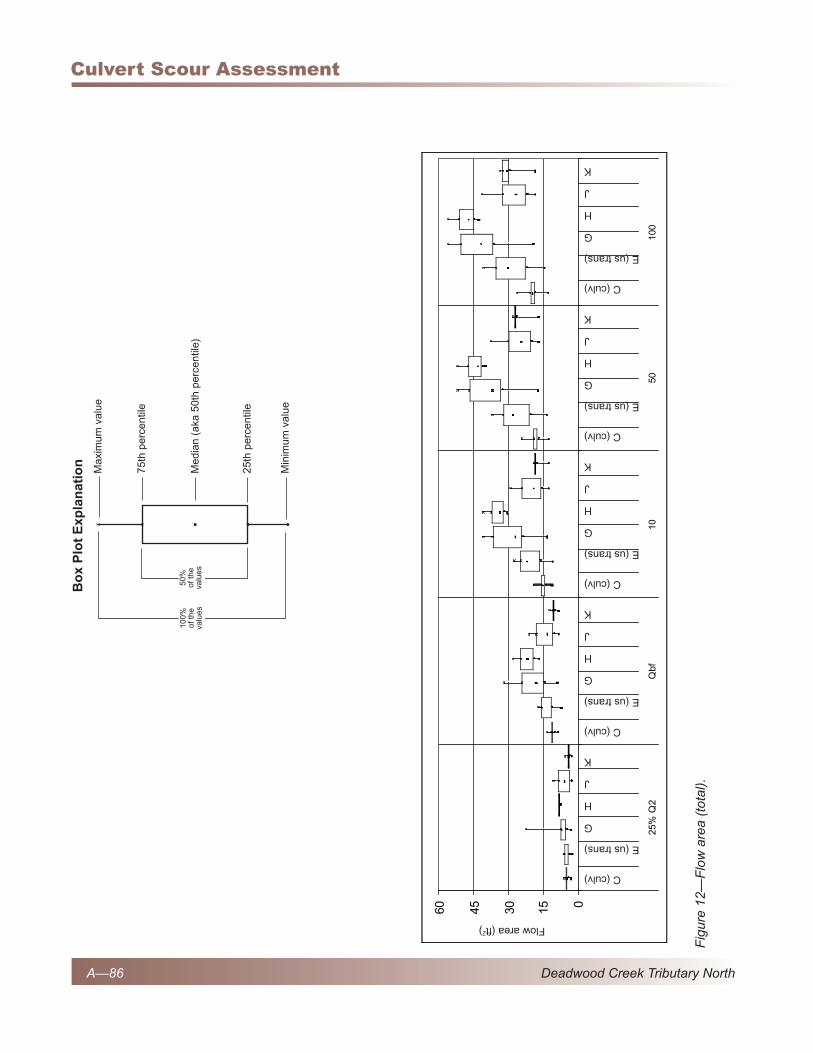
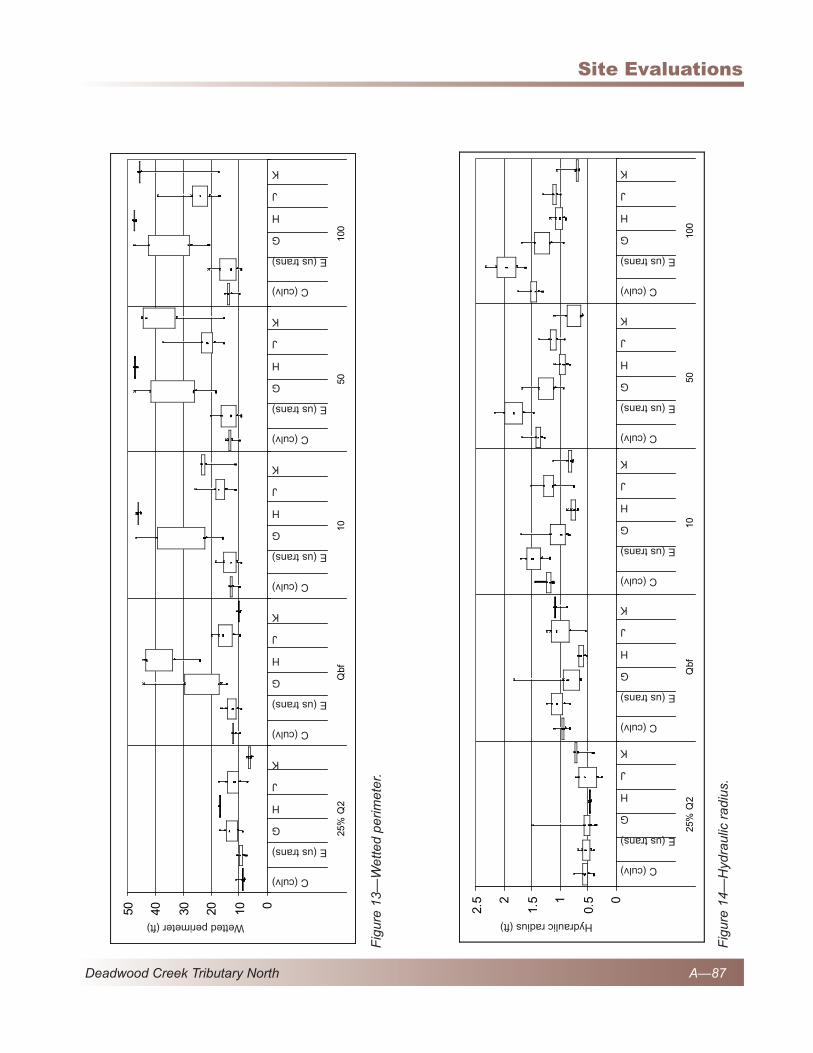
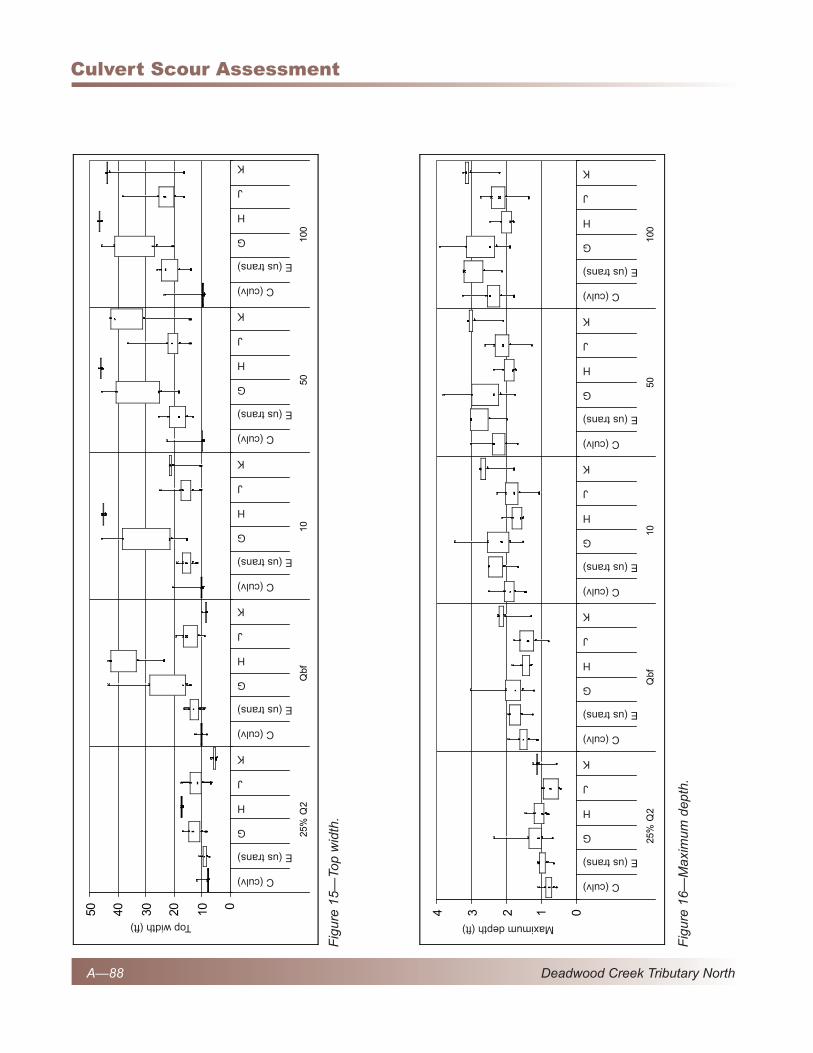
Cross-section characteristics – Cross-sectional flowarea,wettedperimeter,andtopwidthareconsiderablyreducedbytheculvert(figure5,figure6,figure8).Conditionsaresimilaratthe25 percent Q
2 (except for top width) but diverge
beginning at the Q2 and higher. The box plots
indicatethatflowarea,wettedperimeter,topwidth, and width-to-depth are much lower in the culvert when compared to comparable slope segments in the natural channel. Maximum depth and hydraulic radius in the culvert are mostly within the range of that found in comparable
slope segments. Cross-section characteristics in the upstream transition do not vary substantially from comparable slope segments except for hydraulic radius and maximum depth, which indicatesdeeperflowthaninthenaturalchannel,especiallyathigherflows.
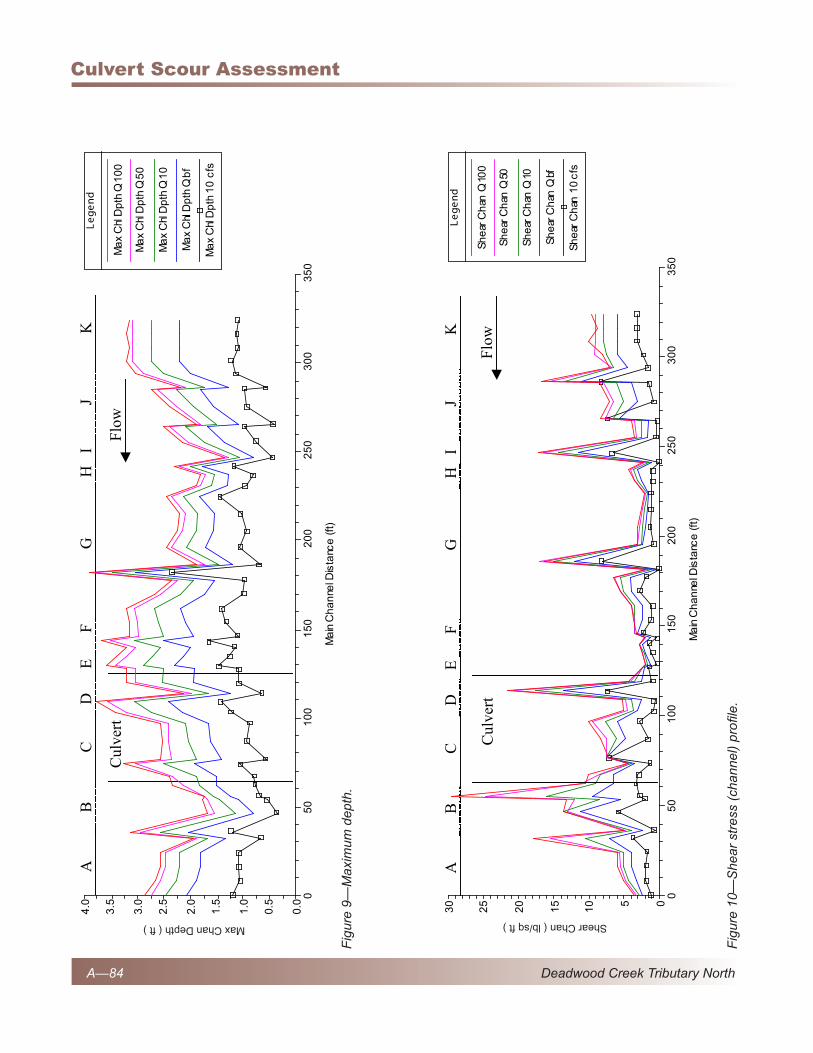
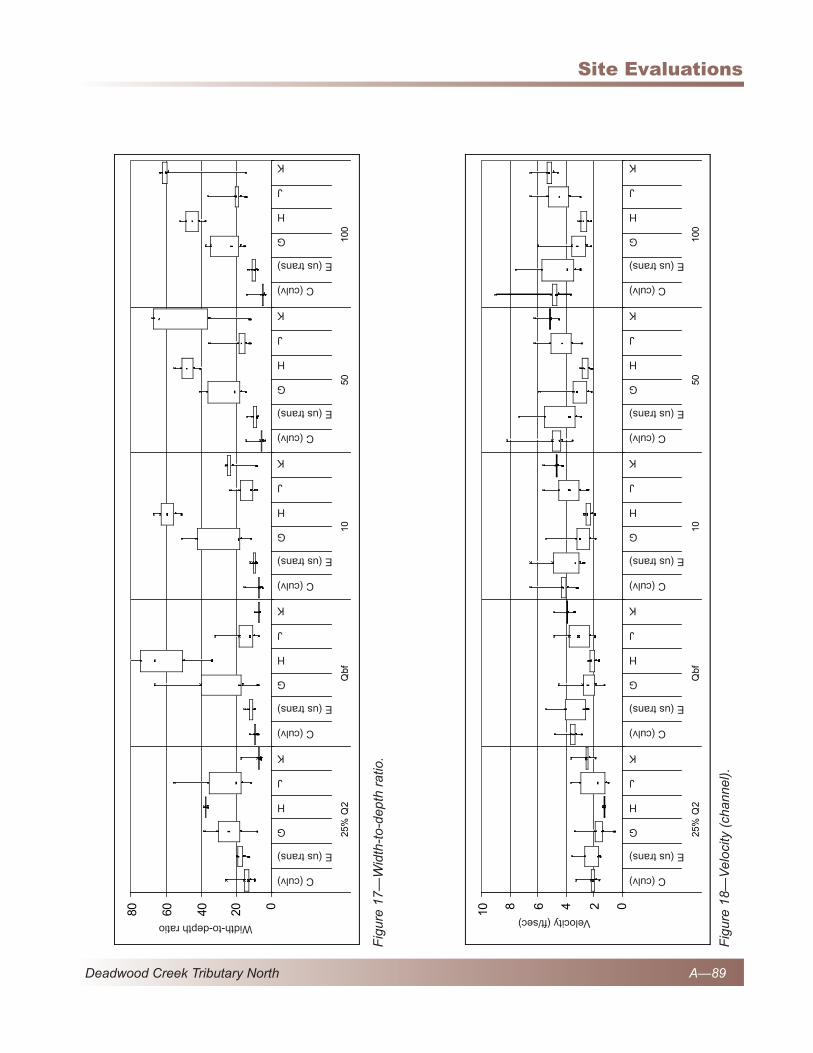
Shear stress – Shear stress appears to increases in the culvert compared to the upstream channel (figure10)andthenincreasesevenmorejustdownstream of the culvert. When compared to comparable slope segments, the culvert shear stress values are mostly within the range of naturalchannelconditions(figure19);however,the maximum value for shear in the culvert is nearly twice the maximum value found in any of the comparable slope segments. The upstream transition segment shear is also within the range of its comparable slope segments.
Excess shear – The excess shear analysis shows that the potential for bed mobilization in the culvert is mostly within the range of that in the naturalchannel(figure20).
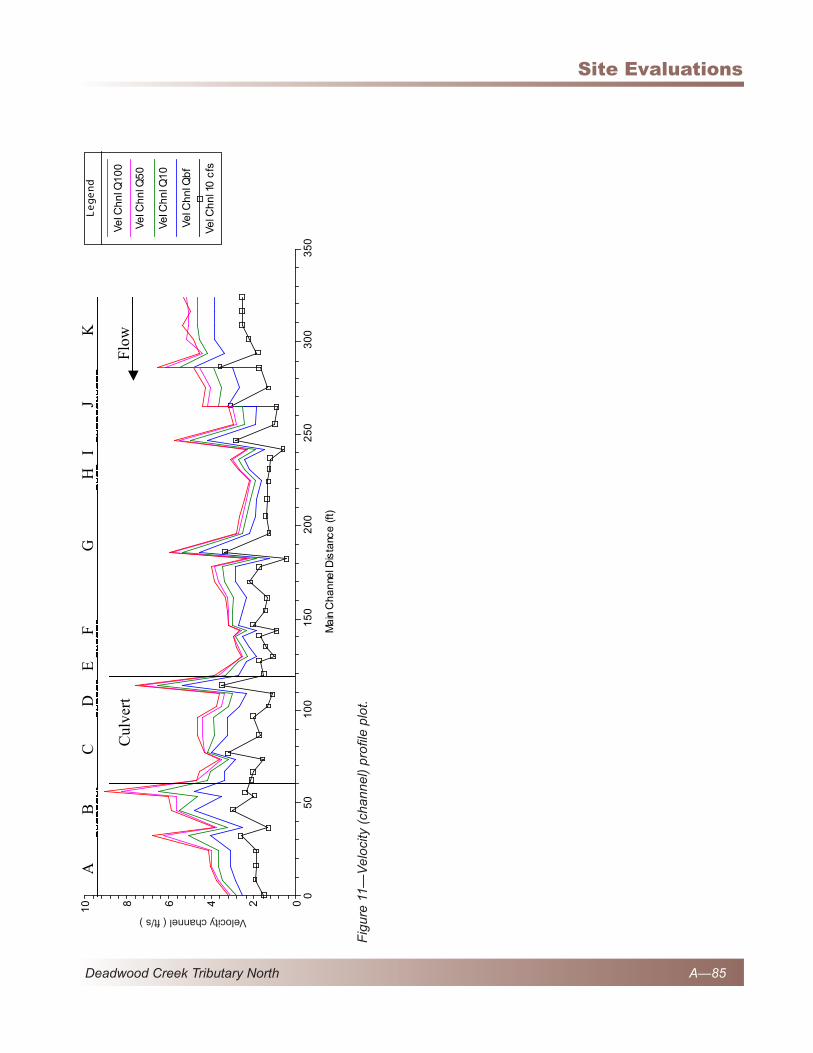
Velocity – Although velocity appears to generally increase within the culvert and just downstream (figure11),theculvertvelocityismostlywithinthe range of velocity of the comparable slope segments(figure18),withtheexceptionbeinga greater maximum velocity in the culvert than in the comparable segments. Velocity in the upstream transition is also mostly within the range of that found in comparable slope segments, except with greater maximum velocities in the transition area.
Scour summary
Theculvertshowsnosignificantbedscour.The only obvious bed adjustment has been the failure of material into the inlet from bank riprap upstream of the inlet. This feature has created
A—75
Site Evaluations
Deadwood Creek Tributary North
a step near the inlet, but has not compromised culvert function or capacity to transmit the modeledfloodflows.Therewasnofootingscourobserved during the survey and residual depths in the culvert are within the range of the natural channel.
Cross-section characteristics indicate there is flowconstrictioncreatedbytheculvert,whichisexpressedasareductioninflowwidth,area, and wetted perimeter. Velocity and shear stress appear to increase at the crossing (andjustdownstream)(figure10,figure11),butthesemetricsarenotsignificantlyoutofrange of channel conditions when compared to comparableslopesegments(figure18,figure19).The only potential exceptions are that maximum shear and velocity values in the culvert are greater than those found in comparable slope segments. The excess shear analysis however, does not show increased potential for bed movement because of the larger culvert D
84.
This site has been affected by a culvert alignment that takes a more direct line to Deadwood Creek than the original stream alignment, resulting in a steeper grade at the crossing and downstream. This steep gradient may be the cause of the higher maximum shear and velocity in the culvert, yet the culvert bed has similar stability as the natural channel due to the placement of coarse material in the culvert during construction.
At the time of the survey, the culvert had likely onlyexperiencedabouta2-yearfloodevent;andtherefore empirical evidence of culvert response tolargerfloodflowsisnotyetavailable.
Itshouldbenotedthattheresultsbasedonhydraulic modeling must be tempered by the steepness of the channel and the associated potential uncertainty with HEC-RAS modeling at such a steep site.
AOP COnDITIOnS
Cross-section complexity – The sum of squared height differences in the culvert cross sections are both within the range of those in the channel cross sections (table 3).
Profile complexity – Vertical sinuosity values in the culvert segments are low compared to the naturalchannel.Thisreflectsthemostlyplane-bed nature of the culvert bed. The upstream and downstream transition segments have greater vertical sinuosity and are more within the range of that found in the channel outside the crossing. The exception is upstream transition segment E, which has higher vertical sinuosity than anything found in the natural channel (table 4).
Depth distribution–Thereissignificantlylesschannel margin habitat in the culvert compared to the channel at the 25-percent Q
2 (table 5).
Habitat units – There is similar habitat unit composition between the culvert and the channel outsidethecrossing(table6).Itshouldbenotedthat the culvert is comprised of only one pool, one riffle,andonestep.
Residual depths – The one residual depth in the culvert is 0.3 feet, which was in the upstream profilesegmentthathasnocomparableslope segment in the representative channel. Nevertheless, the 0.3 feet is within the range of the total population of residual depths from all the representative channel segments, which ranged from0.06to1.3feet(figure21).
Bed material – As mentioned previously under scour conditions, the culvert has more bed material in larger size classes than the natural channel (up to “medium boulders” in the culvert compared to “very large cobbles” in the channel). Theculvertalsohaslessfinematerial,with4to
A—76
culvert Scour Assessment
Deadwood Creek Tributary North
12 percent less than 2 millimeters in the natural channel and 1 to 2 percent less than 2 millimeters in the culvert.
Large woody debris – There was no LWD present in the culvert (table 8). The representative channel had moderate to high LWD abundance. LWD formed steps and scour pools in the channel outside the crossing and played a primary role in habitat unit creation and complexity. Features in the culvert did not mimic the role of wood in the natural channel.
AOP summary
AOP conditions appear less suitable in the culvert when compared to the natural channel upstream. Cross-section complexity values are similar, but thalweg complexity (vertical sinuosity) is less in the culvert. This matches site observations of a uniform, plane-bed channel throughout most of the culvert length (except for the one step near theinlet).Depthdistributionissignificantlylessin the culvert, suggesting that shallow margin habitatneededforfishpassagemaybelimitedin the culvert. Although habitat units and residual pool depths in the culvert are similar to the natural channel, the culvert only has one short pool and one short step and most of the entire pipe is one longriffle,withwall-to-wallflowandnodefinedthalweg.Thislackofcomplexitymayimpairfishpassage. The presence of boulders in the pipe mayprovidevelocityrefugeformigratingfish;however, the coarse angular material and a lack offinesmayincreasethetendencyforsubsurfaceflowduringlow-flowperiods,whichmayobstructfishpassageduringthesummer.
Currently, the steep riprap step downstream of the outlet may not be passable by upstream migratingfish.
DESIgn COnSIDErATIOnS
Theculvertcurrentlyhasnosignificantscourissues. The only bed adjustment (failure of riprap into inlet) may even have served to increase bed complexity and passage conditions. The results indicate that the site should be able to function similarly to the natural channel with respect to scour.
With respect to AOP, conditions in the culvert appear less suitable than the channel outside the crossing. Construction of step sequences in the culvertwouldbemorefavorabletofishpassagethan the current plane bed that provides little velocityrefugeformigratingfish.Nochannelbankswereconstructedintheculvertandflowwas wall-to-wall during the survey. Concentrating flowintoamoredefinedthalwegthroughconstructionofchannelbankswouldaidinfishpassage and would provide banks for terrestrial organism passage. Use of a wider culvert would have provided more ability to provide these features. Construction of step sequences would improve passage in the downstream channel, where upstream passage is likely currently blocked by the steep riprap step.
At a more fundamental level, placement of the crossing more in line with the valley alignment would have avoided steepening of the channel and would have provided a more suitable (i.e., lower)gradientforfishpassage.
A—77
Site Evaluations
Deadwood Creek Tributary North
48
5
49
0
49
5
50
0
50
5
51
0
05
01
00
15
02
00
25
03
00
35
0
Dis
tan
ce
alo
ng
be
d (f
ee
t)
Rela
tive
ele
vati
on (f
eet)
A
B
C
DE
H
J
K
F
G
I
XS 1
0:
Peb
ble
coun
t(ri
ffle)
XS 9
:P
ebbl
e co
unt
(riffl
e)
XS 8
:
Peb
ble
coun
t
(ste
p)XS
5:
Peb
ble
coun
t
(ste
p)
XS 4
:P
ebbl
e co
unt
(riffl
e)
Cul
vert
Rep
rese
ntat
ive C
hann
el
XS 1
:P
ebbl
e co
unt
(riffl
e)
XS 6
XS 3
XS 7
XS 1
1
XS 2
A3
50
.07
1B
23
0.1
13
C4
40
.06
0D
15
0.0
94
E1
40
.03
7F
19
0.0
19
G7
80
.05
6H
14
0.0
33
I9
0.1
08
J4
00
.04
1K
37
0.0
59
Se
gm
en
t S
eg
me
nt
Le
ng
th (
ft)
Se
gm
en
t G
rad
ien
tC
G7
.8%
CJ
2.0
%C
K
1.8
%
Up
str
ea
m T
ran
sit
ion
EJ
9.1
%E
H1
1.5
%
Cu
lve
rt S
eg
me
nt
Re
pre
se
nta
tiv
e
Ch
an
ne
l Se
gm
en
t%
Dif
fere
nc
e in
G
rad
ien
t
Tabl
e 1—
Seg
men
t com
paris
ons
Fig
ure
2—D
eadw
ood
Trib
utar
y N
orth
long
itudi
nal p
rofil
e.
A—78
culvert Scour Assessment
Deadwood Creek Tributary North
Tabl
e 2.
Sum
mar
y of
seg
men
ts u
sed
for
com
paris
ons
Seg
men
t r
ang
e o
f M
ann
ing
’s n
val
ues
1 #
of
mea
sure
d X
Ss
# o
f in
terp
ola
ted
XS
s
C
0.
1232
-0.1
478
3 5
E
0.
1217
-0.1
247
1 2
G
0.
1267
-0.1
360
2 9
H
0.
1359
-0.1
360
1 2
J
0.12
77-0
.135
6 1
6
K
0.
1247
-0.1
277
1 5
1 Obt
aine
d us
ing
equa
tion
from
Jar
rett
(198
4): n
= 0
.39S
0.38
R-0
.16 ,
whe
re S
=st
ream
slo
pe; R
=hy
drau
lic r
adiu
s. J
arre
tt’s
equa
tion
only
ap
plie
d w
ithin
the
follo
win
g ra
nges
: S =
0.0
02 to
0.0
8, R
= 0
.5 ft
to 7
ft. F
or c
ross
sec
tions
out
side
thes
e ra
nges
, n w
as c
ompu
ted
eith
er fr
om a
djac
ent s
ectio
ns th
at fe
ll w
ithin
the
rang
es, u
sing
the
guid
ance
of A
rcem
ent a
nd S
chne
ider
(19
87),
or
from
the
HE
C-R
AS
re
com
men
datio
ns fo
r cu
lver
t mod
elin
g.
Sta
tions
with
dec
imal
val
ues
are
inte
rpol
ated
cro
ss s
ectio
ns p
lace
d al
ong
the
surv
eyed
pro
file.
Fig
ure
3—H
EC
-RA
S p
rofil
e.
05
01
00
15
02
00
25
03
00
35
04
85
49
0
49
5
50
0
50
5
51
0
51
5
Ma
in C
ha
nne
l Dis
tan
ce (
ft)
Elevation (ft)
Le
ge
nd
WS
Q
10
0
WS
Q
50
WS
Q
10
WS
Q
bf
WS
1
0 c
fs
Gro
un
d
11.5
2.5
33.75
4.2
4.6
55.2
5.5
5.75
66.8
7.15*
7.3
7.5
7.75*
88.15*
8.3
8.5
8.625*
8.75*
8.875*
99.125*
9.25
9.5
1010.1
10.4*
10.6
10.85*
1111.0333*
11.0666*
11.1
Elevation (ft)
A—79
Site Evaluations
Deadwood Creek Tributary North
Fig
ure
4—C
ross
-sec
tion
plot
s. O
nly
mea
sure
d cr
oss
sect
ions
are
incl
uded
. Man
ning
’s n
val
ues
are
incl
uded
at t
he to
p of
the
cros
s se
ctio
n. T
he
stat
ioni
ng (
RS
) co
rres
pond
s to
the
stat
ioni
ng o
n th
e H
EC
-RA
S p
rofil
e. G
reen
arr
ows
defin
e th
e in
effe
ctiv
e flo
w a
reas
. Bla
ck a
rrow
s re
pres
ent
poin
ts id
entifi
ed in
the
field
as
the
bank
full
chan
nel b
ound
ary.
Onl
y th
ose
poin
ts id
entifi
ed in
the
field
and
sup
port
ed b
y hy
drau
lic a
nd to
pogr
aphi
c an
alys
es a
re s
how
n be
low
.
010
2030
4050
6050
6
507
508
509
510
511
512
513
514
R
S =
11
Sta
tion
(ft)
Elevation (ft)
Le
ge
nd
WS
Q10
0
WS
Q50
WS
Q10
WS
Qbf
WS
10
cfs
Gro
und
Ban
k S
ta
.124
7. 1 2 4 7
.124
7
1020
3040
5060
7050
4
505
506
507
508
509
510
511
512
R
S =
10
Sta
tion
(ft)
Elevation (ft)
Le
ge
nd
WS
Q10
0
WS
Q50
WS
Q10
WS
Qbf
WS
10
cfs
Gro
und
Ban
k S
ta
.134
1.1
341
.134
1
1020
3040
5060
7050
2
504
506
508
510
R
S =
9
Sta
tion
(ft)
Elevation (ft)
Le
ge
nd
WS
Q1
00
WS
Q5
0
WS
Q1
0
WS
Qb
f
WS
10
cfs
Gro
un
d
Le
vee
Ba
nk
Sta
. 1 3 6
.136
.136
1020
3040
5060
7049
8
499
500
501
502
503
504
505
506
R
S =
8
Sta
tion
(ft)
Elevation (ft)
Le
ge
nd
WS
Q10
0
WS
Q50
WS
Q10
WS
Qbf
WS
10
cfs
Gro
und
Ban
k S
ta
.130
8.1
308
.130
8
Elevation (ft)Elevation (ft)
Elevation (ft)Elevation (ft)
A—80
culvert Scour Assessment
Deadwood Creek Tributary North
Fig
ure
4—C
ross
-sec
tion
plot
s. O
nly
mea
sure
d cr
oss
sect
ions
are
incl
uded
. Man
ning
’s n
val
ues
are
incl
uded
at t
he to
p of
the
cros
s se
ctio
n. T
he
stat
ioni
ng (
RS
) co
rres
pond
s to
the
stat
ioni
ng o
n th
e H
EC
-RA
S p
rofil
e. G
reen
arr
ows
defin
e th
e in
effe
ctiv
e flo
w a
reas
. Bla
ck a
rrow
s re
pres
ent
poin
ts id
entifi
ed in
the
field
as
the
bank
full
chan
nel b
ound
ary.
Onl
y th
ose
poin
ts id
entifi
ed in
the
field
and
sup
port
ed b
y hy
drau
lic a
nd to
pogr
aphi
c an
alys
es a
re s
how
n be
low
. (co
ntin
ued)
-20
-10
010
2030
4050
6049
8
499
500
501
502
503
504
505
506
R
S =
7
Sta
tion
(ft)
Elevation (ft)
Le
ge
nd
WS
Q1
00
WS
Q5
0
WS
Q1
0
WS
Qb
f
WS
10
cfs
Gro
un
d
Ine
ff
Ba
nk
Sta
. 1 2 2 1
.122
1.1
221
-20
-10
010
2030
4050
6049
8
499
500
501
502
503
504
505
506
R
S =
6
Sta
tion
(ft)
Elevation (ft)
Le
ge
nd
WS
Q1
00
WS
Q5
0
WS
Q1
0
WS
Qb
f
WS
10
cfs
Gro
un
d
Ine
ff
Ba
nk
Sta
.121
7.1
217
.121
7
-20
-10
010
2030
4050
6049
6
497
498
499
500
501
502
503
504
R
S =
5
Sta
tion
(ft)
Elevation (ft)
Le
ge
nd
WS
Q10
0
WS
Q50
WS
Q10
WS
Qbf
WS
10
cfs
Gro
und
Ban
k S
ta
. 0 1 9
. 1 4 7 8
. 0 1 9
-20
-10
010
2030
4050
6049
4
495
496
497
498
499
500
501
502
R
S =
4
Sta
tion
(ft)
Elevation (ft)
Le
ge
nd
WS
Q10
0
WS
Q50
WS
Q10
WS
Qbf
WS
10
cfs
Gro
und
Ban
k S
ta
. 0 1 9
. 1 4 7 8
. 0 1 9
Elevation (ft)
Elevation (ft)Elevation (ft)
Elevation (ft)
A—81
Site Evaluations
Deadwood Creek Tributary North
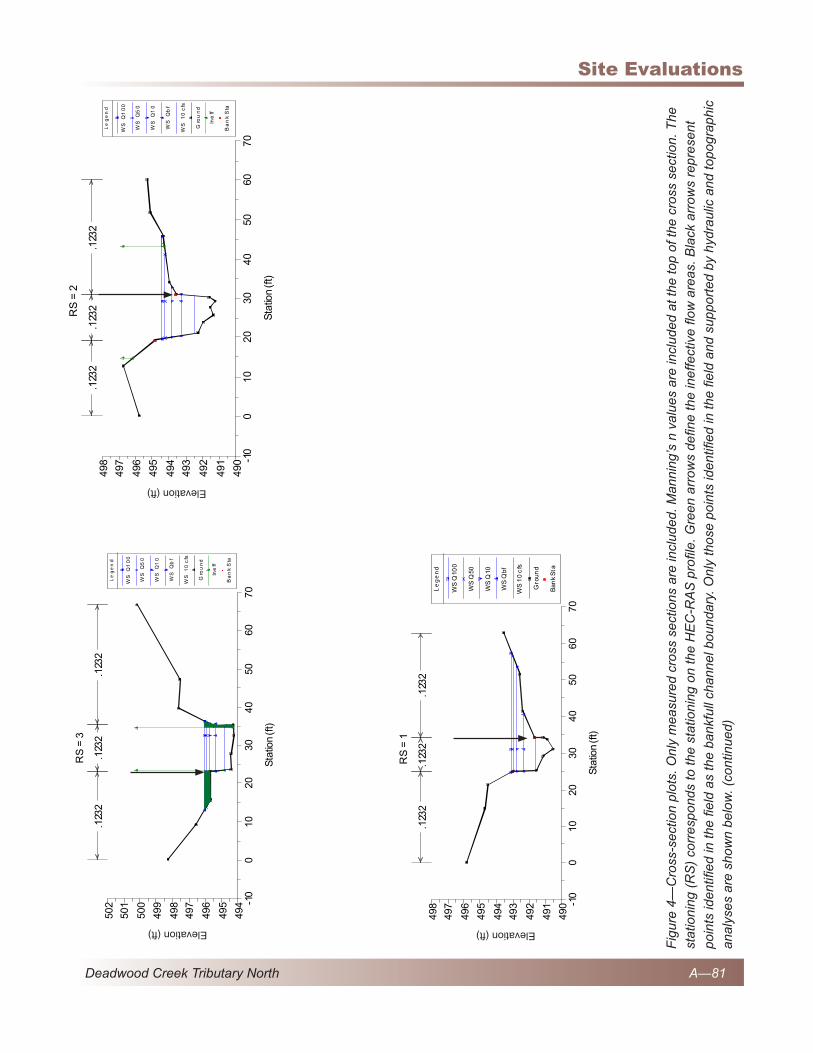
Fig
ure
4—C
ross
-sec
tion
plot
s. O
nly
mea
sure
d cr
oss
sect
ions
are
incl
uded
. Man
ning
’s n
val
ues
are
incl
uded
at t
he to
p of
the
cros
s se
ctio
n. T
he
stat
ioni
ng (
RS
) co
rres
pond
s to
the
stat
ioni
ng o
n th
e H
EC
-RA
S p
rofil
e. G
reen
arr
ows
defin
e th
e in
effe
ctiv
e flo
w a
reas
. Bla
ck a
rrow
s re
pres
ent
poin
ts id
entifi
ed in
the
field
as
the
bank
full
chan
nel b
ound
ary.
Onl
y th
ose
poin
ts id
entifi
ed in
the
field
and
sup
port
ed b
y hy
drau
lic a
nd to
pogr
aphi
c an
alys
es a
re s
how
n be
low
. (co
ntin
ued)
-10
010
2030
4050
6070
494
495
496
497
498
499
500
501
502
R
S =
3
Sta
tion
(ft)
Elevation (ft)
Le
ge
nd
WS
Q1
00
WS
Q5
0
WS
Q1
0
WS
Qb
f
WS
10
cfs
Gro
un
d
Ine
ff
Ba
nk
Sta
.123
2.1
232
.123
2
-10
010
2030
4050
6070
490
491
492
493
494
495
496
497
498
R
S =
2
Sta
tion
(ft)
Elevation (ft)
Le
ge
nd
WS
Q1
00
WS
Q5
0
WS
Q1
0
WS
Qb
f
WS
10
cfs
Gro
un
d
Ine
ff
Ba
nk
Sta
.123
2.1
232
.123
2
-10
010
2030
4050
6070
490
491
492
493
494
495
496
497
498
R
S =
1
Sta
tion
(ft)
Elevation (ft)
Le
ge
nd
WS
Q10
0
WS
Q50
WS
Q10
WS
Qbf
WS
10
cfs
Gro
und
Ban
k S
ta
.123
2.1
232
.123
2
Elevation (ft)Elevation (ft)
Elevation (ft)
A—82
culvert Scour Assessment
Deadwood Creek Tributary North
Fig
ure
5—F
low
are
a (t
otal
) pr
ofile
plo
t.
Fig
ure
6—W
ette
d pe
rimet
er.
05
01
00
15
02
00
25
03
00
35
00
10
20
30
40
50
60
Ma
in C
ha
nne
l Dis
tanc
e (
ft)
Flow Area (sq ft)
Le
ge
nd
Flo
w A
rea
Q1
00
Flo
w A
rea
Q5
0
Flo
w A
rea
Q1
0
Flo
w A
rea
Qb
f
Flo
w A
rea
10
cfs
05
01
00
15
02
00
25
03
00
35
00
10
20
30
40
50
60
Ma
in C
ha
nne
l Dis
tanc
e (
ft)
W.P. Total (ft)
Le
ge
nd
W.P
. T
ota
l Q
10
0
W.P
. T
ota
l Q
50
W.P
. T
ota
l Q
10
W.P
. T
ota
l Q
bf
W.P
. T
ota
l 10
cfs
Cul
vert
A
B
C
D
E
F G
H
I
J K
Flow
Cul
vert
A
B
C
D
E
F G
H
I
J K
Flow
Flow Area ( sq ft ) Wetted perimeter total ( ft )
A—83
Site Evaluations
Deadwood Creek Tributary North
Fig
ure
7—H
ydra
ulic
rad
ius.
Fig
ure
8—To
p w
idth
.
05
01
00
15
02
00
25
03
00
35
00
.0
0.5
1.0
1.5
2.0
2.5
Ma
in C
ha
nne
l Dis
tanc
e (
ft)
Hydr Radius (ft)
Le
ge
nd
Hyd
r Ra
diu
s Q
10
0
Hyd
r Ra
diu
s Q
50
Hyd
r Ra
diu
s Q
10
Hyd
r Ra
diu
s Q
bf
Hyd
r Ra
diu
s 1
0 c
fs
05
01
00
15
02
00
25
03
00
35
00
10
20
30
40
50
60
Ma
in C
ha
nne
l Dis
tanc
e (
ft)
Top Width (ft)
Le
ge
nd
To
p W
idth
Q10
0
To
p W
idth
Q50
To
p W
idth
Q10
To
p W
idth
Qbf
To
p W
idth
10
cfs
Cul
vert
A
B
C
D
E
F G
H
I
J K
Flow
Cul
vert
A
B
C
D
E
F G
H
I
J K
Flow
Hydraulic radius ( ft ) Top width ( ft )
A—84
culvert Scour Assessment
Deadwood Creek Tributary North
Fig
ure
9—M
axim
um d
epth
.
Fig
ure
10—
She
ar s
tres
s (c
hann
el)
profi
le.
Cul
vert
A
B
C
D
E
F G
H
I
J K
Flow
05
01
00
15
02
00
25
03
00
35
00
.0
0.5
1.0
1.5
2.0
2.5
3.0
3.5
4.0
Ma
in C
ha
nne
l Dis
tanc
e (
ft)
Max Chl Dpth (ft)
Le
ge
nd
Ma
x C
hl D
pth
Q1
00
Ma
x C
hl D
pth
Q5
0
Ma
x C
hl D
pth
Q1
0
Ma
x C
hl D
pth
Qb
f
Ma
x C
hl D
pth
10
cfs
05
01
00
15
02
00
25
03
00
35
005
10
15
20
25
30
Ma
in C
ha
nne
l Dis
tanc
e (
ft)
Shear Chan (lb/sq ft)
Le
ge
nd
Sh
ear
Ch
an Q
100
Sh
ear
Ch
an Q
50
Sh
ear
Ch
an Q
10
Sh
ear
Ch
an Q
bf
Sh
ear
Ch
an 1
0 c
fs
Cul
vert
A
B
C
D
E
F G
H
I
J K
Flow
Max Chan Depth ( ft ) Shear Chan ( lb/sq ft )
A—85
Site Evaluations
Deadwood Creek Tributary North
Fig
ure
11—
Vel
ocity
(ch
anne
l) pr
ofile
plo
t.
05
01
00
15
02
00
25
03
00
35
002468
10
Ma
in C
ha
nne
l Dis
tanc
e (
ft)
Vel Chnl (ft/s)
Le
ge
nd
Ve
l Ch
nl Q
10
0
Ve
l Ch
nl Q
50
Ve
l Ch
nl Q
10
Ve
l Ch
nl Q
bf
Ve
l Ch
nl 1
0 c
fs
Cul
vert
A
B
C
D
E
F G
H
I
J K
Flow
Velocity channel ( ft/s )
A—86
culvert Scour Assessment
Deadwood Creek Tributary North
Fig
ure
12—
Flo
w a
rea
(tot
al).
015304560
C (
culv
)
E (
us tr
ans)
GH
JK
C (
culv
) E (
us tr
ans)
GH
JK
C (
culv
) E (
us tr
ans)
GH
JK
C (
culv
) E (
us tr
ans)
GH
JK
C (
culv
) E (
us tr
ans)
GH
JK
25%
Q2
Qbf
1050
100
Flow
Are
a (f
t2)
C (culv)
E (us trans)
G
H
J
K
C (culv)
E (us trans)
G
H
J
K
C (culv)
E (us trans)
G
H
J
K
C (culv)
E (us trans)
G
H
J
K
C (culv)
E (us trans)
G
H
J
K
Flow area (ft2)
Bo
x P
lot
Exp
lan
atio
n
Max
imum
val
ue
75th
per
cent
ile
Med
ian
(aka
50t
h pe
rcen
tile)
25th
per
cent
ile
Min
imum
val
ue
100%
of th
eva
lues
50%
of th
eva
lues
A—87
Site Evaluations
Deadwood Creek Tributary North
Fig
ure
13—
Wet
ted
perim
eter
.
Fig
ure
14—
Hyd
raul
ic r
adiu
s.
01020304050
C (
culv
)
E (
us tr
ans)
GH
JK
C (
culv
) E (
us tr
ans)
GH
JK
C (
culv
) E (
us tr
ans)
GH
JK
C (
culv
) E (
us tr
ans)
GH
JK
C (
culv
) E (
us tr
ans)
GH
JK
25%
Q2
Qbf
1050
100
Wet
ted
Perim
eter
(ft)
C (culv)
E (us trans)
G
H
J
K
C (culv)
E (us trans)
G
H
J
K
C (culv)
E (us trans)
G
H
J
K
C (culv)
E (us trans)
G
H
J
K
C (culv)
E (us trans)
G
H
J
K
Wetted perimeter (ft)
0
0.51
1.52
2.5
C (
culv
)
E (
us tr
ans)
GH
JK
C (
culv
) E (
us tr
ans)
GH
JK
C (
culv
) E (
us tr
ans)
GH
JK
C (
culv
) E (
us tr
ans)
GH
JK
C (
culv
) E (
us tr
ans)
GH
JK
25%
Q2
Qbf
1050
100
Hyd
raul
ic R
adiu
s (f
t)
C (culv)
E (us trans)
G
H
J
K
Hydraulic radius (ft)
C (culv)
E (us trans)
G
H
J
K
C (culv)
E (us trans)
G
H
J
K
C (culv)
E (us trans)
G
H
J
K
C (culv)
E (us trans)
G
H
J
K
A—88
culvert Scour Assessment
Deadwood Creek Tributary North
Fig
ure
15 —
Top
wid
th.
Fig
ure
16—
Max
imum
dep
th.
01020304050
C (
culv
)
E (
us tr
ans)
GH
JK
C (
culv
) E (
us tr
ans)
GH
JK
C (
culv
) E (
us tr
ans)
GH
JK
C (
culv
) E (
us tr
ans)
GH
JK
C (
culv
) E (
us tr
ans)
GH
JK
25%
Q2
Qbf
1050
100
Top
Wid
th (f
t)
01234
C (
culv
) E (
us tr
ans)
GH
JK
C (
culv
) E (
us tr
ans)
GH
JK
C (
culv
) E (
us tr
ans)
GH
JK
C (
culv
) E (
us tr
ans)
GH
JK
C (
culv
) E (
us tr
ans)
GH
JK
25%
Q2
Qbf
1050
100
Max
imum
Dep
th (f
t)
Top width (ft) Maximum depth (ft)
C (culv)
E (us trans)
G
H
J
K
C (culv)
E (us trans)
G
H
J
K
C (culv)
E (us trans)
G
H
J
K
C (culv)
E (us trans)
G
H
J
K
C (culv)
E (us trans)
G
H
J
K
C (culv)
E (us trans)
G
H
J
K
C (culv)
E (us trans)
G
H
J
K
C (culv)
E (us trans)
G
H
J
K
C (culv)
E (us trans)
G
H
J
K
C (culv)
E (us trans)
G
H
J
K
A—89
Site Evaluations
Deadwood Creek Tributary North
Fig
ure
17—
Wid
th-t
o-de
pth
ratio
.
Fig
ure
18—
Vel
ocity
(ch
anne
l).
020406080
C (
culv
)
E (
us tr
ans)
GH
JK
C (
culv
) E (
us tr
ans)
GH
JK
C (
culv
) E (
us tr
ans)
GH
JK
C (
culv
) E (
us tr
ans)
GH
JK
C (
culv
) E (
us tr
ans)
GH
JK
25%
Q2
Qbf
1050
100
Wid
th-t
o-de
pth
Rat
io
0246810
C (
culv
)
E (
us tr
ans)
GH
JK
C (
culv
) E (
us tr
ans)
GH
JK
C (
culv
) E (
us tr
ans)
GH
JK
C (
culv
) E (
us tr
ans)
GH
JK
C (
culv
) E (
us tr
ans)
GH
JK
25%
Q2
Qbf
1050
100
Velo
city
(ft/
sec)
Velocity (ft/sec)Width-to-depth ratio
C (culv)
E (us trans)
G
H
J
K
C (culv)
E (us trans)
G
H
J
K
C (culv)
E (us trans)
G
H
J
K
C (culv)
E (us trans)
G
H
J
K
C (culv)
E (us trans)
G
H
J
K
C (culv)
E (us trans)
G
H
J
K
C (culv)
E (us trans)
G
H
J
K
C (culv)
E (us trans)
G
H
J
K
C (culv)
E (us trans)
G
H
J
K
C (culv)
E (us trans)
G
H
J
K
A—90
culvert Scour Assessment
Deadwood Creek Tributary North
Fig
ure
19—
She
ar s
tres
s (c
hann
el).
Fig
ure
20—
Exc
ess
shea
r st
ress
.
0
102030
C (
culv
) E (
us tr
ans)
GH
JK
C (
culv
) E (
us tr
ans)
GH
JK
C (
culv
) E (
us tr
ans)
GH
JK
C (
culv
) E (
us tr
ans)
GH
JK
C (
culv
) E (
us tr
ans)
GH
JK
25%
Q2
Qbf
1050
100
Shea
r Str
ess
(lbs/
ft2)
02468
101214
020
4060
8010
012
0
Dis
char
ge
(cfs
)
Exce
ss S
hear
(Ap
plie
d / t
crit)
US
Ch
an
ne
l (U
S p
eb
ble
co
un
t) -
riff
le
US
Ch
an
ne
l (M
id p
eb
ble
co
un
t) -
riff
le
US
Ch
an
ne
l (D
S p
eb
ble
co
un
t) -
ste
p
Cu
lve
rt (
US
pe
bb
le c
ou
nt)
- s
tep
Cu
lve
rt (
DS
pe
bb
le c
ou
nt)
- r
iffle
Exc
ess
shea
r st
ress
is th
e ch
anne
l she
ar d
ivid
ed b
y th
e cr
itica
l she
ar fo
r be
d en
trai
nmen
t of t
he D
84 p
artic
le s
ize.
Val
ues
of e
xces
s sh
ear
grea
ter
than
1 in
dica
te
bed
mov
emen
t for
the
D84
par
ticle
siz
e.
Shear stress (lbs/ft2)
C (culv)
E (us trans)
G
H
J
K
C (culv)
E (us trans)
G
H
J
K
C (culv)
E (us trans)
G
H
J
K
C (culv)
E (us trans)
G
H
J
K
C (culv)
E (us trans)
G
H
J
K
Excess shear (applied / tcrit)
A—91
Site Evaluations
Deadwood Creek Tributary North
Table 3—Sum of squared height difference
reach XS Location unit type Sum of squared Within range of height difference channel conditions?
Culvert US Step 0.05 Yes
DS Riffle 0.03 Yes
Upstream US Riffle 0.02
Middle Riffle 0.03
DS Step 0.20
Table 4—Vertical sinuosity
Segment Location vertical Sinuosity (ft/ft)
A DS channel 1.003
B DS transition 1.010
C Culvert 1.004
D Culvert 1.001
E US transition 1.032
F US transition 1.003
G US channel 1.014
H US channel 1.001
I USchannel 1.015
J US channel 1.011
K US channel 1.008
Table 5—Depth distribution
reach XS Location 25% Q2 Within range of
channel conditions?
Culvert US 0 No
DS 0 No
Upstream US 4
Middle 20
DS 6
A—92
culvert Scour Assessment
Deadwood Creek Tributary North
Table 6—Habitat unit composition
Percent of surface area
Reach Pool Glide Riffle Step
Culvert 15% 0% 73% 11%
Upstream Channel 22% 0% 73% 5%
Figure 21—Residual depths.
Table 7—Bed material sorting and skewness
Within range Within range XS unit of channel of channel reach Location Type Sorting conditions? Skewness conditions?
Culvert US Step 2.15 Yes 0.01 No
DS Riffle 1.88 Yes 0.28 Yes
Upstream US Riffle 2.26 0.36
Middle Riffle 2.28 0.19
DS Step 1.89 0.45
Downstream Riffle 1.91 0.42
0.0
0.2
0.4
0.6
0.8
1.0
1.2
1.4
Segment ASegment B:
DS
TransitionSegment C:
CulvertSegment D:
CulvertSegment E:
US
Transition Segment F Segment G Segment HSegmentI Segment J Segment K
Residual depth (ft)
Seg
men
t A
Seg
men
t BD
ST
rans
ition
Seg
men
t CC
ulve
rt
Seg
men
t DC
ulve
rt
Seg
men
t EU
S T
rans
ition
Seg
men
t F
Seg
men
t G
Seg
men
t H
SegmentI
Seg
men
t J
Seg
men
t K
Res
idua
l dep
th (
ft)
A—93
Site Evaluations
Deadwood Creek Tributary North
Table 8—Large woody debris
reach Pieces/Channel Width
Culvert 0
Upstream 1.7
View upstream through culvert. View downstream towards culvert inlet.
Upstream reference reach—upstream pebble count, Upstream reference reach – downstream pebble riffle. count, riffle.
Terminology:
US = Upstream
DS = Downstream
RR = Reference reach
XS = Cross section
A—94
culvert Scour Assessment
Deadwood Creek Tributary North
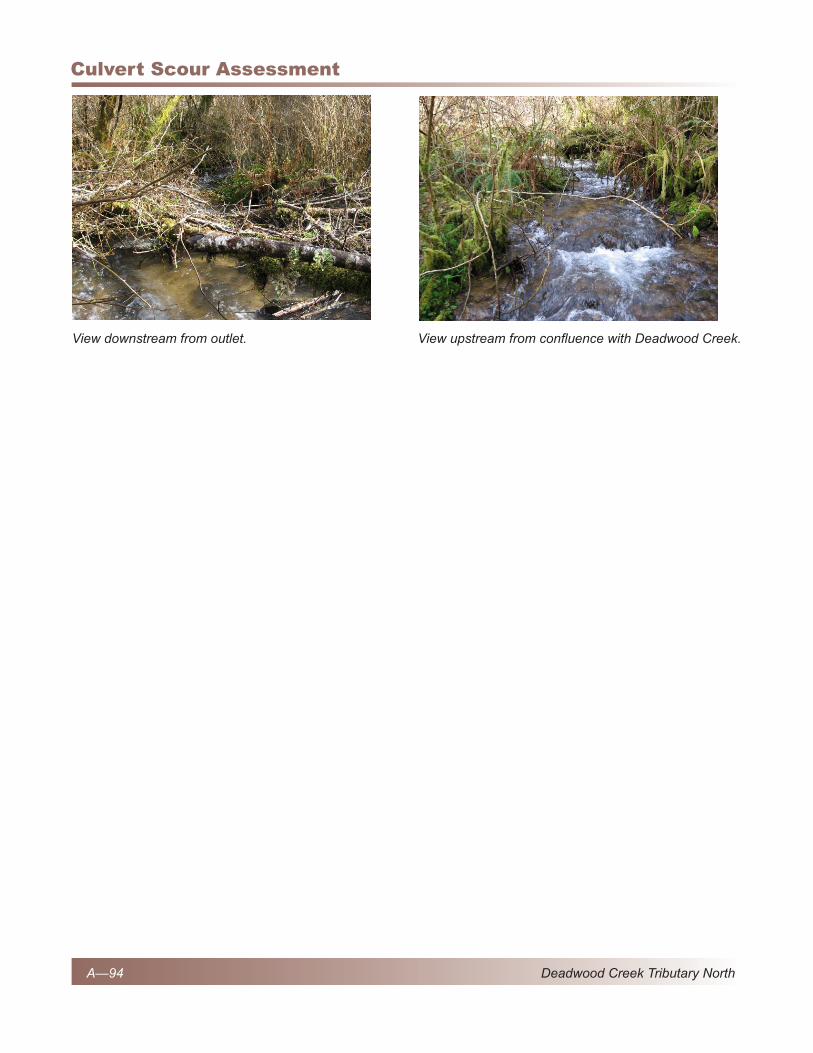
View downstream from outlet. View upstream from confluence with Deadwood Creek.
A—95
Site Evaluations
Deadwood Creek Tributary North
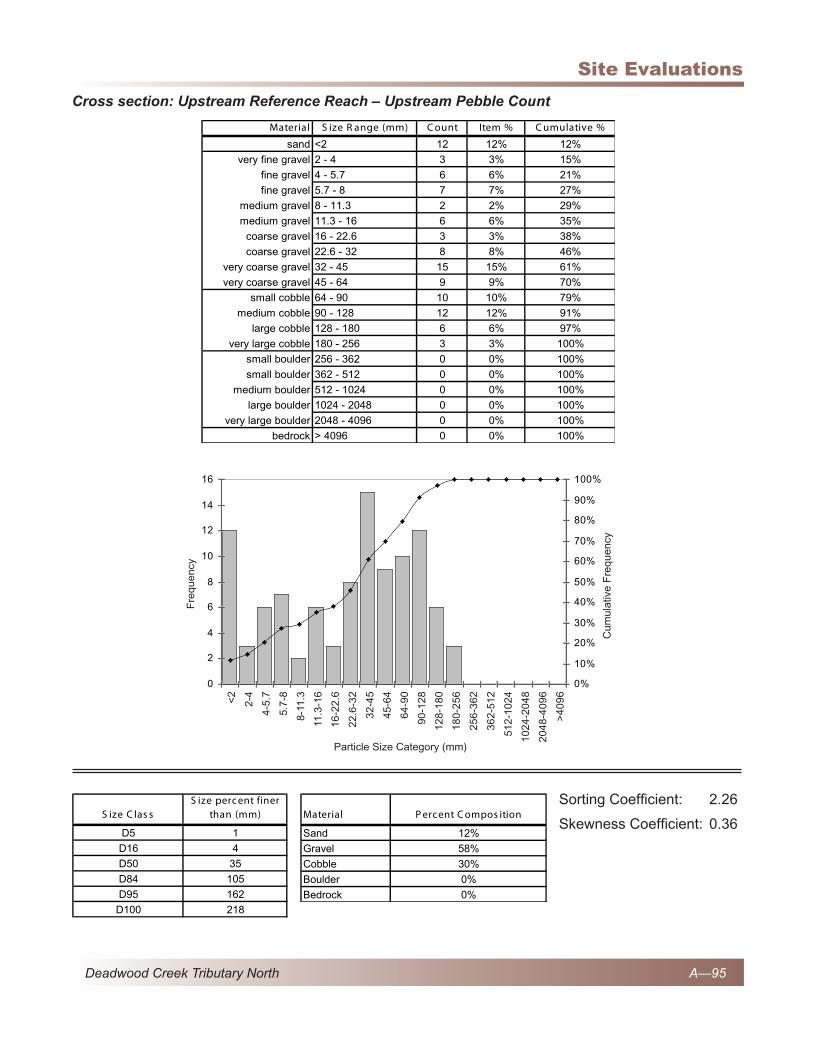
Cross section: Upstream Reference Reach – Upstream Pebble Count
SortingCoefficient: 2.26
SkewnessCoefficient: 0.36
Material S ize R ange (mm) C ount Item % C umulative %
sand <2 12 12% 12%
very fine gravel 2 - 4 3 3% 15%
fine gravel 4 - 5.7 6 6% 21%
fine gravel 5.7 - 8 7 7% 27%
medium gravel 8 - 11.3 2 2% 29%
medium gravel 11.3 - 16 6 6% 35%
coarse gravel 16 - 22.6 3 3% 38%
coarse gravel 22.6 - 32 8 8% 46%
very coarse gravel 32 - 45 15 15% 61%
very coarse gravel 45 - 64 9 9% 70%
small cobble 64 - 90 10 10% 79%
medium cobble 90 - 128 12 12% 91%
large cobble 128 - 180 6 6% 97%
very large cobble 180 - 256 3 3% 100%
small boulder 256 - 362 0 0% 100%
small boulder 362 - 512 0 0% 100%
medium boulder 512 - 1024 0 0% 100%
large boulder 1024 - 2048 0 0% 100%
very large boulder 2048 - 4096 0 0% 100%
bedrock > 4096 0 0% 100%
0
2
4
6
8
10
12
14
16
<22 - 4
4 - 5.75.7 - 88 - 11.3
11.3 - 1616 - 22.622.6 - 3232 - 4545 - 6464 - 90
90 - 128128 - 180180 - 256256 - 362362 - 512
512 - 10241024 - 20482048 - 4096
> 4096
0%
10%
20%
30%
40%
50%
60%
70%
80%
90%
100%
<2
2-4
4-5
.7
5.7
-8
8-1
1.3
11.3
-16
16-2
2.6
22.6
-32
32
-45
45
-64
64
-90
90-1
28
128-1
80
180-2
56
256-3
62
362-5
12
512-1
024
1024-2
048
2048-4
096
>4096
S ize C las sS ize perc ent finer
than (mm)
D5 1
D16 4
D50 35
D84 105
D95 162
D100 218
Material P erc ent C ompos ition
Sand 12%
Gravel 58%
Cobble 30%
Boulder 0%
Bedrock 0%
Fre
quency
Particle Size Category (mm)
Cum
ulat
ive
Fre
quen
cy
A—96
culvert Scour Assessment
Deadwood Creek Tributary North
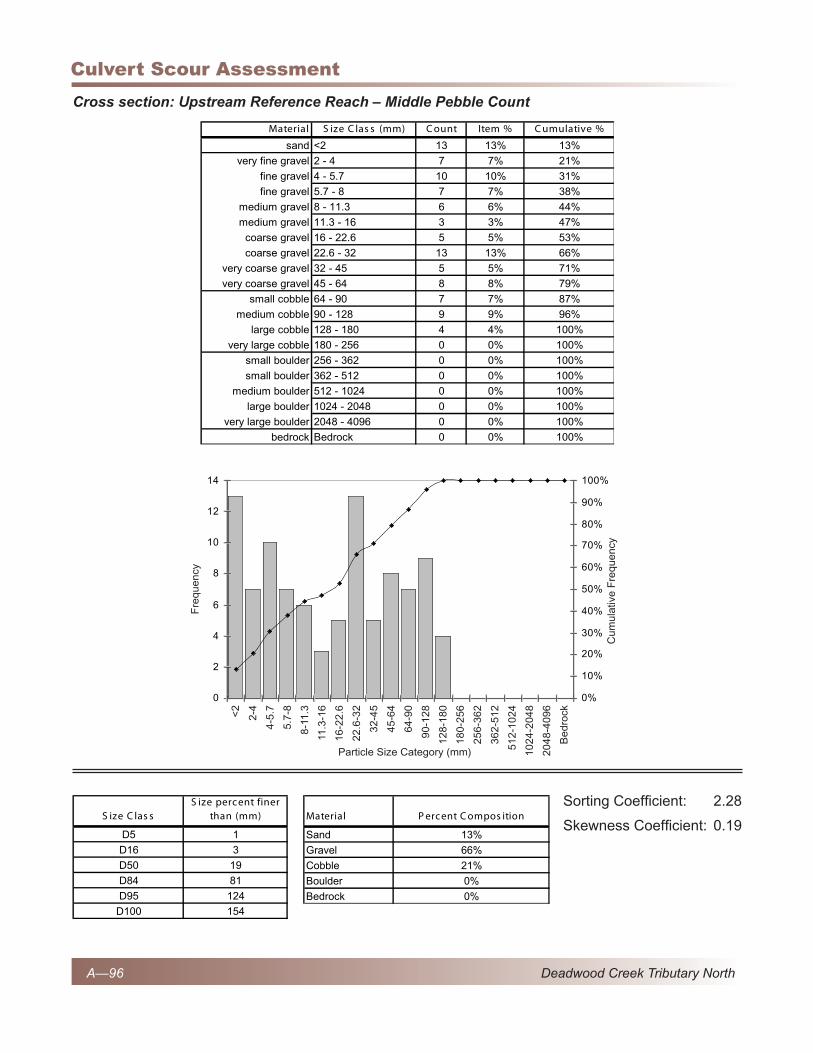
Cross section: Upstream Reference Reach – Middle Pebble Count
SortingCoefficient: 2.28
SkewnessCoefficient: 0.19
Material S ize C las s (mm) C ount Item % C umulative %
sand <2 13 13% 13%
very fine gravel 2 - 4 7 7% 21%
fine gravel 4 - 5.7 10 10% 31%
fine gravel 5.7 - 8 7 7% 38%
medium gravel 8 - 11.3 6 6% 44%
medium gravel 11.3 - 16 3 3% 47%
coarse gravel 16 - 22.6 5 5% 53%
coarse gravel 22.6 - 32 13 13% 66%
very coarse gravel 32 - 45 5 5% 71%
very coarse gravel 45 - 64 8 8% 79%
small cobble 64 - 90 7 7% 87%
medium cobble 90 - 128 9 9% 96%
large cobble 128 - 180 4 4% 100%
very large cobble 180 - 256 0 0% 100%
small boulder 256 - 362 0 0% 100%
small boulder 362 - 512 0 0% 100%
medium boulder 512 - 1024 0 0% 100%
large boulder 1024 - 2048 0 0% 100%
very large boulder 2048 - 4096 0 0% 100%
bedrock Bedrock 0 0% 100%
0
2
4
6
8
10
12
14
<22 - 4
4 - 5.75.7 - 88 - 11.3
11.3 - 1616 - 22.622.6 - 3232 - 4545 - 6464 - 90
90 - 128128 - 180180 - 256256 - 362362 - 512
512 - 10241024 - 20482048 - 4096
Bedrock
0%
10%
20%
30%
40%
50%
60%
70%
80%
90%
100%
<2
2-4
4-5
.7
5.7
-8
8-1
1.3
11.3
-16
16-2
2.6
22.6
-32
32-4
5
45-6
4
64-9
0
90-1
28
128-1
80
180-2
56
256-3
62
362-5
12
512-1
02
4
1024-2
048
2048-4
096
Bedro
ck
S ize C las sS ize perc ent finer
than (mm)
D5 1
D16 3
D50 19
D84 81
D95 124
D100 154
Material P erc ent C ompos ition
Sand 13%
Gravel 66%
Cobble 21%
Boulder 0%
Bedrock 0%
Fre
quency
Particle Size Category (mm)
Cum
ulat
ive
Fre
quen
cy
A—97
Site Evaluations
Deadwood Creek Tributary North
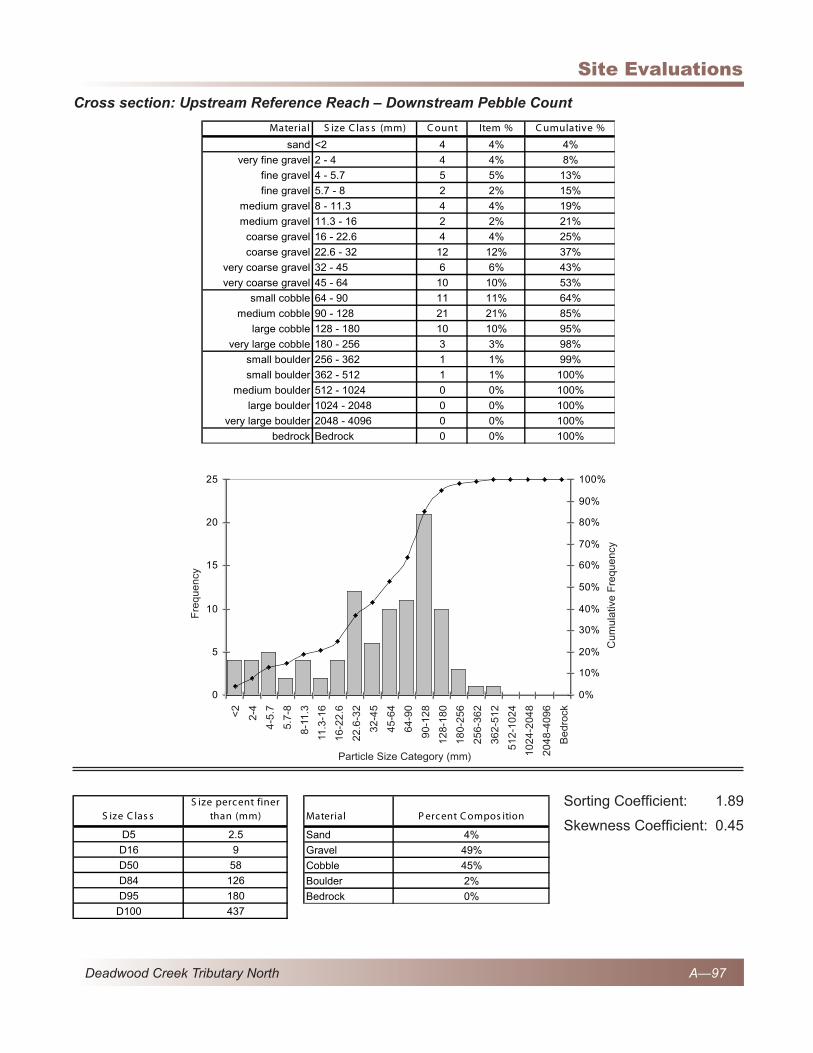
Cross section: Upstream Reference Reach – Downstream Pebble Count
SortingCoefficient: 1.89
SkewnessCoefficient: 0.45
Material S ize C las s (mm) C ount Item % C umulative %
sand <2 4 4% 4%
very fine gravel 2 - 4 4 4% 8%
fine gravel 4 - 5.7 5 5% 13%
fine gravel 5.7 - 8 2 2% 15%
medium gravel 8 - 11.3 4 4% 19%
medium gravel 11.3 - 16 2 2% 21%
coarse gravel 16 - 22.6 4 4% 25%
coarse gravel 22.6 - 32 12 12% 37%
very coarse gravel 32 - 45 6 6% 43%
very coarse gravel 45 - 64 10 10% 53%
small cobble 64 - 90 11 11% 64%
medium cobble 90 - 128 21 21% 85%
large cobble 128 - 180 10 10% 95%
very large cobble 180 - 256 3 3% 98%
small boulder 256 - 362 1 1% 99%
small boulder 362 - 512 1 1% 100%
medium boulder 512 - 1024 0 0% 100%
large boulder 1024 - 2048 0 0% 100%
very large boulder 2048 - 4096 0 0% 100%
bedrock Bedrock 0 0% 100%
0
5
10
15
20
25
<22 - 4
4 - 5.75.7 - 88 - 11.3
11.3 - 1616 - 22.622.6 - 3232 - 4545 - 6464 - 90
90 - 128128 - 180180 - 256256 - 362362 - 512
512 - 10241024 - 20482048 - 4096
Bedrock
0%
10%
20%
30%
40%
50%
60%
70%
80%
90%
100%
<2
2-4
4-5
.7
5.7
-8
8-1
1.3
11.3
-16
16-2
2.6
22.6
-32
32-4
5
45-6
4
64-9
0
90-1
28
128-1
80
180-2
56
256-3
62
362-5
12
512-1
02
4
1024-2
048
2048-4
096
Bedro
ck
S ize C las sS ize perc ent finer
than (mm)
D5 2.5
D16 9
D50 58
D84 126
D95 180
D100 437
Material P erc ent C ompos ition
Sand 4%
Gravel 49%
Cobble 45%
Boulder 2%
Bedrock 0%
Fre
quency
Particle Size Category (mm)
Cum
ulat
ive
Fre
quen
cy
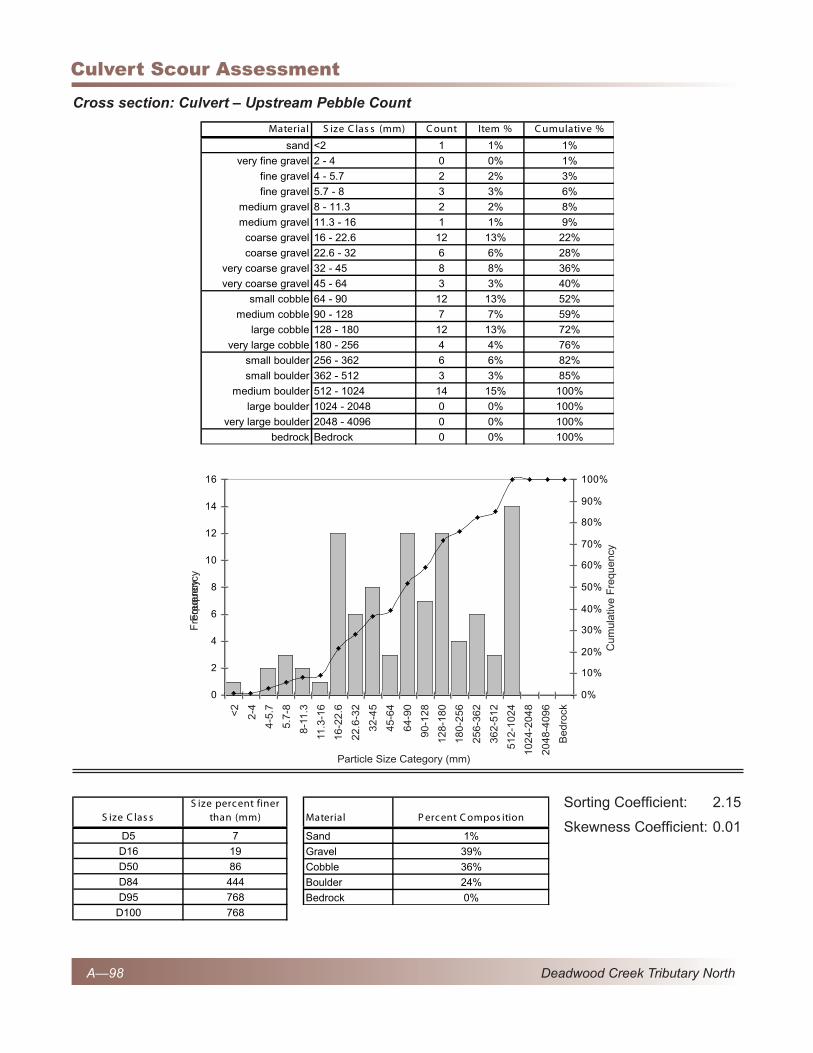
A—98
culvert Scour Assessment
Deadwood Creek Tributary North
Cross section: Culvert – Upstream Pebble Count
SortingCoefficient: 2.15
SkewnessCoefficient:0.01
0
2
4
6
8
10
12
14
16
<22 - 4
4 - 5.75.7 - 88 - 11.3
11.3 - 1616 - 22.622.6 - 3232 - 4545 - 6464 - 90
90 - 128128 - 180180 - 256256 - 362362 - 512
512 - 10241024 - 20482048 - 4096
Bedrock
0%
10%
20%
30%
40%
50%
60%
70%
80%
90%
100%
Material S ize C las s (mm) C ount Item % C umulative %
sand <2 1 1% 1%
very fine gravel 2 - 4 0 0% 1%
fine gravel 4 - 5.7 2 2% 3%
fine gravel 5.7 - 8 3 3% 6%
medium gravel 8 - 11.3 2 2% 8%
medium gravel 11.3 - 16 1 1% 9%
coarse gravel 16 - 22.6 12 13% 22%
coarse gravel 22.6 - 32 6 6% 28%
very coarse gravel 32 - 45 8 8% 36%
very coarse gravel 45 - 64 3 3% 40%
small cobble 64 - 90 12 13% 52%
medium cobble 90 - 128 7 7% 59%
large cobble 128 - 180 12 13% 72%
very large cobble 180 - 256 4 4% 76%
small boulder 256 - 362 6 6% 82%
small boulder 362 - 512 3 3% 85%
medium boulder 512 - 1024 14 15% 100%
large boulder 1024 - 2048 0 0% 100%
very large boulder 2048 - 4096 0 0% 100%
bedrock Bedrock 0 0% 100%
Fre
quency
<2
2-4
4-5
.7
5.7
-8
8-1
1.3
11.3
-16
16-2
2.6
22.6
-32
32-4
5
45-6
4
64-9
0
90-1
28
128-1
80
180-2
56
256-3
62
362-5
12
512-1
02
4
1024-2
048
2048-4
096
Bedro
ck
S ize C las sS ize perc ent finer
than (mm)
D5 7
D16 19
D50 86
D84 444
D95 768
D100 768
Material P erc ent C ompos ition
Sand 1%
Gravel 39%
Cobble 36%
Boulder 24%
Bedrock 0%
Fre
quency
Particle Size Category (mm)
Cum
ulat
ive
Fre
quen
cy
A—99
Site Evaluations
Deadwood Creek Tributary North
Cross section: Culvert – Downstream Pebble Count
SortingCoefficient: 1.88
SkewnessCoefficient:0.28
Material S ize C las s (mm) C ount Item % C umulative %
sand <2 2 2% 2%
very fine gravel 2 - 4 4 4% 6%
fine gravel 4 - 5.7 2 2% 8%
fine gravel 5.7 - 8 6 6% 14%
medium gravel 8 - 11.3 4 4% 18%
medium gravel 11.3 - 16 8 8% 26%
coarse gravel 16 - 22.6 5 5% 31%
coarse gravel 22.6 - 32 9 9% 40%
very coarse gravel 32 - 45 5 5% 45%
very coarse gravel 45 - 64 13 13% 58%
small cobble 64 - 90 10 10% 68%
medium cobble 90 - 128 12 12% 80%
large cobble 128 - 180 11 11% 91%
very large cobble 180 - 256 9 9% 100%
small boulder 256 - 362 0 0% 100%
small boulder 362 - 512 0 0% 100%
medium boulder 512 - 1024 0 0% 100%
large boulder 1024 - 2048 0 0% 100%
very large boulder 2048 - 4096 0 0% 100%
bedrock Bedrock 0 0% 100%
0
2
4
6
8
10
12
14
<22 - 4
4 - 5.75.7 - 88 - 11.3
11.3 - 1616 - 22.622.6 - 3232 - 4545 - 6464 - 90
90 - 128128 - 180180 - 256256 - 362362 - 512
512 - 10241024 - 20482048 - 4096
Bedrock
0%
10%
20%
30%
40%
50%
60%
70%
80%
90%
100%
Fre
quency
<2
2-4
4-5
.7
5.7
-8
8-1
1.3
11.3
-16
16-2
2.6
22.6
-32
32
-45
45
-64
64
-90
90-1
28
128-1
80
180-2
56
256-3
62
362-5
12
512-1
024
1024-2
048
2048-4
096
Bedro
ck
S ize C las sS ize perc ent finer
than (mm)
D5 4
D16 10
D50 52
D84 147
D95 214
D100 218
Material P erc ent C ompos ition
Sand 2%
Gravel 56%
Cobble 42%
Boulder 0%
Bedrock 0%
Fre
quency
Particle Size Category (mm)
Cum
ulat
ive
Fre
quen
cy
A—100
culvert Scour Assessment
Deadwood Creek Tributary North
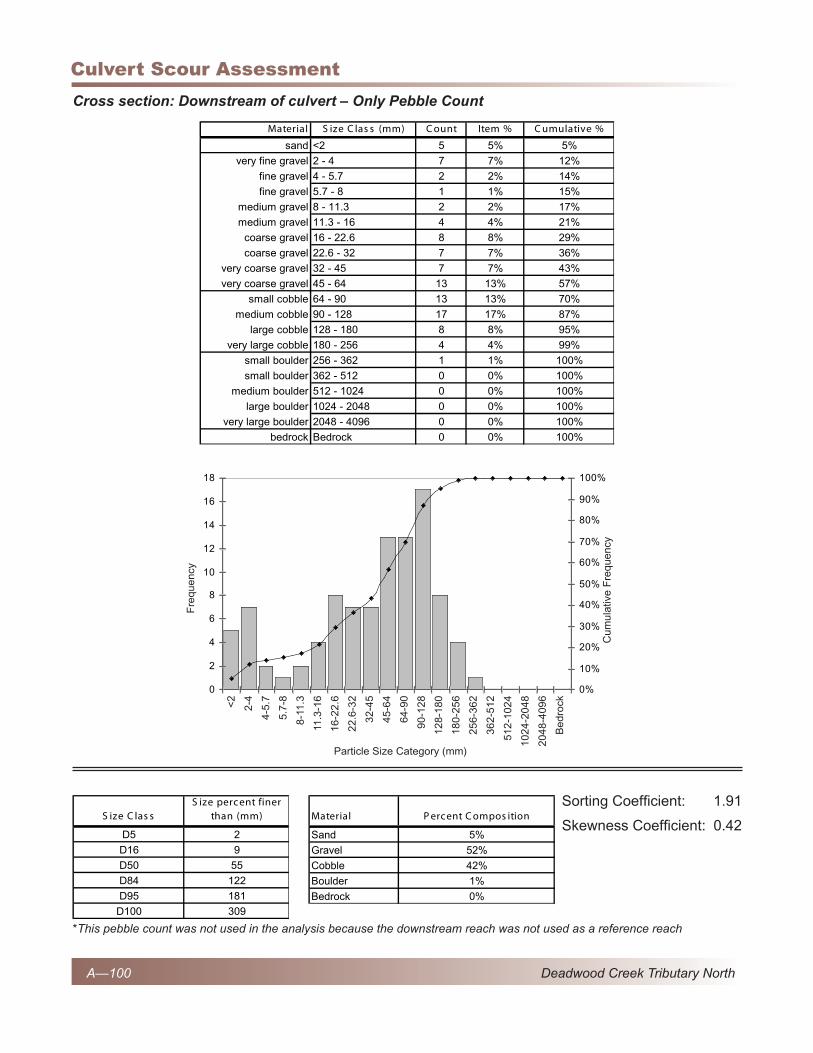
Cross section: Downstream of culvert – Only Pebble Count
SortingCoefficient: 1.91
SkewnessCoefficient: 0.42
Material S ize C las s (mm) C ount Item % C umulative %
sand <2 5 5% 5%
very fine gravel 2 - 4 7 7% 12%
fine gravel 4 - 5.7 2 2% 14%
fine gravel 5.7 - 8 1 1% 15%
medium gravel 8 - 11.3 2 2% 17%
medium gravel 11.3 - 16 4 4% 21%
coarse gravel 16 - 22.6 8 8% 29%
coarse gravel 22.6 - 32 7 7% 36%
very coarse gravel 32 - 45 7 7% 43%
very coarse gravel 45 - 64 13 13% 57%
small cobble 64 - 90 13 13% 70%
medium cobble 90 - 128 17 17% 87%
large cobble 128 - 180 8 8% 95%
very large cobble 180 - 256 4 4% 99%
small boulder 256 - 362 1 1% 100%
small boulder 362 - 512 0 0% 100%
medium boulder 512 - 1024 0 0% 100%
large boulder 1024 - 2048 0 0% 100%
very large boulder 2048 - 4096 0 0% 100%
bedrock Bedrock 0 0% 100%
*This pebble count was not used in the analysis because the downstream reach was not used as a reference reach
0
2
4
6
8
10
12
14
16
18
<22 - 4
4 - 5.75.7 - 88 - 11.3
11.3 - 1616 - 22.622.6 - 3232 - 4545 - 6464 - 90
90 - 128128 - 180180 - 256256 - 362362 - 512
512 - 10241024 - 20482048 - 4096
Bedrock
0%
10%
20%
30%
40%
50%
60%
70%
80%
90%
100%
<2
2-4
4-5
.7
5.7
-8
8-1
1.3
11.3
-16
16-2
2.6
22.6
-32
32
-45
45
-64
64
-90
90-1
28
128-1
80
180-2
56
256-3
62
362-5
12
512-1
024
1024-2
048
2048-4
096
Bedro
ck
S ize C las sS ize perc ent finer
than (mm)
D5 2
D16 9
D50 55
D84 122
D95 181
D100 309
Material P erc ent C ompos ition
Sand 5%
Gravel 52%
Cobble 42%
Boulder 1%
Bedrock 0%
Fre
quency
Particle Size Category (mm)
Cum
ulat
ive
Fre
quen
cy