Embed Size (px)
Citation preview
Culture Report 2012
Northern Territory
March 2012
Prepared by the National Centre for Culture and Recreation Statistics, Australian Bureau of Statistics, for the Statistics Working Group.
ii
Contents
Introduction ................................................................................................................ iii
Summary .................................................................................................................... iv
1. Cultural attendance and participation ................................................................ 1
2. Employment, work and volunteers in culture ..................................................... 7
3. Children, young people and the arts ................................................................ 14
4. Indigenous participation in the arts .................................................................. 20
5. People born overseas and the arts .................................................................. 26
6. Household expenditure on culture ................................................................... 28
7. Economic activity ............................................................................................. 30
8. Museums and art galleries ............................................................................... 37
9. Libraries ........................................................................................................... 39
10. Cultural funding by government and business ................................................. 41
11. The performing arts ......................................................................................... 46
12. Cinema, film and video .................................................................................... 48
13. Sources of data about culture .......................................................................... 49
APPENDIX 1: Detailed occupation and industry employment tables ....................... 52
iii
Introduction
This report prepared by the National Centre for Culture and Recreation Statistics of the Australian Bureau of Statistics (ABS) provides the Northern Territory Department of Natural Resources, Environment and the Arts with a summary of data for the cultural sector in the Northern Territory (NT).
Information is obtained from various annual and periodic ABS national reports, some of which are produced with the assistance of the Statistics Working Group, as well as the Australia Council.
In some cases, the information has been augmented with Northern Territory-specific data not published in the national reports, and with information from other sources where relevant.
Material is updated as new reports are published and new data become available. It is hoped that the information is a useful starting point for researchers and others interested in this profile of the arts in the Northern Territory.
NOTE
In the report, the Northern Territory is often compared with the whole of Australia (e.g. tables may show a column ‘Percentage in NT').
To put this in context:
According to the 2006 Census, the population of the Northern Territory was 192,898 while the population of Australia was 19,855,288. Therefore, 1% of Australia's population lived in NT.
The material in this report has been prepared for the Northern Territory Department of Natural Resources, Environment and the Arts by the National Centre for Culture and Recreation Statistics of the Australian Bureau of Statistics.
iv
Summary
Attendance and participation
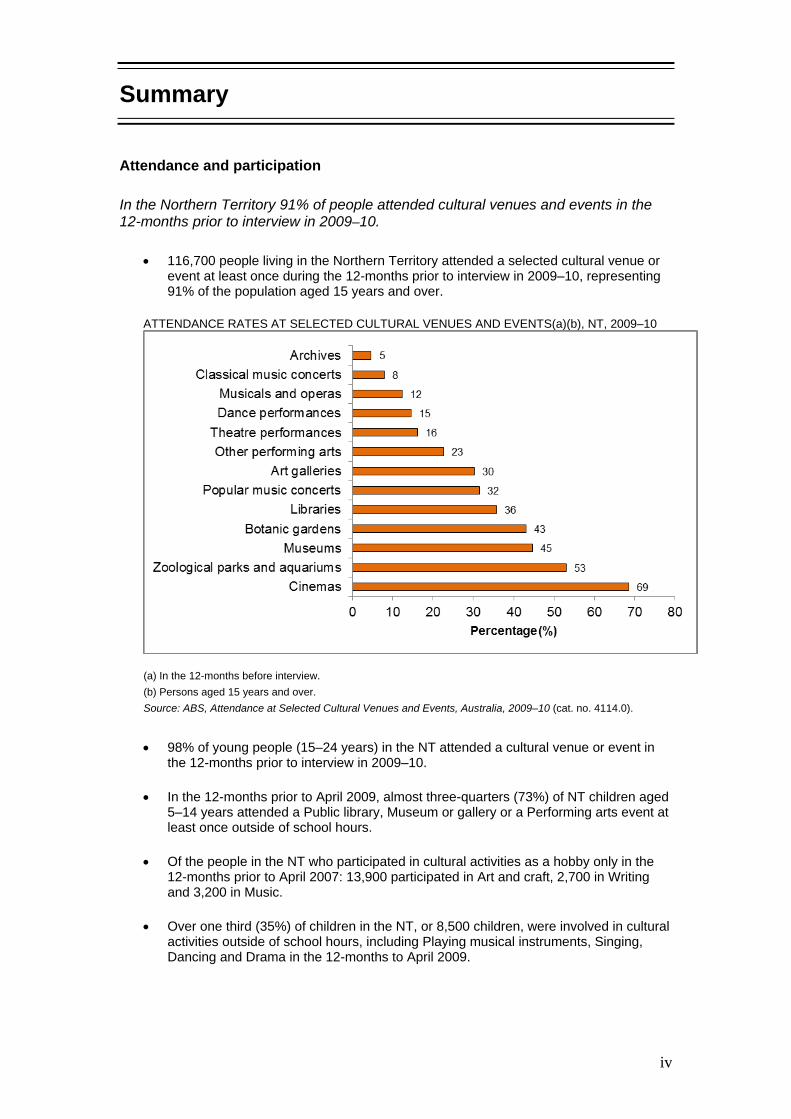
In the Northern Territory 91% of people attended cultural venues and events in the 12-months prior to interview in 2009–10.
116,700 people living in the Northern Territory attended a selected cultural venue or event at least once during the 12-months prior to interview in 2009–10, representing 91% of the population aged 15 years and over.
ATTENDANCE RATES AT SELECTED CULTURAL VENUES AND EVENTS(a)(b), NT, 2009–10
(a) In the 12-months before interview.
(b) Persons aged 15 years and over.
Source: ABS, Attendance at Selected Cultural Venues and Events, Australia, 2009–10 (cat. no. 4114.0).
98% of young people (15–24 years) in the NT attended a cultural venue or event in the 12-months prior to interview in 2009–10.
In the 12-months prior to April 2009, almost three-quarters (73%) of NT children aged 5–14 years attended a Public library, Museum or gallery or a Performing arts event at least once outside of school hours.
Of the people in the NT who participated in cultural activities as a hobby only in the 12-months prior to April 2007: 13,900 participated in Art and craft, 2,700 in Writing and 3,200 in Music.
Over one third (35%) of children in the NT, or 8,500 children, were involved in cultural activities outside of school hours, including Playing musical instruments, Singing, Dancing and Drama in the 12-months to April 2009.
v
4,100 adults (aged 18 years and over) in the NT undertook volunteer work in an Arts or Heritage organisation in the 12 months prior to interview in 2010, equating to 8% of the volunteer population (3% of the total adult population).
Employment and work
In the Northern Territory 31,800 people were involved in a culture or leisure activity in 2007.
28% of all people aged 15 years and over living in the Northern Territory undertook
some paid or unpaid work in culture and leisure activities in the 12-months prior to interview in April 2007, totalling 31,800 people. Of these, 41% received payment for their work.
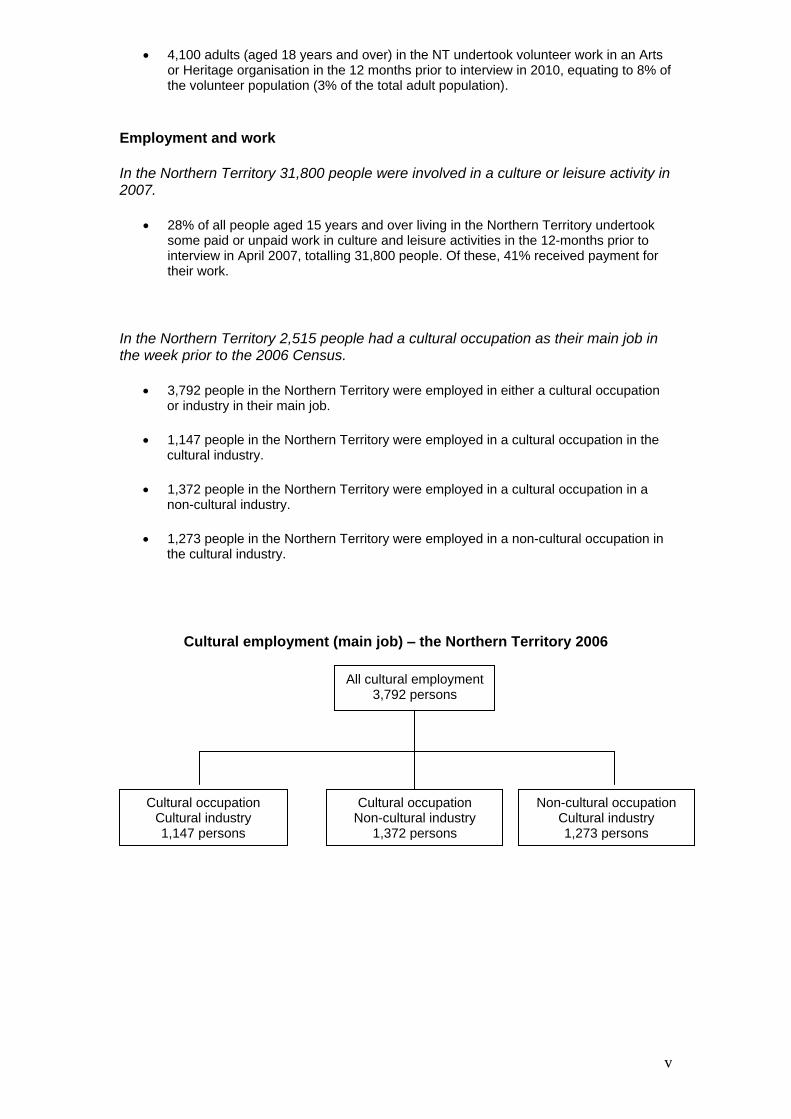
In the Northern Territory 2,515 people had a cultural occupation as their main job in the week prior to the 2006 Census.
3,792 people in the Northern Territory were employed in either a cultural occupation
or industry in their main job.
1,147 people in the Northern Territory were employed in a cultural occupation in the cultural industry.
1,372 people in the Northern Territory were employed in a cultural occupation in a non-cultural industry.
1,273 people in the Northern Territory were employed in a non-cultural occupation in the cultural industry.
Cultural employment (main job) – the Northern Territory 2006
Non-cultural occupation Cultural industry 1,273 persons
All cultural employment 3,792 persons
Cultural occupation Cultural industry 1,147 persons
Cultural occupation Non-cultural industry
1,372 persons
vi
Indigenous arts and culture
Two-fifths (40%) of Indigenous people living in the Northern Territory participated in at least one Indigenous creative arts activity in 2008.
493 Indigenous people in the Northern Territory were employed in a cultural occupation as their main job in 2006, representing 4% of all employed Indigenous people in the Northern Territory.
2,900 Indigenous people in the Northern Territory visited a cultural heritage institution (Museum, library or art gallery) at least once in the three months prior to being interviewed in 2008, while 3,700 attended Movies, theatres or concerts.
16,700 Indigenous people in the Northern Territory aged 15 years and over participated in at least one Indigenous creative arts activity (including Art and craft; Music, dance or theatre; and Writing or telling stories) in the 12-months prior to interview in 2008. This equated to 40% of the Northern Territory Indigenous population.
Cultural spending
In the Northern Territory household expenditure on cultural goods and services was $148m in 2009–10, averaging $43.50 a week.
Of that expenditure Northern Territory households spent most on:
Televisions and home entertainment systems $25m ($7.36 per week)
Books $25m ($7.27 per week)
Pay TV fees $22m ($6.58 per week)
Cultural industries
Northern Territory museums and art galleries generated income of $9.6m in 2007–08.
436 actively trading businesses in the Northern Territory were in a cultural industry at the start of the 2008–09 financial year. The largest numbers of businesses were in the Creative artists, musicians, writers and performers industry.
In the Northern Territory, the income for Performing arts operations was $3.0m in 2006–07.
vii
Performing arts
Almost one-third (32%) of persons in the Northern Territory had attended a Popular music concert in 2009–10.
16% of persons in the Northern Territory had attended a Theatre performance and 12% had been to a Musical or opera in 2009–10.
Northern Territory performing arts organisations staged 250 paid performances which
generated 55,700 paid admissions in 2006–07.
There were 12 Performing arts operation businesses which generated $3.0m in income in 2006–07.

1
1. Cultural attendance and participation
This chapter provides information about Australians’ cultural pursuits, such as attendance at cultural venues and events, and time spent on particular leisure activities. Culture and leisure activities range from going to the theatre or a popular concert, to reading a book, or even watching TV.
ATTENDANCE RATES AT SELECTED CULTURAL VENUES AND EVENTS
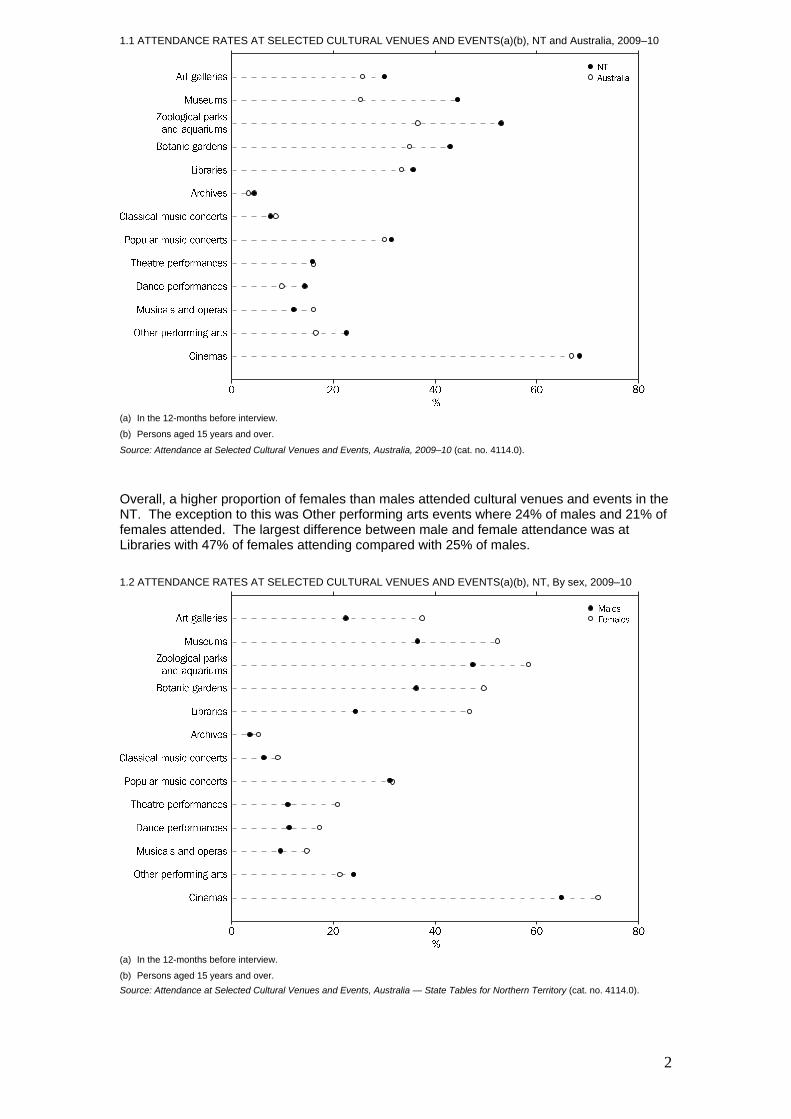
The 2009–10 ABS (2010a) Survey of Attendance at Selected Cultural Venues and Events collected data on attendance at 13 selected cultural venues and events (with Archives being included for the first time). Most people (91% or 116,700) aged 15 years and over in the Northern Territory attended at least one of the cultural venues or events in the 12-month period, compared with 86% nationally.
If Zoological parks and aquariums and Botanic gardens are excluded from these figures, then 91% of persons aged 15 years and over in the Northern Territory (over 319,400 people) attended at least one of the cultural venues or events in the 12-month period, compared with 85% nationally.
In 2009–10, of the people aged 15 years and over in the NT:
69% attended Cinemas compared with 67% of Australians;
53% attended Zoological parks and aquariums compared with 37% of Australians;
36% attended Libraries compared with 34% of Australians;
5% attended Archives compared with 4% of Australians;
43% attended Botanic gardens compared with 35% of Australians;
32% attended Popular music concerts compared with 30% of Australians;
30% attended Art galleries compared with 26% of Australians;
45% attended Museums compared with 26% of Australians;
15% attended Dance performances compared with 10% of Australians;
12% attended Musicals and operas compared with 16% of Australians;
8% attended Classical musical concerts compared with 9% of Australians; and
23% attended Other performing arts events compared with 17% of Australians.
Attendance rates in the NT were similar to the national average at Theatre performances (16%).
2
1.1 ATTENDANCE RATES AT SELECTED CULTURAL VENUES AND EVENTS(a)(b), NT and Australia, 2009–10
(a) In the 12-months before interview.
(b) Persons aged 15 years and over.
Source: Attendance at Selected Cultural Venues and Events, Australia, 2009–10 (cat. no. 4114.0).
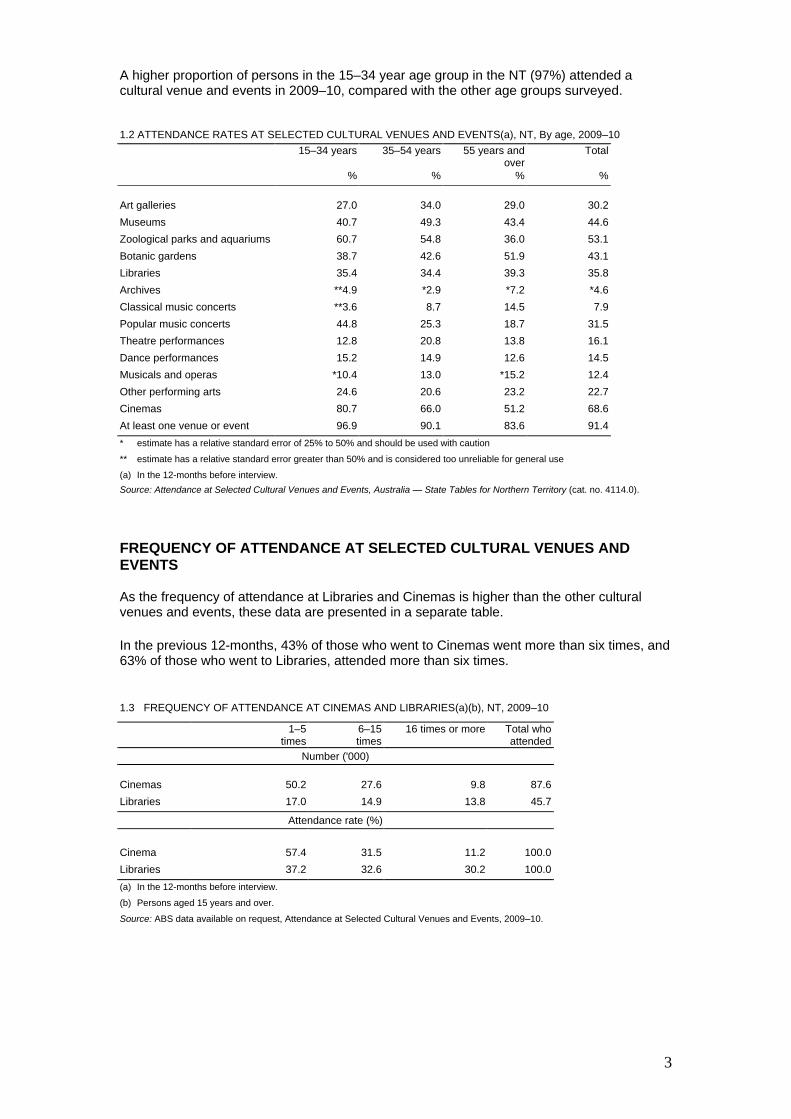
Overall, a higher proportion of females than males attended cultural venues and events in the NT. The exception to this was Other performing arts events where 24% of males and 21% of females attended. The largest difference between male and female attendance was at Libraries with 47% of females attending compared with 25% of males.
1.2 ATTENDANCE RATES AT SELECTED CULTURAL VENUES AND EVENTS(a)(b), NT, By sex, 2009–10
(a) In the 12-months before interview.
(b) Persons aged 15 years and over.
Source: Attendance at Selected Cultural Venues and Events, Australia — State Tables for Northern Territory (cat. no. 4114.0).
3
A higher proportion of persons in the 15–34 year age group in the NT (97%) attended a cultural venue and events in 2009–10, compared with the other age groups surveyed.
1.2 ATTENDANCE RATES AT SELECTED CULTURAL VENUES AND EVENTS(a), NT, By age, 2009–10
15–34 years 35–54 years 55 years and over
Total
% % % %
Art galleries 27.0 34.0 29.0 30.2
Museums 40.7 49.3 43.4 44.6
Zoological parks and aquariums 60.7 54.8 36.0 53.1
Botanic gardens 38.7 42.6 51.9 43.1
Libraries 35.4 34.4 39.3 35.8
Archives **4.9 *2.9 *7.2 *4.6
Classical music concerts **3.6 8.7 14.5 7.9
Popular music concerts 44.8 25.3 18.7 31.5
Theatre performances 12.8 20.8 13.8 16.1
Dance performances 15.2 14.9 12.6 14.5
Musicals and operas *10.4 13.0 *15.2 12.4
Other performing arts 24.6 20.6 23.2 22.7
Cinemas 80.7 66.0 51.2 68.6
At least one venue or event 96.9 90.1 83.6 91.4
* estimate has a relative standard error of 25% to 50% and should be used with caution
** estimate has a relative standard error greater than 50% and is considered too unreliable for general use
(a) In the 12-months before interview.
Source: Attendance at Selected Cultural Venues and Events, Australia — State Tables for Northern Territory (cat. no. 4114.0).
FREQUENCY OF ATTENDANCE AT SELECTED CULTURAL VENUES AND EVENTS
As the frequency of attendance at Libraries and Cinemas is higher than the other cultural venues and events, these data are presented in a separate table.
In the previous 12-months, 43% of those who went to Cinemas went more than six times, and 63% of those who went to Libraries, attended more than six times.
1.3 FREQUENCY OF ATTENDANCE AT CINEMAS AND LIBRARIES(a)(b), NT, 2009–10
1–5 times
6–15 times
16 times or more Total who attended
Number ('000)
Cinemas 50.2 27.6 9.8 87.6
Libraries 17.0 14.9 13.8 45.7
Attendance rate (%)
Cinema 57.4 31.5 11.2 100.0
Libraries 37.2 32.6 30.2 100.0
(a) In the 12-months before interview.
(b) Persons aged 15 years and over.
Source: ABS data available on request, Attendance at Selected Cultural Venues and Events, 2009–10.
4
Most participants who attended cultural venues and events in the NT attended more than once in the 12-month period, except for Theatre performances, Musicals and operas, and Dance performances where most people attended only once in the 12-month period. 1.4 FREQUENCY OF ATTENDANCE AT SELECTED CULTURAL VENUES AND EVENTS(a)(b), NT, 2009–10
Once 2–4 times 5 times or more Total who attended
Number ('000)
Art galleries 9.8 18.6 10.1 38.5
Museums 21.2 29.4 6.4 57.0
Zoological parks and aquariums 27.6 30.9 9.3 67.8
Botanic gardens 19.6 24.6 10.8 55.0
Archives *2.9 **0.5 *2.5 *5.9
Classical music concerts *3.8 5.8 **0.6 10.1
Popular music concerts 17.1 16.6 6.6 40.3
Theatre performances 10.5 8.7 *1.4 20.6
Dance performances 10.1 5.0 *3.4 18.5
Musicals and operas 10.9 np np 15.9
Other performing arts 19.5 6.0 *3.5 29.1
Attendance rate (%)
Art galleries 25.4 48.3 26.3 100.0
Museums 37.1 51.6 11.3 100.0
Zoological parks and aquariums 40.7 45.7 13.7 100.0
Botanic gardens 35.7 44.8 19.6 100.0
Archives *49.1 **8.8 *42.1 100.0
Classical music concerts 37.3 57.2 **5.5 100.0
Popular music concerts 42.5 41.2 16.3 100.0
Theatre performances 50.8 42.3 *6.9 100.0
Dance performances 54.6 27.1 *18.3 100.0
Musicals and operas 68.3 np np 100.0
Other performing arts 67.2 20.7 *12.1 100.0
np not available for publication
* estimate has a relative standard error of 25% to 50% and should be used with caution
** estimate has a relative standard error greater than 50% and is considered too unreliable for general use
(a) In the 12-months before interview.
(b) Persons aged 15 years and over.
Source: ABS data available on request, Attendance at Selected Cultural Venues and Events, 2009–10.
5
READING FOR PLEASURE
Research conducted by Starcom (2008) for Australia Council for the Arts, Books Alive 2008 - reader research, looked at the reading habits of 1,200 Australians aged 16–65, who had read a book for pleasure in the last three years. The study found that almost 7 out of 10 people reported reading books regularly. Of those who read regularly for pleasure, most read magazines (66%), newspapers (61%) or fiction books (58%), while less than half read non-fiction books (41%).
Reading for enjoyment was the main motivation for people, with 83% of readers reporting this as a reason for the activity. General interest was also a popular reason (68%), followed by relaxation and reducing stress (67%) and to improve knowledge (59%).
The main barriers preventing most readers from reading included lack of time (47%) and the cost of new books (40%), however 24% of those surveyed reported that there were no significant barriers to reading.
Technology has changed the way some people read books. The Books Alive program has been rebranded as Get Reading! Data from the 2010 Get Reading! Campaign Effectiveness Research (AMR Interactive, 2010) showed that 13% of people who have read a book for pleasure in the last three years currently download electronic books (e-books) from the Internet. These e-books are read on devices such as phones/PDA/laptop (10%) and e-book readers (6%). When asked about their future intentions for adopting reading technologies, 21% said they would consider downloading an e-book, 22% said they would consider using an e-book reader and 16% said they would consider reading an e-book on their phone/PDA/laptop.
More information on the Books Alive/Get Reading! research is available at: http://www.australiacouncil.gov.au/research/literature. However, there is no state level data provided.
ABS data collected on children’s reading is available in Chapter 3 of this report, ‘Children, Young People and the Arts’.
USE OF FREE TIME
How people spend their time was the subject of an ABS (2008a) survey conducted in 2006. People aged 15 years and over were asked to record what they did during a two-day period. Information was recorded on necessary activities such as eating and sleeping, and the usual activities such as paid work, study, housework and unpaid community work.
The time left in the day after these activities have been accounted for is considered free time, and it is under the broad heading of free time that most culture and recreation activities appear.
Many free time activities can be undertaken simultaneously with another activity (e.g. watching TV while eating a meal, or listening to the radio while doing housework). The information presented below shows the time spent by participants on each activity, regardless of whether it was the main activity being undertaken at the time or whether it was a secondary activity being undertaken simultaneously.
It is perhaps not too surprising that watching TV was found to be the activity which took up most people's leisure time. On a daily basis 87% of Australians watched TV for an average of just less than 3 hours (179 minutes), down slightly from the 1997 figure of 182 minutes. This means that in 2006, Australians aged 15 years and over spent a total of 42m person hours watching TV each day.
Other activities on which Australians spent a large amount of time included listening to the radio and reading.

6
The Time Use Survey found that visiting entertainment and cultural venues attracted about 4% of the population who spent on average about two hours when they attended. The total time spent by all Australians on visiting entertainment and cultural venues (1.3m person hours per day) was similar to the time spent on religious activities and listening to records, tapes, CDs and other audio media (1.3m person hours per day and 1.1m person hours per day respectively).
1.5 AVERAGE TIME SPENT ON SELECTED CULTURE AND LEISURE ACTIVITIES(a)(b), 2006
Participants average
Participation rate
Total time spent by all
Australians
Average % of day spent on activity by all Australians
minutes per day
% million person hours per day
%
Visiting entertainment and cultural venues 114 4.3 1.3 0.3
Attendance at sports event 127 1.6 0.5 0.1
Religious activities/ritual ceremonies 91 5.3 1.3 0.3
Sport and outdoor activity 88 25.6 6.2 1.5
Games/hobbies/arts/crafts 100 17.7 4.9 1.2
Reading 76 43.7 8.9 2.3
TV watching/listening 179 87.4 42 10.8
Video/DVD watching 109 8.3 2.4 0.6
Listening to radio 123 47.9 15.9 4.1
Listening to records/tapes/CDs and other audio media
71 5.6 1.1 0.3
Attendance at courses (excluding school and university)
113 0.6 0.2 -
Audio/visual media nec(c) 83 22.7 5.8 1.3
- nil or rounded to zero (including null cells)
(a) Includes only those that have taken part in the activity.
(b) Includes cultural activities that were undertaken as a secondary activity.
(c) Computer and internet use, other than for games.
Source: ABS data available on request, How Australians Use Their Time 2006.
CULTURAL TOURISM
The report Cultural Tourism in Regions of Australia prepared by Tourism Research Australia (2005) for the former Cultural Ministers Council Statistics Working Group provides information on both domestic and international cultural visitors. The report is available from the following website at http://www.culturaldata.gov.au/sites/www.culturaldata.gov.au/files/Cultural_tourism_in_regions_of_Australia.pdf
More recent information is available in Cultural and Heritage Tourism in Australia, 2009, (Tourism Research Australia, 2009) which is available on the website at http://www.ret.gov.au/tourism/Documents/tra/Snapshots%20and%20Factsheets/Cultural_09_FINAL.pdf
7
2. Employment, work and volunteers in culture
There are challenges in measuring how many people are employed in culture. Some people have only short-term jobs, while others have a cultural job that is not their main job. Nevertheless, there are several data sources that provide an indication of the number of people working in culture. The two main sources are the 2006 Census of Population and Housing and the 2007 Survey of Work in Selected Culture and Leisure Activities. Data are also presented from the Service Industry Surveys.
PERSONS EMPLOYED IN CULTURAL OCCUPATIONS & INDUSTRIES
Cultural employment can be defined using either occupation data, that is, the type of work people do; or industry data, that is, the main activity of the business for whom people work.
Consequently, data by industry will include people who have a non-cultural occupation within a cultural industry (such as clerks, receptionists and sales assistants) and will exclude people who have cultural occupations but do not work in cultural industries (such as a librarian working in an educational institution).
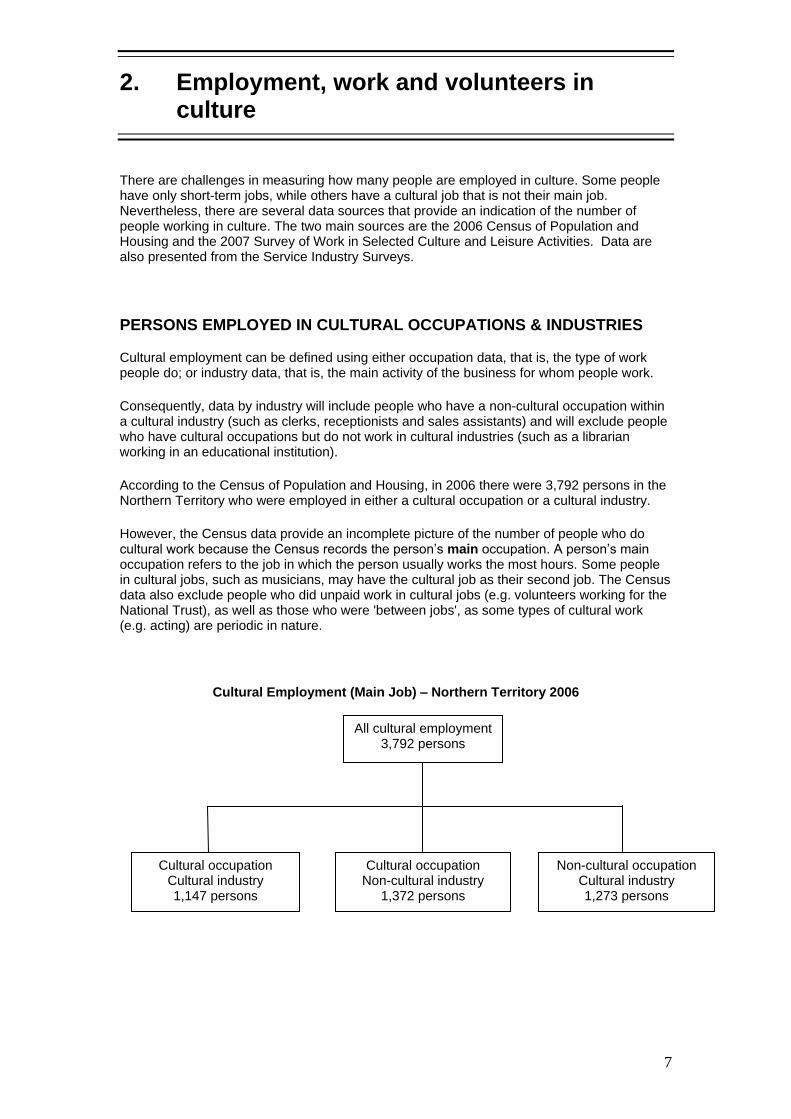
According to the Census of Population and Housing, in 2006 there were 3,792 persons in the Northern Territory who were employed in either a cultural occupation or a cultural industry.
However, the Census data provide an incomplete picture of the number of people who do cultural work because the Census records the person’s main occupation. A person’s main occupation refers to the job in which the person usually works the most hours. Some people in cultural jobs, such as musicians, may have the cultural job as their second job. The Census data also exclude people who did unpaid work in cultural jobs (e.g. volunteers working for the National Trust), as well as those who were 'between jobs', as some types of cultural work (e.g. acting) are periodic in nature.
Cultural Employment (Main Job) – Northern Territory 2006
Non-cultural occupation Cultural industry 1,273 persons
All cultural employment 3,792 persons
Cultural occupation Cultural industry 1,147 persons
Cultural occupation Non-cultural industry
1,372 persons
8
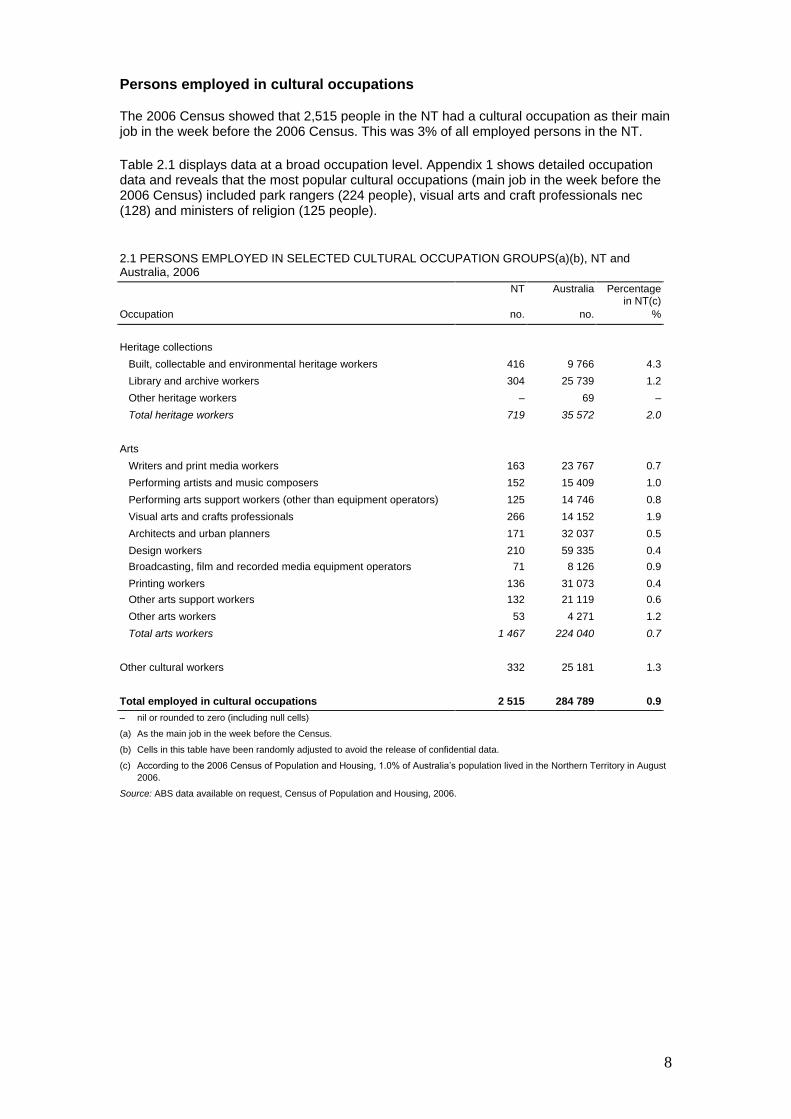
Persons employed in cultural occupations
The 2006 Census showed that 2,515 people in the NT had a cultural occupation as their main job in the week before the 2006 Census. This was 3% of all employed persons in the NT.
Table 2.1 displays data at a broad occupation level. Appendix 1 shows detailed occupation data and reveals that the most popular cultural occupations (main job in the week before the 2006 Census) included park rangers (224 people), visual arts and craft professionals nec (128) and ministers of religion (125 people).
2.1 PERSONS EMPLOYED IN SELECTED CULTURAL OCCUPATION GROUPS(a)(b), NT and Australia, 2006
NT Australia Percentage in NT(c)
Occupation no. no. %
Heritage collections
Built, collectable and environmental heritage workers 416 9 766 4.3
Library and archive workers 304 25 739 1.2
Other heritage workers – 69 –
Total heritage workers 719 35 572 2.0
Arts
Writers and print media workers 163 23 767 0.7
Performing artists and music composers 152 15 409 1.0
Performing arts support workers (other than equipment operators) 125 14 746 0.8
Visual arts and crafts professionals 266 14 152 1.9
Architects and urban planners 171 32 037 0.5
Design workers 210 59 335 0.4
Broadcasting, film and recorded media equipment operators 71 8 126 0.9
Printing workers 136 31 073 0.4
Other arts support workers 132 21 119 0.6
Other arts workers 53 4 271 1.2
Total arts workers 1 467 224 040 0.7
Other cultural workers 332 25 181 1.3
Total employed in cultural occupations 2 515 284 789 0.9
– nil or rounded to zero (including null cells)
(a) As the main job in the week before the Census.
(b) Cells in this table have been randomly adjusted to avoid the release of confidential data.
(c) According to the 2006 Census of Population and Housing, 1.0% of Australia’s population lived in the Northern Territory in August
2006.
Source: ABS data available on request, Census of Population and Housing, 2006.
9
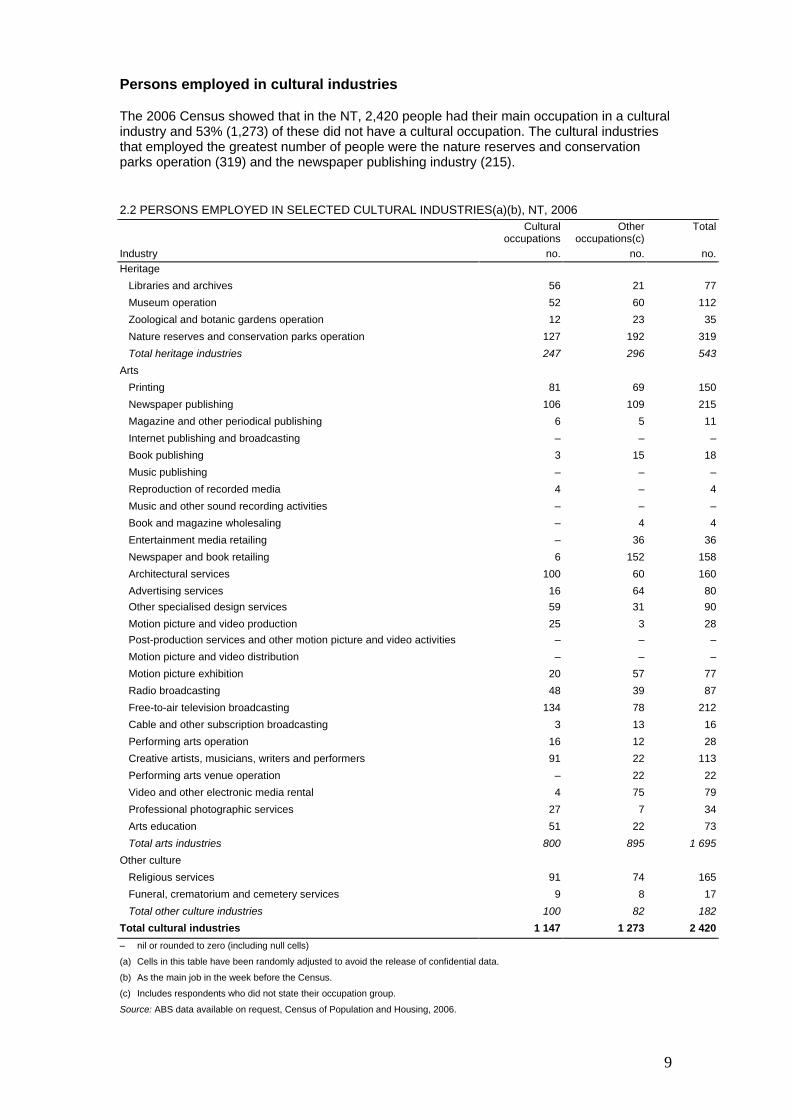
Persons employed in cultural industries
The 2006 Census showed that in the NT, 2,420 people had their main occupation in a cultural industry and 53% (1,273) of these did not have a cultural occupation. The cultural industries that employed the greatest number of people were the nature reserves and conservation parks operation (319) and the newspaper publishing industry (215).
2.2 PERSONS EMPLOYED IN SELECTED CULTURAL INDUSTRIES(a)(b), NT, 2006
Cultural occupations
Other occupations(c)
Total
Industry no. no. no.
Heritage
Libraries and archives 56 21 77
Museum operation 52 60 112
Zoological and botanic gardens operation 12 23 35
Nature reserves and conservation parks operation 127 192 319
Total heritage industries 247 296 543
Arts
Printing 81 69 150
Newspaper publishing 106 109 215
Magazine and other periodical publishing 6 5 11
Internet publishing and broadcasting – – –
Book publishing 3 15 18
Music publishing – – –
Reproduction of recorded media 4 – 4
Music and other sound recording activities – – –
Book and magazine wholesaling – 4 4
Entertainment media retailing – 36 36
Newspaper and book retailing 6 152 158
Architectural services 100 60 160
Advertising services 16 64 80
Other specialised design services 59 31 90
Motion picture and video production 25 3 28
Post-production services and other motion picture and video activities – – –
Motion picture and video distribution – – –
Motion picture exhibition 20 57 77
Radio broadcasting 48 39 87
Free-to-air television broadcasting 134 78 212
Cable and other subscription broadcasting 3 13 16
Performing arts operation 16 12 28
Creative artists, musicians, writers and performers 91 22 113
Performing arts venue operation – 22 22
Video and other electronic media rental 4 75 79
Professional photographic services 27 7 34
Arts education 51 22 73
Total arts industries 800 895 1 695
Other culture
Religious services 91 74 165
Funeral, crematorium and cemetery services 9 8 17
Total other culture industries 100 82 182
Total cultural industries 1 147 1 273 2 420
– nil or rounded to zero (including null cells)
(a) Cells in this table have been randomly adjusted to avoid the release of confidential data.
(b) As the main job in the week before the Census.
(c) Includes respondents who did not state their occupation group.
Source: ABS data available on request, Census of Population and Housing, 2006.
10
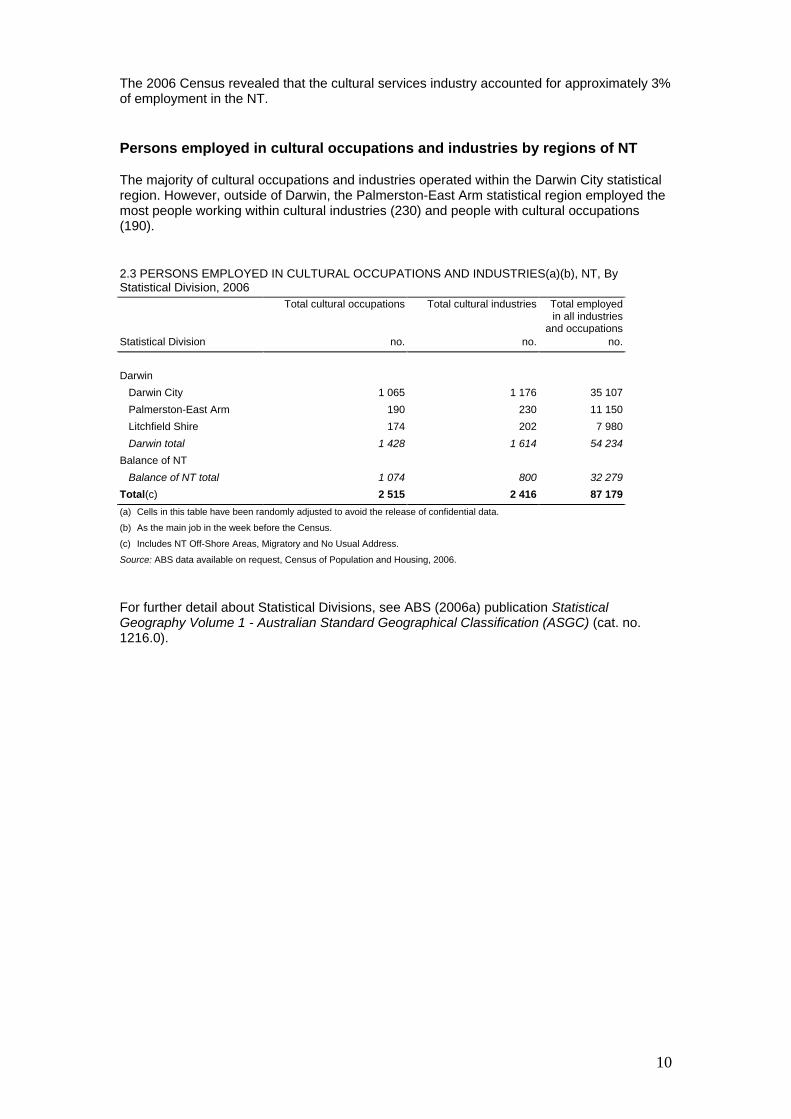
The 2006 Census revealed that the cultural services industry accounted for approximately 3% of employment in the NT.
Persons employed in cultural occupations and industries by regions of NT
The majority of cultural occupations and industries operated within the Darwin City statistical region. However, outside of Darwin, the Palmerston-East Arm statistical region employed the most people working within cultural industries (230) and people with cultural occupations (190).
2.3 PERSONS EMPLOYED IN CULTURAL OCCUPATIONS AND INDUSTRIES(a)(b), NT, By Statistical Division, 2006
Total cultural occupations Total cultural industries Total employed in all industries
and occupations
Statistical Division no. no. no.
Darwin
Darwin City 1 065 1 176 35 107
Palmerston-East Arm 190 230 11 150
Litchfield Shire 174 202 7 980
Darwin total 1 428 1 614 54 234
Balance of NT
Balance of NT total 1 074 800 32 279
Total(c) 2 515 2 416 87 179
(a) Cells in this table have been randomly adjusted to avoid the release of confidential data.
(b) As the main job in the week before the Census.
(c) Includes NT Off-Shore Areas, Migratory and No Usual Address.
Source: ABS data available on request, Census of Population and Housing, 2006.
For further detail about Statistical Divisions, see ABS (2006a) publication Statistical Geography Volume 1 - Australian Standard Geographical Classification (ASGC) (cat. no. 1216.0).
11
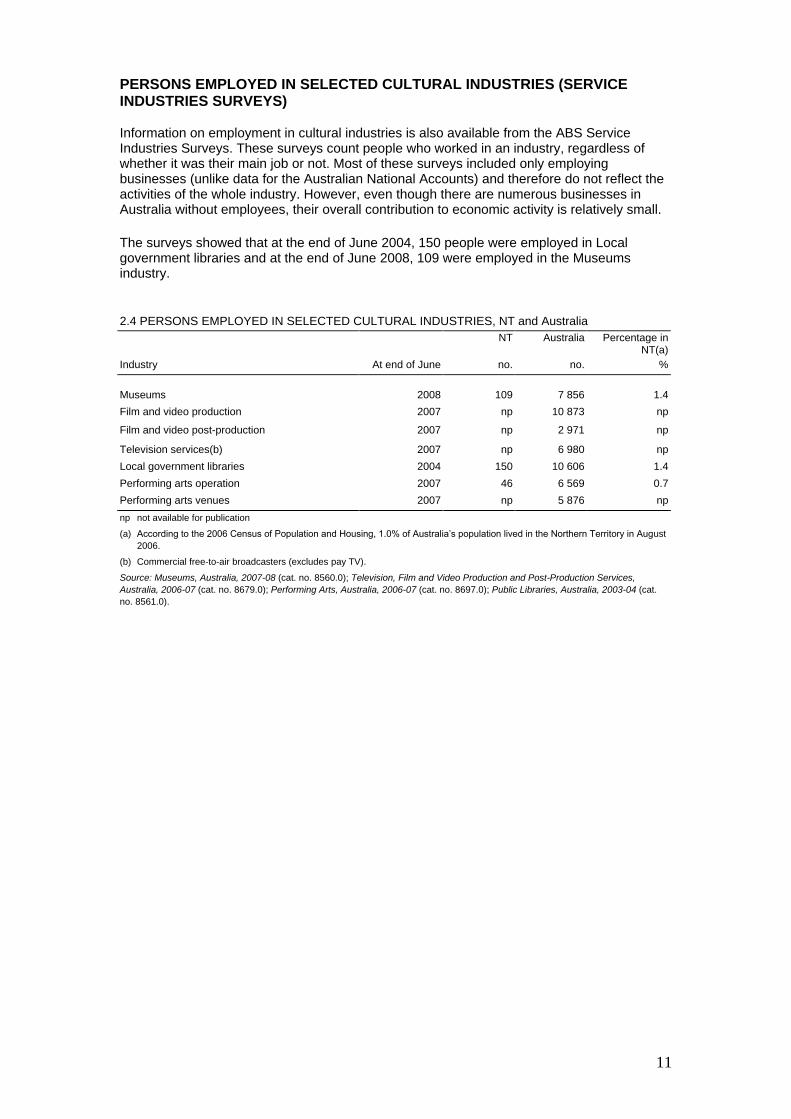
PERSONS EMPLOYED IN SELECTED CULTURAL INDUSTRIES (SERVICE INDUSTRIES SURVEYS)
Information on employment in cultural industries is also available from the ABS Service Industries Surveys. These surveys count people who worked in an industry, regardless of whether it was their main job or not. Most of these surveys included only employing businesses (unlike data for the Australian National Accounts) and therefore do not reflect the activities of the whole industry. However, even though there are numerous businesses in Australia without employees, their overall contribution to economic activity is relatively small.
The surveys showed that at the end of June 2004, 150 people were employed in Local government libraries and at the end of June 2008, 109 were employed in the Museums industry.
2.4 PERSONS EMPLOYED IN SELECTED CULTURAL INDUSTRIES, NT and Australia
NT Australia Percentage in NT(a)
Industry At end of June no. no. %
Museums 2008 109 7 856 1.4
Film and video production
Film and video post-production
2007
2007
np
np
10 873
2 971
np
np
Television services(b) 2007 np 6 980 np
Local government libraries 2004 150 10 606 1.4
Performing arts operation 2007 46 6 569 0.7
Performing arts venues 2007 np 5 876 np
np not available for publication
(a) According to the 2006 Census of Population and Housing, 1.0% of Australia’s population lived in the Northern Territory in August
2006.
(b) Commercial free-to-air broadcasters (excludes pay TV).
Source: Museums, Australia, 2007-08 (cat. no. 8560.0); Television, Film and Video Production and Post-Production Services,
Australia, 2006-07 (cat. no. 8679.0); Performing Arts, Australia, 2006-07 (cat. no. 8697.0); Public Libraries, Australia, 2003-04 (cat.
no. 8561.0).

12
WORK IN CULTURE ACTIVITIES (PAID AND UNPAID)
The 2007 Survey of Work in Selected Culture and Leisure Activities (ABS 2007a) collected information on people who had a work involvement in culture and leisure activities in the 12-months before the interview. The survey included those people whose involvement was in a main or second job, was spasmodic in nature, or whose work was unpaid (e.g. working in a band).
In the NT, 28% of the population aged 15 years and over (or 31,800 persons) had involvement in selected culture and leisure activities in the 12-months ending April 2007. The majority of these people (59%) received no payment for their involvement in the cultural activity.
2.5 PERSONS INVOLVED IN SELECTED CULTURE AND LEISURE ACTIVITIES(a)(b), By payment status, NT and Australia, 2007
NT Australia
Number
Percentage of total population
Number
Percentage of total population
‘000 % ‘000 %
Some paid involvement(c) 12.9 11.3 1 062.1 6.5
Unpaid involvement only 18.9 16.6 2 428.6 14.9
Total persons involved(d) 31.8 27.9 3 531.0 21.7
(a) In the 12-months before interview.
(b) Persons aged 15 years and over.
(c) Includes persons who only received goods or services as payment.
(d) Includes people whose payment status was not known.
Source: ABS data available on request, Work in Selected Culture and Leisure Activities, Australia, April 2007.
13
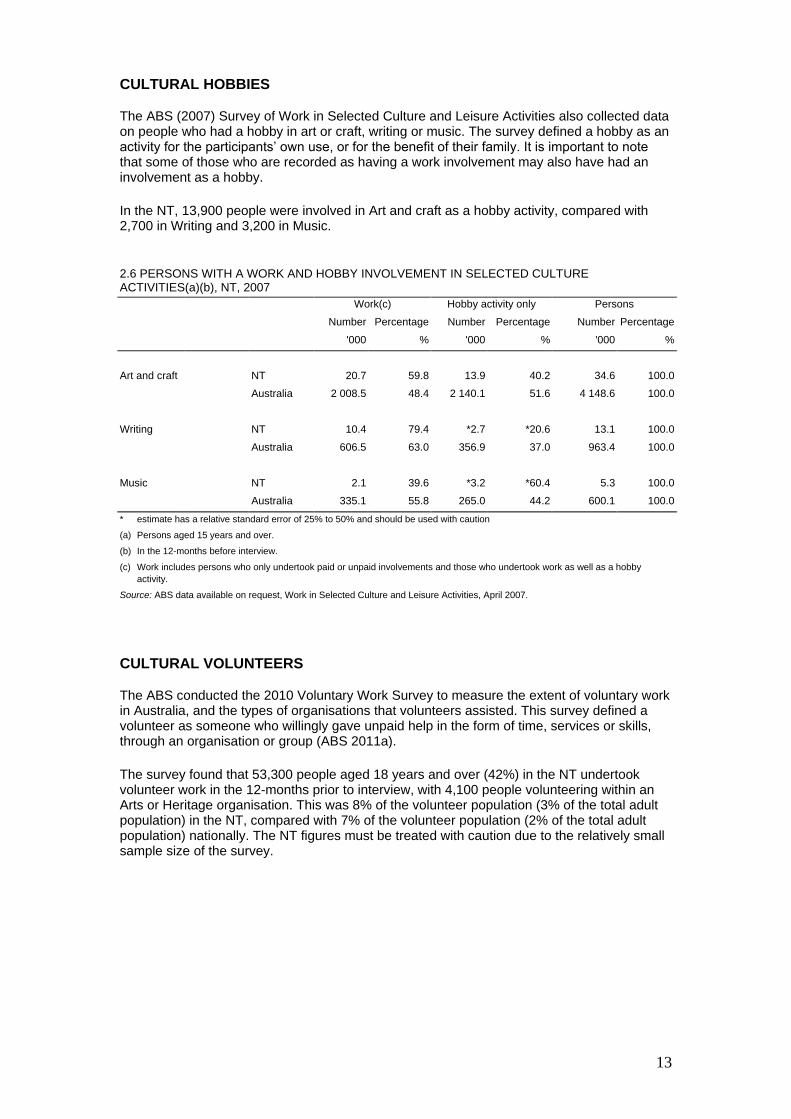
CULTURAL HOBBIES
The ABS (2007) Survey of Work in Selected Culture and Leisure Activities also collected data on people who had a hobby in art or craft, writing or music. The survey defined a hobby as an activity for the participants’ own use, or for the benefit of their family. It is important to note that some of those who are recorded as having a work involvement may also have had an involvement as a hobby.
In the NT, 13,900 people were involved in Art and craft as a hobby activity, compared with 2,700 in Writing and 3,200 in Music.
2.6 PERSONS WITH A WORK AND HOBBY INVOLVEMENT IN SELECTED CULTURE ACTIVITIES(a)(b), NT, 2007
Work(c) Hobby activity only Persons
Number Percentage Number Percentage Number Percentage
'000 % '000 % '000 %
Art and craft NT 20.7 59.8 13.9 40.2 34.6 100.0
Australia 2 008.5 48.4 2 140.1 51.6 4 148.6 100.0
Writing NT 10.4 79.4 *2.7 *20.6 13.1 100.0
Australia 606.5 63.0 356.9 37.0 963.4 100.0
Music NT 2.1 39.6 *3.2 *60.4 5.3 100.0
Australia 335.1 55.8 265.0 44.2 600.1 100.0
* estimate has a relative standard error of 25% to 50% and should be used with caution
(a) Persons aged 15 years and over.
(b) In the 12-months before interview.
(c) Work includes persons who only undertook paid or unpaid involvements and those who undertook work as well as a hobby
activity.
Source: ABS data available on request, Work in Selected Culture and Leisure Activities, April 2007.
CULTURAL VOLUNTEERS
The ABS conducted the 2010 Voluntary Work Survey to measure the extent of voluntary work in Australia, and the types of organisations that volunteers assisted. This survey defined a volunteer as someone who willingly gave unpaid help in the form of time, services or skills, through an organisation or group (ABS 2011a).
The survey found that 53,300 people aged 18 years and over (42%) in the NT undertook volunteer work in the 12-months prior to interview, with 4,100 people volunteering within an Arts or Heritage organisation. This was 8% of the volunteer population (3% of the total adult population) in the NT, compared with 7% of the volunteer population (2% of the total adult population) nationally. The NT figures must be treated with caution due to the relatively small sample size of the survey.
14
3. Children, young people and the arts
Children (aged 5–14 years) and young people (aged 15–24 years) have different participation rates in selected cultural activities compared with persons aged 25 years and over.
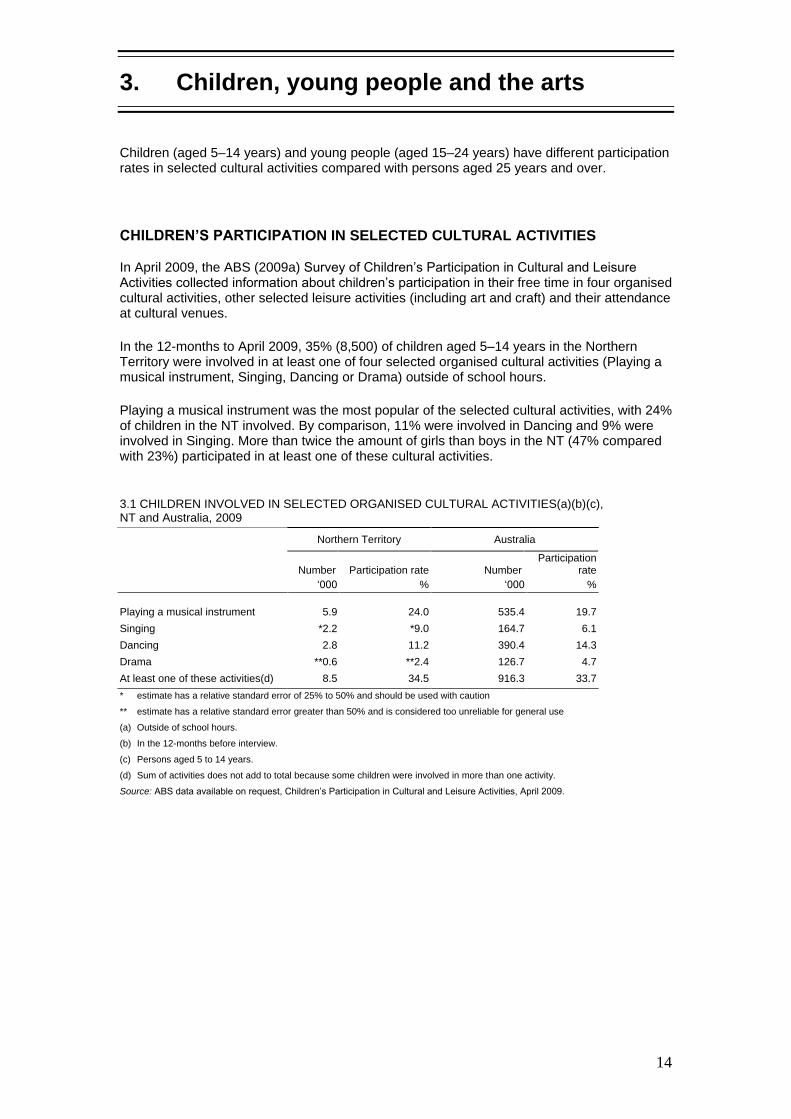
CHILDREN’S PARTICIPATION IN SELECTED CULTURAL ACTIVITIES
In April 2009, the ABS (2009a) Survey of Children’s Participation in Cultural and Leisure Activities collected information about children’s participation in their free time in four organised cultural activities, other selected leisure activities (including art and craft) and their attendance at cultural venues.
In the 12-months to April 2009, 35% (8,500) of children aged 5–14 years in the Northern Territory were involved in at least one of four selected organised cultural activities (Playing a musical instrument, Singing, Dancing or Drama) outside of school hours.
Playing a musical instrument was the most popular of the selected cultural activities, with 24% of children in the NT involved. By comparison, 11% were involved in Dancing and 9% were involved in Singing. More than twice the amount of girls than boys in the NT (47% compared with 23%) participated in at least one of these cultural activities.
3.1 CHILDREN INVOLVED IN SELECTED ORGANISED CULTURAL ACTIVITIES(a)(b)(c), NT and Australia, 2009
Northern Territory Australia
Number Participation rate Number
Participation rate
‘000 % ‘000 %
Playing a musical instrument 5.9 24.0 535.4 19.7
Singing *2.2 *9.0 164.7 6.1
Dancing 2.8 11.2 390.4 14.3
Drama **0.6 **2.4 126.7 4.7
At least one of these activities(d) 8.5 34.5 916.3 33.7
* estimate has a relative standard error of 25% to 50% and should be used with caution
** estimate has a relative standard error greater than 50% and is considered too unreliable for general use
(a) Outside of school hours.
(b) In the 12-months before interview.
(c) Persons aged 5 to 14 years.
(d) Sum of activities does not add to total because some children were involved in more than one activity.
Source: ABS data available on request, Children’s Participation in Cultural and Leisure Activities, April 2009.

15
Playing a musical instrument recorded the highest participation rate followed by Dancing, Singing and Drama.
3.2 PARTICIPATION RATES OF CHILDREN AGED 5–14 YEARS INVOLVED IN SELECTED ORGANISED CULTURAL ACTIVITIES(a)(b), NT, 2009
(a) Outside of school hours.
(b) In the 12-months before interview.
Source: ABS data available on request, Children’s Participation in Cultural and Leisure Activities, April 2009.
The majority (86%) of NT children who participated in Dancing received lessons during the 12-month period prior to interview in 2009. This compares with 82% of those who played a musical instrument, 76% of those involved in Drama and 59% of those involved in Singing.
CHILDREN’S PARTICIPATION IN OTHER LEISURE ACTIVITIES
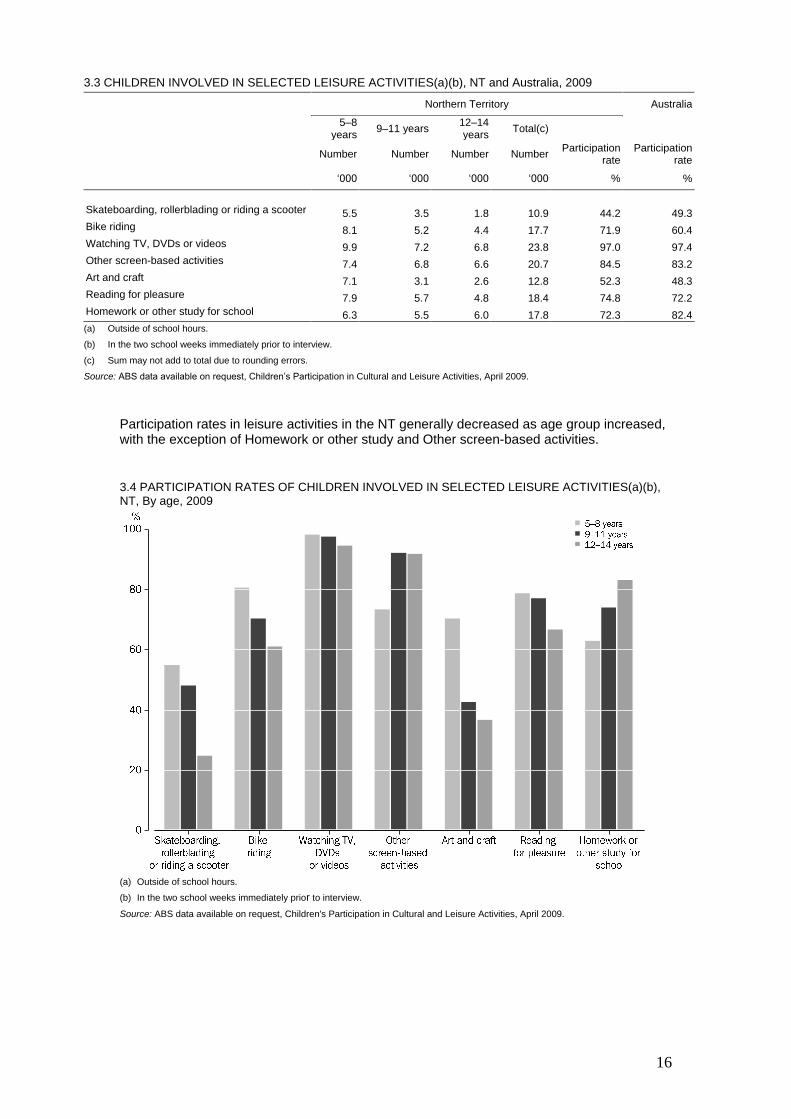
The 2009 ABS survey also collected data on six selected leisure activities undertaken by children in the two school weeks immediately prior to interview. It showed that 97% of children in the NT had watched TV, videos or DVDs outside of school hours; 72% did homework or other study; 75% of children read for pleasure; 72% had been bike riding; 44% had been skateboarding, rollerblading or riding a scooter and 85% had participated in other screen-based activities. Just over half (52%) of children in the NT participated in art and craft activities.
16
3.3 CHILDREN INVOLVED IN SELECTED LEISURE ACTIVITIES(a)(b), NT and Australia, 2009
Northern Territory Australia
5–8 years
9–11 years 12–14 years
Total(c)
Number Number Number Number Participation
rate Participation
rate
‘000 ‘000 ‘000 ‘000 % %
Skateboarding, rollerblading or riding a scooter 5.5 3.5 1.8 10.9 44.2 49.3
Bike riding 8.1 5.2 4.4 17.7 71.9 60.4
Watching TV, DVDs or videos 9.9 7.2 6.8 23.8 97.0 97.4
Other screen-based activities 7.4 6.8 6.6 20.7 84.5 83.2
Art and craft 7.1 3.1 2.6 12.8 52.3 48.3
Reading for pleasure 7.9 5.7 4.8 18.4 74.8 72.2
Homework or other study for school 6.3 5.5 6.0 17.8 72.3 82.4
(a) Outside of school hours.
(b) In the two school weeks immediately prior to interview.
(c) Sum may not add to total due to rounding errors.
Source: ABS data available on request, Children’s Participation in Cultural and Leisure Activities, April 2009.
Participation rates in leisure activities in the NT generally decreased as age group increased, with the exception of Homework or other study and Other screen-based activities.
3.4 PARTICIPATION RATES OF CHILDREN INVOLVED IN SELECTED LEISURE ACTIVITIES(a)(b), NT, By age, 2009
(a) Outside of school hours.
(b) In the two school weeks immediately prior to interview.
Source: ABS data available on request, Children's Participation in Cultural and Leisure Activities, April 2009.
17
CHILDREN’S ATTENDANCE AT SELECTED CULTURAL VENUES AND EVENTS
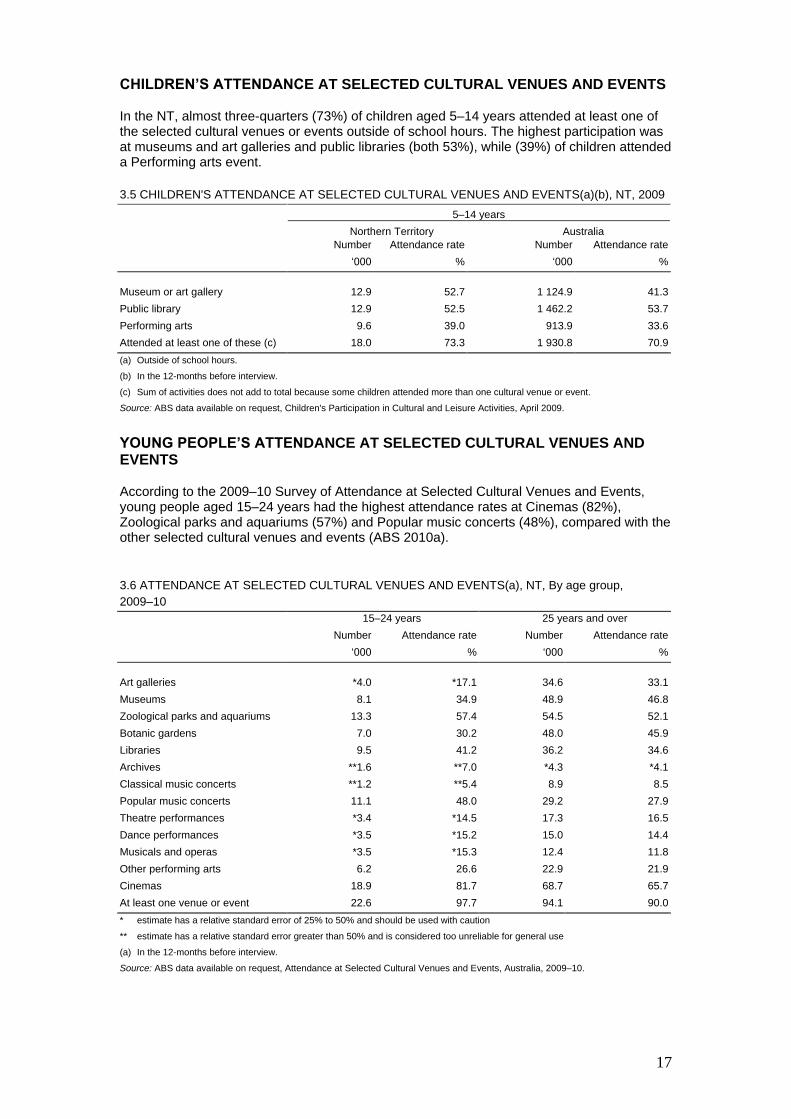
In the NT, almost three-quarters (73%) of children aged 5–14 years attended at least one of the selected cultural venues or events outside of school hours. The highest participation was at museums and art galleries and public libraries (both 53%), while (39%) of children attended a Performing arts event.
3.5 CHILDREN'S ATTENDANCE AT SELECTED CULTURAL VENUES AND EVENTS(a)(b), NT, 2009
5–14 years
Northern Territory Australia
Number Attendance rate Number Attendance rate
‘000 % ‘000 %
Museum or art gallery 12.9 52.7 1 124.9 41.3
Public library 12.9 52.5 1 462.2 53.7
Performing arts 9.6 39.0 913.9 33.6
Attended at least one of these (c) 18.0 73.3 1 930.8 70.9
(a) Outside of school hours.
(b) In the 12-months before interview.
(c) Sum of activities does not add to total because some children attended more than one cultural venue or event.
Source: ABS data available on request, Children's Participation in Cultural and Leisure Activities, April 2009.
YOUNG PEOPLE’S ATTENDANCE AT SELECTED CULTURAL VENUES AND EVENTS
According to the 2009–10 Survey of Attendance at Selected Cultural Venues and Events, young people aged 15–24 years had the highest attendance rates at Cinemas (82%), Zoological parks and aquariums (57%) and Popular music concerts (48%), compared with the other selected cultural venues and events (ABS 2010a).
3.6 ATTENDANCE AT SELECTED CULTURAL VENUES AND EVENTS(a), NT, By age group,
2009–10
15–24 years 25 years and over
Number Attendance rate Number Attendance rate
‘000 % ‘000 %
Art galleries *4.0 *17.1 34.6 33.1
Museums 8.1 34.9 48.9 46.8
Zoological parks and aquariums 13.3 57.4 54.5 52.1
Botanic gardens 7.0 30.2 48.0 45.9
Libraries 9.5 41.2 36.2 34.6
Archives **1.6 **7.0 *4.3 *4.1
Classical music concerts **1.2 **5.4 8.9 8.5
Popular music concerts 11.1 48.0 29.2 27.9
Theatre performances *3.4 *14.5 17.3 16.5
Dance performances *3.5 *15.2 15.0 14.4
Musicals and operas *3.5 *15.3 12.4 11.8
Other performing arts 6.2 26.6 22.9 21.9
Cinemas 18.9 81.7 68.7 65.7
At least one venue or event 22.6 97.7 94.1 90.0
* estimate has a relative standard error of 25% to 50% and should be used with caution
** estimate has a relative standard error greater than 50% and is considered too unreliable for general use
(a) In the 12-months before interview.
Source: ABS data available on request, Attendance at Selected Cultural Venues and Events, Australia, 2009–10.
18
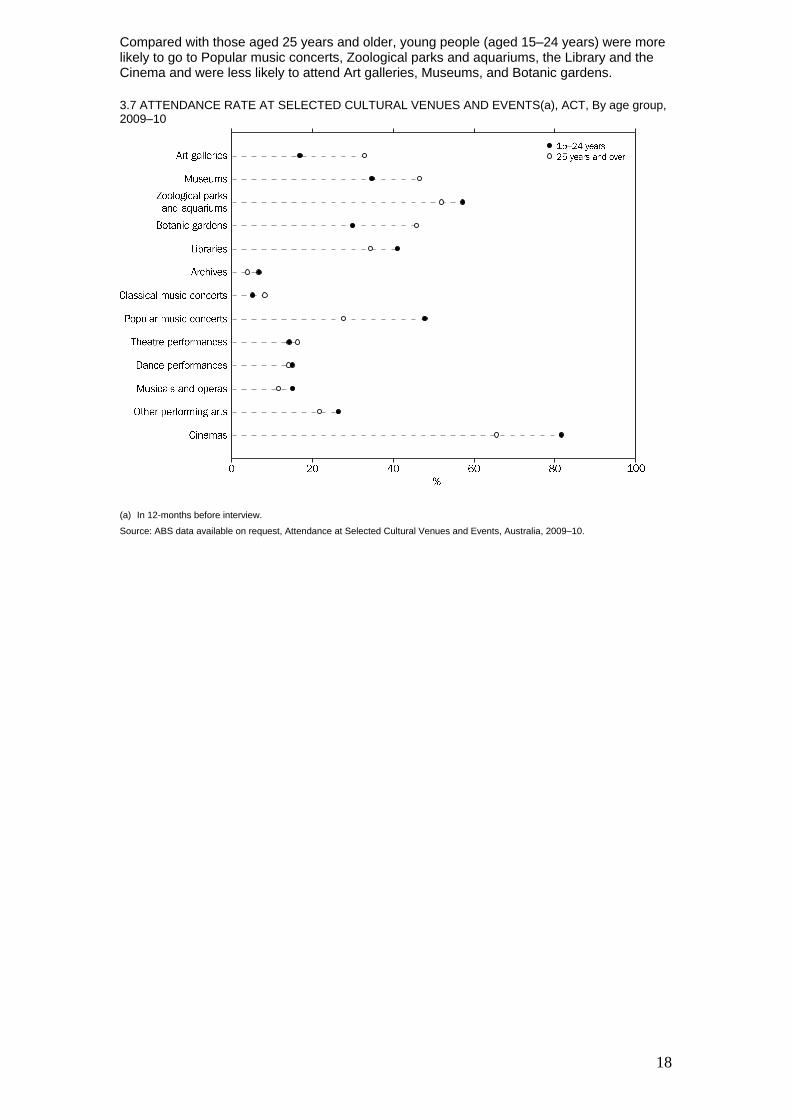
Compared with those aged 25 years and older, young people (aged 15–24 years) were more likely to go to Popular music concerts, Zoological parks and aquariums, the Library and the Cinema and were less likely to attend Art galleries, Museums, and Botanic gardens.
3.7 ATTENDANCE RATE AT SELECTED CULTURAL VENUES AND EVENTS(a), ACT, By age group, 2009–10
(a) In 12-months before interview.
Source: ABS data available on request, Attendance at Selected Cultural Venues and Events, Australia, 2009–10.
19
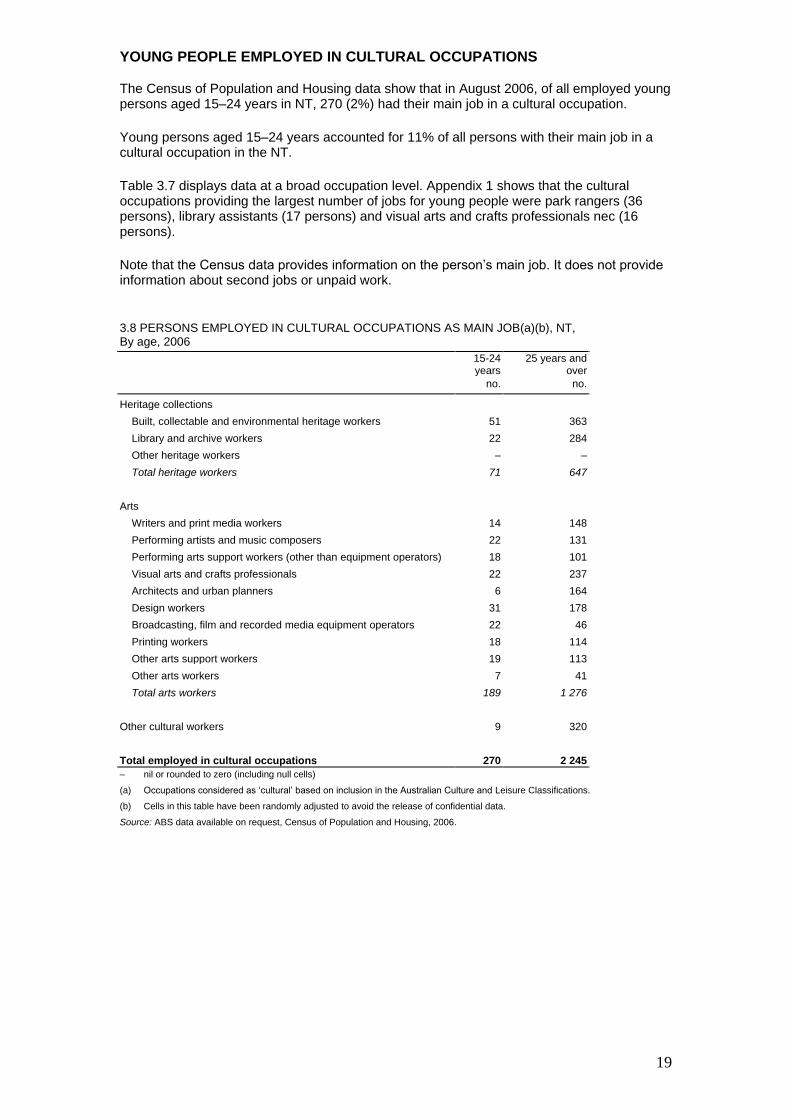
YOUNG PEOPLE EMPLOYED IN CULTURAL OCCUPATIONS
The Census of Population and Housing data show that in August 2006, of all employed young persons aged 15–24 years in NT, 270 (2%) had their main job in a cultural occupation.
Young persons aged 15–24 years accounted for 11% of all persons with their main job in a cultural occupation in the NT.
Table 3.7 displays data at a broad occupation level. Appendix 1 shows that the cultural occupations providing the largest number of jobs for young people were park rangers (36 persons), library assistants (17 persons) and visual arts and crafts professionals nec (16 persons).
Note that the Census data provides information on the person’s main job. It does not provide information about second jobs or unpaid work.
3.8 PERSONS EMPLOYED IN CULTURAL OCCUPATIONS AS MAIN JOB(a)(b), NT, By age, 2006
15-24 years
25 years and over
no. no.
Heritage collections
Built, collectable and environmental heritage workers 51 363
Library and archive workers 22 284
Other heritage workers – –
Total heritage workers 71 647
Arts
Writers and print media workers 14 148
Performing artists and music composers 22 131
Performing arts support workers (other than equipment operators) 18 101
Visual arts and crafts professionals 22 237
Architects and urban planners 6 164
Design workers 31 178
Broadcasting, film and recorded media equipment operators 22 46
Printing workers 18 114
Other arts support workers 19 113
Other arts workers 7 41 Total arts workers 189 1 276
Other cultural workers 9 320
Total employed in cultural occupations 270 2 245
– nil or rounded to zero (including null cells)
(a) Occupations considered as ‘cultural’ based on inclusion in the Australian Culture and Leisure Classifications.
(b) Cells in this table have been randomly adjusted to avoid the release of confidential data.
Source: ABS data available on request, Census of Population and Housing, 2006.
20
4. Indigenous participation in the arts
This chapter focuses on Indigenous Australians’ participation in a range of Indigenous creative arts activities, such as music and visual arts, as well as attendance at Indigenous events (e.g. festivals and ceremonies) and other selected cultural venues (e.g. museums or art galleries). Information is also provided on the number of Indigenous people employed in cultural occupations.
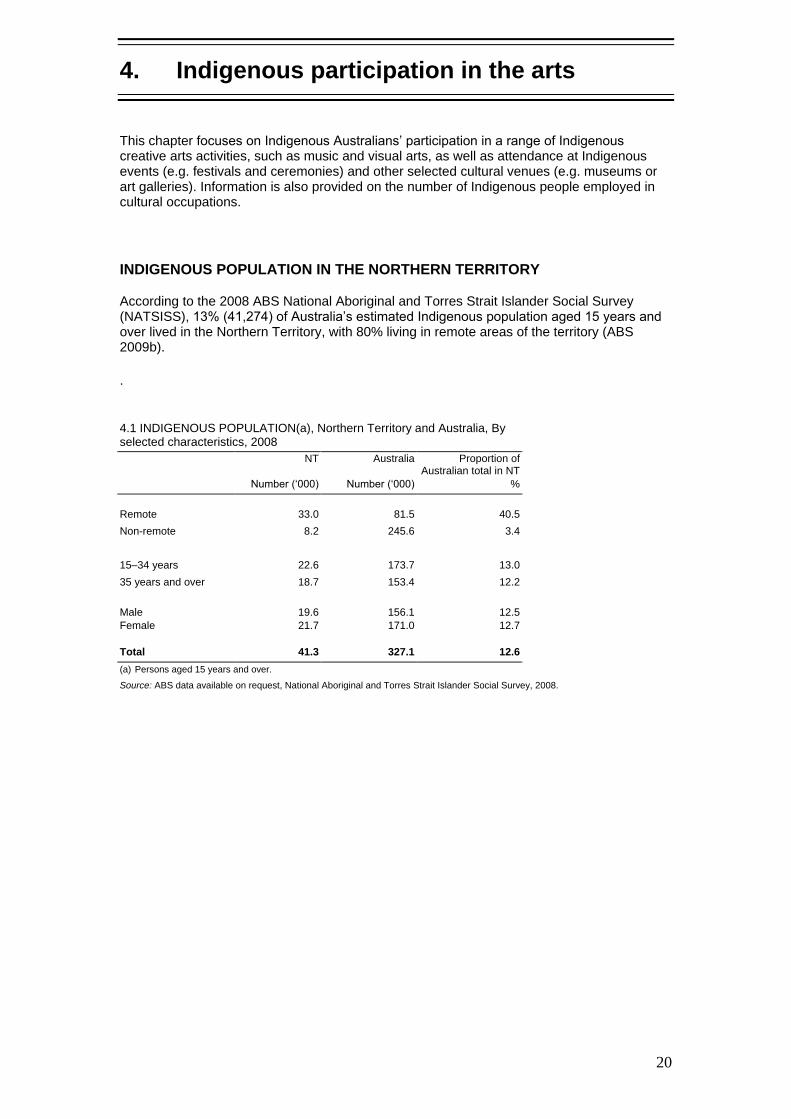
INDIGENOUS POPULATION IN THE NORTHERN TERRITORY
According to the 2008 ABS National Aboriginal and Torres Strait Islander Social Survey (NATSISS), 13% (41,274) of Australia’s estimated Indigenous population aged 15 years and over lived in the Northern Territory, with 80% living in remote areas of the territory (ABS 2009b).
.
4.1 INDIGENOUS POPULATION(a), Northern Territory and Australia, By selected characteristics, 2008
NT Australia Proportion of Australian total in NT
Number (‘000) Number (‘000) %
Remote 33.0 81.5 40.5
Non-remote 8.2 245.6 3.4
15–34 years 22.6 173.7 13.0
35 years and over 18.7 153.4 12.2
Male 19.6 156.1 12.5
Female 21.7 171.0 12.7
Total 41.3 327.1 12.6
(a) Persons aged 15 years and over.
Source: ABS data available on request, National Aboriginal and Torres Strait Islander Social Survey, 2008.

21
PARTICIPATION IN INDIGENOUS CREATIVE ARTS
The 2008 ABS NATSISS collected data on participation in Indigenous creative arts activities by Indigenous people aged 15 years and over.
Two-fifths (40%) of Indigenous persons aged 15 years and over living in the Northern Territory had participated in at least one Indigenous creative art activity. The most popular activities were Art and craft activities and Writing or telling stories (23%), while 21% had participated in Music, dance or theatre.
4.2 PARTICIPATION BY INDIGENOUS PERSONS IN INDIGENOUS CREATIVE ART ACTIVITIES(a)(b), Northern Territory and Australia, By selected characteristics, 2008
Northern Territory Australia
Number Participation rate Participation rate
‘000 % %
Type of Indigenous activity
Arts and crafts 9.6 23.4 17.3
Music, dance or theatre 8.5 20.5 10.8
Writing or telling stories 9.6 23.3 15.4
At least one of the activities(c) 16.7 40.4 28.1
15–34 years of age
Arts and crafts 4.9 21.5 16.3
Music, dance or theatre 4.6 20.4 10.8
Writing or telling stories 4.5 20.0 11.5
At least one of the activities(c) 9.0 39.9 25.9
35 years and over
Arts and crafts 4.8 25.6 18.4
Music, dance or theatre 3.9 20.7 10.9
Writing or telling stories 5.1 27.2 19.9
At least one of the activities(c) 7.7 41.0 30.6
Remote
Arts and crafts 8.5 25.6 21.6
Music, dance or theatre 7.6 23.1 16.4
Writing or telling stories 8.0 24.2 21.4
At least one of the activities(c) 14.5 44.0 37.6
Non-remote
Arts and crafts 1.2 14.2 15.9
Music, dance or theatre *0.9 *10.4 9.0
Writing or telling stories 1.6 19.5 13.5
At least one of the activities(c) 2.1 26.1 24.9
* estimate has a relative standard error of 25% to 50% and should be used with caution
(a) Persons aged 15 years and over.
(b) In the 12-months prior to interview.
(c) Sum of activities does not add to total because some people were involved in more than one activity.
Source: ABS data available on request, National Aboriginal and Torres Strait Islander Social Survey, 2008.

22
In 2008, of those Indigenous persons aged 15 years and over living in the Northern Territory who participated in Music, dance or theatre, 80% reported the reason for their participation as being for Cultural learning or ceremony. Of those that participated in Writing or telling stories, more than three-quarters (82%) also reported this as the reason for their participation.
4.3 PARTICIPATION BY INDIGENOUS PERSONS IN INDIGENOUS CREATIVE ART ACTIVITIES(a)(b), NT and Australia, By reason for participation, 2008
NT Australia
Number Participation rate Participation rate
Reason for participation ‘000 % %
Own enjoyment/fun
Arts and crafts 5.3 55.1 57.0
Music, dance or theatre 4.5 53.1 49.8
Writing or telling stories 4.4 45.7 38.6
At least one of the activities(c) 9.0 53.9 53.0
Enjoyment/fun with others
Arts and crafts 4.1 42.9 40.6
Music, dance or theatre 4.3 50.8 43.9
Writing or telling stories 4.0 41.7 42.3
At least one of the activities(c) 8.0 48.0 46.2
Cultural learning or ceremony
Arts and crafts 5.5 57.5 50.2
Music, dance or theatre 6.8 80.3 66.8
Writing or telling stories 7.8 81.6 69.8
At least one of the activities(c) 12.6 75.8 60.3
School activity
Arts and crafts 1.0 10.7 18.3
Music, dance or theatre *0.5 *6.3 17.0
Writing or telling stories 1.3 13.1 23.2
At least one of the activities(c) 2.0 11.7 20.9
Total
Arts and crafts 9.6 23.4 17.3
Music, dance or theatre 8.5 20.5 10.8
Writing or telling stories 9.6 23.3 15.4
At least one of the activities(c) 16.7 40.4 28.1
* estimate has a relative standard error of 25% to 50% and should be used with caution
(a) Persons aged 15 years and over.
(b) In the 12-months prior to interview.
(c) Sum of activities does not add to total because some people were involved in more than one activity.
Source: ABS data available on request, National Aboriginal and Torres Strait Islander Social Survey, 2008.
23
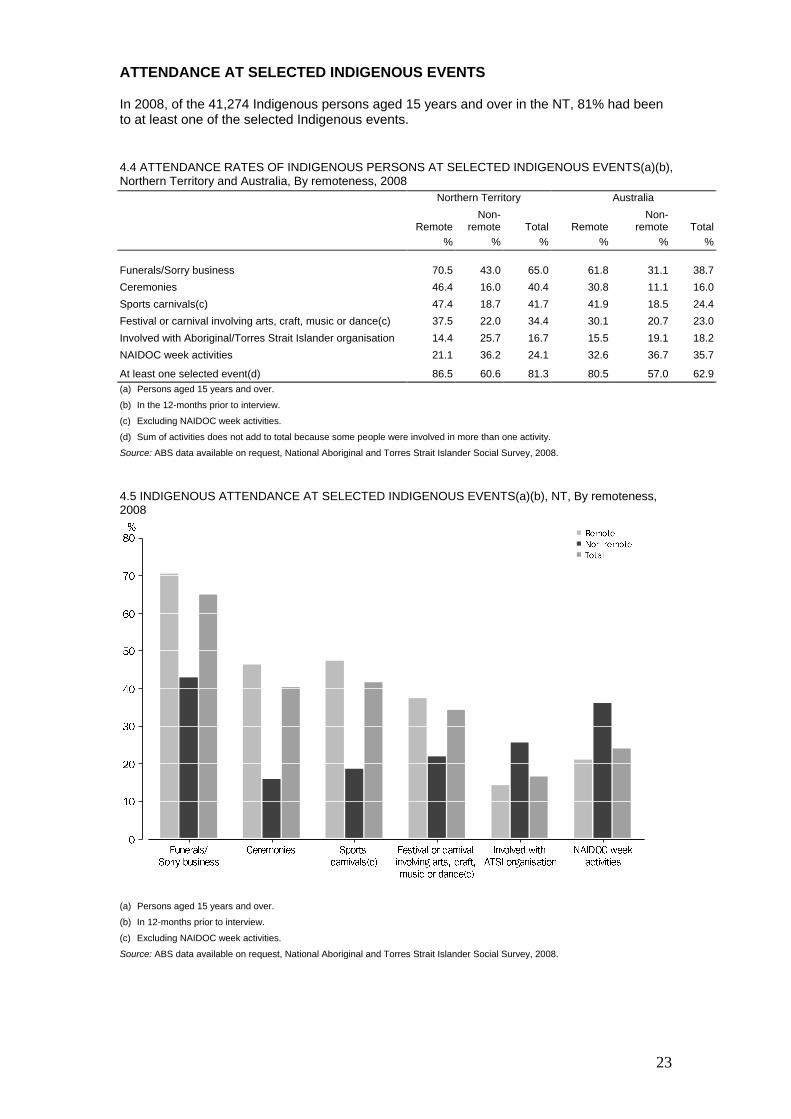
ATTENDANCE AT SELECTED INDIGENOUS EVENTS
In 2008, of the 41,274 Indigenous persons aged 15 years and over in the NT, 81% had been to at least one of the selected Indigenous events.
4.4 ATTENDANCE RATES OF INDIGENOUS PERSONS AT SELECTED INDIGENOUS EVENTS(a)(b), Northern Territory and Australia, By remoteness, 2008
Northern Territory Australia
Remote
Non-remote
Total
Remote
Non-remote
Total
% % % % % %
Funerals/Sorry business 70.5 43.0 65.0 61.8 31.1 38.7
Ceremonies 46.4 16.0 40.4 30.8 11.1 16.0
Sports carnivals(c) 47.4 18.7 41.7 41.9 18.5 24.4
Festival or carnival involving arts, craft, music or dance(c) 37.5 22.0 34.4 30.1 20.7 23.0
Involved with Aboriginal/Torres Strait Islander organisation 14.4 25.7 16.7 15.5 19.1 18.2
NAIDOC week activities 21.1 36.2 24.1 32.6 36.7 35.7
At least one selected event(d) 86.5 60.6 81.3 80.5 57.0 62.9
(a) Persons aged 15 years and over.
(b) In the 12-months prior to interview.
(c) Excluding NAIDOC week activities.
(d) Sum of activities does not add to total because some people were involved in more than one activity.
Source: ABS data available on request, National Aboriginal and Torres Strait Islander Social Survey, 2008.
4.5 INDIGENOUS ATTENDANCE AT SELECTED INDIGENOUS EVENTS(a)(b), NT, By remoteness, 2008
(a) Persons aged 15 years and over.
(b) In 12-months prior to interview.
(c) Excluding NAIDOC week activities.
Source: ABS data available on request, National Aboriginal and Torres Strait Islander Social Survey, 2008.
24
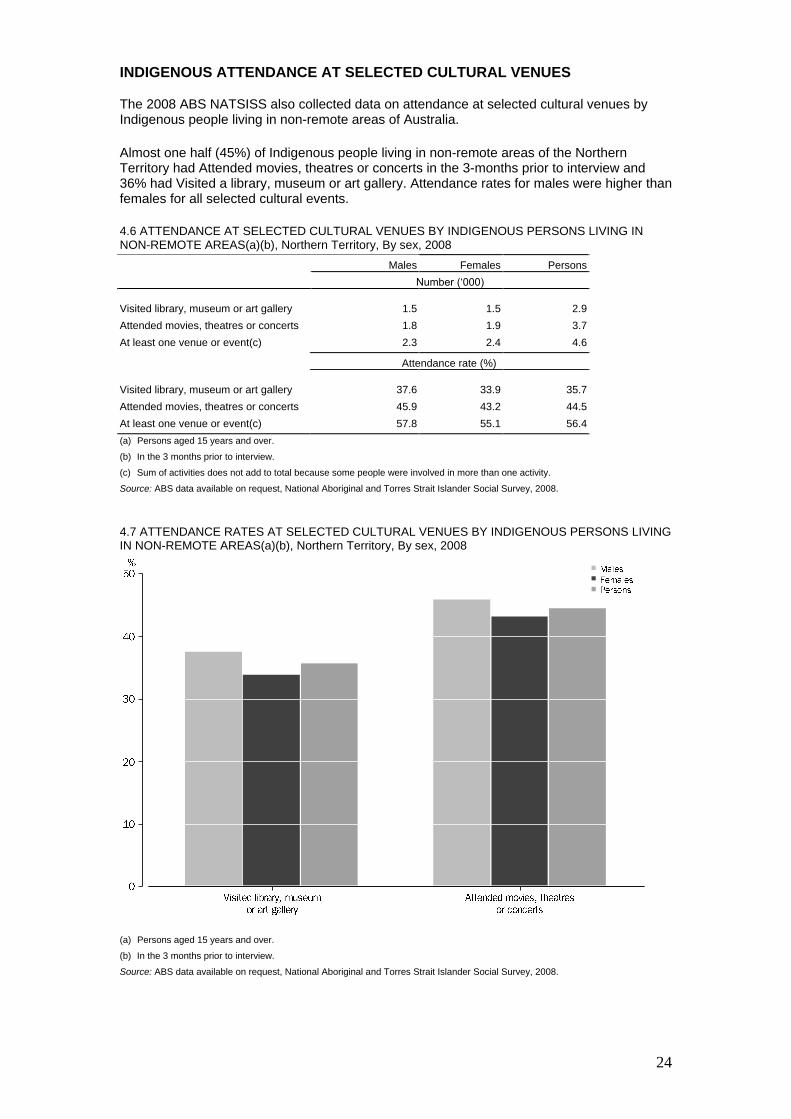
INDIGENOUS ATTENDANCE AT SELECTED CULTURAL VENUES
The 2008 ABS NATSISS also collected data on attendance at selected cultural venues by Indigenous people living in non-remote areas of Australia.
Almost one half (45%) of Indigenous people living in non-remote areas of the Northern Territory had Attended movies, theatres or concerts in the 3-months prior to interview and 36% had Visited a library, museum or art gallery. Attendance rates for males were higher than females for all selected cultural events.
4.6 ATTENDANCE AT SELECTED CULTURAL VENUES BY INDIGENOUS PERSONS LIVING IN NON-REMOTE AREAS(a)(b), Northern Territory, By sex, 2008
Males Females Persons
Number (‘000)
Visited library, museum or art gallery 1.5 1.5 2.9
Attended movies, theatres or concerts 1.8 1.9 3.7
At least one venue or event(c) 2.3 2.4 4.6
Attendance rate (%)
Visited library, museum or art gallery 37.6 33.9 35.7
Attended movies, theatres or concerts 45.9 43.2 44.5
At least one venue or event(c) 57.8 55.1 56.4
(a) Persons aged 15 years and over.
(b) In the 3 months prior to interview.
(c) Sum of activities does not add to total because some people were involved in more than one activity.
Source: ABS data available on request, National Aboriginal and Torres Strait Islander Social Survey, 2008.
4.7 ATTENDANCE RATES AT SELECTED CULTURAL VENUES BY INDIGENOUS PERSONS LIVING IN NON-REMOTE AREAS(a)(b), Northern Territory, By sex, 2008
(a) Persons aged 15 years and over.
(b) In the 3 months prior to interview.
Source: ABS data available on request, National Aboriginal and Torres Strait Islander Social Survey, 2008.

25
CULTURAL FACILITIES IN INDIGENOUS COMMUNITIES
The 2006 Community Housing and Infrastructure Needs Survey (ABS 2007b) found that there were 641 discrete Indigenous communities in the Northern Territory. Of these, 70 had a hall or meeting area while 18 had a library, and 39 had an arts or cultural centre.
INDIGENOUS PERSONS EMPLOYED IN CULTURAL OCCUPATIONS
The 2006 Census showed that 493 Indigenous people in the NT were employed in a cultural occupation as their main job. For detailed occupation level data see table 1 in Appendix 1. Table 4.8 below provides data at a broad occupation level.
Of the 11,659 employed Indigenous people in the NT in 2006, 4% were employed in a cultural occupation.
4.8 INDIGENOUS PEOPLE EMPLOYED IN CULTURAL OCCUPATIONS AS MAIN JOB(a)(b), Northern Territory and Australia, 2006
NT
Australia
Proportion of Australian total
employed in NT
Cultural occupation no. no. %
Heritage collections
Built, collectable and environmental heritage workers 135 405 33.3
Library and archive workers 31 230 13.5
Other heritage workers – 5 –
Total heritage workers 165 636 25.9
Arts
Writers and print media workers 10 99 10.1
Performing artists and music composers 40 320 12.5
Performing arts support workers (other than equipment operators) 14 113 12.4
Visual arts and crafts professionals 171 692 24.7
Architects and urban planners 3 54 5.6
Design workers 8 206 3.9
Broadcasting, film and recorded media equipment operators 8 61 13.1
Printing workers 14 229 6.1
Other arts support workers 16 159 10.1
Other arts workers 12 119 10.1
Total arts workers 278 2 061 13.5
Other cultural workers 47 349 13.5
Total employed in cultural occupations 493 3 054 16.1
– nil or rounded to zero (including null cells)
(a) Occupations considered as ‘cultural’ based on inclusion in the Australian Culture and Leisure Classifications.
(b) Cells in this table have been randomly adjusted to avoid the release of confidential data.
Source: ABS data available on request, Census of Population and Housing, 2006.

26
5. People born overseas and the arts
Our cultural interests are influenced by a variety of factors, such as our upbringing, our education and our personal interests. This chapter highlights the differences between the cultural activities undertaken by people who were born overseas and those who were born in Australia. In addition, some information is also presented on the cultural activities of overseas-born people by whether they were born in one of the main English speaking countries (United Kingdom and Ireland, New Zealand, South Africa, Canada and the United States of America) or elsewhere (referred to as non-English speaking countries).
WORK IN CULTURE (PAID AND UNPAID)
The ABS (2007a) Survey of Work in Selected Culture and Leisure Activities, showed that in the 12-months before the interview, 28% of people in the NT born in Australia had some work involvement in culture and leisure activities (compared with 22% nationally). Of those people in the NT that were born overseas, 27% had some work involvement in culture and leisure activities (compared with 18% nationally).
A lower proportion of people born overseas (13%) had unpaid involvement in culture and leisure activities, than those born in Australia (18%).
5.1 PERSONS WITH WORK INVOLVEMENT IN SELECTED CULTURE AND LEISURE ACTIVITIES(a)(b), NT, By birthplace, 2007
BORN IN AUSTRALIA
BORN OVERSEAS
Main English speaking countries
Non-English speaking countries
Total NT
‘000 % '000 % '000 % ‘000 %
Some payment 8.7 10.4 *2.8 *21.2 *1.4 *8.0 *4.2 *13.7
Unpaid involvement only 15.0 17.9 *2.6 *19.4 *1.3 *7.7 *3.9 *12.8
Total with involvement 23.7 28.4 5.4 40.5 *2.7 *15.7 8.1 26.5
* estimate has a relative standard error of 25% to 50% and should be used with caution
(a) In the 12-months before interview.
(b) Persons aged 15 years and over.
Source: ABS data available on request, Work in Selected Culture and Leisure Activities, April 2007.
27
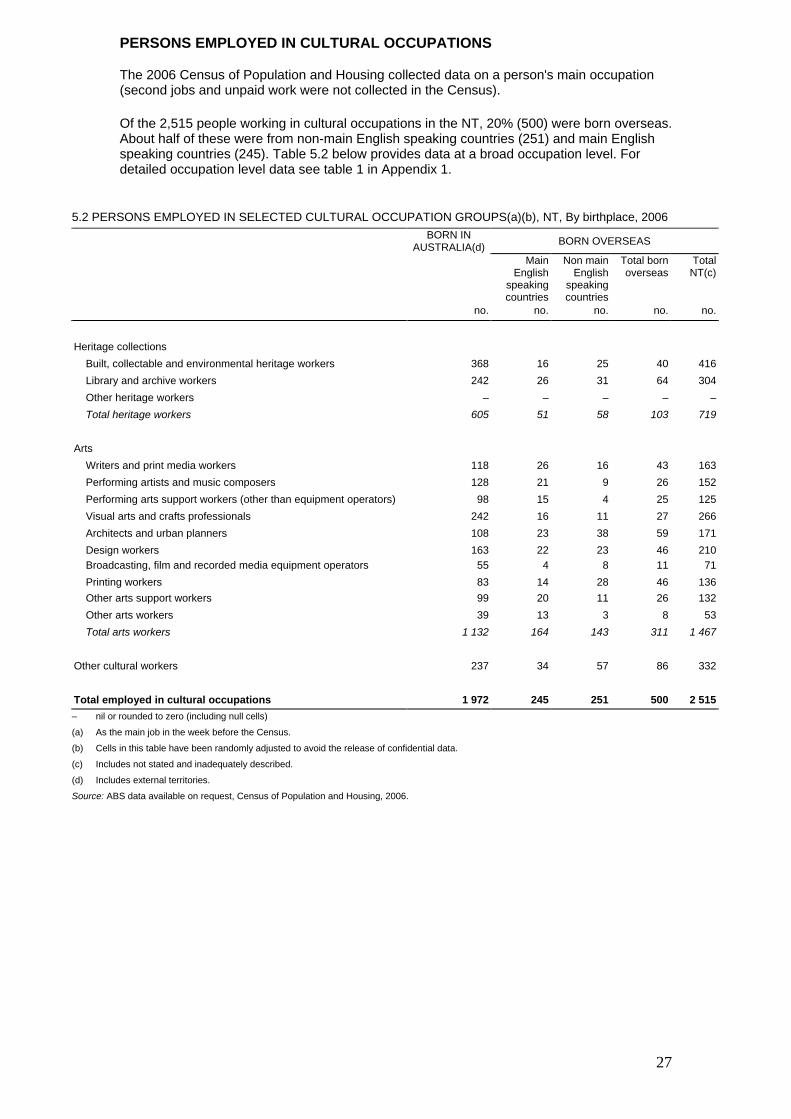
PERSONS EMPLOYED IN CULTURAL OCCUPATIONS
The 2006 Census of Population and Housing collected data on a person's main occupation (second jobs and unpaid work were not collected in the Census).
Of the 2,515 people working in cultural occupations in the NT, 20% (500) were born overseas. About half of these were from non-main English speaking countries (251) and main English speaking countries (245). Table 5.2 below provides data at a broad occupation level. For detailed occupation level data see table 1 in Appendix 1.
5.2 PERSONS EMPLOYED IN SELECTED CULTURAL OCCUPATION GROUPS(a)(b), NT, By birthplace, 2006
BORN IN AUSTRALIA(d)
BORN OVERSEAS
Main English
speaking countries
Non main English
speaking countries
Total born overseas
Total NT(c)
no. no. no. no. no.
Heritage collections
Built, collectable and environmental heritage workers 368 16 25 40 416
Library and archive workers 242 26 31 64 304
Other heritage workers – – – – –
Total heritage workers 605 51 58 103 719
Arts
Writers and print media workers 118 26 16 43 163
Performing artists and music composers 128 21 9 26 152
Performing arts support workers (other than equipment operators) 98 15 4 25 125
Visual arts and crafts professionals 242 16 11 27 266
Architects and urban planners 108 23 38 59 171
Design workers 163 22 23 46 210
Broadcasting, film and recorded media equipment operators 55 4 8 11 71
Printing workers 83 14 28 46 136
Other arts support workers 99 20 11 26 132
Other arts workers 39 13 3 8 53
Total arts workers 1 132 164 143 311 1 467
Other cultural workers 237 34 57 86 332
Total employed in cultural occupations 1 972 245 251 500 2 515
– nil or rounded to zero (including null cells)
(a) As the main job in the week before the Census.
(b) Cells in this table have been randomly adjusted to avoid the release of confidential data.
(c) Includes not stated and inadequately described.
(d) Includes external territories.
Source: ABS data available on request, Census of Population and Housing, 2006.

28
6. Household expenditure on culture
The most comprehensive source of data on household cultural expenditure is the ABS Household Expenditure Survey. This survey, which is conducted every five years, records the expenditure of households rather than individuals. This is because some expenditure (e.g. housing, furniture, televisions) is often for the benefit of everyone in the household and so cannot be attributed in a meaningful way to any particular person in the household.
The latest available data relates to the 2009–10 financial year. Households in the Northern Territory spent an average of $43.50 per week in 2009–10 on ‘cultural’ items (ABS 2011b). This included over $14 per week on items such as television, video and photographic equipment and over $12 per week on broadcasting, electronic media and film. Weekly household expenditure on culture in the NT was slightly higher than the national average ($43.50 compared with $42.30). Total expenditure on cultural goods and services by the 65,300 households in the NT during 2009–10 was $148m.
In 2003–04, the ABS Household Expenditure Survey showed that households in the NT spent an average of $47.46 per week on cultural items (ABS 2006b). It should be noted that during the 5 years between the surveys, the prices of goods and services as measured by the Consumer Price Index rose by 19%.

29
6.1 HOUSEHOLD EXPENDITURE ON CULTURE, NT and Australia, 2009–10
AVERAGE WEEKLY HOUSEHOLD EXPENDITURE
TOTAL ANNUAL HOUSEHOLD EXPENDITURE
NT(a)($) Australia ($) NT(a) ($m) Australia ($m)
Literature Books *7.27 4.64 25 2 032
Newspapers 2.06 2.69 7 1 178
Magazines and comics 2.35 1.89 8 828
Total(a) 11.70 9.38 40 4 107
Music
Pre-recorded compact discs and records (audio) *0.57 0.92 2 403
Total(b) *0.57 0.92 2 403
Performing arts
Live theatre fees and charges *0.91 1.04 3 455
Music concert fees and charges **2.95 1.89 10 828
Total *3.86 2.93 13 1 283
Visual arts and crafts
Paintings, carvings and sculptures *0.53 *1.25 2 547
Art and craft materials *0.54 0.57 2 250
Total(c) 1.25 2.38 4 1 042
Broadcasting, electronic media and film
Hire of video cassette tapes and TV and computer games *1.11 0.73 4 320
Pre-recorded video cassettes and video discs *2.25 2.60 8 1 139
Cinema fees and charges 2.10 2.29 7 1 003
Pay TV fees 6.58 5.24 22 2 295
Total 12.04 10.86 41 4 756
Other arts
Culture course **0.34 2.00 1 876
Total(d) *1.94 2.53 7 1 108
Heritage(e) **0.70 0.43 2 188
Other culture
Audio equipment(f) **1.26 1.77 4 775
Televisions and home entertainment systems 7.36 8.52 25 3 731
Video players and recorders *1.10 0.86 4 377
Video equipment nec - **0.06 - 26
Blank video cassettes and digital media *1.20 0.85 4 372
Audiovisual equipment and personal computer repairs insurance **0.60 0.24 2 105
Photographic film and chemicals (including developing) **1.15 0.64 4 280
Total(g) 14.41 14.92 49 6 533
Total expenditure on culture 43.50 42.30 148 18 523
– nil or rounded to zero (including null cells)
* estimate has a relative standard error of 25% to 50% and should be used with caution
** estimate has a relative standard error greater than 50% and is considered too unreliable for general use
(a) Includes other printed material.
(b) Includes audio cassettes and tapes.
(c) Includes studio and other professional photography.
(d) Includes musical instruments and accessories, and cultural fees and charges nec.
(e) Comprises art gallery and museum, national park, and zoo fees and charges.
(f) Includes portable players and radios, CD players, integrated sound systems, amplifiers and tuner-amplifiers, speakers and audio
equipment nec.
(g) Includes television aerials, audiovisual equipment and parts nec, hire of televisions, video cassette/DVD/BluRay recorder or player,
repair and maintenance of audiovisual equipment, and photographic equipment.
Source: Household Expenditure Survey, Australia: Summary of Results: 2009–10 (cat. no. 6530.0).
30
7. Economic activity
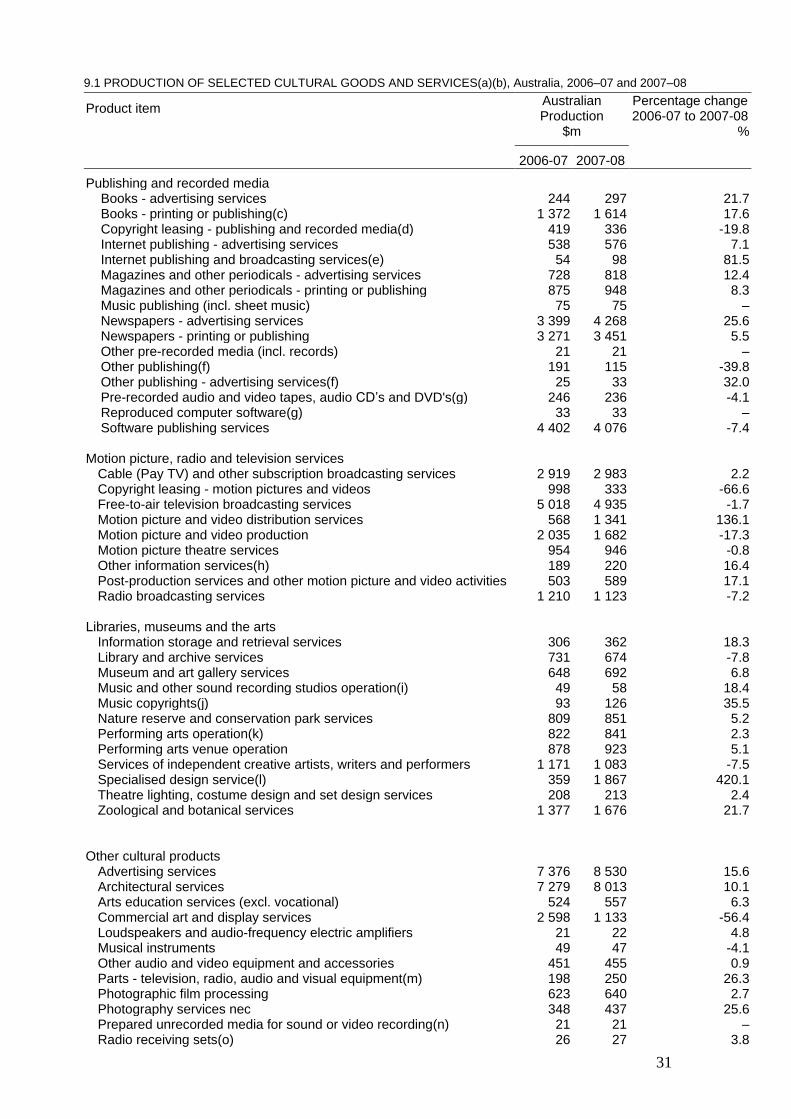
The cultural industries are diverse in nature. It is possible to determine their size in a number of ways, for example, by the number of firms in each industry or the number of people employed in each industry. Another measure to assess their relative size is the value of their production.
AUSTRALIA’S PRODUCTION OF CULTURAL GOODS AND SERVICES
A selection of cultural goods and services produced in Australia in 2006-07 and 2007-08 is
presented in Table 7.1. Of these goods and services, Advertising services had the highest
production value in both years ($7,376m in 2006-07 and $8,530m 2007-08), closely followed
by Architectural services ($7,279m in 2006-07 and $8,013m in 2007-08) (ABS, 2011c and
ABS, 2011d). The largest increase in production value between 2006-07 and 2007-08 was in
Specialised design services (up 420.1%) and the largest decrease was in Copyright leasing-
motion pictures and videos (down 66.6%).
31
9.1 PRODUCTION OF SELECTED CULTURAL GOODS AND SERVICES(a)(b), Australia, 2006–07 and 2007–08
Product item Australian Production
Percentage change 2006-07 to 2007-08
$m %
2006-07 2007-08
Publishing and recorded media
Books - advertising services 244 297 21.7 Books - printing or publishing(c) 1 372 1 614 17.6 Copyright leasing - publishing and recorded media(d) 419 336 -19.8 Internet publishing - advertising services 538 576 7.1 Internet publishing and broadcasting services(e) 54 98 81.5 Magazines and other periodicals - advertising services 728 818 12.4 Magazines and other periodicals - printing or publishing 875 948 8.3 Music publishing (incl. sheet music) 75 75 – Newspapers - advertising services 3 399 4 268 25.6 Newspapers - printing or publishing 3 271 3 451 5.5 Other pre-recorded media (incl. records) 21 21 – Other publishing(f) 191 115 -39.8 Other publishing - advertising services(f) 25 33 32.0 Pre-recorded audio and video tapes, audio CD’s and DVD's(g) 246 236 -4.1 Reproduced computer software(g) 33 33 – Software publishing services 4 402 4 076 -7.4
Motion picture, radio and television services
Cable (Pay TV) and other subscription broadcasting services 2 919 2 983 2.2 Copyright leasing - motion pictures and videos 998 333 -66.6 Free-to-air television broadcasting services 5 018 4 935 -1.7 Motion picture and video distribution services 568 1 341 136.1 Motion picture and video production 2 035 1 682 -17.3 Motion picture theatre services 954 946 -0.8 Other information services(h) 189 220 16.4 Post-production services and other motion picture and video activities 503 589 17.1 Radio broadcasting services 1 210 1 123 -7.2
Libraries, museums and the arts Information storage and retrieval services 306 362 18.3 Library and archive services 731 674 -7.8 Museum and art gallery services 648 692 6.8 Music and other sound recording studios operation(i) 49 58 18.4 Music copyrights(j) 93 126 35.5 Nature reserve and conservation park services 809 851 5.2 Performing arts operation(k) 822 841 2.3 Performing arts venue operation 878 923 5.1 Services of independent creative artists, writers and performers 1 171 1 083 -7.5 Specialised design service(l) 359 1 867 420.1 Theatre lighting, costume design and set design services 208 213 2.4 Zoological and botanical services 1 377 1 676 21.7
Other cultural products
Advertising services 7 376 8 530 15.6 Architectural services 7 279 8 013 10.1 Arts education services (excl. vocational) 524 557 6.3 Commercial art and display services 2 598 1 133 -56.4 Loudspeakers and audio-frequency electric amplifiers 21 22 4.8 Musical instruments 49 47 -4.1 Other audio and video equipment and accessories 451 455 0.9 Parts - television, radio, audio and visual equipment(m) 198 250 26.3 Photographic film processing 623 640 2.7 Photography services nec 348 437 25.6 Prepared unrecorded media for sound or video recording(n) 21 21 – Radio receiving sets(o) 26 27 3.8
32
Sound and video recording and reproducing equipment(p) 11 13 18.2 Television receiving sets 64 65 1.6 Video and other electronic media rental or hire 1 509 1 698 12.5
Total selected cultural goods and services 58 836 62 421 6.1
- nil or rounded to zero (including null cells)
nec not elsewhere classified
(a) At basic values - the net price received by the producer (after deducting any indirect taxes).
(b) Excludes products primary to: the recorded media manufacturing and publishing industry; the book and magazine wholesaling industry; the newspaper, book and stationery retailing industry; and the recorded music retailing industry (details for these industries are not available separately).
(c) Includes textbooks, encyclopaedias, travel guides and atlases.
(d) Includes newspapers, magazines and other periodicals, books and software.
(e) Includes radio, television, books, newspapers and magazines.
(f) Includes maps, greeting cards, postcards and calendars.
(g) Manufactured but not published by this business.
(h) Includes radio and television new collection and telephone based recorded information services.
(i) Includes pre-recorded radio programming services.
(j) Acquiring, registering and selling.
(k) Includes theatre restaurants and circuses.
(l) Includes fashion, interior and jewellery design.
(m) Includes parts for radio and television studio equipment, transmitters and radio transceivers.
(n) Includes blank CDs and magnetic tape.
(o) Includes car radios and clock radios. Excludes parts.
(p) Includes CD players and record players.
Note: Input-output tables are a disaggregation of the gross domestic product account showing inter-industry flows of goods and services. They are compiled using a large number of data sources, which are of varying quality and frequency. These processes result in individual components being modeled and adjusted, and this is particularly true for those with relatively small values. Users should therefore be very cautious when considering isolated fragments of the tables, especially details at the product level.
Source: Australian National Accounts: Input-Output Tables (Product details), 2006-07 and 2007-08 (cat. no. 5215.0.55.001).
ANNUAL INCOME OF CULTURAL INDUSTRIES IN THE NORTHERN TERRITORY
Detailed information on the economic aspects of a number of cultural industries was also collected in the Service Industries Surveys. Most of these surveys included only employing businesses (unlike data for the Australian National Accounts) and therefore do not reflect the activities of the whole industry. However, while non-employing businesses are quite numerous, their overall contribution to economic activity is quite small. A 1995–96 study showed that non-employing businesses in the industry division ‘cultural and recreational services’ accounted for about three-quarters of all businesses, but only 6% of operating income (ABS 1999). Consequently, this is not a serious limitation to the data collected by the Service Industries Surveys.
The surveys showed that employing businesses in the Museums and art galleries industry in the NT had a total income of $9.6m in 2007-08. Performing arts operation industries in the NT earned $3.0m in 2006-07, while businesses in the Public libraries industry earned $5.8m in 2003-04.
33
7.2 INCOME OF SELECTED CULTURAL INDUSTRIES(a), NT and Australia
NT Australia Percentage in
NT(b)
Year $m $m %
Museums and art galleries 2007–2008 9.6 998.4 1.0
Film and video production
Film and video post-production
2006–2007
2006–2007
np
np
1 584.2
444.0
np
np
Television services(c) 2006–2007 np 4 530.1 np
Performing arts operation 2006–2007 3.0 733.4 0.4
Performing arts venues 2006–2007 np 494.4 np
Public libraries(d) 2003–2004 5.8 545.2 1.1
Performing arts festivals 2002–2003 1.2 88.5 1.4
np not available for publication
(a) Excludes some parts of the cultural sector such as publishing and recorded media, the creative arts and archives. Also excludes
the income of non-employing businesses.
(b) According to the 2006 Census of Population and Housing, 1.0% of Australia’s population lived in the Northern Territory in August
2006.
(c) Commercial free-to-air broadcasters (excludes pay TV).
(d) This includes local government libraries only.
Sources: Museums, Australia, 2007-08 (cat. no. 8560.0); Television, Film and Video Production and Post-Production Services,
Australia, 2006-07 (cat. no. 8679.0); Performing Arts, Australia, 2002-03, 2006-07 (cat. no. 8697.0); Public Libraries,
Australia, 2003-04 (cat. no. 8561.0).
NUMBER OF CULTURAL BUSINESSES IN NORTHERN TERRITORY
The ABS (2010b) Counts of Australian Businesses, Including Entries and Exits, June 2007 to June 2009 presents counts of actively trading businesses. This excludes entities which:
had an active ABN but which did not have a GST role. While economically active, these entities are mainly businesses with asset holdings and consequent income flows but which do not trade in goods and services; and
had a GST role which had not returned a Business Activity statement (BAS) for more than five quarters or had returned a BAS reporting zero dollar amounts. These businesses are likely to be no longer trading.
Please note that counts from this data source are not comparable to data presented from the ABS Business Register in previous versions of this report. Over 400 businesses in the NT were actively trading within the cultural sector as at the start of the 2008–09 financial year. The largest numbers of businesses in the NT were in the Creative artists, musicians, writers and performers industry (97), Architectural services (66) and Other specialised design services (66). Most of the businesses in the NT (69%) had no employees.
7.3 BUSINESSES BY SELECTED INDUSTRY CLASS(a)(b), Employment Size Ranges, Start of 2008–09 financial year
Northern Territory
Australia
NT as a percentage of Australia
Non Employing
1-19 20+ Total Total (c)
no. no. no. no. no. %
Museums, heritage and libraries Museum operation – – – – 201 –
Zoological and botanic gardens operation 3 – – 3 117 2.6
Nature reserves and conservation parks operation 9 6 – 15 279 5.4
Libraries and archives – – – – 183 –
Literature and print media –
Newspaper publishing 3 – – 3 505 0.6
34
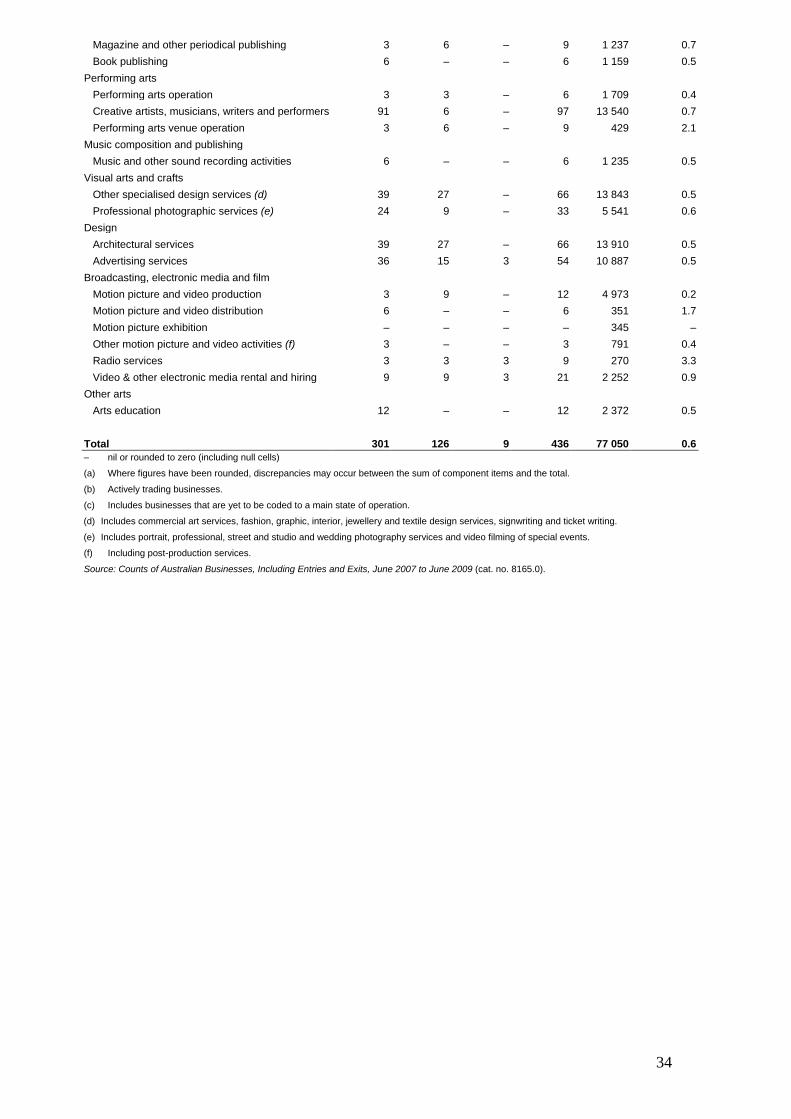
Magazine and other periodical publishing 3 6 – 9 1 237 0.7
Book publishing 6 – – 6 1 159 0.5
Performing arts
Performing arts operation 3 3 – 6 1 709 0.4
Creative artists, musicians, writers and performers 91 6 – 97 13 540 0.7
Performing arts venue operation 3 6 – 9 429 2.1
Music composition and publishing
Music and other sound recording activities 6 – – 6 1 235 0.5
Visual arts and crafts
Other specialised design services (d) 39 27 – 66 13 843 0.5
Professional photographic services (e) 24 9 – 33 5 541 0.6
Design
Architectural services 39 27 – 66 13 910 0.5
Advertising services 36 15 3 54 10 887 0.5
Broadcasting, electronic media and film
Motion picture and video production 3 9 – 12 4 973 0.2
Motion picture and video distribution 6 – – 6 351 1.7
Motion picture exhibition – – – – 345 –
Other motion picture and video activities (f) 3 – – 3 791 0.4
Radio services 3 3 3 9 270 3.3
Video & other electronic media rental and hiring 9 9 3 21 2 252 0.9
Other arts
Arts education 12 – – 12 2 372 0.5
Total 301 126 9 436 77 050 0.6
– nil or rounded to zero (including null cells)
(a) Where figures have been rounded, discrepancies may occur between the sum of component items and the total.
(b) Actively trading businesses.
(c) Includes businesses that are yet to be coded to a main state of operation.
(d) Includes commercial art services, fashion, graphic, interior, jewellery and textile design services, signwriting and ticket writing.
(e) Includes portrait, professional, street and studio and wedding photography services and video filming of special events.
(f) Including post-production services.
Source: Counts of Australian Businesses, Including Entries and Exits, June 2007 to June 2009 (cat. no. 8165.0).

35
TURNOVER OF CULTURAL BUSINESSES IN THE NORTHERN TERRITORY
The ABS (2010b) Counts of Australian Businesses, Including Entries and Exits, June 2007 to June 2009 presents turnover information of actively trading businesses. This excludes entities which:
had an active ABN but which did not have a GST role. While economically active, these entities are mainly businesses with asset holdings and consequent income flows but which do not trade in goods and services; and
had a GST role which had not returned a Business Activity statement (BAS) for more than five quarters or had returned a BAS reporting zero dollar amounts. These businesses are likely to be no longer trading.
Please note that counts from this data source are not comparable to data presented from the ABS Business Register in previous versions of this report. Of the 436 businesses in the NT actively trading within the cultural sector as at the start of the 2008–09 financial year, 174 (40%) were turning over between $50,000 and $200,000 per annum.

36
7.4 BUSINESSES BY SELECTED INDUSTRY CLASS(a)(b), Annual turnover ranges, Start of 2008–09 financial year
Northern Territory
Australia
NT as a percentage of Australia
Zero to $50k
$50k to less than
$200k
$200k to less than
$2m
$2m or more
Total Total (c)
no. no. no. no. no. no. %
Museums, heritage and libraries
Museum operation – – – – – 201 –
Zoological and botanic gardens operation 3 – – – 3 117 2.6
Nature reserves and conservation parks operation 6 – 9 – 15 279 5.4
Libraries and archives – – – – – 183 –
Literature and print media
Newspaper publishing – 3 – – 3 505 0.6
Magazine and other periodical publishing 3 3 3 – 9 1 237 0.7
Book publishing 6 – – – 6 1 159 0.5
Other publishing(d) – – – – – 174 –
Performing arts
Performing arts operation 3 – 3 – 6 1 709 0.4
Creative artists, musicians, writers and performers 43 48 6 – 97 13 540 0.7
Performing arts venue operation – 6 – 3 9 429 2.1
Music composition and publishing
Music publishing – – – – – 198 –
Music and other sound recording activities – 6 – – 6 1 235 0.5
Visual arts and crafts
Other specialised design services (e) 18 27 21 – 66 13 843 0.5
Professional photographic services (f) 12 15 6 – 33 5 541 0.6
Design
Architectural services 15 27 24 – 66 13 910 0.5
Advertising services 15 18 21 – 54 10 887 0.5
Broadcasting, electronic media and film
Motion picture and video production 3 – 9 – 12 4 973 0.2
Motion picture and video distribution 3 3 – – 6 351 1.7
Motion picture exhibition – – – – – 345 –
Other motion picture and video activities(g) 3 – – – 3 791 0.4
Radio broadcasting – 3 3 3 9 270 3.3
Free-to-air television broadcasting – – – – – 171 –
Cable and other subscription broadcasting – – – – – 108 –
Video & other electronic media rental and hiring – 12 9 – 21 2 252 0.9
Other arts
Arts education 9 3 – – 12 2 372 0.5
Reproduction of recorded media – – – – – 270 –
Total 142 174 114 6 436 77 050 0.6
– nil or rounded to zero (including null cells)
(a) Where figures have been rounded, discrepancies may occur between the sum of component items and the total.
(b) Actively trading businesses.
(c) Includes businesses that are yet to be coded to a main state of operation.
(d) Except software, music and internet.
(e) Includes commercial art services, fashion, graphic, interior, jewellery and textile design services, signwriting and ticket writing.
(f) Includes portrait, professional, street and studio and wedding photography services and video filming of special events.
(g) Including post-production services
Source: Counts of Australian Businesses, Including Entries and Exits, June 2007 to June 2009 (cat. no. 8165.0).
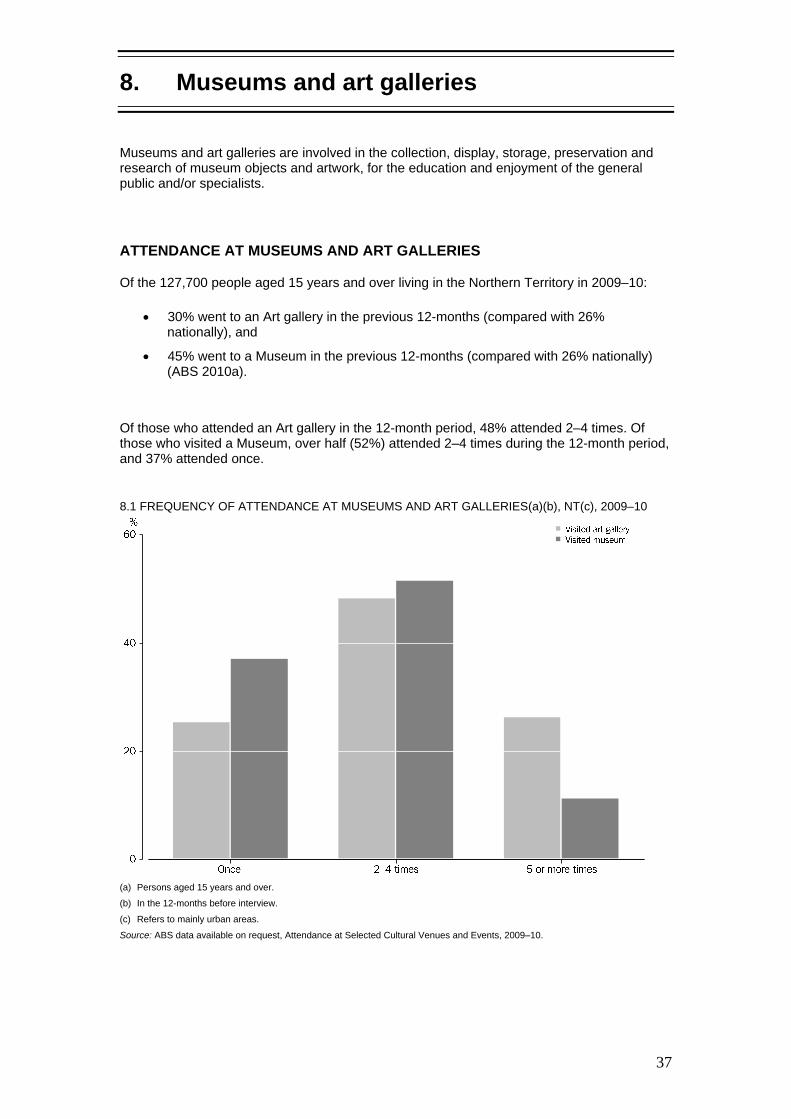
37
8. Museums and art galleries
Museums and art galleries are involved in the collection, display, storage, preservation and research of museum objects and artwork, for the education and enjoyment of the general public and/or specialists.
ATTENDANCE AT MUSEUMS AND ART GALLERIES
Of the 127,700 people aged 15 years and over living in the Northern Territory in 2009–10:
30% went to an Art gallery in the previous 12-months (compared with 26% nationally), and
45% went to a Museum in the previous 12-months (compared with 26% nationally) (ABS 2010a).
Of those who attended an Art gallery in the 12-month period, 48% attended 2–4 times. Of those who visited a Museum, over half (52%) attended 2–4 times during the 12-month period, and 37% attended once.
8.1 FREQUENCY OF ATTENDANCE AT MUSEUMS AND ART GALLERIES(a)(b), NT(c), 2009–10
(a) Persons aged 15 years and over.
(b) In the 12-months before interview.
(c) Refers to mainly urban areas.
Source: ABS data available on request, Attendance at Selected Cultural Venues and Events, 2009–10.
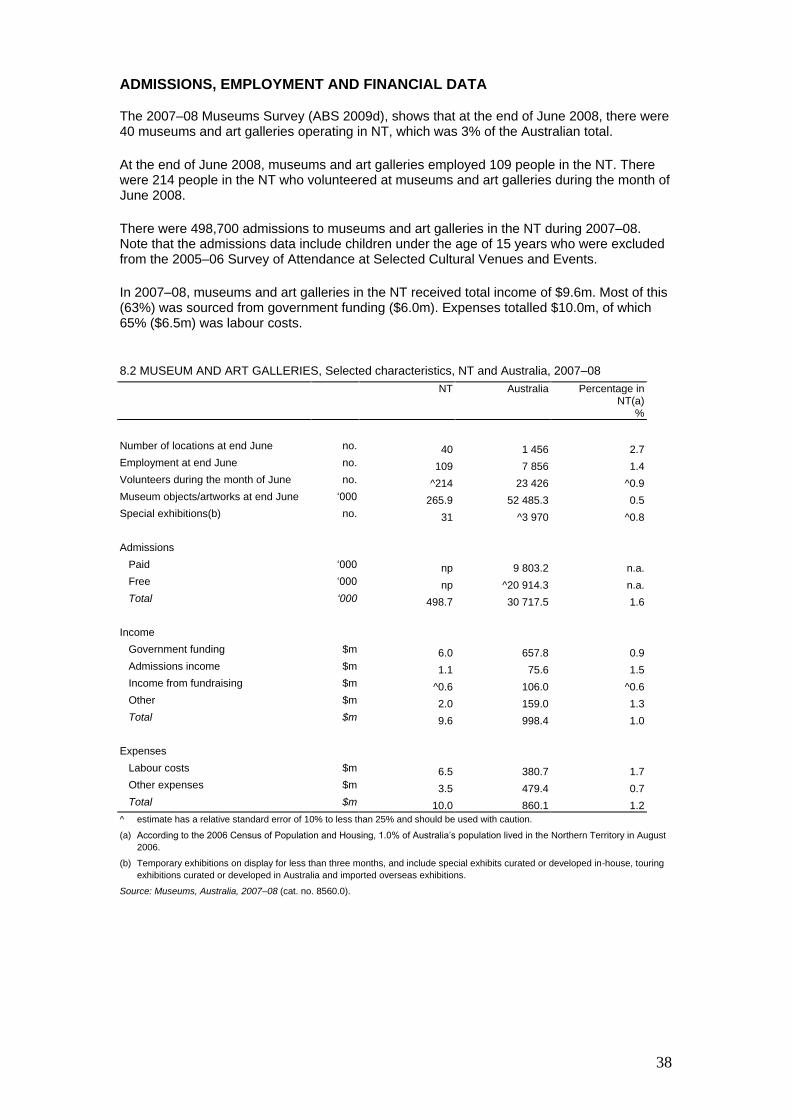
38
ADMISSIONS, EMPLOYMENT AND FINANCIAL DATA
The 2007–08 Museums Survey (ABS 2009d), shows that at the end of June 2008, there were 40 museums and art galleries operating in NT, which was 3% of the Australian total.
At the end of June 2008, museums and art galleries employed 109 people in the NT. There were 214 people in the NT who volunteered at museums and art galleries during the month of June 2008.
There were 498,700 admissions to museums and art galleries in the NT during 2007–08. Note that the admissions data include children under the age of 15 years who were excluded from the 2005–06 Survey of Attendance at Selected Cultural Venues and Events.
In 2007–08, museums and art galleries in the NT received total income of $9.6m. Most of this (63%) was sourced from government funding ($6.0m). Expenses totalled $10.0m, of which 65% ($6.5m) was labour costs.
8.2 MUSEUM AND ART GALLERIES, Selected characteristics, NT and Australia, 2007–08
NT Australia Percentage in NT(a)
%
Number of locations at end June no. 40 1 456 2.7
Employment at end June no. 109 7 856 1.4
Volunteers during the month of June no. ^214 23 426 ^0.9
Museum objects/artworks at end June ‘000 265.9 52 485.3 0.5
Special exhibitions(b) no. 31 ^3 970 ^0.8
Admissions
Paid ‘000 np 9 803.2 n.a.
Free ‘000 np ^20 914.3 n.a.
Total ‘000 498.7 30 717.5 1.6
Income
Government funding $m 6.0 657.8 0.9
Admissions income $m 1.1 75.6 1.5
Income from fundraising $m ^0.6 106.0 ^0.6
Other $m 2.0 159.0 1.3
Total $m 9.6 998.4 1.0
Expenses
Labour costs $m 6.5 380.7 1.7
Other expenses $m 3.5 479.4 0.7
Total $m 10.0 860.1 1.2
^ estimate has a relative standard error of 10% to less than 25% and should be used with caution.
(a) According to the 2006 Census of Population and Housing, 1.0% of Australia’s population lived in the Northern Territory in August
2006.
(b) Temporary exhibitions on display for less than three months, and include special exhibits curated or developed in-house, touring
exhibitions curated or developed in Australia and imported overseas exhibitions.
Source: Museums, Australia, 2007–08 (cat. no. 8560.0).
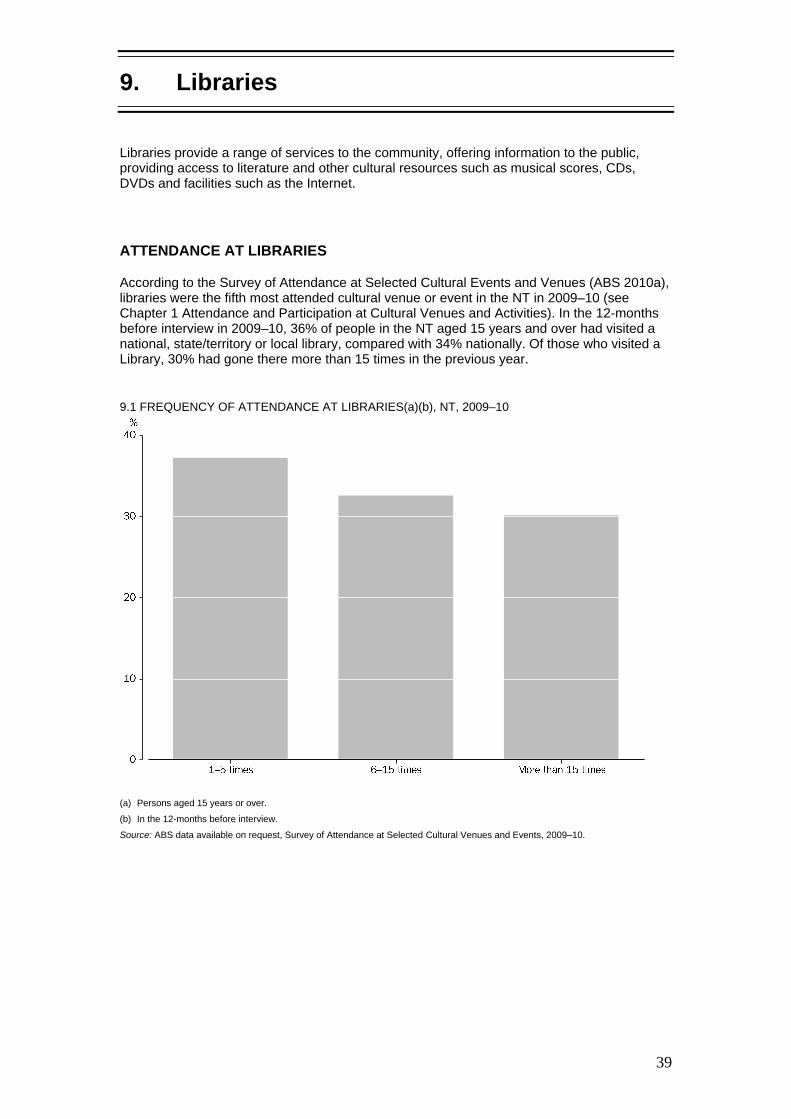
39
9. Libraries
Libraries provide a range of services to the community, offering information to the public, providing access to literature and other cultural resources such as musical scores, CDs, DVDs and facilities such as the Internet.
ATTENDANCE AT LIBRARIES
According to the Survey of Attendance at Selected Cultural Events and Venues (ABS 2010a), libraries were the fifth most attended cultural venue or event in the NT in 2009–10 (see Chapter 1 Attendance and Participation at Cultural Venues and Activities). In the 12-months before interview in 2009–10, 36% of people in the NT aged 15 years and over had visited a national, state/territory or local library, compared with 34% nationally. Of those who visited a Library, 30% had gone there more than 15 times in the previous year.
9.1 FREQUENCY OF ATTENDANCE AT LIBRARIES(a)(b), NT, 2009–10
(a) Persons aged 15 years or over.
(b) In the 12-months before interview.
Source: ABS data available on request, Survey of Attendance at Selected Cultural Venues and Events, 2009–10.

40
PUBLIC LIBRARIES
National
The National Library of Australia (NLA) is the country's largest reference library and its role is to ensure that documentary resources of national significance relating to Australia and the Australian people – as well as significant non-Australian library materials – are collected, preserved and made accessible. The NLA website provides online visitors with access to information about more than 5,400 Australian libraries, their collections and services via the Australian Libraries Gateway (State Library of Queensland 2011). Northern Territory
According the Australian Public Libraries Statistical Report, 2009-10 (State Library of Queensland 2011) as at June 2010 there were just under 1,500 public libraries in Australia. Thirty-three were located in the Northern Territory, with all of these providing public access to the Internet. There were over 10m registered library users in Australia in 2009-10 with 71,458 registered in the NT. Total expenditure on public libraries in Australia was $935.9m in 2009-10, with the NT responsible for $9.3m of this expenditure.
9.2 PUBLIC LIBRARIES(a), 2009-10
Units NSW Vic. Qld SA WA Tas. NT ACT Australia
Libraries
Fixed point no. 374 261 327 136 232 46 33 9 1 418
Mobile no. 23 26 18 7 – – – 2 76
Total 397 287 345 143 232 46 33 11 1 494
Staff
Qualified librarians, FTE(b) no. 827.4 614.1 392.0 131.6 307.7 na 16.2 27.5 2 316.5
Total staff, FTE(b) no. 2 365.9 2 723.5 1 447.4 765.1 970.7 na 94.3 94.9 8 461.7
Public Internet access
Service points with Internet terminals no. 397 287 300 136 213 45 33 9 1 420
Service points with Internet terminals % 100 100 87 95 92 98 100 82 95
Internet terminals provided no. 2 735 1 951 2 023 1 093 819 391 103 78 9 193
Registered library users ‘000 3 301.1 2 595.6 1 918.9 873.0 1 020.6 137.2 71.5 180.2 10 098.0
Expenditure on public library services $m 312.9 210.1 186.0 84.0 102.2 19.2 9.3 12.3 935.9
- nil or rounded to zero (including null cells)
na not available
(a) As at 30 June 2010.
(b) FTE = Full Time Equivalent.
Source: Australian Public Libraries Statistical Report 2009-10, Public Library Services, State Library of Queensland, September 2011.

41
10. Cultural funding by government and business
Governments provide considerable financial support to organisations involved in culture. This support may include direct funding, subsidies and in some instances tax concessions. Governments also provide grants to individuals.
AUSTRALIAN GOVERNMENT FUNDING
Cultural funding is provided by all three tiers of government – Australian; state and territory; and local government. Data on cultural funding by the Australian Government are only collected at the national level. As a state or territory breakdown of this funding is not available, it is not possible to determine the amount of Australian Government funding spent in NT.
Nationwide, the Australian Government provided funding of $2,457.0m for culture in 2009–10, which equated to $110.92 per person in Australia (ABS 2011e). Over half ($1,295.0m) of this funding was provided to Radio and television services.
In 2009–10, recurrent expenditure accounted for 90% ($2,218.4m) of the total cultural funding by the Australian Government.
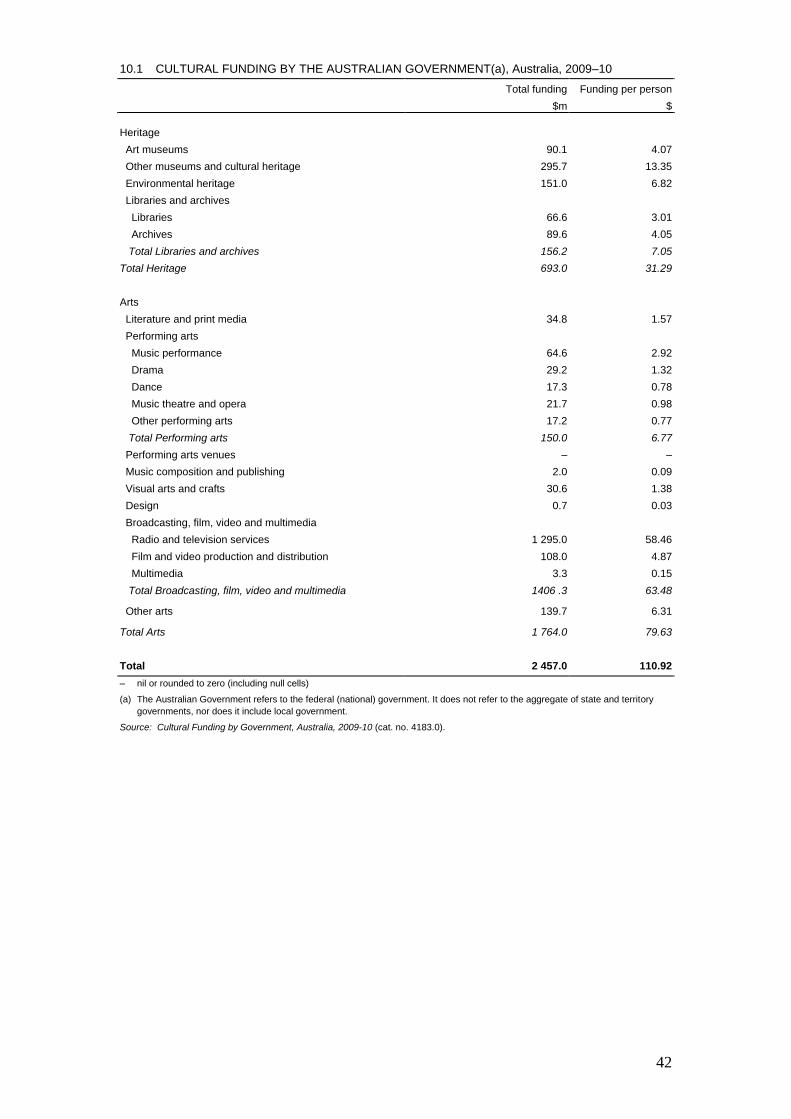
42
10.1 CULTURAL FUNDING BY THE AUSTRALIAN GOVERNMENT(a), Australia, 2009–10
Total funding Funding per person
$m $
Heritage
Art museums 90.1 4.07
Other museums and cultural heritage 295.7 13.35
Environmental heritage 151.0 6.82
Libraries and archives
Libraries 66.6 3.01
Archives 89.6 4.05
Total Libraries and archives 156.2 7.05
Total Heritage 693.0 31.29
Arts
Literature and print media 34.8 1.57
Performing arts
Music performance 64.6 2.92
Drama 29.2 1.32
Dance 17.3 0.78
Music theatre and opera 21.7 0.98
Other performing arts 17.2 0.77
Total Performing arts 150.0 6.77
Performing arts venues – –
Music composition and publishing 2.0 0.09
Visual arts and crafts 30.6 1.38
Design 0.7 0.03
Broadcasting, film, video and multimedia
Radio and television services 1 295.0 58.46
Film and video production and distribution 108.0 4.87
Multimedia 3.3 0.15
Total Broadcasting, film, video and multimedia 1406 .3 63.48
Other arts 139.7 6.31
Total Arts 1 764.0 79.63
Total 2 457.0 110.92
– nil or rounded to zero (including null cells)
(a) The Australian Government refers to the federal (national) government. It does not refer to the aggregate of state and territory
governments, nor does it include local government.
Source: Cultural Funding by Government, Australia, 2009-10 (cat. no. 4183.0).

43
TERRITORY GOVERNMENT FUNDING
In 2009–10, cultural funding provided by the NT Government totalled $89.3m, which equated to $391.89 per person in the NT. Capital expenditure accounted for 15% ($13.5m) of this funding.
Total cultural funding by the NT Government increased by 8% between 2008–09 and 2009–10.
10.2 CULTURAL FUNDING BY THE NT GOVERNMENT, 2007–08, 2008–09 and 2009–10
2007-08 2008-09 2009-10
Category $m $m $m
Heritage
Art museums 6.6 6.6 7.3
Other museums and cultural heritage 9.8 11.4 12.4
Environmental heritage 44.1 42.5 49.3
Libraries and archives
Libraries 12.0 10.4 10.4
Archives 1.4 1.3 1.5
Total Libraries and archives 13.3 11.7 11.9
Total Heritage 73.8 72.3 80.9
Arts
Literature and print media 0.9 0.1 0.3
Performing arts
Music performance 0.7 1.0 1.8
Drama 0.5 0.3 0.1
Dance 0.4 0.4 0.4
Music theatre and opera – – –
Other performing arts 0.1 0.1 0.3
Total Performing arts 1.7 1.8 2.6
Performing arts venues 1.9 1.2 2.0
Music composition and publishing – – –
Visual arts and crafts 1.1 1.0 0.6
Design – – –
Broadcasting, film, video and multimedia
Radio and television services – – –
Film and video production and distribution 0.4 0.4 0.2
Multimedia 0.2 – –
Total Broadcasting, film, video and multimedia 0.6 0.4 0.2
Other arts 4.3 5.5 2.7
Total Arts 10.6 10.1 8.5
Total 84.4 82.4 89.3
– nil or rounded to zero (including null cells)
Source: Statistics Working Group, 2009-10, Cultural Funding in Australia: Three Tiers of Government, February 2012.
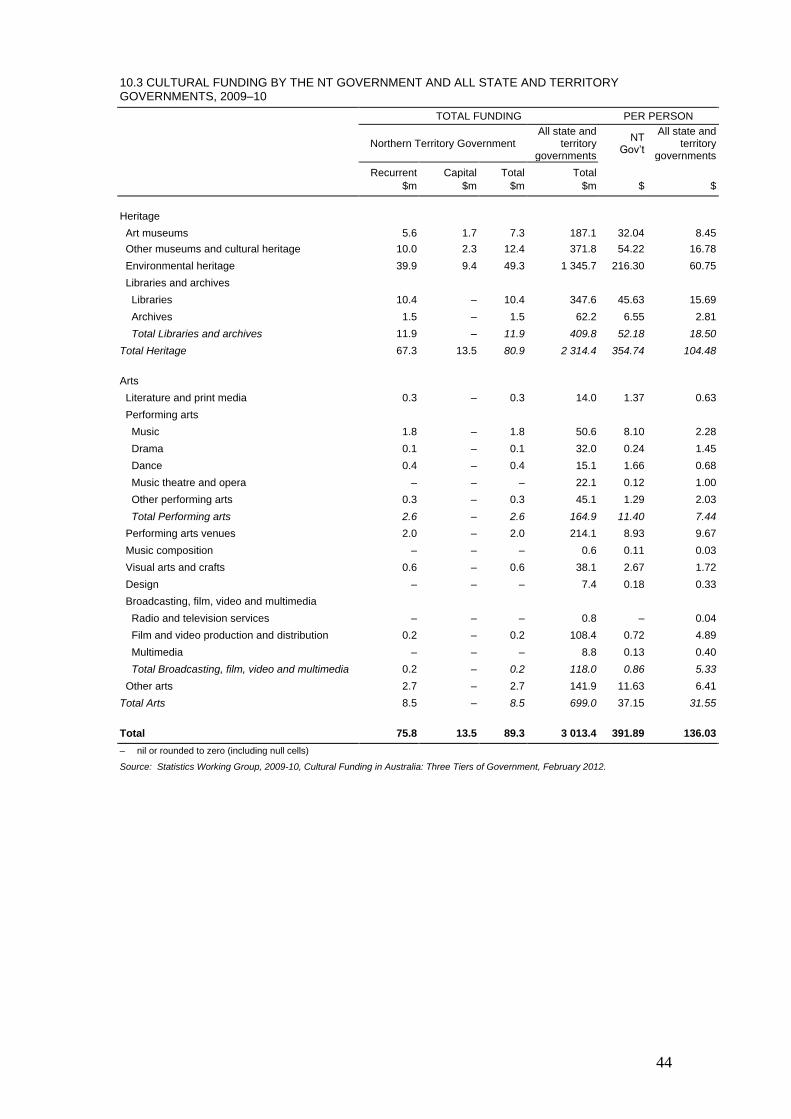
44
10.3 CULTURAL FUNDING BY THE NT GOVERNMENT AND ALL STATE AND TERRITORY GOVERNMENTS, 2009–10
TOTAL FUNDING PER PERSON
Northern Territory Government
All state and territory
governments
NT Gov’t
All state and territory
governments
Recurrent Capital Total Total
$m $m $m $m $ $
Heritage
Art museums 5.6 1.7 7.3 187.1 32.04 8.45
Other museums and cultural heritage 10.0 2.3 12.4 371.8 54.22 16.78
Environmental heritage 39.9 9.4 49.3 1 345.7 216.30 60.75
Libraries and archives
Libraries 10.4 – 10.4 347.6 45.63 15.69
Archives 1.5 – 1.5 62.2 6.55 2.81
Total Libraries and archives 11.9 – 11.9 409.8 52.18 18.50
Total Heritage 67.3 13.5 80.9 2 314.4 354.74 104.48
Arts
Literature and print media 0.3 – 0.3 14.0 1.37 0.63
Performing arts
Music 1.8 – 1.8 50.6 8.10 2.28
Drama 0.1 – 0.1 32.0 0.24 1.45
Dance 0.4 – 0.4 15.1 1.66 0.68
Music theatre and opera – – – 22.1 0.12 1.00
Other performing arts 0.3 – 0.3 45.1 1.29 2.03
Total Performing arts 2.6 – 2.6 164.9 11.40 7.44
Performing arts venues 2.0 – 2.0 214.1 8.93 9.67
Music composition – – – 0.6 0.11 0.03
Visual arts and crafts 0.6 – 0.6 38.1 2.67 1.72
Design – – – 7.4 0.18 0.33
Broadcasting, film, video and multimedia
Radio and television services – – – 0.8 – 0.04
Film and video production and distribution 0.2 – 0.2 108.4 0.72 4.89
Multimedia – – – 8.8 0.13 0.40
Total Broadcasting, film, video and multimedia 0.2 – 0.2 118.0 0.86 5.33
Other arts 2.7 – 2.7 141.9 11.63 6.41
Total Arts 8.5 – 8.5 699.0 37.15 31.55
Total 75.8 13.5 89.3 3 013.4 391.89 136.03
– nil or rounded to zero (including null cells)
Source: Statistics Working Group, 2009-10, Cultural Funding in Australia: Three Tiers of Government, February 2012.
45
LOCAL GOVERNMENT FUNDING
Cultural funding by local government in the NT was $4.8m in 2009–10, which equated to $21.19 per person in the NT. The main recipient of funding was Libraries, which received 35% ($1.7m) of total local government funding in 2009-10. Local government data are classified according to the Local Government Purpose Classification (LGPC).
EXPENDITURE ON CULTURE BY BUSINESS
The Australian Major Performing Arts Group (AMPAG) report Tracking Changes in Corporate Sponsorship and Private Donations 2011 tracks and analyses levels of corporate sponsorship and private donations for the major performing arts sector from the years 2001 to 2010.
According to this report, major performing arts companies reported $54.6m in corporate sponsorship and private donation revenue in 2010 compared with $48.8m in 2009 (AMPAG 2011). Of this, $26.8m (49%) was received in the form of corporate sponsorship, $25.2m (46%) from donations and a net amount of $2.6m (5%) was raised from fundraising events. In 2001 the ratios were 72% from corporate sponsorship and 25% from donations.

46
11. The performing arts
The term ‘performing arts’ covers a range of art forms including theatre, opera, music theatre, dance, popular and classical music concerts and festivals. There are also businesses which support the performing arts industry in terms of venues, costume and set design and ticketing.
ATTENDANCE AT PERFORMING ARTS
The 2009–10 ABS Survey of Attendance at Selected Cultural Venues and Events showed that in the previous 12-months, of the 127,700 people living in the Northern Territory aged 15 years and over:
8% had been to a Classical music concert (compared with 9% nationally);
32% had been to a Popular music concert (compared with 30% nationally);
15% had been to a Dance performance (compared with 10% nationally);
12% had been to a Musical or opera (compared with 16% nationally); and
23% had been to Other performing arts events (compared with 17% nationally)
(ABS 2010a).
Persons in the NT aged 15 years and over recorded an attendance rate consistent with the national rate for Theatre performances (16%).
Of those who attended the performing arts events, most people only went once in the previous 12–months, with the exception of Classical music concerts where most people attended 2–4 times in the previous 12-months.
11.1 FREQUENCY OF ATTENDANCE AT PERFORMING ARTS(a)(b), NT, 2009–10
(a) Persons aged 15 years or over.
(b) In the 12-months before interview.
Source: ABS data available on request, Attendance at Selected Cultural Venues and Events, 2009–10.

47
PERFORMING ARTS OPERATION
The 2006–07 Performing Arts Survey (ABS 2008c) covered employing and significant non-employing organisations in Australia that generated their income predominantly from live theatrical or musical presentations (including concerts, opera, ballet or drama).
At the end of June 2007, there were 12 performing arts operation businesses in the NT which generated a total of $3.0m of income. Performing arts operation businesses staged 250 paid performances in the NT in 2006–07, which generated over 55,000 paid admissions.
11.2 PERFORMING ARTS OPERATION, Selected characteristics, NT and Australia, 2006–07
NT Australia Percentage in NT(a)
%
Number of organisations at end June 2007
For profit no. np 381 np
Not for profit no. np 345 np
Total no. 12 726 1.7
Number of paid performances(b)(c) no. 250 41 179 0.6
Number of paid attendances(b)(d) ‘000 55.7 11 357.2 0.5
Employment at end June 2007 no. 46 6 569 0.7
Wages and salaries $m 0.9 219.1 0.4
Total income $m 3.0 733.4 0.4
np not available for publication but included in totals where applicable, unless otherwise indicated.
(a) According to the 2006 Census of Population and Housing, 1.0% of Australia’s population lived in the Northern Territory in August
2006.
(b) Paid performances and paid attendances are counted according to the state in which they are performed.
(c) Excludes overseas performances.
(d) Excludes overseas attendances.
Source: Performing Arts, Australia, 2006–07 (cat. no. 8697.0).
PERFORMING ARTS VENUE INDUSTRIES
At the end of June 2007, there were 3 businesses in the Northern Territory in the Performing arts venues industry which operated 4 Performing art spaces.

48
12. Cinema, film and video
Industries related to cinema, film and video encompass a range of activities, including the production of feature films, TV series, documentaries, music videos and commercials, as well as film distribution, video hire and the operation of cinemas.
ATTENDANCE AT CINEMAS
In the Northern Territory, 69% of people aged 15 years and over had been to the Cinema in the 12-months before interview in 2009–10 (compared with 67% nationally) (ABS 2010a). Of those who went to the Cinema, over half went 1-5 times (57%), while 43% went more than 5 times in the year.
12.1 FREQUENCY OF ATTENDANCE AT CINEMAS(a)(b), NT, 2009–10
(a) Persons aged 15 years and over.
(b) In the 12-months before interview.
Source: ABS data available on request, Attendance at Selected Cultural Venues and Events, 2009–10.
SCREEN AUSTRALIA
The Screen Australia annual Drama Report (previously the National Survey of Feature Film and TV Drama Production) tracks the production of feature films and TV drama programs (mini-series, telemovies and series/serials) over a financial year. The Screen Australia survey provides data on production activity categorised by type of film, by budget range and by sources of finance. Results from this survey are available from http://www.screenaustralia.gov.au/research/
49
13. Sources of data about culture
NATIONAL CENTRE FOR CULTURE AND RECREATION STATISTICS (NCCRS)
The NCCRS is the unit within the Australian Bureau of Statistics (ABS) which provides a national focus on culture, recreation and leisure statistics. Its tasks involve the coordination and drawing together of results of statistical work from ABS and other sources, and the statistical analyses of relevant data. The NCCRS is also involved in the development and the conduct of new and existing collections. Finally, NCCRS also has the role of the development and application of appropriate classifications and standards.
More information about the NCCRS is available from the Culture theme page on the ABS website <www.abs.gov.au>. (Select ‘Topics @ a Glance’ from the menu along the top of the Home Page, then select ‘Culture’)
A list of ABS publications containing culture and recreation data are available on the theme page, along with links to other arts and culture websites.
SELECTED ARTS AND CULTURE WEBSITES
The following websites have further information about culture:
Australia Council www.australiacouncil.gov.au
Screen Australia www.screenaustralia.gov.au
Statistics Working Group www.culturaldata.gov.au
Culture and Recreation Portal www.cultureandrecreation.gov.au
Department of Regional Australia, Local Government, Arts and Sport http://www.regional.gov.au/
50
LIST OF PUBLICATIONS
The publications referenced in this report are:
ABS 1999, Information Paper: The Expanded Use of Business Income Tax Data in ABS Economic Statistics – Experimental Estimates for Selected Industries 1994–95
and 1995–96, 1995–96 (cat. no. 5672.0) ABS Canberra. www.abs.gov.au/ausstats/[email protected]/mf/5672.0 ABS 2005, Public Libraries, Australia, 2003–04 (cat. no. 8561.0) ABS Canberra. www.abs.gov.au/ausstats/[email protected]/mf/8561.0 ABS 2006a, Australian Standard Geographical Classification, July 2006 (cat. no. 1216.0) ABS Canberra. http://www.abs.gov.au/AUSSTATS/[email protected]/7d12b0f6763c78caca257061001cc588/8b8abc8ec62d8f46ca2570ae000dd3b5!OpenDocument ABS 2006b, Household Expenditure Survey, Australia: Summary of Results, 2003-04 (cat. no. 6530.0) ABS Canberra. http://www.abs.gov.au/AUSSTATS/[email protected]/allprimarymainfeatures/8C2472C665DF480CCA25790200158ED7?opendocument ABS 2007a, Work in Selected Culture and Leisure Activities, Australia, April 2007 (cat. no. 6281.0) ABS Canberra. www.abs.gov.au/ausstats/[email protected]/mf/6281.0 ABS 2007b, Housing and Infrastructure in Aboriginal and Torres Strait Islander Communities, Australia, 2006 (cat. no. 4710.0) ABS Canberra. www.abs.gov.au/ausstats/[email protected]/mf/4710.0 ABS 2008a, How Australians Use Their Time, Australia, 2006 (cat. no. 4153.0) ABS Canberra. www.abs.gov.au/ausstats/[email protected]/mf/4153.0 ABS 2008b, Television, Film and Video Production and Post-Production Services, Australia, 2006–07 (cat. no. 8679.0) ABS Canberra. www.abs.gov.au/ausstats/[email protected]/mf/8679.0 ABS 2008c, Performing Arts, Australia, 2006–07 (cat. no. 8697.0) ABS Canberra. www.abs.gov.au/ausstats/[email protected]/mf/8697.0 ABS 2008d, Australian Culture and Leisure Classifications, 2008 (cat. no. 4902.0) ABS Canberra. www.abs.gov.au/ausstats/[email protected]/mf/4902.0 ABS 2009a, Children’s Participation in Cultural and Leisure Activities, April 2009 (cat. no. 4901.0) ABS Canberra. www.abs.gov.au/ausstats/[email protected]/mf/4901.0 ABS 2009b. National Aboriginal and Torres Strait Islander Social Survey, 2008 (cat. no. 4714.0) ABS Canberra. www.abs.gov.au/ausstats/[email protected]/mf/4714.0 ABS 2009c, Museums, Australia, 2007–08 (cat. no. 8560.0) ABS Canberra. www.abs.gov.au/ausstats/[email protected]/mf/8560.0 ABS 2010a, Attendance at Selected Cultural Venues and Events, Australia, 2009–10 (cat. no. 4114.0) ABS Canberra. www.abs.gov.au/ausstats/[email protected]/mf/4114.0
51
ABS, 2010b, Counts of Australian Businesses, Including Entries and Exits, June 2007 to June 2009 (cat. no. 8165.0) ABS Canberra. www.abs.gov.au/ausstats/[email protected]/mf/8165.0 ABS 2011a, Voluntary Work, Australia, 2010 (cat. no. 4441.0) ABS Canberra. www.abs.gov.au/ausstats/[email protected]/mf/4441.0 ABS 2011b, Household Expenditure Survey, Australia: Summary of Results, 2009–10 (cat. no. 6530.0) ABS Canberra. http://www.abs.gov.au/ausstats/[email protected]/mf/6530.0 ABS 2011c, Australian National Accounts: Input-Output Tables (Product Details) – Electronic Publication, 2006–07 (cat. no. 5215.0.55.001) ABS Canberra. www.abs.gov.au/ausstats/[email protected]/mf/5215.0.55.001 ABS 2011d, Australian National Accounts: Input-Output Tables (Product Details) – Electronic Publication, 2007–08 (cat. no. 5215.0.55.001) ABS Canberra. www.abs.gov.au/ausstats/[email protected]/mf/5215.0.55.001 ABS 2011e, Cultural Funding by Government, Australia, 2009–10 (cat. no. 4183.0) ABS Canberra. www.abs.gov.au/ausstats/[email protected]/mf/4183.0 AMPAG 2011, Tracking Changes in Corporate Sponsorship and Private Donations 2011. http://www.ampag.com.au/_literature_94255/Tracking_Changes_in_Corporate_Sponsorship_and_Private_Donations_2011
AMR Interactive 2011, Get Reading! Campaign Effectiveness Research. http://www.australiacouncil.gov.au/__data/assets/pdf_file/0015/102453/GR10_-_Final_Research_Report.pdf
State Library of Queensland 2011, Australian Public Libraries Statistical Report, 2009-10, Public and Indigenous Library Services, State Library of Queensland, September 2011. http://www.nsla.org.au/sites/default/files/publications/NSLA.Statistics Australian.Public.Libraries.Statistics_2009-10.pdf
Starcom 2008, Books Alive 2008 – reader research. http://www.australiacouncil.gov.au/__data/assets/pdf_file/0004/48658/Books_Alive_-_reader_research1.pdf Statistics Working Group (SWG), 2012, Cultural Funding in Australia: Three Tiers of Government, 2009-10.
Tourism Research Australia 2005, Cultural Tourism in Regions of Australia. http://www.culturaldata.gov.au/sites/www.culturaldata.gov.au/files/Cultural_tourism_in_regions_of_Australia.pdf
Tourism Research Australia 2009, Snapshots 2009, Cultural and Heritage Tourism in Australia. http://www.ret.gov.au/tourism/Documents/tra/Snapshots%20and%20Factsheets/Cultural_09_FINAL.pdf
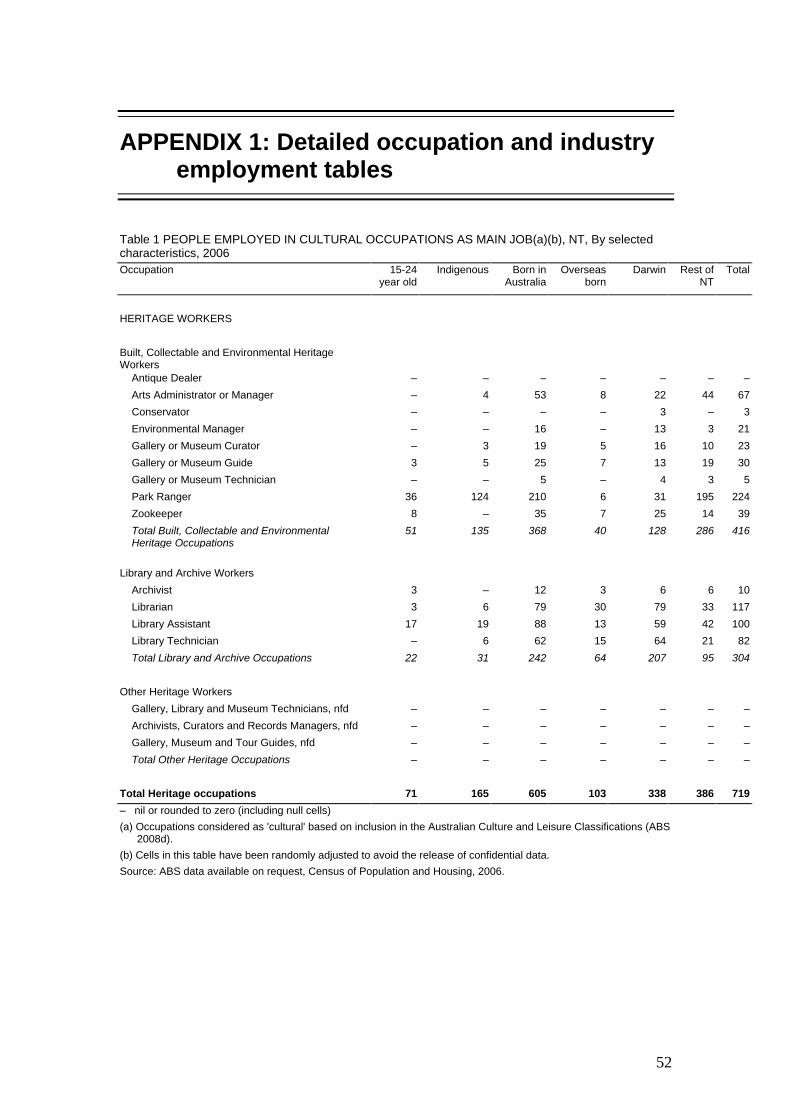
52
APPENDIX 1: Detailed occupation and industry employment tables
Table 1 PEOPLE EMPLOYED IN CULTURAL OCCUPATIONS AS MAIN JOB(a)(b), NT, By selected characteristics, 2006
Occupation 15-24 year old
Indigenous Born in Australia
Overseas born
Darwin Rest of NT
Total
HERITAGE WORKERS
Built, Collectable and Environmental Heritage Workers
Antique Dealer – – – – – – – Arts Administrator or Manager – 4 53 8 22 44 67
Conservator – – – – 3 – 3
Environmental Manager – – 16 – 13 3 21
Gallery or Museum Curator – 3 19 5 16 10 23
Gallery or Museum Guide 3 5 25 7 13 19 30
Gallery or Museum Technician – – 5 – 4 3 5
Park Ranger 36 124 210 6 31 195 224
Zookeeper 8 – 35 7 25 14 39
Total Built, Collectable and Environmental Heritage Occupations
51 135 368 40 128 286 416
Library and Archive Workers
Archivist 3 – 12 3 6 6 10
Librarian 3 6 79 30 79 33 117
Library Assistant 17 19 88 13 59 42 100
Library Technician – 6 62 15 64 21 82
Total Library and Archive Occupations 22 31 242 64 207 95 304
Other Heritage Workers
Gallery, Library and Museum Technicians, nfd – – – – – – – Archivists, Curators and Records Managers, nfd – – – – – – – Gallery, Museum and Tour Guides, nfd – – – – – – – Total Other Heritage Occupations – – – – – – –
Total Heritage occupations 71 165 605 103 338 386 719
– nil or rounded to zero (including null cells)
(a) Occupations considered as 'cultural' based on inclusion in the Australian Culture and Leisure Classifications (ABS 2008d).
(b) Cells in this table have been randomly adjusted to avoid the release of confidential data.
Source: ABS data available on request, Census of Population and Housing, 2006.
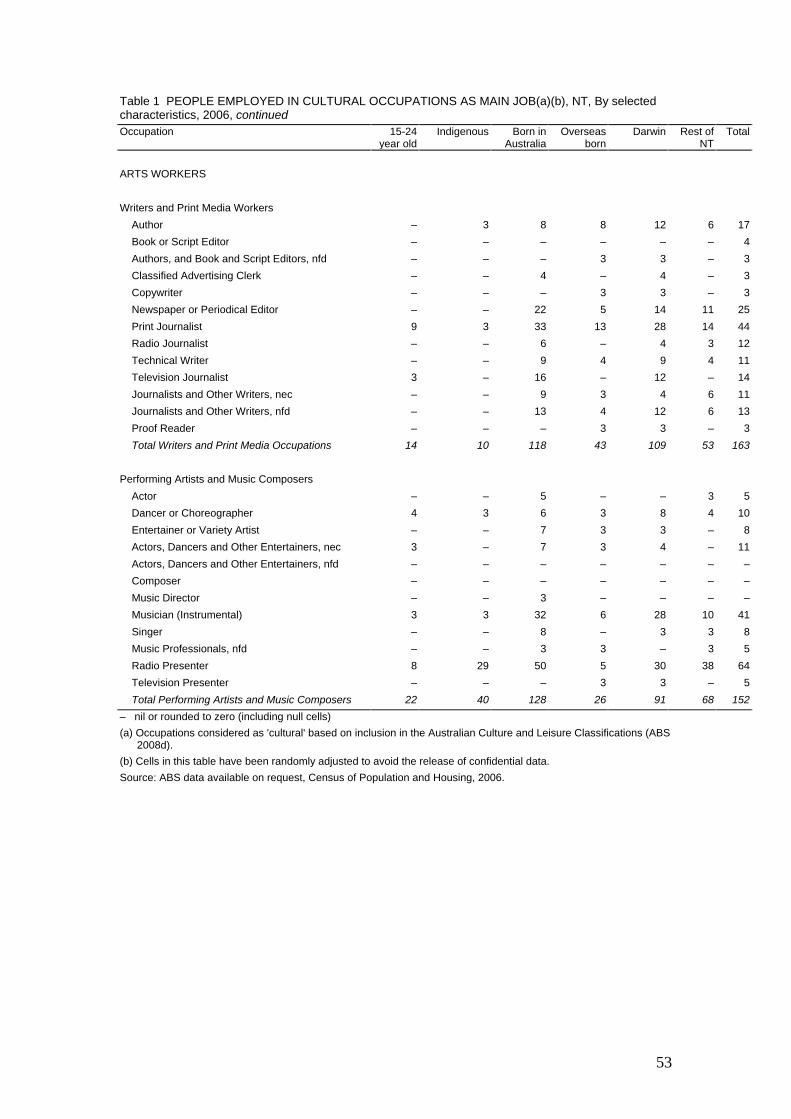
53
Table 1 PEOPLE EMPLOYED IN CULTURAL OCCUPATIONS AS MAIN JOB(a)(b), NT, By selected characteristics, 2006, continued
Occupation 15-24 year old
Indigenous Born in Australia
Overseas born
Darwin Rest of NT
Total
ARTS WORKERS
Writers and Print Media Workers
Author – 3 8 8 12 6 17
Book or Script Editor – – – – – – 4
Authors, and Book and Script Editors, nfd – – – 3 3 – 3
Classified Advertising Clerk – – 4 – 4 – 3
Copywriter – – – 3 3 – 3
Newspaper or Periodical Editor – – 22 5 14 11 25
Print Journalist 9 3 33 13 28 14 44
Radio Journalist – – 6 – 4 3 12
Technical Writer – – 9 4 9 4 11
Television Journalist 3 – 16 – 12 – 14
Journalists and Other Writers, nec – – 9 3 4 6 11
Journalists and Other Writers, nfd – – 13 4 12 6 13
Proof Reader – – – 3 3 – 3
Total Writers and Print Media Occupations 14 10 118 43 109 53 163
Performing Artists and Music Composers
Actor – – 5 – – 3 5
Dancer or Choreographer 4 3 6 3 8 4 10
Entertainer or Variety Artist – – 7 3 3 – 8
Actors, Dancers and Other Entertainers, nec 3 – 7 3 4 – 11
Actors, Dancers and Other Entertainers, nfd – – – – – – – Composer – – – – – – – Music Director – – 3 – – – – Musician (Instrumental) 3 3 32 6 28 10 41
Singer – – 8 – 3 3 8
Music Professionals, nfd – – 3 3 – 3 5
Radio Presenter 8 29 50 5 30 38 64
Television Presenter – – – 3 3 – 5
Total Performing Artists and Music Composers 22 40 128 26 91 68 152
– nil or rounded to zero (including null cells)
(a) Occupations considered as 'cultural' based on inclusion in the Australian Culture and Leisure Classifications (ABS 2008d).
(b) Cells in this table have been randomly adjusted to avoid the release of confidential data.
Source: ABS data available on request, Census of Population and Housing, 2006.
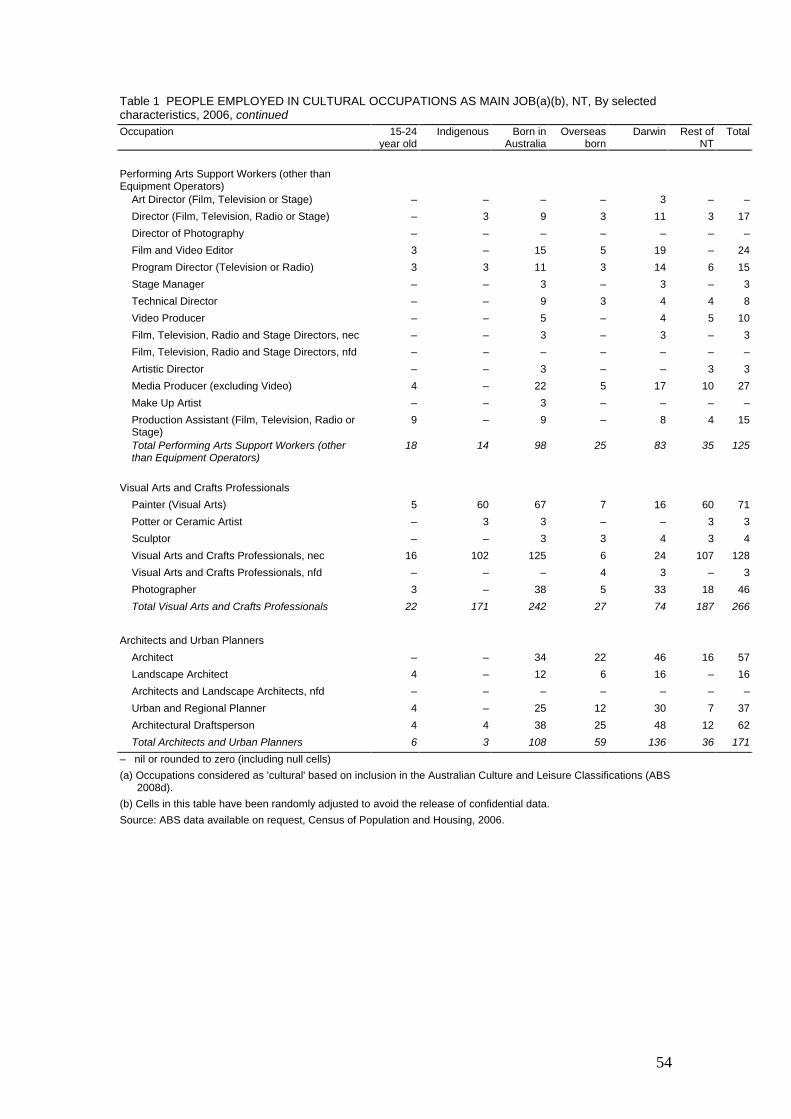
54
Table 1 PEOPLE EMPLOYED IN CULTURAL OCCUPATIONS AS MAIN JOB(a)(b), NT, By selected characteristics, 2006, continued
Occupation 15-24 year old
Indigenous Born in Australia
Overseas born
Darwin Rest of NT
Total
Performing Arts Support Workers (other than Equipment Operators)
Art Director (Film, Television or Stage) – – – – 3 – – Director (Film, Television, Radio or Stage) – 3 9 3 11 3 17
Director of Photography – – – – – – – Film and Video Editor 3 – 15 5 19 – 24
Program Director (Television or Radio) 3 3 11 3 14 6 15
Stage Manager – – 3 – 3 – 3
Technical Director – – 9 3 4 4 8
Video Producer – – 5 – 4 5 10
Film, Television, Radio and Stage Directors, nec – – 3 – 3 – 3
Film, Television, Radio and Stage Directors, nfd – – – – – – –
Artistic Director – – 3 – – 3 3
Media Producer (excluding Video) 4 – 22 5 17 10 27
Make Up Artist – – 3 – – – – Production Assistant (Film, Television, Radio or Stage)
9 – 9 – 8 4 15
Total Performing Arts Support Workers (other than Equipment Operators)
18 14 98 25 83 35 125
Visual Arts and Crafts Professionals
Painter (Visual Arts) 5 60 67 7 16 60 71
Potter or Ceramic Artist – 3 3 – – 3 3
Sculptor – – 3 3 4 3 4
Visual Arts and Crafts Professionals, nec 16 102 125 6 24 107 128
Visual Arts and Crafts Professionals, nfd – – – 4 3 – 3
Photographer 3 – 38 5 33 18 46
Total Visual Arts and Crafts Professionals 22 171 242 27 74 187 266
Architects and Urban Planners
Architect – – 34 22 46 16 57
Landscape Architect 4 – 12 6 16 – 16
Architects and Landscape Architects, nfd – – – – – – – Urban and Regional Planner 4 – 25 12 30 7 37
Architectural Draftsperson 4 4 38 25 48 12 62
Total Architects and Urban Planners 6 3 108 59 136 36 171
– nil or rounded to zero (including null cells)
(a) Occupations considered as 'cultural' based on inclusion in the Australian Culture and Leisure Classifications (ABS 2008d).
(b) Cells in this table have been randomly adjusted to avoid the release of confidential data.
Source: ABS data available on request, Census of Population and Housing, 2006.
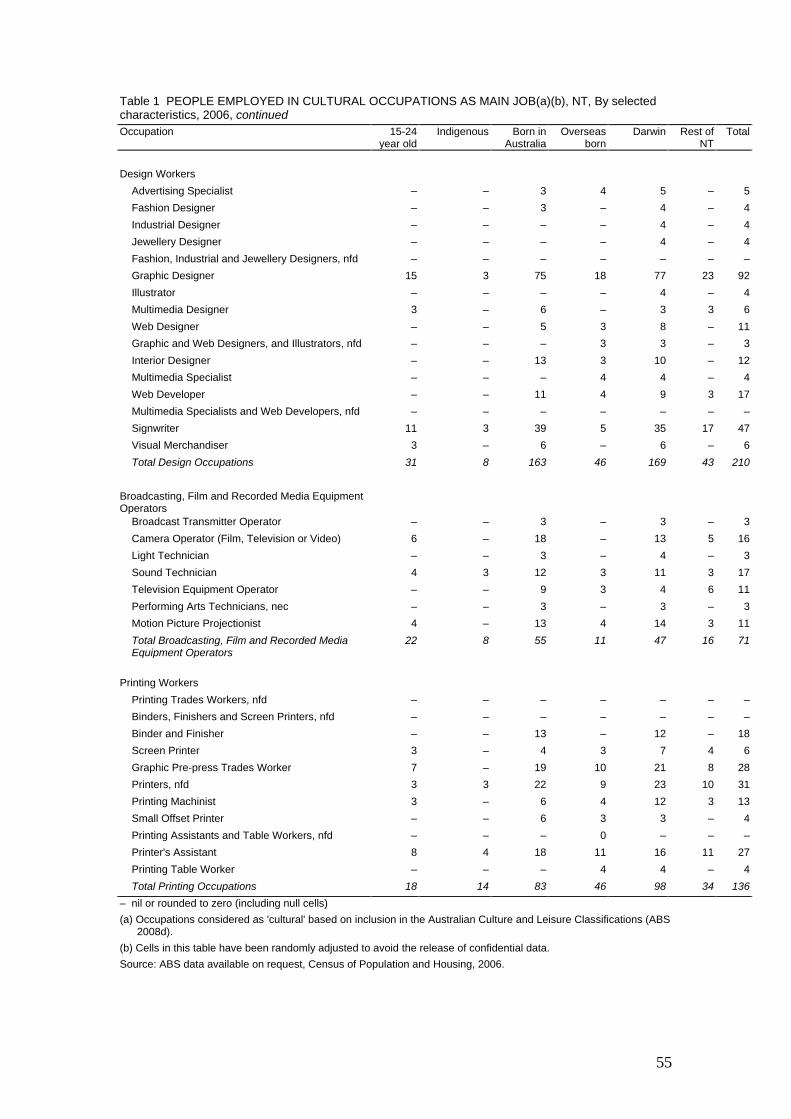
55
Table 1 PEOPLE EMPLOYED IN CULTURAL OCCUPATIONS AS MAIN JOB(a)(b), NT, By selected characteristics, 2006, continued
Occupation 15-24 year old
Indigenous Born in Australia
Overseas born
Darwin Rest of NT
Total
Design Workers
Advertising Specialist – – 3 4 5 – 5
Fashion Designer – – 3 – 4 – 4
Industrial Designer – – – – 4 – 4
Jewellery Designer – – – – 4 – 4
Fashion, Industrial and Jewellery Designers, nfd – – – – – – – Graphic Designer 15 3 75 18 77 23 92
Illustrator – – – – 4 – 4
Multimedia Designer 3 – 6 – 3 3 6
Web Designer – – 5 3 8 – 11
Graphic and Web Designers, and Illustrators, nfd – – – 3 3 – 3
Interior Designer – – 13 3 10 – 12
Multimedia Specialist – – – 4 4 – 4
Web Developer – – 11 4 9 3 17
Multimedia Specialists and Web Developers, nfd – – – – – – – Signwriter 11 3 39 5 35 17 47
Visual Merchandiser 3 – 6 – 6 – 6
Total Design Occupations 31 8 163 46 169 43 210
Broadcasting, Film and Recorded Media Equipment Operators
Broadcast Transmitter Operator – – 3 – 3 – 3
Camera Operator (Film, Television or Video) 6 – 18 – 13 5 16
Light Technician – – 3 – 4 – 3
Sound Technician 4 3 12 3 11 3 17
Television Equipment Operator – – 9 3 4 6 11
Performing Arts Technicians, nec – – 3 – 3 – 3
Motion Picture Projectionist 4 – 13 4 14 3 11
Total Broadcasting, Film and Recorded Media Equipment Operators
22 8 55 11 47 16 71
Printing Workers
Printing Trades Workers, nfd – – – – – – –
Binders, Finishers and Screen Printers, nfd – – – – – – – Binder and Finisher – – 13 – 12 – 18
Screen Printer 3 – 4 3 7 4 6
Graphic Pre-press Trades Worker 7 – 19 10 21 8 28
Printers, nfd 3 3 22 9 23 10 31
Printing Machinist 3 – 6 4 12 3 13
Small Offset Printer – – 6 3 3 – 4
Printing Assistants and Table Workers, nfd – – – 0 – – –
Printer's Assistant 8 4 18 11 16 11 27
Printing Table Worker – – – 4 4 – 4
Total Printing Occupations 18 14 83 46 98 34 136
– nil or rounded to zero (including null cells)
(a) Occupations considered as 'cultural' based on inclusion in the Australian Culture and Leisure Classifications (ABS 2008d).
(b) Cells in this table have been randomly adjusted to avoid the release of confidential data.
Source: ABS data available on request, Census of Population and Housing, 2006.
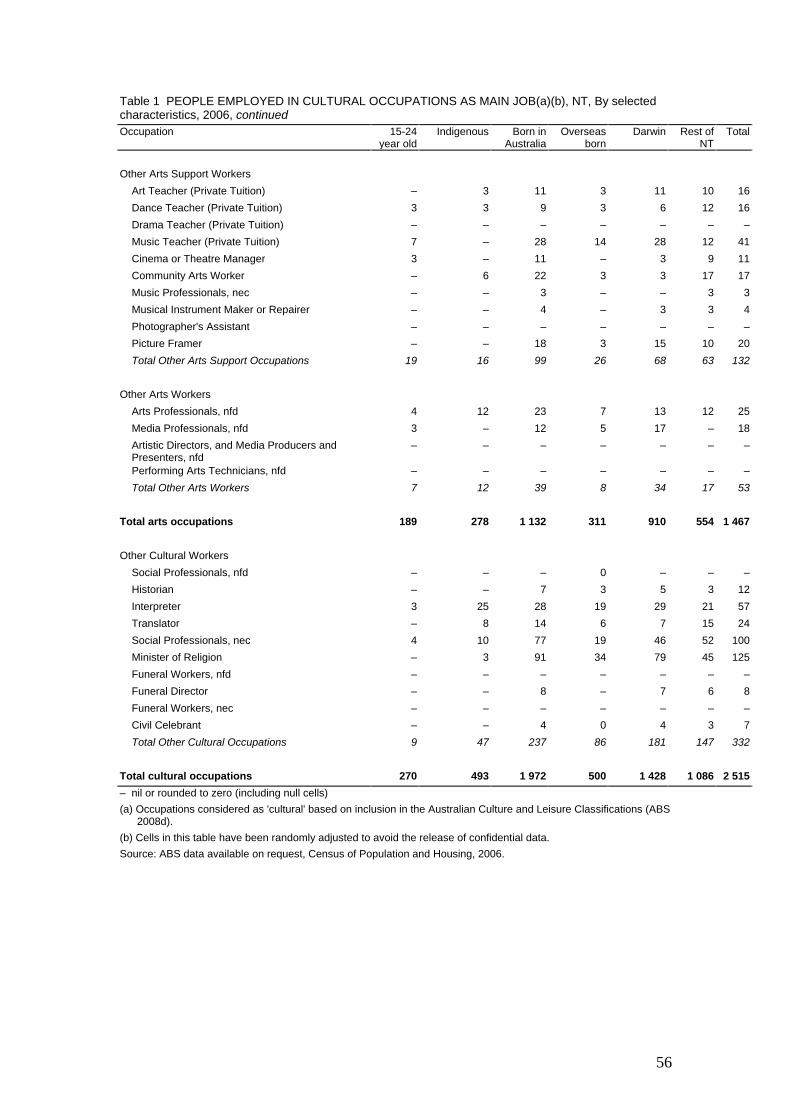
56
Table 1 PEOPLE EMPLOYED IN CULTURAL OCCUPATIONS AS MAIN JOB(a)(b), NT, By selected characteristics, 2006, continued
Occupation 15-24 year old
Indigenous Born in Australia
Overseas born
Darwin Rest of NT
Total
Other Arts Support Workers
Art Teacher (Private Tuition) – 3 11 3 11 10 16
Dance Teacher (Private Tuition) 3 3 9 3 6 12 16
Drama Teacher (Private Tuition) – – – – – – – Music Teacher (Private Tuition) 7 – 28 14 28 12 41
Cinema or Theatre Manager 3 – 11 – 3 9 11
Community Arts Worker – 6 22 3 3 17 17
Music Professionals, nec – – 3 – – 3 3
Musical Instrument Maker or Repairer – – 4 – 3 3 4
Photographer's Assistant – – – – – – – Picture Framer – – 18 3 15 10 20
Total Other Arts Support Occupations 19 16 99 26 68 63 132
Other Arts Workers
Arts Professionals, nfd 4 12 23 7 13 12 25
Media Professionals, nfd 3 – 12 5 17 – 18
Artistic Directors, and Media Producers and Presenters, nfd
– – – – – – –
Performing Arts Technicians, nfd – – – – – – – Total Other Arts Workers 7 12 39 8 34 17 53
Total arts occupations 189 278 1 132 311 910 554 1 467
Other Cultural Workers
Social Professionals, nfd – – – 0 – – – Historian – – 7 3 5 3 12
Interpreter 3 25 28 19 29 21 57
Translator – 8 14 6 7 15 24
Social Professionals, nec 4 10 77 19 46 52 100
Minister of Religion – 3 91 34 79 45 125
Funeral Workers, nfd – – – – – – – Funeral Director – – 8 – 7 6 8
Funeral Workers, nec – – – – – – – Civil Celebrant – – 4 0 4 3 7
Total Other Cultural Occupations 9 47 237 86 181 147 332
Total cultural occupations 270 493 1 972 500 1 428 1 086 2 515
– nil or rounded to zero (including null cells)
(a) Occupations considered as 'cultural' based on inclusion in the Australian Culture and Leisure Classifications (ABS 2008d).
(b) Cells in this table have been randomly adjusted to avoid the release of confidential data.
Source: ABS data available on request, Census of Population and Housing, 2006.

57
Table 2 PEOPLE EMPLOYED IN CULTURAL INDUSTRIES AS MAIN JOB(a), NT, by selected characteristics, 2006
15-24 year old
Indigenous Born in Australia
Overseas born
Darwin Rest of NT
Total
Heritage
Libraries and Archives 6 3 62 10 57 24 76
Museum Operation 8 14 80 31 66 46 113
Zoological and Botanic Gardens Operation 5 – 25 9 23 14 32
Nature Reserves and Conservation Parks Operation
48 105 274 36 104 214 316
Total heritage industries 69 128 444 85 240 301 548
Arts
Printing 21 4 110 35 135 14 149
Newspaper Publishing 32 3 155 54 151 64 217
Magazine and Other Periodical Publishing – – 12 4 8 – 9
Internet Publishing and Broadcasting – – – – – – – Book Publishing – 3 9 7 9 5 18
Music Publishing – – – – – – – Reproduction of Recorded Media – – – – 3 – 3
Music and Other Sound Recording Activities – – 6 – – 3 6
Book and Magazine Wholesaling 3 – 8 – 5 – 5
Entertainment Media Retailing 21 – 32 3 22 16 37
Newspaper and Book Retailing 44 9 140 20 100 57 157
Architectural Services 13 7 103 60 128 29 159
Advertising Services 15 – 58 17 62 14 81
Other Specialised Design Services 21 7 75 15 78 15 90
Motion Picture and Video Production 3 – 16 8 12 10 24
Postproduction Services and Other Motion Picture and Video Activities
– – – – 3 – 3
Motion Picture and Video Distribution – – – – – – – Motion Picture Exhibition 44 8 68 6 52 26 78
Radio Broadcasting 15 11 69 13 54 29 87
Free-to-Air Television Broadcasting 38 18 170 38 159 49 213
Cable and Other Subscription Broadcasting – 4 15 – 17 – 17
Performing Arts Operation 5 3 20 4 21 8 26
Creative Artists, Musicians, Writers and Performers
14 23 84 25 67 45 113
Performing Arts Venue Operation 7 – 19 5 27 – 23
Video and Other Electronic Media Rental 50 3 70 6 58 24 77
Professional Photographic Services 3 – 27 9 26 11 33
Arts Education 8 5 53 21 50 24 72
Total arts industries 372 98 1 315 348 1 251 440 1 693
Other culture
Religious Services 6 – 124 41 111 56 164
Funeral, Crematorium and Cemetery Services 3 – 13 3 8 7 17
Total other culture industries 9 – 135 42 120 62 184
Total cultural industries 449 228 1 892 477 1 614 807 2 416
– nil or rounded to zero (including null cells)
(a) Cells in this table have been randomly adjusted to avoid the release of confidential data.
Source: ABS data available on request, Census of Population and Housing, 2006.