Embed Size (px)
Citation preview
Culture, politics and innovation:evidence from the creameries
Kevin H. O�Rourke
Department of Economics and IIISTrinity College, Dublin
November 2001
I am very grateful to the following for their advice and encouragement: Charles Calomiris, TimGuinnane, Ingrid Henriksen, Joel Mokyr, Cormac Ó Gráda, Andrei Shleifer, Eugene White, JeffreyWilliamson, and seminar participants at Harvard, the LSE, Northwestern, Rutgers, Yale and theDublin Economics Workshop. I have also benefitted from conversations with Bruce Campbell,Claudia Goldin and Avner Greif about these and related matters. Brendan Kelly provided ableresearch assistance. The usual disclaimer applies.
1
I INTRODUCTION
The aim of this paper is to shed light on the causes of economic growth by exploring the
diffusion of two agricultural innovations in late 19th century Denmark and Ireland. The first was
technological: the centrifugal milk separator, which made it possible to extract a greater proportion of
the butter fat in milk, and to do so more quickly and hygienically. The second was organizational: the
creamery cooperative, in which farmers jointly owned the creamery which processed their milk, and
which was held by many contemporaries to have important efficiency advantages over the privately
owned creamery� a judgement with which economic historians, notably Ingrid Henriksen [1999],
have concurred.
There are several reasons why economists as well as economic historians should be
interested in how butter was produced in two small European countries a century ago. The first is that
this episode provides a canonical example of how innovations do not always diffuse at the same rate
across countries: separators and cooperatives spread much more quickly in Denmark, despite the fact
that both countries were important dairy producers, located in north-west Europe, and selling to the
same market (Britain). A key concern of this paper is the extent to which purely economic factors can
explain different rates of diffusion of modern cooperative creameries between Denmark and Ireland,
and within Ireland itself. Is it appropriate to view farmers in both countries as purely economic
agents, whose differing strategies reflected nothing more than the differing economic environments
they faced; or were such factors as culture, religion and politics of importance too?
A second motivation can be found in the recent empirical literature on convergence and
growth. To date, this has mostly relied on cross-country growth regressions, which have produced a
number of commonly-accepted findings. One is that education matters for growth: a common
interpretation is that poor countries may grow more rapidly than rich ones by importing best-practice
technology, but only if their educational levels are sufficiently high [Easterlin 1981; Abramovitz
1986; Barro 1991]. A second is that stable property rights, and political stability more generally, are
good for growth: again, the interpretation is that a stable environment promotes investment and
1 Other contributions to this literature, which are not however based on cross-country regressions,include Putnam [1993] and Greif [1994].
2
innovation [Barro 1991; Knack and Keefer 1995]. A third is that societies with greater �social
capital�, and in particular �trust�, may perform better than low-trust societies in terms of both GDP
growth and a number of other indicators [Knack and Keefer 1997; La Porta et. al. 1997; Zak and
Knack 2001].1 Again, the intuition is that trust facilitates a great range of economic transactions, and
makes possible higher levels of investment and innovation. Of necessity, such cross-country
regression exercises tend to be fairly crude: it would be nice to know whether these aggregate
correlations are really being driven by the mechanisms identified by theory as being important. Does
literacy, or political stability, or well-defined property rights, or trust, really promote investment and
innovation as the theory suggests? In order to answer such a question, it is necessary to look in
greater detail at particular innovations, and identify the economic, political and/or cultural factors
which facilitated or hindered their diffusion. Dairying in late 19th century Denmark and Ireland offers
a promising test case (on Denmark, see Kindleberger [1951]).
The paper shows that illiteracy and political instability impeded the diffusion of creameries
within Ireland. It also argues that a variety of collective action problems hampered their diffusion,
and impaired the quality of Irish creamery butter. Finally, it finds a link between Catholicism and the
propensity to cooperate, consistent with the argument of La Porta et al. [1997] that hierarchical
religions inhibit the development of trust. The next section establishes the superiority of the Danish
dairying sector�s performance relative to its Irish counterpart in the late 19th and early 20th centuries.
Section III surveys a literature which asks whether the more rapid spread of cooperative creameries in
Denmark can be explained by economic factors alone, or whether a number of non-economic factors-
- in particular literacy and instability associated with the Irish Land Wars-- mattered as well. Section
IV provides some econometric evidence on the issue, while Section V looks at the relationships
between culture, cooperation and performance in the Irish dairying sector. Section VI concludes.
2 See for example Ó Gráda [1977], Crotty [1966], or Lee [1989].
3 Solow [1971], p. 151.
4 Cited by Ó Gráda [1977], p. 298. In this ideal Plunkett was fully supported by none other thanAndrew Carnegie: see Ehrlich [1981], p. 272.
3
II DAIRYING IN LATE 19TH CENTURY DENMARK AND IRELAND
Many historians of post-Famine Ireland have commented on the differences between the Irish
and Danish economies� performances since the middle of the nineteenth century.2 Both countries
were largely agricultural, and both competed for the lucrative British market for breakfast goods:
bacon, eggs, and, especially, butter. It was a competition which, by common consent, the Danes won
hands down. As an outsider, Barbara Solow felt able to comment that �the Irish are rightly annoyed at
always having Denmark held up to them as a good example,� but went on to claim that �there
remains much in the history of Danish agriculture that stands as a reproach to Irish farming.�3 But
perhaps the greatest tribute to the hold which Denmark has had on those interested in Ireland�s
economic welfare comes not from an academic but from Horace Plunkett, a leader in the field of Irish
agricultural reform around the turn of the century. In 1908, he wrote that �I have always felt that
Ireland a second Denmark was no bad ideal for our reformers to set before them�.4
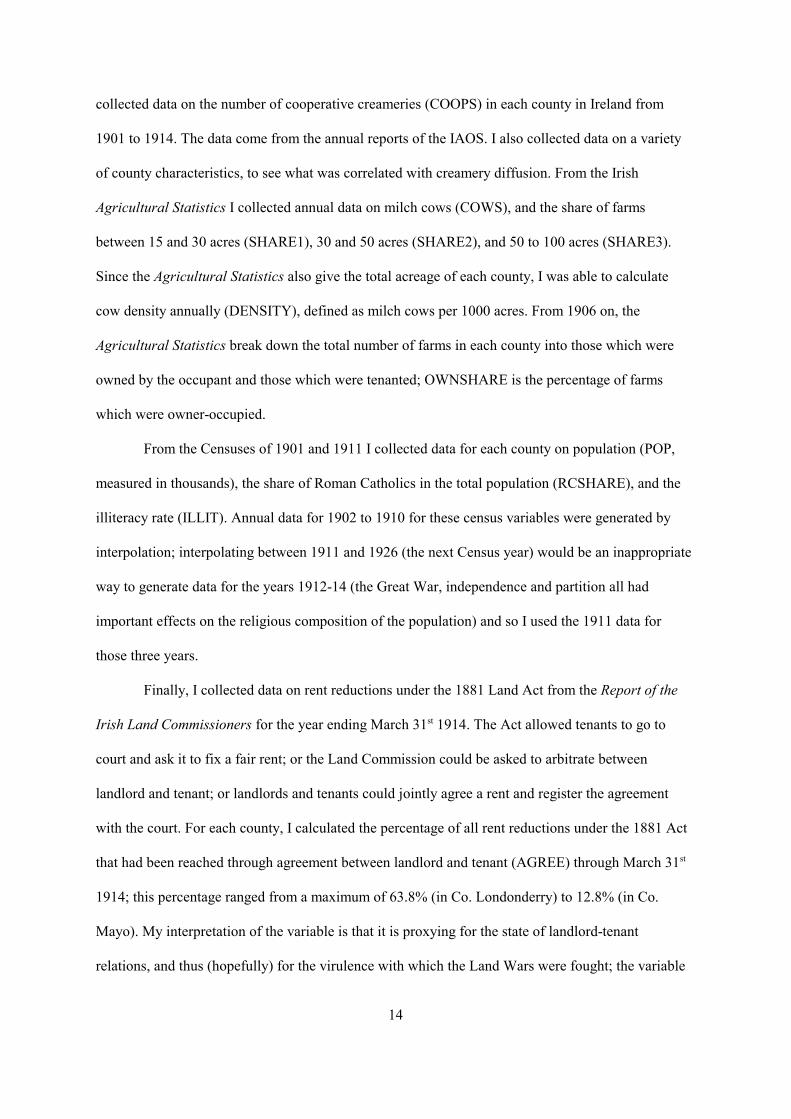
As late as the 1870s, the Irish dairy industry dwarfed the Danish one, but the 1880s proved a
crucial turning point: the Irish industry had been overtaken by the early 1890s, and was only half the
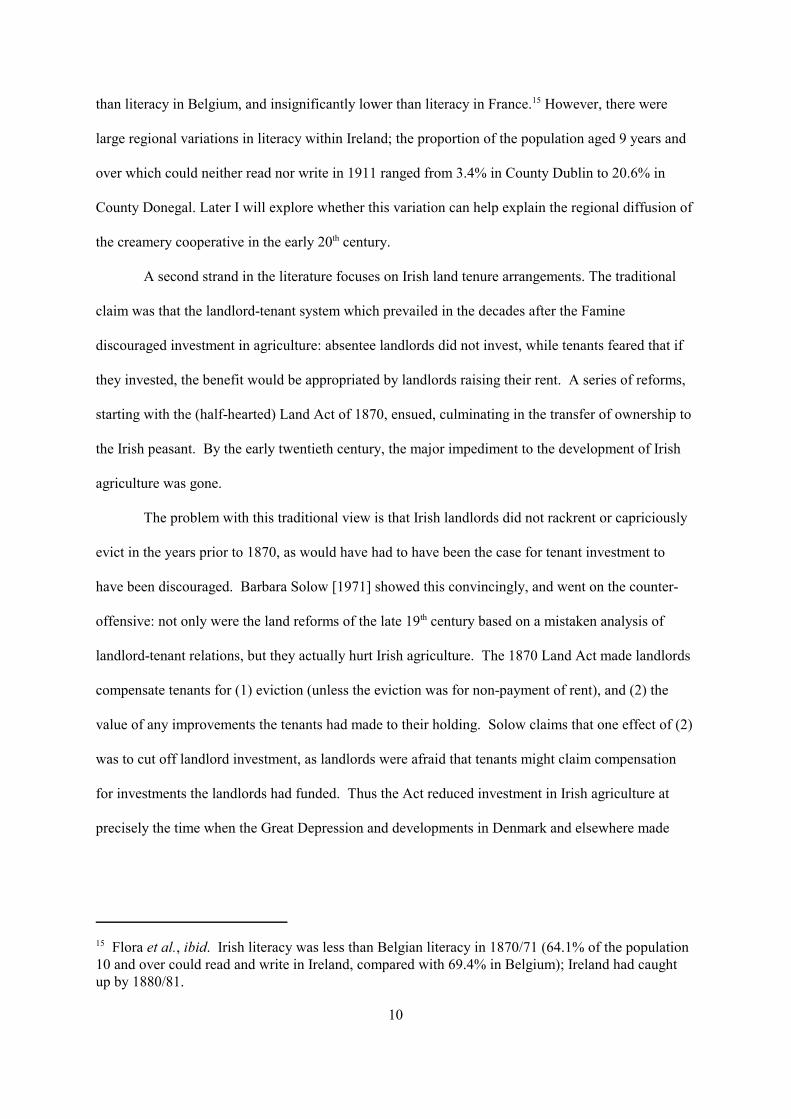
size of the Danish industry on the eve of World War I. Output trends are mirrored in the export data:
Figure 1 shows that Irish butter exports were static throughout the late 19th century, whereas Danish
exports grew explosively, with a sharp acceleration during the 1880s, during which decade Danish
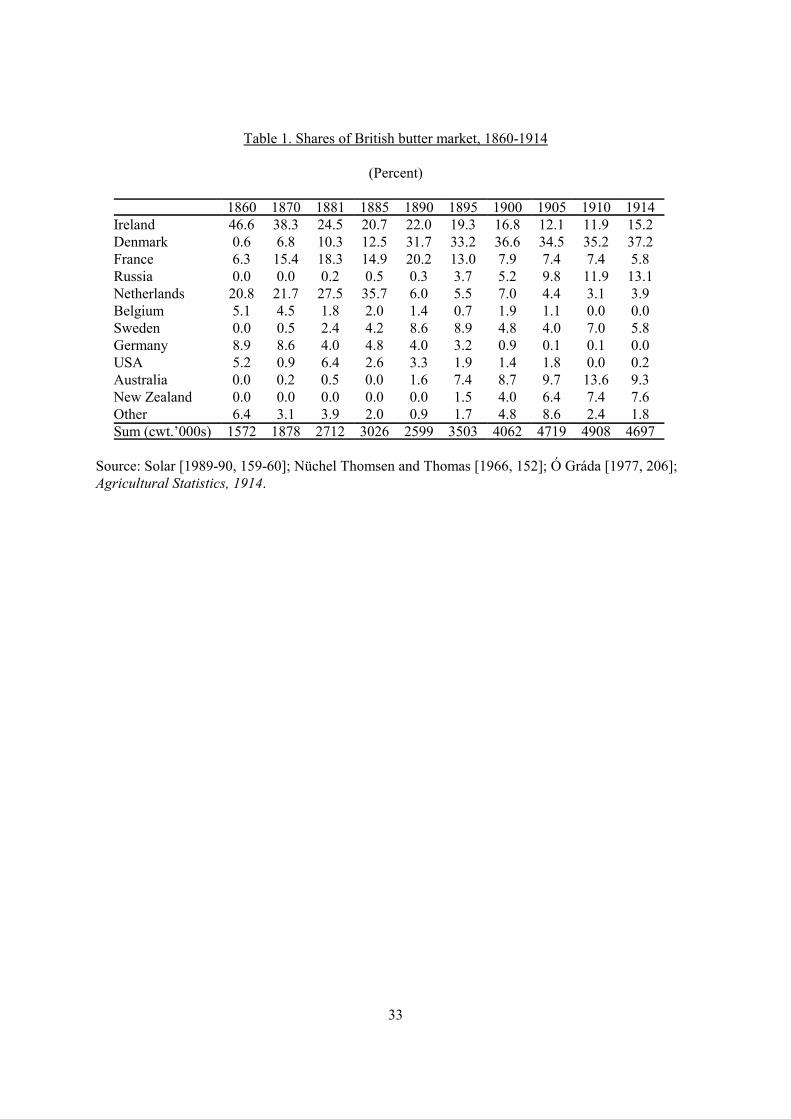
exports pulled ahead of Irish exports. Both Ireland and Denmark exported almost all their butter to
Britain; Table 1 calculates different countries� shares of the British import market (assuming that all
Irish exports went to Britain, and that UK imports were consumed in Britain). Before 1887 the
statistics include margarine imports, mostly from Holland, which were quite substantial; this implies
that Ireland probably held somewhat over half the British butter market in 1860. Yet it had been
5 All price data in this and the following paragraph come from O�Rourke [1999], Table 6.
6 In principle higher transport costs between Britain and Ireland could also have been to blame, butHenriksen and O�Rourke [ongoing] show that for most of the period Anglo-Danish price gaps werehigher than Anglo-Irish ones.
4
overtaken by Denmark by 1890, and was also facing strong competition from French, Russian, and
eventually Australasian butter. It was this displacement of Irish butter by new competitors in its most
important market that most disturbed contemporary Irish observers.
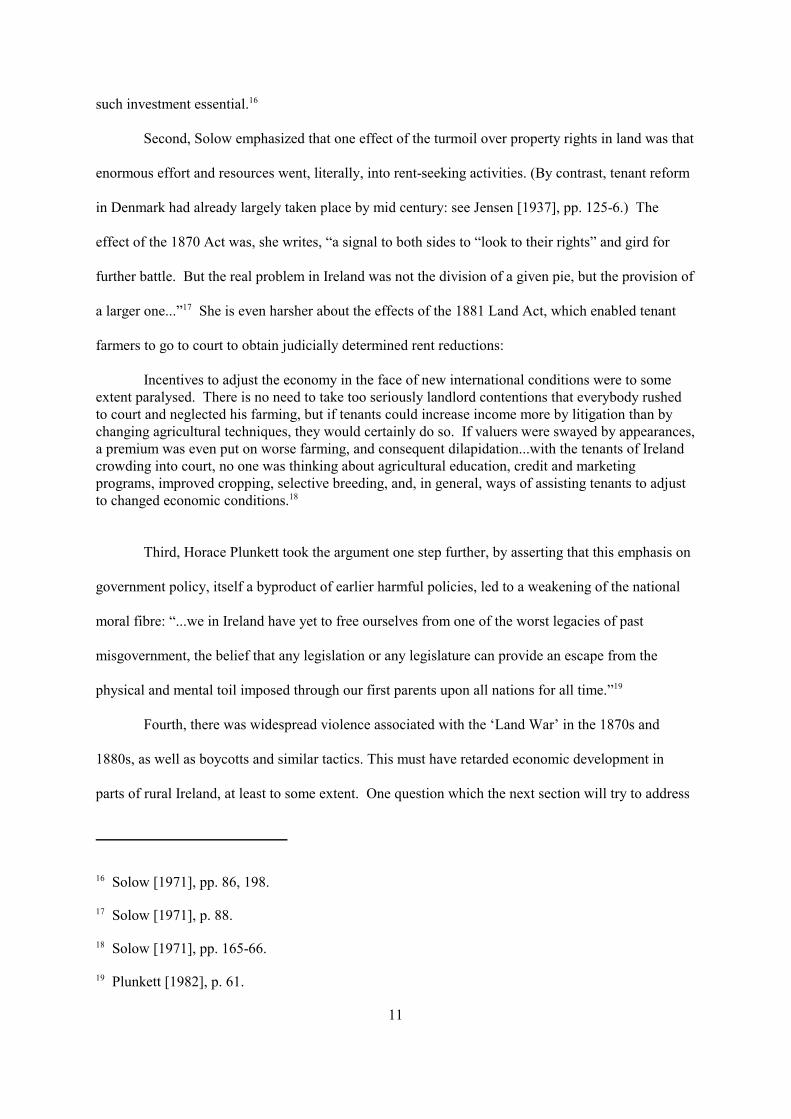
Losing market share might not have been so bad, had it indicated that Ireland was moving
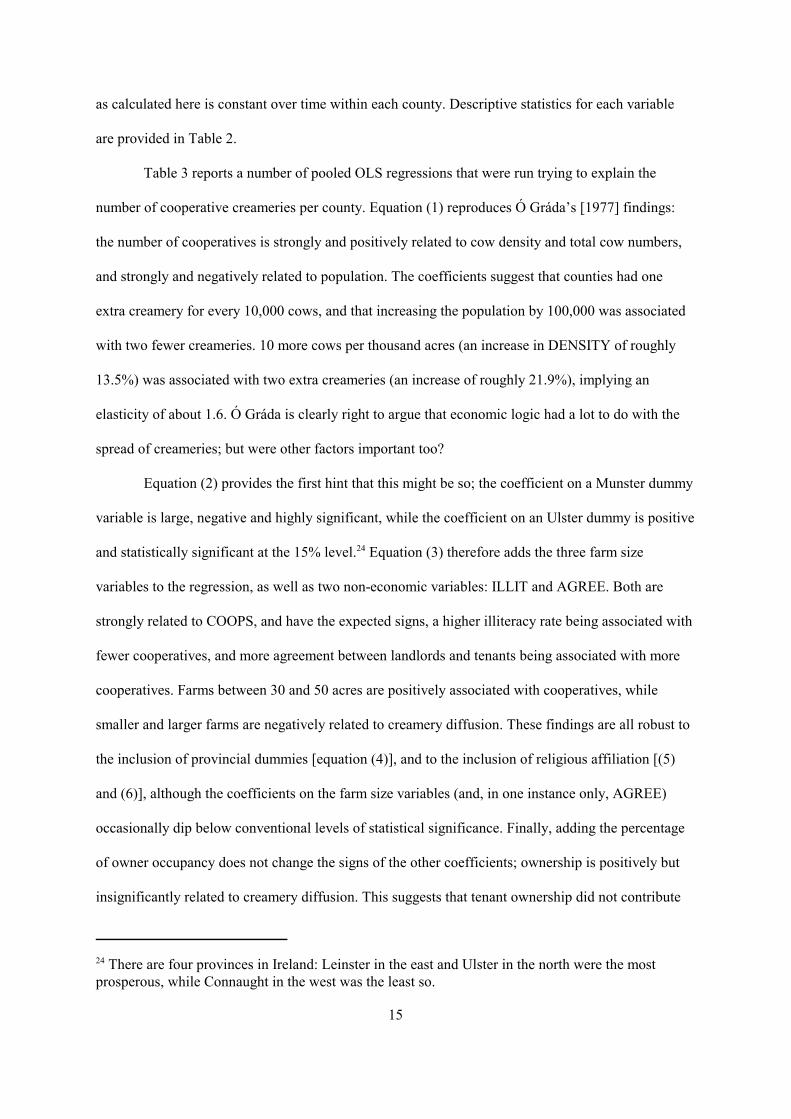
into a high-quality niche, and substituting high prices for volume. The reverse was the case. Figure 2
gives official average butter prices in the two countries from 1846; in principal these should capture
not only overall movements in butter prices, but changing average qualities as well. According to the
data, Irish prices were well above Danish prices in mid-century, the gap was rapidly eliminated after
the mid-1870s, and average Danish prices exceeded Irish ones from the early 1880s. The gap
averaged 14.8% between 1905 and 1914: 14.8% of the value of butter production on the eve of the
Great War was equivalent to one percent of Irish national income.
Official price statistics give some intuition as to what was the underlying source of these
average price differences.5 The gap between average export prices realized by the two economies
between 1905 and 1914 was 13.2%, somewhat lower than the average domestic price gap; when like
is compared with like, the price gaps are even smaller. Thus, Danish creamery butter fetched between
6.4% and 7.3% more than Irish creamery butter in Britain; this presumably reflects quality
differences. The data suggest that about half of the average price gap [(6.4+7.3)/(2*14.8)=46%] was
due to Irish butter being inferior to Danish butter, within given product classes; the remaining half
was due to an inferior Irish quality mix.6
The basic problem regarding the quality of Irish butter was that not enough of it was
produced in modern creameries. Creamery butter was produced using the new cream separator
7 For an extensive discussion of the different types of butter, see the Report of the DepartmentalCommittee on the Irish Butter Industry [B.P.P. 1910, Cd. 5092].
8 Whole milk contains approximately 3.5% butter fat; see Jensen [1937, pp. 174-176] from whom thisdiscussion is drawn.
5
technology, invented in Scandinavia in the late 1870s.7 Prior to the introduction of the separator, milk
had been allowed to sit in containers while the cream rose to the top; the cream was then skimmed off
and churned. The separator not only extracted more cream from the milk (leaving 0.1-0.25% butter
fat in the skim milk, as opposed to a minimum of 0.5-1.0%, and more probably 1.0-1.5% under the
old system);8 it could efficiently extract fat from milk which had been shaken in transit, and it
extracted the cream more quickly and hygienically. Separators were quickly introduced into
Denmark, and the vast majority of butter was being produced using the new methods by 1914.
However, as late as 1907 only 37.2% of Irish butter was produced in creameries, according to a
witness to the 1911 Irish Milk Commission. 50% of total output was farmers� butter, that is to say,
butter produced on farms using traditional methods; the remaining 12.7% was �factory butter�, i.e.
farmers� butter which was bought up by factory owners and blended to produce a more uniform
consistency. Creamery butter fetched 15% more than factory butter, and 16% more than farmers�
butter; Irish butter producers were persisting in producing what was clearly regarded as an inferior
product. Even more inferior was the salt firkin butter, produced by hill farmers who added brine to
preserve it; this had been a mainstay of the Cork butter market, which had carried on an extensive
export trade in the early 19th century, but overseas tastes shifted away from excessively salted butter
when milder-cured and fresher Continental butter began to penetrate the British market in the 1870s
[Donnelly 1971].
The quality of Irish butter was also variable; it frequently contained more moisture than the
16% maximum allowed under British law. In some cases, water was deliberately added to the butter,
either by farmers or by factories, to add to the weight of the product. Thus, while only 11 samples of
butter imported into the UK (out of a total of 1875) were found to contain more than 16% of water in
1905-6 (all 11 were Dutch), and only one sample was found to be so deficient between 1899-1900
9 The average mid-sized Danish farm owned 6 to 14 cows [Henriksen 1999].
6
and 1904-5, 8.7% of samples tested in Ireland between May 1902 and December 1905 were found to
contain more than 16% water. There was considerable regional variation in the data: the percentage
of deficient samples was 19% in Clare, 0.4% in Cork, 9% in Galway, 15.8% in Kerry, 6.3% in
Limerick, 5.5% in Tipperary North Riding, and 22.4% in Tipperary South Riding [B.P.P. 1906, pp.
413, 437].
In addition to not producing as much butter using new creamery methods as the Danes, the
Irish were not as rapid in adopting another, organizational innovation: the cooperative creamery.
Employing cream separators was only financially viable when they were processing the milk from a
large number of cows � 300 to 400, say � and so it clearly made sense for centralized creameries to
process the milk output of several farms.9 In principle this could be done by privately owned
creameries as well as by cooperatives. Henriksen [1999] has however emphasized the efficiency
advantages of the cooperative: by tying a group of farmers into only supplying one creamery, which
they jointly owned, a higher average milk quality was ensured. Farmers had an incentive to provide
high quality milk, and if necessary, to monitor each other; social sanctions could be applied to those
farmers who underperformed, and of course their property rights in the creamery might be forfeit. By
contrast, a privately owned creamery would always be on the lookout for enough milk suppliers to
ensure an efficient scale of production (not having suppliers who were locked in); this would give
suppliers more leverage, and might enable them to sell poorer quality milk.
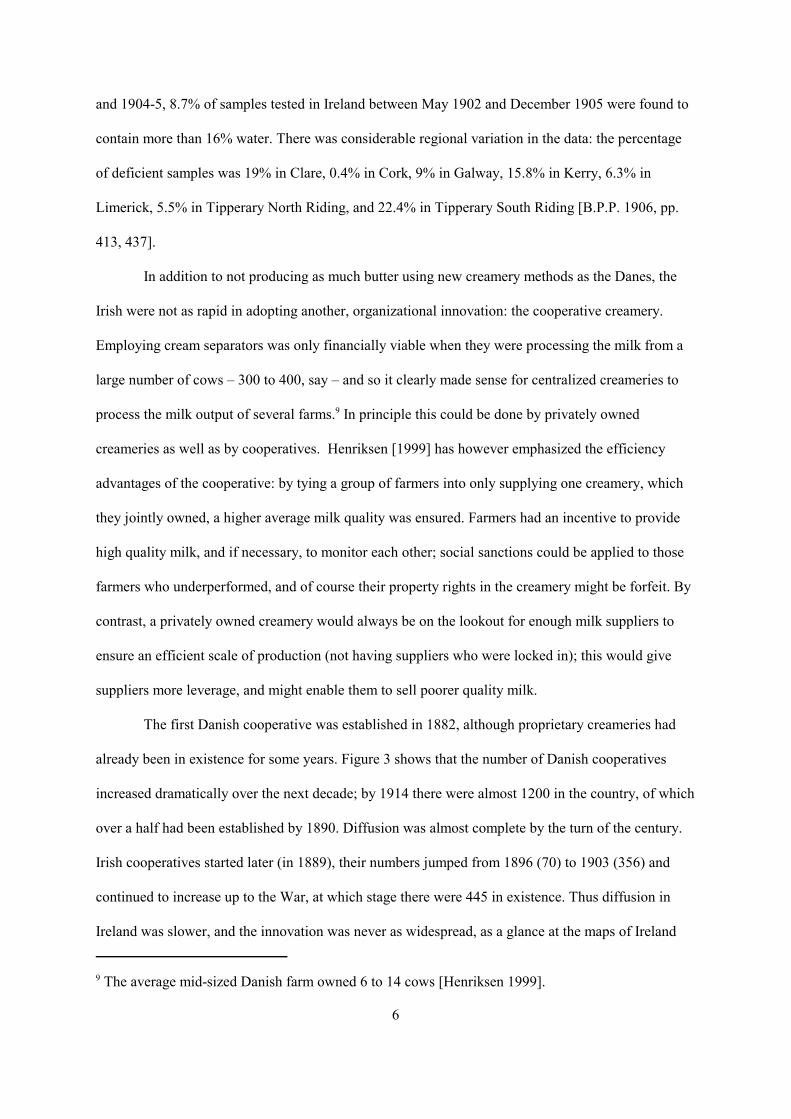
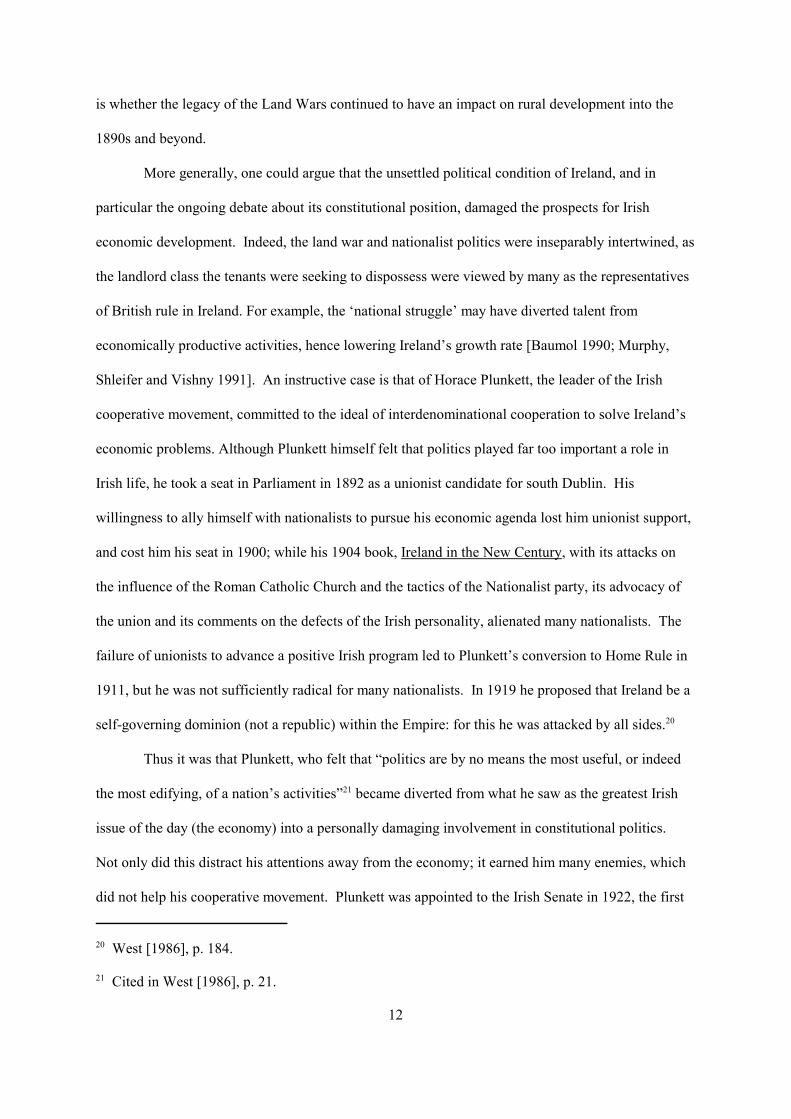
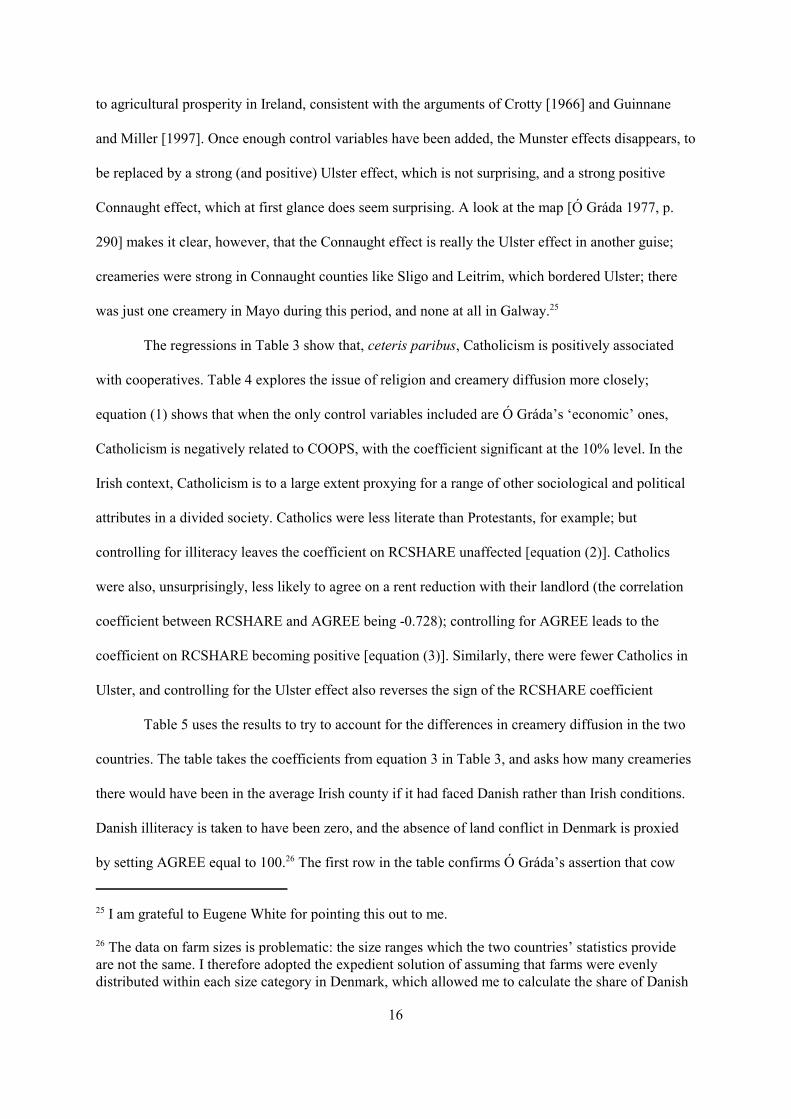
The first Danish cooperative was established in 1882, although proprietary creameries had
already been in existence for some years. Figure 3 shows that the number of Danish cooperatives
increased dramatically over the next decade; by 1914 there were almost 1200 in the country, of which
over a half had been established by 1890. Diffusion was almost complete by the turn of the century.
Irish cooperatives started later (in 1889), their numbers jumped from 1896 (70) to 1903 (356) and
continued to increase up to the War, at which stage there were 445 in existence. Thus diffusion in
Ireland was slower, and the innovation was never as widespread, as a glance at the maps of Ireland
10 Based on Henriksen [1999, Table 1], except for the 1888 figure for cooperatives, which is takenfrom Bjørn [1988, p. 371].
7
and Denmark early this century will confirm [Ó Gráda 1977, p. 290; Bjørn 1988, p. 373]. Ireland�s
cooperative performance looks even weaker when set against the two countries� milch cow herds (the
Irish herd was substantially larger throughout this period); by 1888 there was roughly one
cooperative per 2000 milch cows in Denmark, and there was almost one cooperative per thousand
milch cows by the turn of the century; in Ireland, there was only slightly more than one cooperative
per 4000 milch cows by 1914 [O�Rourke 1999, Table 8].
Things look better if proprietary creameries are added to the total. In 1896 there were 207
private creameries in Ireland, or 279 in all; in 1906 there were 800 creameries in all, of which just
339 were cooperative. In Denmark, by contrast, cooperatives displaced private creameries during the
1890s; cooperatives accounted for 54% of all creameries in 1888, but 81% in 1894, a proportion
which was to remain roughly constant until the Great War.10 Thus there were 0.19 creameries per
1000 cows in Ireland in 1896, as opposed to roughly 1.1 per thousand in Denmark in 1894; and there
were 0.53 creameries in Ireland per 1000 cows in 1906, as opposed to roughly 1.18 in Denmark in
1903. Nevertheless, Ireland�s total creamery density was less than half that of Denmark throughout
the period, as further evidenced by the large proportion of non-creamery butter in total output.
Furthermore, it appears as though Ireland chose the wrong type of creamery, opting for the private
form when cooperation offered substantial efficiency advantages.
What can explain these contrasting performances?
III THE CAUSES OF CREAMERY DIFFUSION IN IRELAND: LITERACY, LAND TENURE
AND POLITICS
In a classic article, Cormac Ó Gráda [1977] argued that Irish farmers were right not to adopt
cooperative creameries as enthusiastically as their Danish counterparts. They were not irrational;
rather, they faced an economic environment that was different in one crucial respect: Ireland had
8
almost twice as many acres per cow as did Denmark. �Creamery viability demanded a minimum milk
supply: in areas where that milk supply implied a catchment area too large for many individual
farmers to consider switching techniques, it seems reasonable to expect few if any creameries. For
small herds, or for herds located some miles from a creamery, the overhead cost incurred by the
farmer in bringing milk to the creamery might be prohibitive, and there might then have been no
demand for the new technique� [Ó Gráda 1977, p. 292]. Ó Gráda found that the number of
cooperative creameries in each county or poor law union in 1913 was well explained by cow density,
milch cow numbers (a scale variable), and population (representing the demand for non-butter uses of
milk, i.e. liquid milk). Further evidence of rationality came from the fact that the oldest creameries
were also the largest, suggesting that creameries had spread first in areas where they were most
profitable (scale being a proxy for profitability). In areas such as Limerick, which most resembled
Denmark, creameries (both private and cooperative) were widely diffused; they had �spread as far as
was viable in the Irish context by the 1910's� [p. 299].
Not everyone has been so charitable: the slower diffusion of creameries in Ireland has more
typically been seen as representing failure of some kind, whether entrepreneurial, political, or
cultural. Many contemporaries, and some historians, have argued that Irish peasant farmers were too
conservative, suspicious, poorly-educated or ignorant to adopt cooperation and the milk separator.
Lionel Smith-Gordon and Laurence Staples, the former an employee of the IAOS (the main Irish
cooperative organization) wrote in 1917 that �the most serious obstacle to the co-operative movement
was and remains the conservatism of the Irish farmer. Many projects which would have brought great
benefit to the country have been abandoned because the lords of the soil were suspicious, or did not
understand� [Smith-Gordon and Staples 1917, pp. 47-48], an opinion with which Liam Kennedy
[1976, p. 177] concurs. Even when Irish farmers did establish creameries, they were often reluctant to
invest adequately in them:
It seems absurd to some farmers to sanction the payment of a salary to a skilled Manager (of thecreamery) in excess of their own incomes. This is one of the chief short-comings in productive co-operation, and it is this that gives the proprietor his chance. His business instinct shows him plainly
11 Cipolla [1969], p. 14.
12 Flora et al. [1987], Vol. 1, p. 82. Army recruit data and bridegroom data are fairly comparable forother countries at the time: see Flora et al.
13 Flora et al. [1987], p. 72; 1911 Census, General Report, p. lii.
14 Mokyr and Ó Gráda [1988], p. 226.
9
that a good man is worth a good wage, and hence it is that some of the very best men the movementhas produced have been tempted to leave it for situations outside, where their brains and skill will beadequately rewarded. The Co-operative Creamery Manager is too often driven by circumstances tobecome a �rolling stone�...He seldom is provided with an adequate residence and his wages arefrequently cut down during the winter months, though he has been obliged to compress more than ayear�s work, done at high pressure, into the summer months [IAOS 1904, p. 16].
The allegation of entrepreneurial failure relies in part on the Irish peasant�s supposedly poor
education. Denmark was clearly a more educated society than Ireland in the 19th century: compulsory
education for 3 days a week between the ages of 7 and 14, had been introduced in Denmark in 1814;
in 1849 compulsory education was extended to cover a 6-day week. Although there are few data to
support the claim, it seems clear that near-universal literacy had been achieved in Denmark, certainly
by the middle of the century, and probably a lot earlier. In 1859-60, only 3% of military recruits in
Denmark were completely illiterate, while 9% could read but not write.11
By contrast, in Ireland only 74% of bridegrooms could write their names as late as 1880.12 In
1841, 53% of the Irish population over the age of 5 could neither read nor write; the figure fell to
46.8% in 1851, 38.7% in 1861, 33.4% in 1871, 25.2% in 1881, 18.4% in 1891, 13.7% in 1901, and
11.9% in 1911.13 While a successful national elementary school system had been established in
Ireland in 1831, education was made compulsory only in 1892 (1898 for rural areas). Ireland was
clearly less literate than Denmark; it is however important to note that Ireland was not a backward
society educationally for the time. Mokyr and Ó Gráda show that this was true even for the pre-
Famine period, and conclude that pre-Famine Ireland �was something of an �impoverished
sophisticate�, in the sense that its literacy level was probably higher than its income level would
indicate.�14 In 1900, literacy in Ireland was higher than in Italy and Austria, insignificantly higher
15 Flora et al., ibid. Irish literacy was less than Belgian literacy in 1870/71 (64.1% of the population10 and over could read and write in Ireland, compared with 69.4% in Belgium); Ireland had caughtup by 1880/81.
10
than literacy in Belgium, and insignificantly lower than literacy in France.15 However, there were
large regional variations in literacy within Ireland; the proportion of the population aged 9 years and
over which could neither read nor write in 1911 ranged from 3.4% in County Dublin to 20.6% in
County Donegal. Later I will explore whether this variation can help explain the regional diffusion of
the creamery cooperative in the early 20th century.
A second strand in the literature focuses on Irish land tenure arrangements. The traditional
claim was that the landlord-tenant system which prevailed in the decades after the Famine
discouraged investment in agriculture: absentee landlords did not invest, while tenants feared that if
they invested, the benefit would be appropriated by landlords raising their rent. A series of reforms,
starting with the (half-hearted) Land Act of 1870, ensued, culminating in the transfer of ownership to
the Irish peasant. By the early twentieth century, the major impediment to the development of Irish
agriculture was gone.
The problem with this traditional view is that Irish landlords did not rackrent or capriciously
evict in the years prior to 1870, as would have had to have been the case for tenant investment to
have been discouraged. Barbara Solow [1971] showed this convincingly, and went on the counter-
offensive: not only were the land reforms of the late 19th century based on a mistaken analysis of
landlord-tenant relations, but they actually hurt Irish agriculture. The 1870 Land Act made landlords
compensate tenants for (1) eviction (unless the eviction was for non-payment of rent), and (2) the
value of any improvements the tenants had made to their holding. Solow claims that one effect of (2)
was to cut off landlord investment, as landlords were afraid that tenants might claim compensation
for investments the landlords had funded. Thus the Act reduced investment in Irish agriculture at
precisely the time when the Great Depression and developments in Denmark and elsewhere made
16 Solow [1971], pp. 86, 198.
17 Solow [1971], p. 88.
18 Solow [1971], pp. 165-66.
19 Plunkett [1982], p. 61.
11
such investment essential.16
Second, Solow emphasized that one effect of the turmoil over property rights in land was that
enormous effort and resources went, literally, into rent-seeking activities. (By contrast, tenant reform
in Denmark had already largely taken place by mid century: see Jensen [1937], pp. 125-6.) The
effect of the 1870 Act was, she writes, �a signal to both sides to �look to their rights� and gird for
further battle. But the real problem in Ireland was not the division of a given pie, but the provision of
a larger one...�17 She is even harsher about the effects of the 1881 Land Act, which enabled tenant
farmers to go to court to obtain judicially determined rent reductions:
Incentives to adjust the economy in the face of new international conditions were to someextent paralysed. There is no need to take too seriously landlord contentions that everybody rushedto court and neglected his farming, but if tenants could increase income more by litigation than bychanging agricultural techniques, they would certainly do so. If valuers were swayed by appearances,a premium was even put on worse farming, and consequent dilapidation...with the tenants of Irelandcrowding into court, no one was thinking about agricultural education, credit and marketingprograms, improved cropping, selective breeding, and, in general, ways of assisting tenants to adjustto changed economic conditions.18
Third, Horace Plunkett took the argument one step further, by asserting that this emphasis on
government policy, itself a byproduct of earlier harmful policies, led to a weakening of the national
moral fibre: �...we in Ireland have yet to free ourselves from one of the worst legacies of past
misgovernment, the belief that any legislation or any legislature can provide an escape from the
physical and mental toil imposed through our first parents upon all nations for all time.�19
Fourth, there was widespread violence associated with the �Land War� in the 1870s and
1880s, as well as boycotts and similar tactics. This must have retarded economic development in
parts of rural Ireland, at least to some extent. One question which the next section will try to address
20 West [1986], p. 184.
21 Cited in West [1986], p. 21.
12
is whether the legacy of the Land Wars continued to have an impact on rural development into the
1890s and beyond.
More generally, one could argue that the unsettled political condition of Ireland, and in
particular the ongoing debate about its constitutional position, damaged the prospects for Irish
economic development. Indeed, the land war and nationalist politics were inseparably intertwined, as
the landlord class the tenants were seeking to dispossess were viewed by many as the representatives
of British rule in Ireland. For example, the �national struggle� may have diverted talent from
economically productive activities, hence lowering Ireland�s growth rate [Baumol 1990; Murphy,
Shleifer and Vishny 1991]. An instructive case is that of Horace Plunkett, the leader of the Irish
cooperative movement, committed to the ideal of interdenominational cooperation to solve Ireland�s
economic problems. Although Plunkett himself felt that politics played far too important a role in
Irish life, he took a seat in Parliament in 1892 as a unionist candidate for south Dublin. His
willingness to ally himself with nationalists to pursue his economic agenda lost him unionist support,
and cost him his seat in 1900; while his 1904 book, Ireland in the New Century, with its attacks on
the influence of the Roman Catholic Church and the tactics of the Nationalist party, its advocacy of
the union and its comments on the defects of the Irish personality, alienated many nationalists. The
failure of unionists to advance a positive Irish program led to Plunkett�s conversion to Home Rule in
1911, but he was not sufficiently radical for many nationalists. In 1919 he proposed that Ireland be a
self-governing dominion (not a republic) within the Empire: for this he was attacked by all sides.20
Thus it was that Plunkett, who felt that �politics are by no means the most useful, or indeed
the most edifying, of a nation�s activities�21 became diverted from what he saw as the greatest Irish
issue of the day (the economy) into a personally damaging involvement in constitutional politics.
Not only did this distract his attentions away from the economy; it earned him many enemies, which
did not help his cooperative movement. Plunkett was appointed to the Irish Senate in 1922, the first
22 West, op. cit.
23 Cited in Plunkett [1982], pp. 190-91.
13
year of Irish independence. The following year his house was burnt down by Republicans, Plunkett
resigned his Senate seat, and the founder of the Irish cooperative movement emigrated to England,
where he spent the rest of his life.22
Politics introduced a divisiveness into public life which could make it difficult for collective
action to be effectively embarked upon. On one famous occasion, R.A. Anderson, an associate of
Plunkett�s, was prevented from addressing a local meeting on the subject of cooperation, when a
local solicitor discovered that the cooperative movement was apolitical and non-denominational. The
solicitor informed Anderson that cooperation �would not suit Rathkeale. �Rathkeale,� said he
pompously, �is a Nationalist town-- Nationalist to the backbone-- and every pound of butter made in
this Creamery must be made on nationalist principles, or it shan�t be made at all.� This sentiment
was applauded loudly and the proceedings terminated.�23
Finally, the cooperative movement and other attempts to improve Irish living standards were
viewed with suspicion by some Nationalists, not just because many leaders of these movements were
of the wrong religion or political persuasion, but because if the attempts were successful, this might
undermine the demand for Independence. �It had been enough to see the powerful lever of the land
agitations weakened by agrarian legislation. To improve the position of the people further was to
destroy Home Rule utterly� [Smith-Gordon and Staples 1917, p. 47]. The IAOS frequently
complained that they had to contend, not just with the vested interests of traders, but with a hostile
Nationalist Press, and the opposition of local politicians.
IV CREAMERY DIFFUSION IN IRELAND: ECONOMETRIC EVIDENCE
Was the diffusion of creameries across Ireland a purely rational response to economic
circumstances, as Ó Gráda argues, or were illiteracy, or the struggle over the land, or other political
or cultural factors important? To test some of the hypotheses suggested by the above discussion, I
14
collected data on the number of cooperative creameries (COOPS) in each county in Ireland from
1901 to 1914. The data come from the annual reports of the IAOS. I also collected data on a variety
of county characteristics, to see what was correlated with creamery diffusion. From the Irish
Agricultural Statistics I collected annual data on milch cows (COWS), and the share of farms
between 15 and 30 acres (SHARE1), 30 and 50 acres (SHARE2), and 50 to 100 acres (SHARE3).
Since the Agricultural Statistics also give the total acreage of each county, I was able to calculate
cow density annually (DENSITY), defined as milch cows per 1000 acres. From 1906 on, the
Agricultural Statistics break down the total number of farms in each county into those which were
owned by the occupant and those which were tenanted; OWNSHARE is the percentage of farms
which were owner-occupied.
From the Censuses of 1901 and 1911 I collected data for each county on population (POP,
measured in thousands), the share of Roman Catholics in the total population (RCSHARE), and the
illiteracy rate (ILLIT). Annual data for 1902 to 1910 for these census variables were generated by
interpolation; interpolating between 1911 and 1926 (the next Census year) would be an inappropriate
way to generate data for the years 1912-14 (the Great War, independence and partition all had
important effects on the religious composition of the population) and so I used the 1911 data for
those three years.
Finally, I collected data on rent reductions under the 1881 Land Act from the Report of the
Irish Land Commissioners for the year ending March 31st 1914. The Act allowed tenants to go to
court and ask it to fix a fair rent; or the Land Commission could be asked to arbitrate between
landlord and tenant; or landlords and tenants could jointly agree a rent and register the agreement
with the court. For each county, I calculated the percentage of all rent reductions under the 1881 Act
that had been reached through agreement between landlord and tenant (AGREE) through March 31st
1914; this percentage ranged from a maximum of 63.8% (in Co. Londonderry) to 12.8% (in Co.
Mayo). My interpretation of the variable is that it is proxying for the state of landlord-tenant
relations, and thus (hopefully) for the virulence with which the Land Wars were fought; the variable
24 There are four provinces in Ireland: Leinster in the east and Ulster in the north were the mostprosperous, while Connaught in the west was the least so.
15
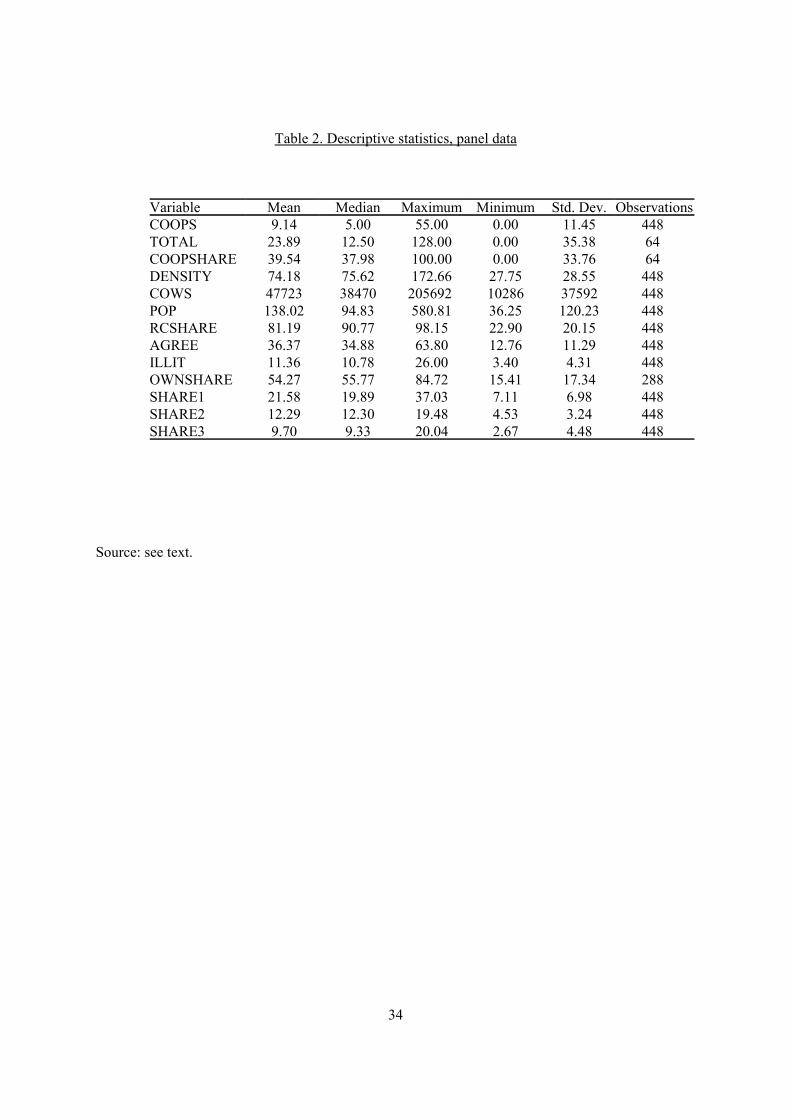
as calculated here is constant over time within each county. Descriptive statistics for each variable
are provided in Table 2.
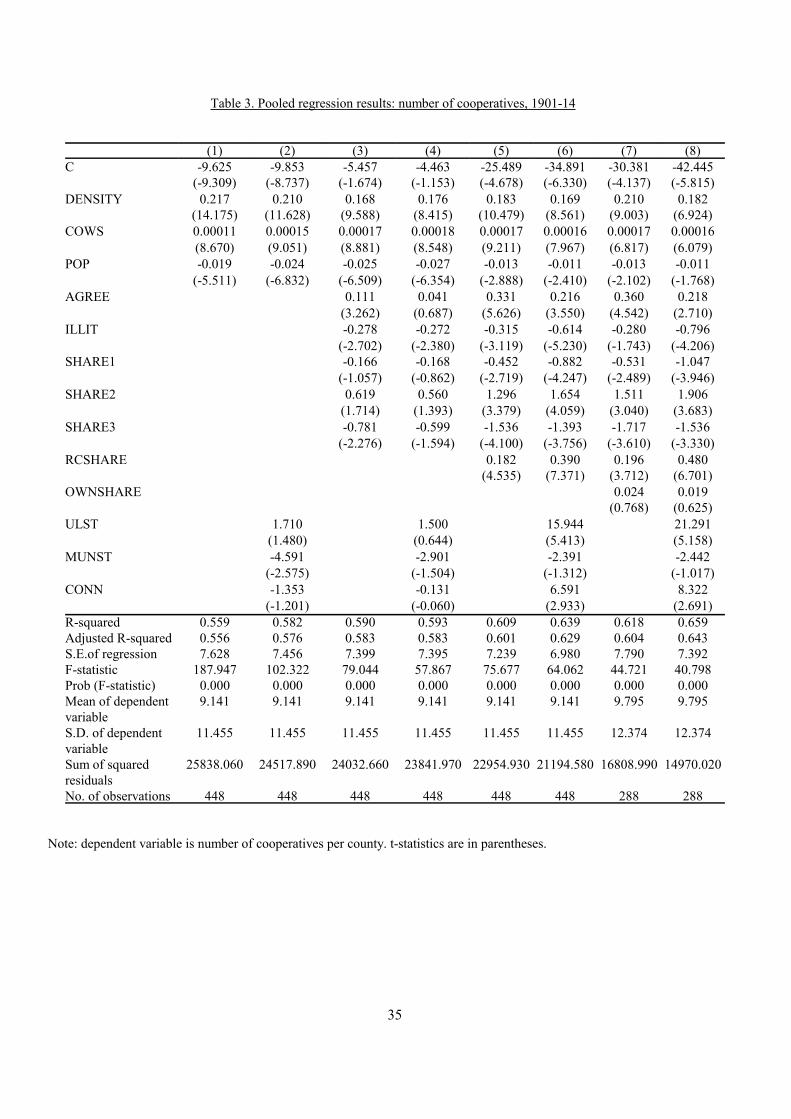
Table 3 reports a number of pooled OLS regressions that were run trying to explain the
number of cooperative creameries per county. Equation (1) reproduces Ó Gráda�s [1977] findings:
the number of cooperatives is strongly and positively related to cow density and total cow numbers,
and strongly and negatively related to population. The coefficients suggest that counties had one
extra creamery for every 10,000 cows, and that increasing the population by 100,000 was associated
with two fewer creameries. 10 more cows per thousand acres (an increase in DENSITY of roughly
13.5%) was associated with two extra creameries (an increase of roughly 21.9%), implying an
elasticity of about 1.6. Ó Gráda is clearly right to argue that economic logic had a lot to do with the
spread of creameries; but were other factors important too?
Equation (2) provides the first hint that this might be so; the coefficient on a Munster dummy
variable is large, negative and highly significant, while the coefficient on an Ulster dummy is positive
and statistically significant at the 15% level.24 Equation (3) therefore adds the three farm size
variables to the regression, as well as two non-economic variables: ILLIT and AGREE. Both are
strongly related to COOPS, and have the expected signs, a higher illiteracy rate being associated with
fewer cooperatives, and more agreement between landlords and tenants being associated with more
cooperatives. Farms between 30 and 50 acres are positively associated with cooperatives, while
smaller and larger farms are negatively related to creamery diffusion. These findings are all robust to
the inclusion of provincial dummies [equation (4)], and to the inclusion of religious affiliation [(5)
and (6)], although the coefficients on the farm size variables (and, in one instance only, AGREE)
occasionally dip below conventional levels of statistical significance. Finally, adding the percentage
of owner occupancy does not change the signs of the other coefficients; ownership is positively but
insignificantly related to creamery diffusion. This suggests that tenant ownership did not contribute
25 I am grateful to Eugene White for pointing this out to me.
26 The data on farm sizes is problematic: the size ranges which the two countries� statistics provideare not the same. I therefore adopted the expedient solution of assuming that farms were evenlydistributed within each size category in Denmark, which allowed me to calculate the share of Danish
16
to agricultural prosperity in Ireland, consistent with the arguments of Crotty [1966] and Guinnane
and Miller [1997]. Once enough control variables have been added, the Munster effects disappears, to
be replaced by a strong (and positive) Ulster effect, which is not surprising, and a strong positive
Connaught effect, which at first glance does seem surprising. A look at the map [Ó Gráda 1977, p.
290] makes it clear, however, that the Connaught effect is really the Ulster effect in another guise;
creameries were strong in Connaught counties like Sligo and Leitrim, which bordered Ulster; there
was just one creamery in Mayo during this period, and none at all in Galway.25
The regressions in Table 3 show that, ceteris paribus, Catholicism is positively associated
with cooperatives. Table 4 explores the issue of religion and creamery diffusion more closely;
equation (1) shows that when the only control variables included are Ó Gráda�s �economic� ones,
Catholicism is negatively related to COOPS, with the coefficient significant at the 10% level. In the
Irish context, Catholicism is to a large extent proxying for a range of other sociological and political
attributes in a divided society. Catholics were less literate than Protestants, for example; but
controlling for illiteracy leaves the coefficient on RCSHARE unaffected [equation (2)]. Catholics
were also, unsurprisingly, less likely to agree on a rent reduction with their landlord (the correlation
coefficient between RCSHARE and AGREE being -0.728); controlling for AGREE leads to the
coefficient on RCSHARE becoming positive [equation (3)]. Similarly, there were fewer Catholics in
Ulster, and controlling for the Ulster effect also reverses the sign of the RCSHARE coefficient
Table 5 uses the results to try to account for the differences in creamery diffusion in the two
countries. The table takes the coefficients from equation 3 in Table 3, and asks how many creameries
there would have been in the average Irish county if it had faced Danish rather than Irish conditions.
Danish illiteracy is taken to have been zero, and the absence of land conflict in Denmark is proxied
by setting AGREE equal to 100.26 The first row in the table confirms Ó Gráda�s assertion that cow
farms falling within the three Irish size ranges.
17
densities were crucial; there would have been roughly twice as many cooperatives in Ireland had
Ireland enjoyed Danish cow densities. This is highly suggestive, since there were slightly more than
twice as many creameries (both private and cooperative) in Denmark per milch cow as there were in
Ireland. However, authors stressing education and conflict are also right: Ireland would also have had
twice as many cooperatives if it had enjoyed universal literacy and avoided the struggles over land
tenure which characterized the last decades of the 19th century.
I interpret these results as follows: economic considerations were important in determining
the diffusion of creameries, but so were non-economic factors. In particular, the suspicion that
Danish success may have had something to do with superior Danish literacy seems born out by the
evidence that cooperatives did not diffuse as much in the more illiterate parts of Ireland. Similarly,
Solow is right to attribute negative effects to the Land Wars and their aftermath. Disagreement
between landlord and tenant hurt diffusion, while the eventual outcome of the conflict, tenant
ownership, did nothing to help it. There are various ways to interpret the positive effects of
agreement between landlord and tenant: maybe conflictual landlord-tenant relations were associated
with a history of land war violence, or with the diversion of effort away from productive farming and
into rent-seeking, or with or a lack of social cohesion. For example, maybe healthy inter-
denominational relations were good for innovation in an age when in many rural communities it was
Protestants who possessed the education and capital required to get a creamery off the ground.
V CREAMERIES, COOPERATION AND CULTURE
More interesting, perhaps, from a theoretical point of view are arguments that the Irish
farming community seemed unable to solve collective action problems efficiently. A good example
from mid-century lies in the practice of dairy farmers of soaking their firkins in whatever water came
to hand� rivers, ponds, bog-holes� so as to increase their measured weight when they came to market
[Donnelly 1971, p. 150]. This was partly in response to the merchants� practice of adding 2 pounds to
18
the real weight of the cask (i.e. subtracting 2 pounds from their estimate of the butter�s weight),
which was itself a response to the farmers� practice of soaking. Indeed, the so-called �soakage
allowance� was an important source of income for exporters, who levied it on all suppliers, whether
the casks had been soaked or not; the practice was banned by weights and measures legislation in
1862 [Donnelly 1971, p. 145]. The predictable result of these practices was dirty casks and lower
butter quality.
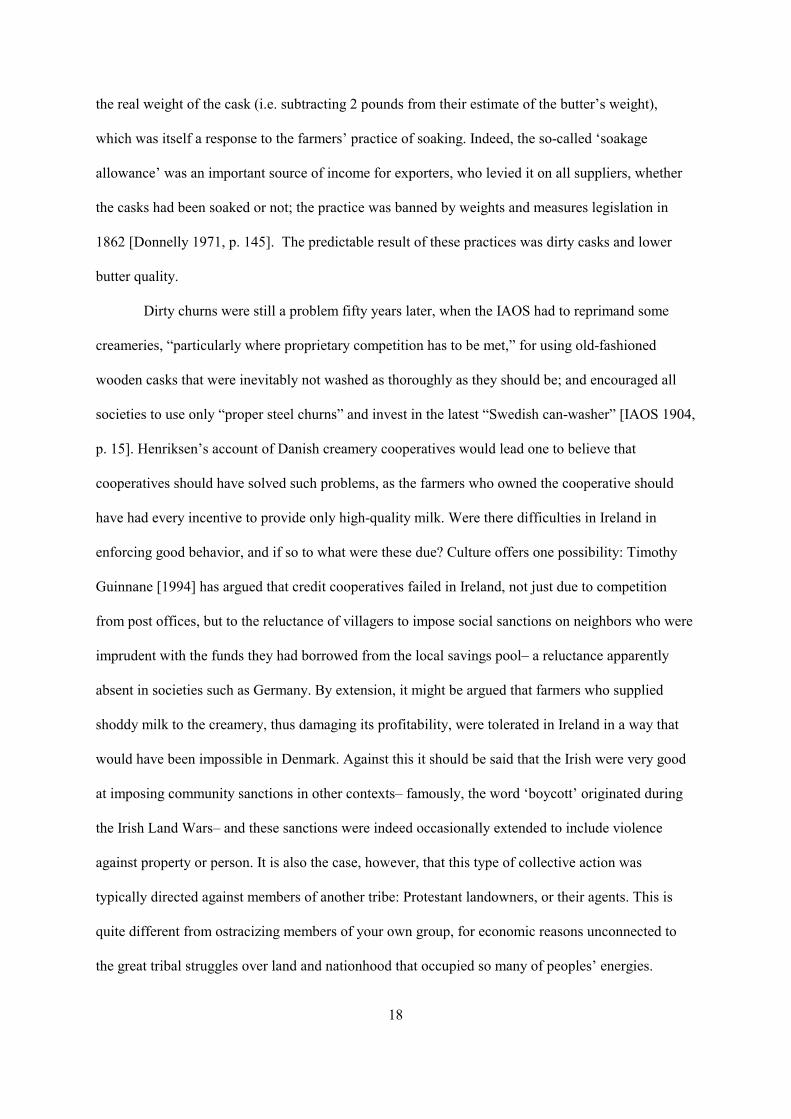
Dirty churns were still a problem fifty years later, when the IAOS had to reprimand some
creameries, �particularly where proprietary competition has to be met,� for using old-fashioned
wooden casks that were inevitably not washed as thoroughly as they should be; and encouraged all
societies to use only �proper steel churns� and invest in the latest �Swedish can-washer� [IAOS 1904,
p. 15]. Henriksen�s account of Danish creamery cooperatives would lead one to believe that
cooperatives should have solved such problems, as the farmers who owned the cooperative should
have had every incentive to provide only high-quality milk. Were there difficulties in Ireland in
enforcing good behavior, and if so to what were these due? Culture offers one possibility: Timothy
Guinnane [1994] has argued that credit cooperatives failed in Ireland, not just due to competition
from post offices, but to the reluctance of villagers to impose social sanctions on neighbors who were
imprudent with the funds they had borrowed from the local savings pool� a reluctance apparently
absent in societies such as Germany. By extension, it might be argued that farmers who supplied
shoddy milk to the creamery, thus damaging its profitability, were tolerated in Ireland in a way that
would have been impossible in Denmark. Against this it should be said that the Irish were very good
at imposing community sanctions in other contexts� famously, the word �boycott� originated during
the Irish Land Wars� and these sanctions were indeed occasionally extended to include violence
against property or person. It is also the case, however, that this type of collective action was
typically directed against members of another tribe: Protestant landowners, or their agents. This is
quite different from ostracizing members of your own group, for economic reasons unconnected to
the great tribal struggles over land and nationhood that occupied so many of peoples� energies.
19
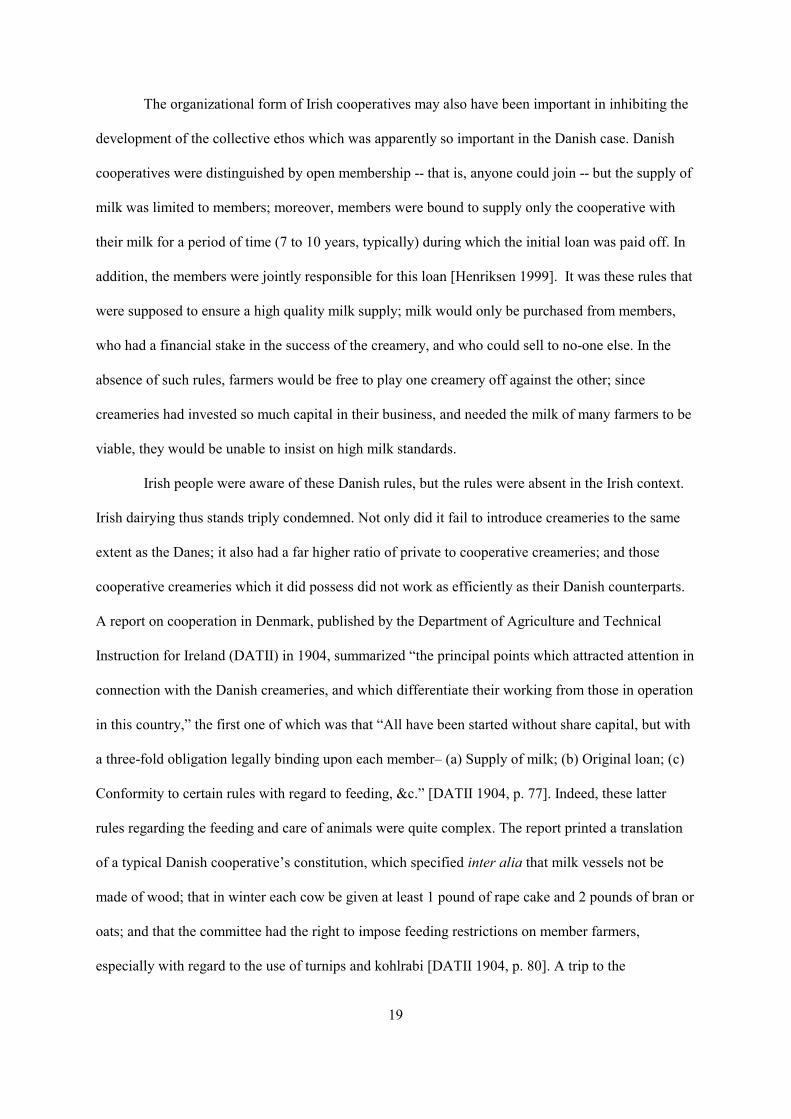
The organizational form of Irish cooperatives may also have been important in inhibiting the
development of the collective ethos which was apparently so important in the Danish case. Danish
cooperatives were distinguished by open membership -- that is, anyone could join -- but the supply of
milk was limited to members; moreover, members were bound to supply only the cooperative with
their milk for a period of time (7 to 10 years, typically) during which the initial loan was paid off. In
addition, the members were jointly responsible for this loan [Henriksen 1999]. It was these rules that
were supposed to ensure a high quality milk supply; milk would only be purchased from members,
who had a financial stake in the success of the creamery, and who could sell to no-one else. In the
absence of such rules, farmers would be free to play one creamery off against the other; since
creameries had invested so much capital in their business, and needed the milk of many farmers to be
viable, they would be unable to insist on high milk standards.
Irish people were aware of these Danish rules, but the rules were absent in the Irish context.
Irish dairying thus stands triply condemned. Not only did it fail to introduce creameries to the same
extent as the Danes; it also had a far higher ratio of private to cooperative creameries; and those
cooperative creameries which it did possess did not work as efficiently as their Danish counterparts.
A report on cooperation in Denmark, published by the Department of Agriculture and Technical
Instruction for Ireland (DATII) in 1904, summarized �the principal points which attracted attention in
connection with the Danish creameries, and which differentiate their working from those in operation
in this country,� the first one of which was that �All have been started without share capital, but with
a three-fold obligation legally binding upon each member� (a) Supply of milk; (b) Original loan; (c)
Conformity to certain rules with regard to feeding, &c.� [DATII 1904, p. 77]. Indeed, these latter
rules regarding the feeding and care of animals were quite complex. The report printed a translation
of a typical Danish cooperative�s constitution, which specified inter alia that milk vessels not be
made of wood; that in winter each cow be given at least 1 pound of rape cake and 2 pounds of bran or
oats; and that the committee had the right to impose feeding restrictions on member farmers,
especially with regard to the use of turnips and kohlrabi [DATII 1904, p. 80]. A trip to the
20
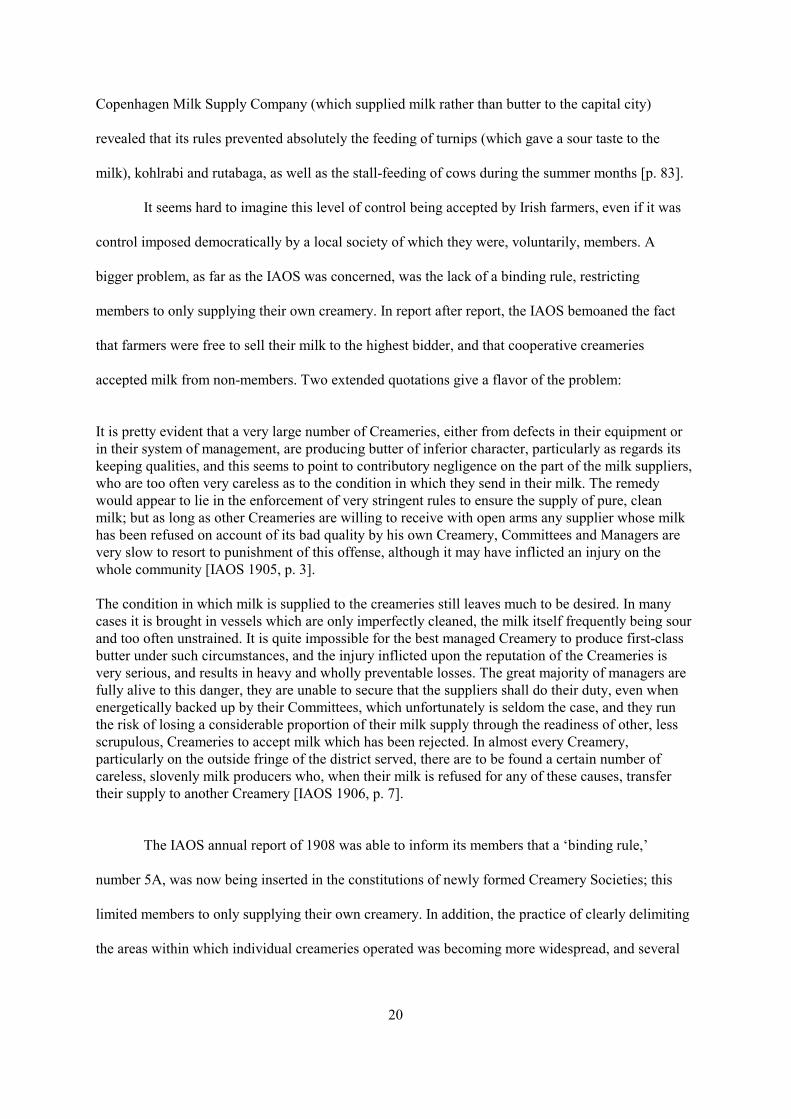
Copenhagen Milk Supply Company (which supplied milk rather than butter to the capital city)
revealed that its rules prevented absolutely the feeding of turnips (which gave a sour taste to the
milk), kohlrabi and rutabaga, as well as the stall-feeding of cows during the summer months [p. 83].
It seems hard to imagine this level of control being accepted by Irish farmers, even if it was
control imposed democratically by a local society of which they were, voluntarily, members. A
bigger problem, as far as the IAOS was concerned, was the lack of a binding rule, restricting
members to only supplying their own creamery. In report after report, the IAOS bemoaned the fact
that farmers were free to sell their milk to the highest bidder, and that cooperative creameries
accepted milk from non-members. Two extended quotations give a flavor of the problem:
It is pretty evident that a very large number of Creameries, either from defects in their equipment orin their system of management, are producing butter of inferior character, particularly as regards itskeeping qualities, and this seems to point to contributory negligence on the part of the milk suppliers,who are too often very careless as to the condition in which they send in their milk. The remedywould appear to lie in the enforcement of very stringent rules to ensure the supply of pure, cleanmilk; but as long as other Creameries are willing to receive with open arms any supplier whose milkhas been refused on account of its bad quality by his own Creamery, Committees and Managers arevery slow to resort to punishment of this offense, although it may have inflicted an injury on thewhole community [IAOS 1905, p. 3].
The condition in which milk is supplied to the creameries still leaves much to be desired. In manycases it is brought in vessels which are only imperfectly cleaned, the milk itself frequently being sourand too often unstrained. It is quite impossible for the best managed Creamery to produce first-classbutter under such circumstances, and the injury inflicted upon the reputation of the Creameries isvery serious, and results in heavy and wholly preventable losses. The great majority of managers arefully alive to this danger, they are unable to secure that the suppliers shall do their duty, even whenenergetically backed up by their Committees, which unfortunately is seldom the case, and they runthe risk of losing a considerable proportion of their milk supply through the readiness of other, lessscrupulous, Creameries to accept milk which has been rejected. In almost every Creamery,particularly on the outside fringe of the district served, there are to be found a certain number ofcareless, slovenly milk producers who, when their milk is refused for any of these causes, transfertheir supply to another Creamery [IAOS 1906, p. 7].
The IAOS annual report of 1908 was able to inform its members that a �binding rule,�
number 5A, was now being inserted in the constitutions of newly formed Creamery Societies; this
limited members to only supplying their own creamery. In addition, the practice of clearly delimiting
the areas within which individual creameries operated was becoming more widespread, and several
21
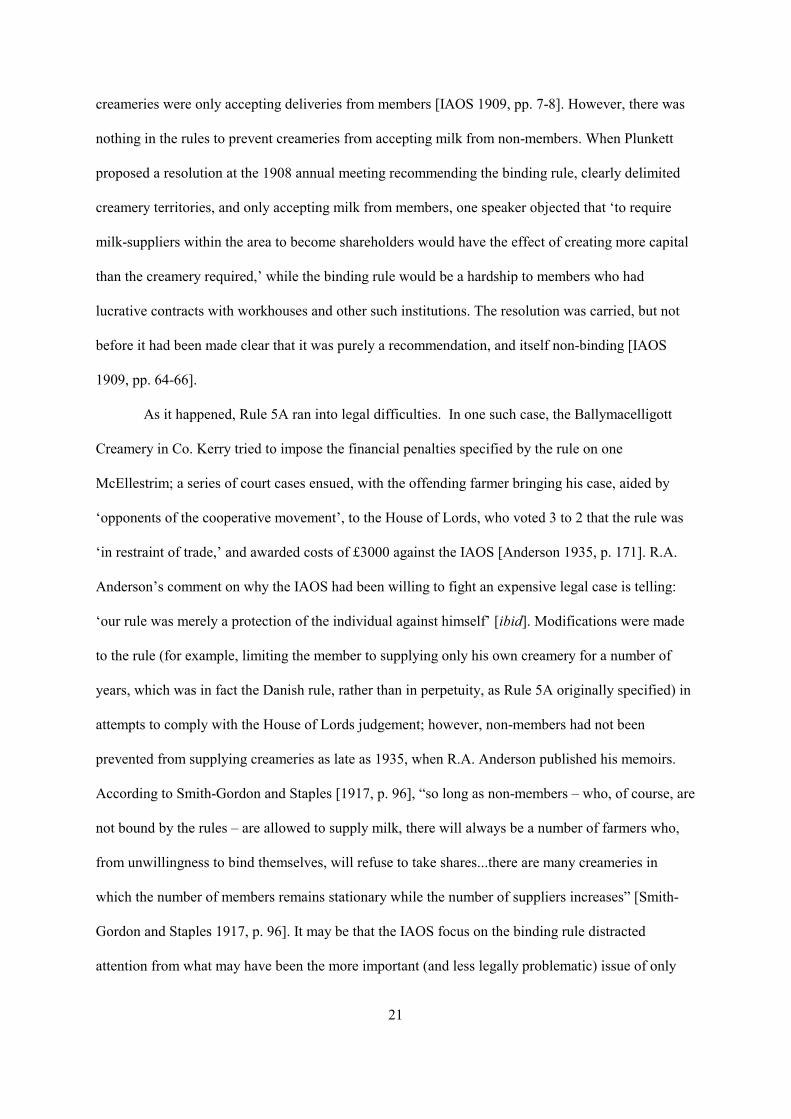
creameries were only accepting deliveries from members [IAOS 1909, pp. 7-8]. However, there was
nothing in the rules to prevent creameries from accepting milk from non-members. When Plunkett
proposed a resolution at the 1908 annual meeting recommending the binding rule, clearly delimited
creamery territories, and only accepting milk from members, one speaker objected that �to require
milk-suppliers within the area to become shareholders would have the effect of creating more capital
than the creamery required,� while the binding rule would be a hardship to members who had
lucrative contracts with workhouses and other such institutions. The resolution was carried, but not
before it had been made clear that it was purely a recommendation, and itself non-binding [IAOS
1909, pp. 64-66].
As it happened, Rule 5A ran into legal difficulties. In one such case, the Ballymacelligott
Creamery in Co. Kerry tried to impose the financial penalties specified by the rule on one
McEllestrim; a series of court cases ensued, with the offending farmer bringing his case, aided by
�opponents of the cooperative movement�, to the House of Lords, who voted 3 to 2 that the rule was
�in restraint of trade,� and awarded costs of £3000 against the IAOS [Anderson 1935, p. 171]. R.A.
Anderson�s comment on why the IAOS had been willing to fight an expensive legal case is telling:
�our rule was merely a protection of the individual against himself� [ibid]. Modifications were made
to the rule (for example, limiting the member to supplying only his own creamery for a number of
years, which was in fact the Danish rule, rather than in perpetuity, as Rule 5A originally specified) in
attempts to comply with the House of Lords judgement; however, non-members had not been
prevented from supplying creameries as late as 1935, when R.A. Anderson published his memoirs.
According to Smith-Gordon and Staples [1917, p. 96], �so long as non-members � who, of course, are
not bound by the rules � are allowed to supply milk, there will always be a number of farmers who,
from unwillingness to bind themselves, will refuse to take shares...there are many creameries in
which the number of members remains stationary while the number of suppliers increases� [Smith-
Gordon and Staples 1917, p. 96]. It may be that the IAOS focus on the binding rule distracted
attention from what may have been the more important (and less legally problematic) issue of only
22
accepting milk from members.
Another difference between the organizational form of Danish and Irish creameries
concerned the provision of capital. Danish creameries had no share capital, but members were jointly
responsible for the bank loan which was taken out to construct the creamery and manager�s
residence, purchase equipment, and so on. In Ireland, members held shares in the amount of one
pound per cow, but only paid 2s./6. at the time they were allotted their shares. More importantly,
banks who loaned money to cooperatives insisted �upon a collective note from the members of the
committee, so that in case of necessity they will be able to proceed against one or two prominent
persons for the whole amount of the loan. The committee members in turn must protect themselves,
and this they do as a rule by the issue of loan guarantee shares. Every member may be obliged to take
out one of these shares with every ordinary share he holds. The nominal value is £1, but only 1 s. is
paid, and the rest is payable only on liquidation. Another method is for the members to sign a
collective letter of indemnity to the committee, but the process of collection would probably be slow�
[Smith-Gordon and Staples 1917, p. 101]. Thus, it was the committee, in the first instance, rather than
the membership as a whole, which was responsible for the society�s loans, which further undermined
members� stake in their creamery; the Irish system also made it impossible to remove committee
members as long as they were guarantors, undermining the democratic nature of the cooperative.
There are various ways to interpret the failure of Irish creameries to adopt Danish
organizational forms. It may have represented entrepreneurial failure, an inability to understand the
incentive mechanisms involved; more plausibly, perhaps (since the above quotations suggest that the
issues involved were very well understood in Ireland), it may have reflected the fact that creameries
were unable to get local farmers to bind themselves in the Danish manner, in which case culture may
have been to blame. It could of course be argued that the existence of large numbers of private
creameries in Ireland meant that farmers would have been foolish to bind themselves, rather than play
off private creamery against cooperative; but private creameries outnumbered cooperatives in
Denmark well into the 1880s, but were then completely displaced, their numbers declining as many
23
converted to the cooperative form. It seems as though the Danes were decisively convinced of the
merits of the cooperative form and switched over wholesale: this did not occur in Ireland.
Table 6 provides some evidence relating culture, and in particular religious affiliation, to the
choice of organizational form in the Irish dairy industry. The Agricultural Statistics provide county-
level data on the numbers of private creameries in 1905 and 1906. The first regression in Table 6 uses
these data to explore the determinants of total creamery numbers (private plus cooperative) across
counties. Qualitatively, the results look identical to those in Table 3: creameries are positively related
to cow density, literacy, an absence of land conflict, farms in the 30-50 acre bracket, and the share of
Catholics in the population. It thus looks as though Table 3 was primarily explaining the diffusion of
a new technology� the milk separator� rather than a new organization� the cooperative creamery.
Equation (2) explores the determinants of the propensity to cooperate, as measured by the percentage
of creameries in a county which were cooperative. The positive coefficient on DENSITY makes
sense: IAOS officials insisted on a minimum number of cattle within a certain radius of a proposed
creamery before they would support the proposal [Smith-Gordon and Staples 1917, p. 97].
Interestingly, the coefficient on ILLIT is positive: illiteracy impeded the adoption of new
technologies, but did not inhibit the propensity to cooperate. Most importantly, the coefficient on
RCSHARE is negative and statistically significant, while the coefficient on the Munster dummy
variable is extremely large and negative. The proportion of cooperatives in a county�s creameries fell
by 1.1 percentage points for every one percentage point increase in the share of Catholics in the
population. This is certainly consistent with the arguments of La Porta et al. [1997] regarding the
negative relationship between hierarchical religions and trust, and suggests that Catholic culture may
have been less conducive to this type of cooperation than Protestantism.
A further instance of a possible Irish collective action failure concerns the financing of the
IAOS. Its main function was propagandist � promoting the spread of cooperatives � but it also helped
to set up new societies, and assisted societies with technical assistance, both with regard to dairy
machinery and butter-making generally, and in helping societies with their account-keeping. It also
24
lobbied on behalf of the cooperative sector, and was involved in attempts to develop a national
testing procedure that could guarantee the quality of Irish butter. Member societies were supposed to
pay affiliation fees related to turnover, but the IAOS was in permanent financial difficulty, despite a
brief period of subvention from the DATII (of which Plunkett was the first Vice-President). It relied
largely on donations from Plunkett himself, and from other grandees such as Lord Dunsany, and
Andrew Carnegie. The IAOS certainly saw this as a failure of the cooperative spirit: farmers �have
been allowed to enjoy the privileges of membership without being brought to recognize their source
and without sufficient insistence upon the attendant responsibilities, and like all people who have had
the opportunity of getting something for nothing they are now unwilling to pay full value� [Smith-
Gordon and Staples 1917, p. 88]. Danish cooperatives were apparently willing to pay for their
regional and national organizations; could this represent another example of an ability to surmount
free-rider problems, which was absent in Ireland?
One of the most puzzling differences between Ireland and Denmark in the period from 1870
to 1914, which suggests that cultural forces may have mattered in the relative diffusion of the
cooperative creamery, was the different ways in which innovation was spread in the two countries.
Agricultural reform in Denmark was from the bottom up; that is, Danish farmers took it upon
themselves to set up cooperatives, establish quality standards, etc. without anyone having to tell them
to do so. The cooperatives were a purely private response to market conditions; thus, the first
cooperative set up in Hjedding, Jutland in 1882 instituted the �partnership contract� that was
emulated all over the country. This contract was drawn up by a local farmer, who had had experience
as chairman of a local fire insurance society and of a savings bank [Henriksen 1999]. Such farmers
were probably fairly rare in the Irish context. Equally telling is the example of the �Lur� butter brand.
In 1899 the federated creameries decided to establish a brand to cover all Danish export butter. The
brand was designed as a certificate of national origin (some foreign butter had been passing itself off
as Danish on the international market), and eventually became a guarantee of quality as well. By
1903 98% of all creameries had voluntarily adopted the brand; only at that stage were moves made by
27 Jensen [1937], pp. 326-27.
28 West [1986], pp. 103-4.
29 Ó Gráda [1977], p. 289.
30 Anderson [1935], Chapter XVI.
25
government to make the use of the brand compulsory.27
The contrast with Ireland could not be greater. The cooperative movement was founded
largely as a result of the efforts of a group of patriotic aristocratic reformers whose attitudes towards
the peasantry could occasionally be condescending, although they were clearly well-motivated.
�Noblesse oblige� was not only a motivating factor in the lives of many of these reformers, but the
title of a pamphlet Plunkett wrote in 1908 to convince the gentry at large to join him in the struggle
for cooperation.28
One could argue that the �top down� nature of cooperative reform in Ireland is an illusion,
produced by the standard histories of the period which emphasize personalities such as Plunkett.
Maybe a widespread creamery movement would have spread in the absence of Plunkett�s efforts:
creameries were a logical institutional response to the invention of the centrifugal separator. Indeed,
as we have seen, privately-run creameries were set up before the first co-operative creamery, and
handled as much milk as the co-operative creameries into the 1920s.29 The cooperative movement is
not, however, the only example of reform coming from above.
Once again, the example of quality control is instructive. The IAOS tried to set up a national
butter brand in 1910, but the system eventually folded for lack of government support.30 A quality
control system was eventually established in the 1920s by the Free State government; a Danish
commentator, Jørgen Pedersen [1926], was horrified by what he saw. The system relied on
inspection by government officials and the police, who could impose penalties on establishments not
conforming with government regulations. Pedersen felt that such intrusive government interference
would be quite unacceptable in Denmark, and that the regulations might have the effect of driving
31 Pedersen [1926], pp. 432-34.
32 Interestingly, the coefficient on AGE is negative, albeit insignificant at conventional levels� olderfirms were not more profitable, which is at odds with Ó Gráda�s argument that creameries spread firstwere they were most profitable.
26
farmers away from butter production altogether.31 This image of a liberal Dane chastising the Irish
for their statist inclinations may seem counterintuitive, but the history of agricultural reforms in the
two countries bears it out in many respects.
Tables 7 and 8 bring some econometric evidence to bear on the issue of top-down economic
reform. I collected data from the 1913 IAOS annual report on individual creameries; inter alia they
reported their net profits, age, turnover, milk use, share and loan capital, and membership, as well as
their contributions to the IAOS. The variables used are the profit rate (calculated as profits divided by
the sum of share capital plus loan capital), AGE, SCALE (i.e. thousands of gallons of milk received),
PERCENTSHARE (i.e. share capital as a percentage of total capital), and AVGSHARE (i.e. share
capital divided by membership). Table 7 shows that the two big influences on profitability seem to
have been scale, as might have been expected, and AVGSHARE. Increasing the scale of a creamery
by a half standard deviation (123.026) raised the profit rate by a third, while increasing the average
share capital per member by a half standard deviation (2.056) lowered the profit rate by 40% relative
to its mean value (7.23) (all descriptive statistics are given in O�Rourke [1999], Table 15). The
negative sign on AVGSHARE suggests that it was better for profitability to have many small
member-shareholders rather than a few large member-shareholders, which might indicate the active
involvement of local philanthropically-minded gentry, rather than the peasants whose farming
practices were the key to the creamery�s success.32
The dependent variable in Table 8 is another measure of the propensity to cooperate: the
extent to which individual creameries donated money to the IAOS. The rationale behind the
regression is that contributions indicated a willingness to pay for a public good. They were supposed
to be proportional to turnover, and SCALE is indeed strongly and positively related to donations.
AGE is negatively related: old friends were not best, it seems. Rather, newer IAOS members seem to
33 The IAOS report specifies which county each creamery is in.
34 The coefficient is statistically significant at the 15% level.
35 The negative sign on AGREE was unexpected; taken in conjunction with the results in Table 3, itmight be interpreted as follows. Tension related to the Land Wars and/or land reform was bad forinnovation; but it may have enhanced group solidarity (vis à vis the landlord class) through boycotts,rent strikes, or other mechanisms. Thus, while such regions were less likely to adopt newtechnologies, they were more likely to behave in a cooperative manner once having done so.
27
have been keener to support an organization that had recently helped them get established. Donations
are positively related to the percentage of share capital; maybe share capital is an index of creamery
members� willingness to cooperate; maybe creameries were unwilling to be generous while they had
large debts to pay. The coefficient on RESERVE, the size of the creameries� reserve fund, is positive,
suggesting that financial security made it easier for creameries to support the IAOS.
It seems that creameries� contributions were largely determined by their financial
circumstances. Did the cultural environment within which they operated also matter? The positive
coefficient on AVGSHARE is suggestive: having your capital provided by a few wealthy individuals
may not have been good for incentives and profitability (Table 7), but it made for more donations to
the IAOS coffers. Raising AVGSHARE by a half standard deviation raised contributions by 12%
relative to their mean value (£4.463). Once again, the image of philanthropically-motivated gentry
rather than hard-nosed peasants being involved in the cooperative movement seems to emerge from
the data. The county-level variables used in earlier tables are added to the regression in equation
(4).33 RCSHARE is negatively related to contributions, and while the coefficient is only weakly
statistically significant, it is big: a half standard deviation increase in the share of Catholics in a
county�s population (10.1) lowered contributions by 31%.34 The Connaught and Munster dummies
are also strongly negative. Once again, it seems, Catholicism was negatively related to the propensity
to cooperate.35
VI CONCLUSIONS
Economic rationality played a large role in explaining the slower diffusion of centrifugal
separators in late 19th century Ireland, but other factors mattered too. A variety of collective action
28
problems seem to have been more difficult to resolve in Ireland than in Denmark; these impeded the
diffusion of cooperative creameries, and seem to have lowered the quality of creamery butter by
lowering the quality of milk supplies. The failure to adopt Danish cooperative rules, the inability to
organize a quality control scheme, and the �top down� nature of the cooperative movement itself all
suggest a very different social environment from that found in Denmark. The econometric results
offer further support for this non-economistic perspective. Illiteracy impeded technological diffusion
in the early years of this century, and was presumably an even bigger problem in the 1880s and
1890s: Abramovitz, Easterlin, and the many contemporary observers who fretted about poorly
educated Irish peasants were all correct. So was Solow: the struggles over land tenure were
counterproductive, in that the divisions which they entailed retarded agricultural innovation, while
the outcome which ensued, peasant proprietorship, seems to have had no off-setting advantages.
Uncertain property rights were indeed an obstacle to economic progress during this period, consistent
with Knack and Keefer [1995]. Diffusion was faster in Ulster than can be explained by its economic
and political circumstances, and indeed by its large Protestant population; Ulstermen were (and still
are) different, regardless of their religious persuasion. Finally, cooperation was less widespread in
Ireland than in Denmark during this period, despite the fact that cooperative creameries were more
efficient than their private counterparts. This seems to be partly explained by religion, in that within
Ireland the propensity to cooperate was lower among Catholics than among Protestants.
29
References
Abramovitz, M. [1986], "Catching Up, Forging Ahead, and Falling Behind," Journal of Economic
History 46 (June): 385-406.
Anderson, R.A. [1935], With Horace Plunkett in Ireland (London: Macmillan).
Barro, R. J. [1991], "Economic Growth in a Cross Section of Countries," Journal of Political
Economy 106 (May): 407-43.
Baumol, W. [1990], �Entrepreneurship: productive, unproductive, and destructive,� Journal of
Political Economy 98: 893-921.
Bjørn, C. (ed.) [1988], Det Danske Landbrugs Historie III: 1810-1914 (Copenhagen:
Landbohistorisk Selskab).
B.P.P. [1906], Report from the Select Committee on Butter Trade, British Parliamentary Papers,
Vol. VII.
Cipolla, C. [1969], Literacy and Development in the West (London: Penguin).
Crotty, R. [1966], Irish Agricultural Production: Its Volume and Structure (Cork: Cork
University Press).
DATII [1904], Bulletin No. 7, Miscellaneous Series: Report on Co-operative Agriculture and
Rural Conditions in Denmark, (Dublin: Department of Agriculture and Technical
Instruction for Ireland).
Donnelly, J.S. [1971], �Cork market: its role in the nineteenth century Irish butter trade,� Studia
Hibernica 11: 130-163.
Easterlin, R. A. [1981], "Why Isn�t the Whole World Developed?," Journal of Economic History
41: 1-19.
Ehrlich, C. [1981], �Horace Plunkett and agricultural reform,� in Irish Population, Economy and
Society, eds. J.M. Goldstrom and L.A. Clarkson (Oxford: Clarendon Press).
30
Flora, P., F. Kraus and W. Pfenning [1987], State, Economy and Society in Western Europe 1815-
1975: A Data Handbook, Vol. I (Chicago: St. James Press).
Greif, A. [1994], �Cultural beliefs and the organization of society: a historical and theoretical
reflection on collectivist and individualist societies,� Journal of Political Economy 102:
912-50.
Guinnane, T.G. [1994], �A failed institutional transplant: Raiffeisen�s credit cooperatives in Ireland,
1894-1914,� Explorations in Economic History 31 (1): 38-61.
Guinnane, T.W. and R.I. Miller [1997], �The Limits to Land Reform: The Land Acts in Ireland,
1870-1909,� Economic Development and Cultural Change 45(3): 591-612.
Henriksen, I. [1999], �Avoiding lock-in: co-operative creameries in Denmark, 1882-1903,�
European Review of Economic History, 3(1): 57-78.
Henriksen, I. and K.H. O�Rourke [ongoing], �Prices, market integration and quality: breakfast foods
in the late 19th century,� (work in progress).
IAOS [various years], Annual Reports of the Irish Agricultural Organisation Society, Ltd.
(Dublin).
Jensen, E. [1937], Danish Agriculture (Copenhagen: J.H. Schultz Forlag).
Kennedy, L. [1976], �The decline of the Cork butter market: a comment,� Studia Hibernica 16:175-
177.
Kindleberger, C. P. [1951], "Group Behavior and International Trade," Journal of Political
Economy 59: 30-46.
Knack, S. and P. Keefer [1995], �Institutions and Economic Performance: Cross-Country Tests Using
Alternative Institutional Measures,� Economics and Politics 7(3): 207-227.
Knack, S. and P. Keefer [1997], �Does Social Capital Have an Economic Payoff? A Cross-Country
Investigation,� Quarterly Journal of Economics 112(4): 1251-1288.
31
La Porta, R., F. Lopez-de-Silanes, A. Shleifer and R.W. Vishny [1997], �Trust in Large
Organizations,� American Economic Review Papers and Proceedings 87(2): 333-338.
Lee, J.J. [1989], Ireland 1912-1985: Politics and Society (Cambridge: Cambridge University Press).
Mokyr, J. and C. Ó Gráda [1988], �Poor and getting poorer? Living standards in Ireland before the
famine,� Economic History Review XLI: 209-235.
Murphy, K., A. Shleifer and R.W. Vishny [1991], �The Allocation of Talent: Implications for
Growth,� Quarterly Journal of Economics 106: 503-530.
Nüchel Thomsen and B. Thomas [1966], Dansk-Engelsk Samhandel: Et Historisk Rids 1661-1963
(Århus: Universitetsforlaget i Århus).
Ó Gráda, C. [1977], �The beginnings of the Irish creamery system, 1880-1914," Economic History
Review 30: 284-305.
O�Rourke, K.H. [1999], �Culture, Politics and Innovation: Creamery Diffusion in Late 19th Century
Denmark and Ireland,� CER Working Paper 99/23, University College Dublin (October).
Pedersen, J. [1926], �Irland som Danmarks konkurrent paa det Engelske marked,�
Nationaløkonomiske Tidsskrift: 423-438.
Plunkett, H. [1982], Ireland in the New Century (Blackrock, Co. Dublin: Irish Academic Press).
Putnam, R.D. with R. Leonardi and R.Y. Nanetti [1993], Making Democracy Work : Civic
Traditions in Modern Italy (Princeton, N.J. : Princeton University Press).
Solar, P.M. [1989-90], �The Irish butter trade in the nineteenth century: new estimates and their
implications,� Studia Hibernica 25: 134-161.
Solow, B [1971], The Land Question and the Irish Economy, 1870-1903 (Cambridge Mass.:
Harvard University Press).
Smith-Gordon, L. and L.C. Staples [1917], Rural Reconstruction in Ireland: A Record of Co-
operative Organisation (London: P. S. King and Son).
West, T. [1986], Horace Plunkett: Co-operation and Politics, An Irish biography (Washington
D.C.: Catholic University of America Press).

32
Zak, P.J. and S. Knack [2001], �Trust and Growth,� Economic Journal 111: 295-321.
33
Table 1. Shares of British butter market, 1860-1914
(Percent)
1860 1870 1881 1885 1890 1895 1900 1905 1910 1914 Ireland 46.6 38.3 24.5 20.7 22.0 19.3 16.8 12.1 11.9 15.2 Denmark 0.6 6.8 10.3 12.5 31.7 33.2 36.6 34.5 35.2 37.2 France 6.3 15.4 18.3 14.9 20.2 13.0 7.9 7.4 7.4 5.8 Russia 0.0 0.0 0.2 0.5 0.3 3.7 5.2 9.8 11.9 13.1 Netherlands 20.8 21.7 27.5 35.7 6.0 5.5 7.0 4.4 3.1 3.9 Belgium 5.1 4.5 1.8 2.0 1.4 0.7 1.9 1.1 0.0 0.0 Sweden 0.0 0.5 2.4 4.2 8.6 8.9 4.8 4.0 7.0 5.8 Germany 8.9 8.6 4.0 4.8 4.0 3.2 0.9 0.1 0.1 0.0 USA 5.2 0.9 6.4 2.6 3.3 1.9 1.4 1.8 0.0 0.2 Australia 0.0 0.2 0.5 0.0 1.6 7.4 8.7 9.7 13.6 9.3 New Zealand 0.0 0.0 0.0 0.0 0.0 1.5 4.0 6.4 7.4 7.6 Other 6.4 3.1 3.9 2.0 0.9 1.7 4.8 8.6 2.4 1.8 Sum (cwt.�000s) 1572 1878 2712 3026 2599 3503 4062 4719 4908 4697
Source: Solar [1989-90, 159-60]; Nüchel Thomsen and Thomas [1966, 152]; Ó Gráda [1977, 206];Agricultural Statistics, 1914.
34
Table 2. Descriptive statistics, panel data
Variable Mean Median Maximum Minimum Std. Dev. ObservationsCOOPS 9.14 5.00 55.00 0.00 11.45 448 TOTAL 23.89 12.50 128.00 0.00 35.38 64 COOPSHARE 39.54 37.98 100.00 0.00 33.76 64 DENSITY 74.18 75.62 172.66 27.75 28.55 448 COWS 47723 38470 205692 10286 37592 448 POP 138.02 94.83 580.81 36.25 120.23 448 RCSHARE 81.19 90.77 98.15 22.90 20.15 448 AGREE 36.37 34.88 63.80 12.76 11.29 448 ILLIT 11.36 10.78 26.00 3.40 4.31 448 OWNSHARE 54.27 55.77 84.72 15.41 17.34 288 SHARE1 21.58 19.89 37.03 7.11 6.98 448 SHARE2 12.29 12.30 19.48 4.53 3.24 448 SHARE3 9.70 9.33 20.04 2.67 4.48 448
Source: see text.
35
Table 3. Pooled regression results: number of cooperatives, 1901-14
(1) (2) (3) (4) (5) (6) (7) (8)C -9.625 -9.853 -5.457 -4.463 -25.489 -34.891 -30.381 -42.445
(-9.309) (-8.737) (-1.674) (-1.153) (-4.678) (-6.330) (-4.137) (-5.815)DENSITY 0.217 0.210 0.168 0.176 0.183 0.169 0.210 0.182
(14.175) (11.628) (9.588) (8.415) (10.479) (8.561) (9.003) (6.924)COWS 0.00011 0.00015 0.00017 0.00018 0.00017 0.00016 0.00017 0.00016
(8.670) (9.051) (8.881) (8.548) (9.211) (7.967) (6.817) (6.079)POP -0.019 -0.024 -0.025 -0.027 -0.013 -0.011 -0.013 -0.011
(-5.511) (-6.832) (-6.509) (-6.354) (-2.888) (-2.410) (-2.102) (-1.768)AGREE 0.111 0.041 0.331 0.216 0.360 0.218
(3.262) (0.687) (5.626) (3.550) (4.542) (2.710)ILLIT -0.278 -0.272 -0.315 -0.614 -0.280 -0.796
(-2.702) (-2.380) (-3.119) (-5.230) (-1.743) (-4.206)SHARE1 -0.166 -0.168 -0.452 -0.882 -0.531 -1.047
(-1.057) (-0.862) (-2.719) (-4.247) (-2.489) (-3.946)SHARE2 0.619 0.560 1.296 1.654 1.511 1.906
(1.714) (1.393) (3.379) (4.059) (3.040) (3.683)SHARE3 -0.781 -0.599 -1.536 -1.393 -1.717 -1.536
(-2.276) (-1.594) (-4.100) (-3.756) (-3.610) (-3.330)RCSHARE 0.182 0.390 0.196 0.480
(4.535) (7.371) (3.712) (6.701)OWNSHARE 0.024 0.019
(0.768) (0.625)ULST 1.710 1.500 15.944 21.291
(1.480) (0.644) (5.413) (5.158)MUNST -4.591 -2.901 -2.391 -2.442
(-2.575) (-1.504) (-1.312) (-1.017)CONN -1.353 -0.131 6.591 8.322
(-1.201) (-0.060) (2.933) (2.691)R-squared 0.559 0.582 0.590 0.593 0.609 0.639 0.618 0.659Adjusted R-squared 0.556 0.576 0.583 0.583 0.601 0.629 0.604 0.643S.E.of regression 7.628 7.456 7.399 7.395 7.239 6.980 7.790 7.392F-statistic 187.947 102.322 79.044 57.867 75.677 64.062 44.721 40.798Prob (F-statistic) 0.000 0.000 0.000 0.000 0.000 0.000 0.000 0.000Mean of dependentvariable
9.141 9.141 9.141 9.141 9.141 9.141 9.795 9.795
S.D. of dependentvariable
11.455 11.455 11.455 11.455 11.455 11.455 12.374 12.374
Sum of squaredresiduals
25838.060 24517.890 24032.660 23841.970 22954.930 21194.580 16808.990 14970.020
No. of observations 448 448 448 448 448 448 288 288
Note: dependent variable is number of cooperatives per county. t-statistics are in parentheses.
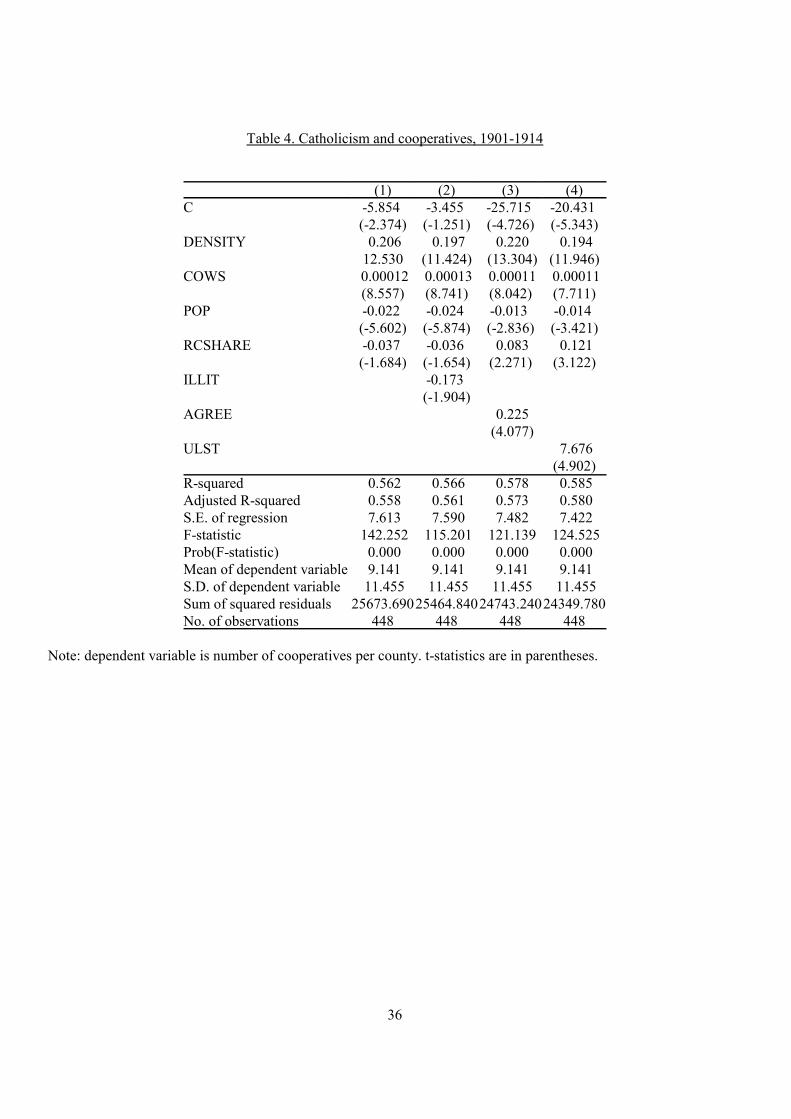
36
Table 4. Catholicism and cooperatives, 1901-1914
(1) (2) (3) (4)C -5.854 -3.455 -25.715 -20.431
(-2.374) (-1.251) (-4.726) (-5.343)DENSITY 0.206 0.197 0.220 0.194
12.530 (11.424) (13.304) (11.946)COWS 0.00012 0.00013 0.00011 0.00011
(8.557) (8.741) (8.042) (7.711)POP -0.022 -0.024 -0.013 -0.014
(-5.602) (-5.874) (-2.836) (-3.421)RCSHARE -0.037 -0.036 0.083 0.121
(-1.684) (-1.654) (2.271) (3.122)ILLIT -0.173
(-1.904)AGREE 0.225
(4.077)ULST 7.676
(4.902)R-squared 0.562 0.566 0.578 0.585Adjusted R-squared 0.558 0.561 0.573 0.580S.E. of regression 7.613 7.590 7.482 7.422F-statistic 142.252 115.201 121.139 124.525Prob(F-statistic) 0.000 0.000 0.000 0.000Mean of dependent variable 9.141 9.141 9.141 9.141S.D. of dependent variable 11.455 11.455 11.455 11.455Sum of squared residuals 25673.69025464.84024743.24024349.780No. of observations 448 448 448 448
Note: dependent variable is number of cooperatives per county. t-statistics are in parentheses.
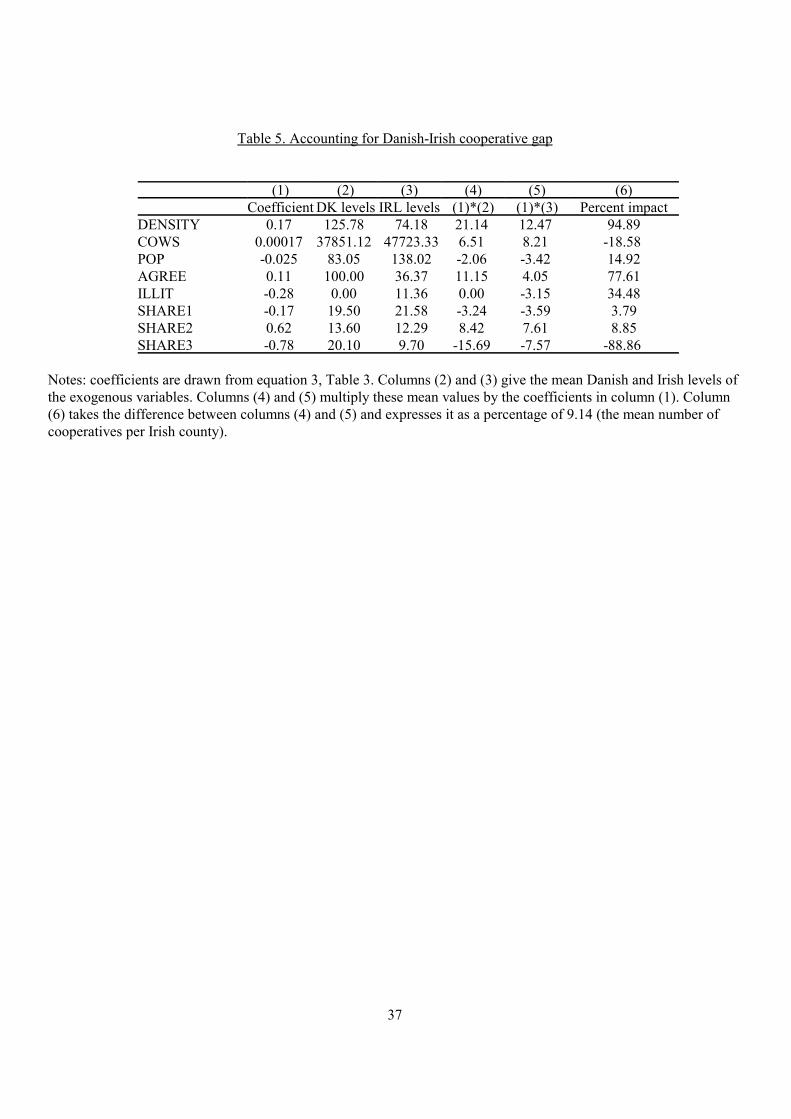
37
Table 5. Accounting for Danish-Irish cooperative gap
(1) (2) (3) (4) (5) (6)Coefficient DK levels IRL levels (1)*(2) (1)*(3) Percent impact
DENSITY 0.17 125.78 74.18 21.14 12.47 94.89COWS 0.00017 37851.12 47723.33 6.51 8.21 -18.58 POP -0.025 83.05 138.02 -2.06 -3.42 14.92AGREE 0.11 100.00 36.37 11.15 4.05 77.61ILLIT -0.28 0.00 11.36 0.00 -3.15 34.48SHARE1 -0.17 19.50 21.58 -3.24 -3.59 3.79SHARE2 0.62 13.60 12.29 8.42 7.61 8.85SHARE3 -0.78 20.10 9.70 -15.69 -7.57 -88.86
Notes: coefficients are drawn from equation 3, Table 3. Columns (2) and (3) give the mean Danish and Irish levels ofthe exogenous variables. Columns (4) and (5) multiply these mean values by the coefficients in column (1). Column(6) takes the difference between columns (4) and (5) and expresses it as a percentage of 9.14 (the mean number ofcooperatives per Irish county).
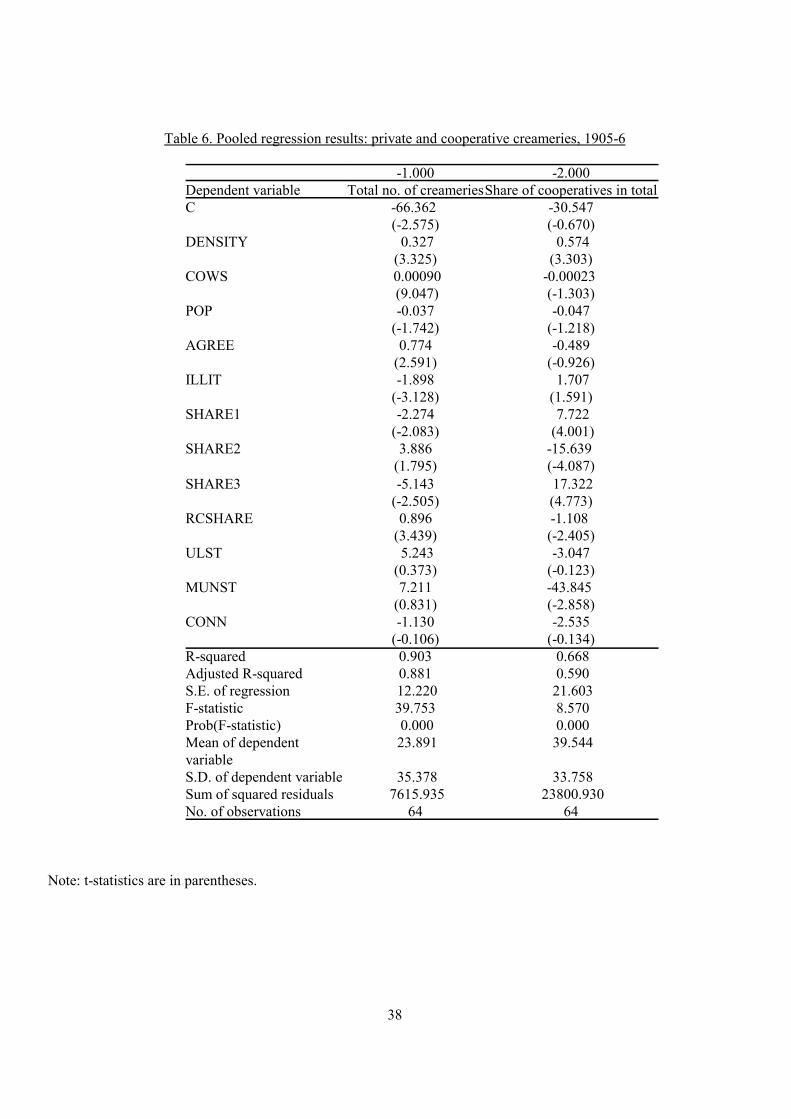
38
Table 6. Pooled regression results: private and cooperative creameries, 1905-6
-1.000 -2.000Dependent variable Total no. of creameriesShare of cooperatives in totalC -66.362 -30.547
(-2.575) (-0.670)DENSITY 0.327 0.574
(3.325) (3.303)COWS 0.00090 -0.00023
(9.047) (-1.303)POP -0.037 -0.047
(-1.742) (-1.218)AGREE 0.774 -0.489
(2.591) (-0.926)ILLIT -1.898 1.707
(-3.128) (1.591)SHARE1 -2.274 7.722
(-2.083) (4.001)SHARE2 3.886 -15.639
(1.795) (-4.087)SHARE3 -5.143 17.322
(-2.505) (4.773)RCSHARE 0.896 -1.108
(3.439) (-2.405)ULST 5.243 -3.047
(0.373) (-0.123)MUNST 7.211 -43.845
(0.831) (-2.858)CONN -1.130 -2.535
(-0.106) (-0.134)R-squared 0.903 0.668Adjusted R-squared 0.881 0.590S.E. of regression 12.220 21.603F-statistic 39.753 8.570Prob(F-statistic) 0.000 0.000Mean of dependentvariable
23.891 39.544
S.D. of dependent variable 35.378 33.758Sum of squared residuals 7615.935 23800.930No. of observations 64 64
Note: t-statistics are in parentheses.
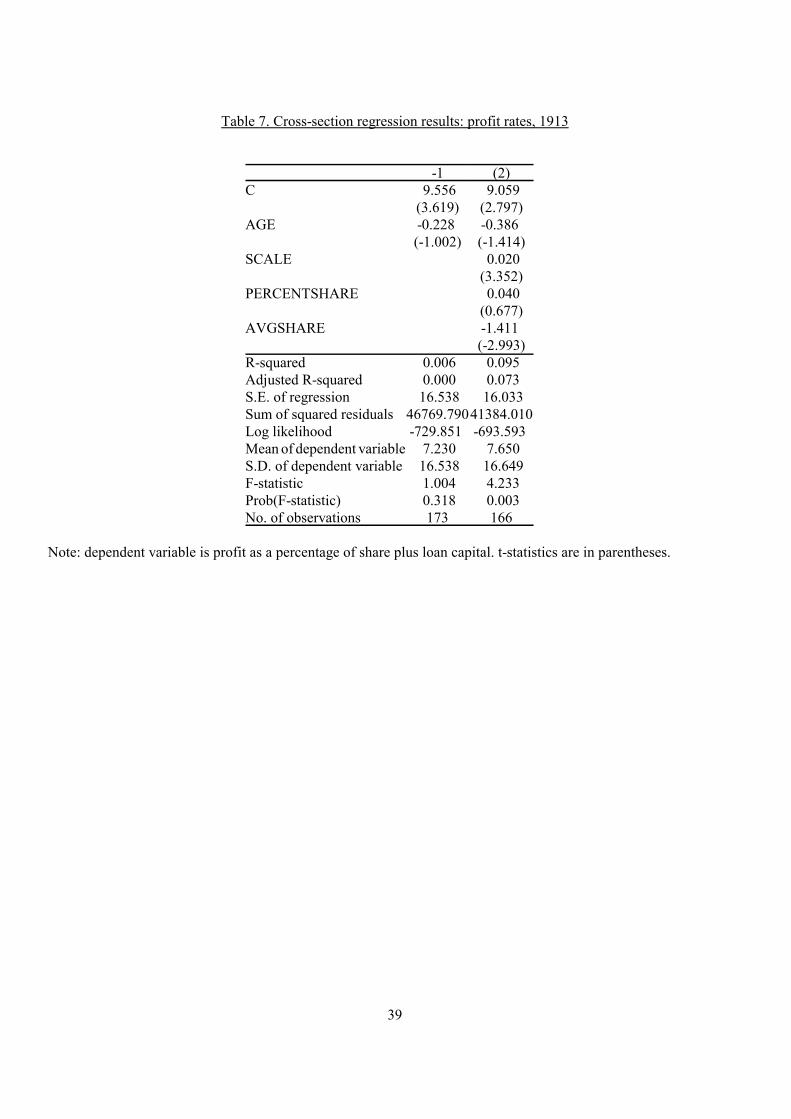
39
Table 7. Cross-section regression results: profit rates, 1913
-1 (2)C 9.556 9.059
(3.619) (2.797)AGE -0.228 -0.386
(-1.002) (-1.414)SCALE 0.020
(3.352)PERCENTSHARE 0.040
(0.677)AVGSHARE -1.411
(-2.993)R-squared 0.006 0.095Adjusted R-squared 0.000 0.073S.E. of regression 16.538 16.033Sum of squared residuals 46769.79041384.010Log likelihood -729.851 -693.593 Mean of dependent variable 7.230 7.650S.D. of dependent variable 16.538 16.649F-statistic 1.004 4.233Prob(F-statistic) 0.318 0.003No. of observations 173 166
Note: dependent variable is profit as a percentage of share plus loan capital. t-statistics are in parentheses.
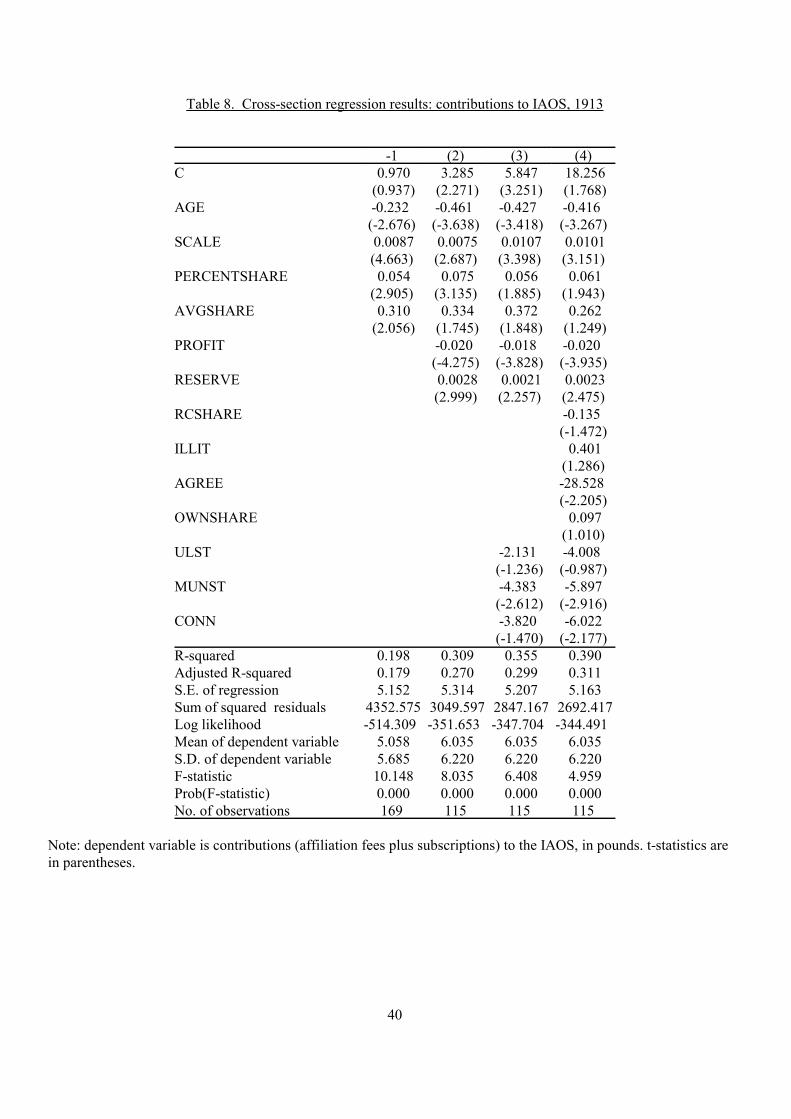
40
Table 8. Cross-section regression results: contributions to IAOS, 1913
-1 (2) (3) (4)C 0.970 3.285 5.847 18.256
(0.937) (2.271) (3.251) (1.768)AGE -0.232 -0.461 -0.427 -0.416
(-2.676) (-3.638) (-3.418) (-3.267)SCALE 0.0087 0.0075 0.0107 0.0101
(4.663) (2.687) (3.398) (3.151)PERCENTSHARE 0.054 0.075 0.056 0.061
(2.905) (3.135) (1.885) (1.943)AVGSHARE 0.310 0.334 0.372 0.262
(2.056) (1.745) (1.848) (1.249)PROFIT -0.020 -0.018 -0.020
(-4.275) (-3.828) (-3.935)RESERVE 0.0028 0.0021 0.0023
(2.999) (2.257) (2.475)RCSHARE -0.135
(-1.472)ILLIT 0.401
(1.286)AGREE -28.528
(-2.205)OWNSHARE 0.097
(1.010)ULST -2.131 -4.008
(-1.236) (-0.987)MUNST -4.383 -5.897
(-2.612) (-2.916)CONN -3.820 -6.022
(-1.470) (-2.177)R-squared 0.198 0.309 0.355 0.390Adjusted R-squared 0.179 0.270 0.299 0.311S.E. of regression 5.152 5.314 5.207 5.163Sum of squared residuals 4352.575 3049.597 2847.167 2692.417Log likelihood -514.309 -351.653 -347.704 -344.491 Mean of dependent variable 5.058 6.035 6.035 6.035S.D. of dependent variable 5.685 6.220 6.220 6.220F-statistic 10.148 8.035 6.408 4.959Prob(F-statistic) 0.000 0.000 0.000 0.000No. of observations 169 115 115 115
Note: dependent variable is contributions (affiliation fees plus subscriptions) to the IAOS, in pounds. t-statistics arein parentheses.
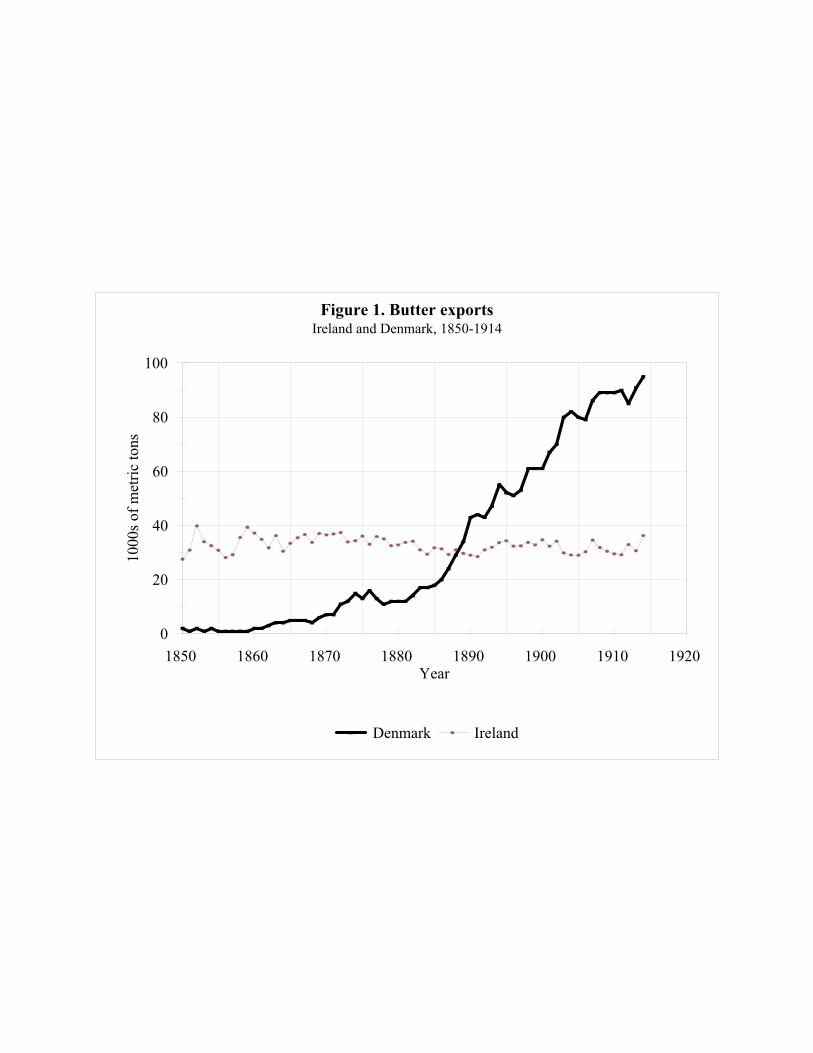
0
20
40
60
80
100
1000
s of m
etric
tons
1850 1860 1870 1880 1890 1900 1910 1920 Year
Denmark Ireland
Figure 1. Butter exportsIreland and Denmark, 1850-1914
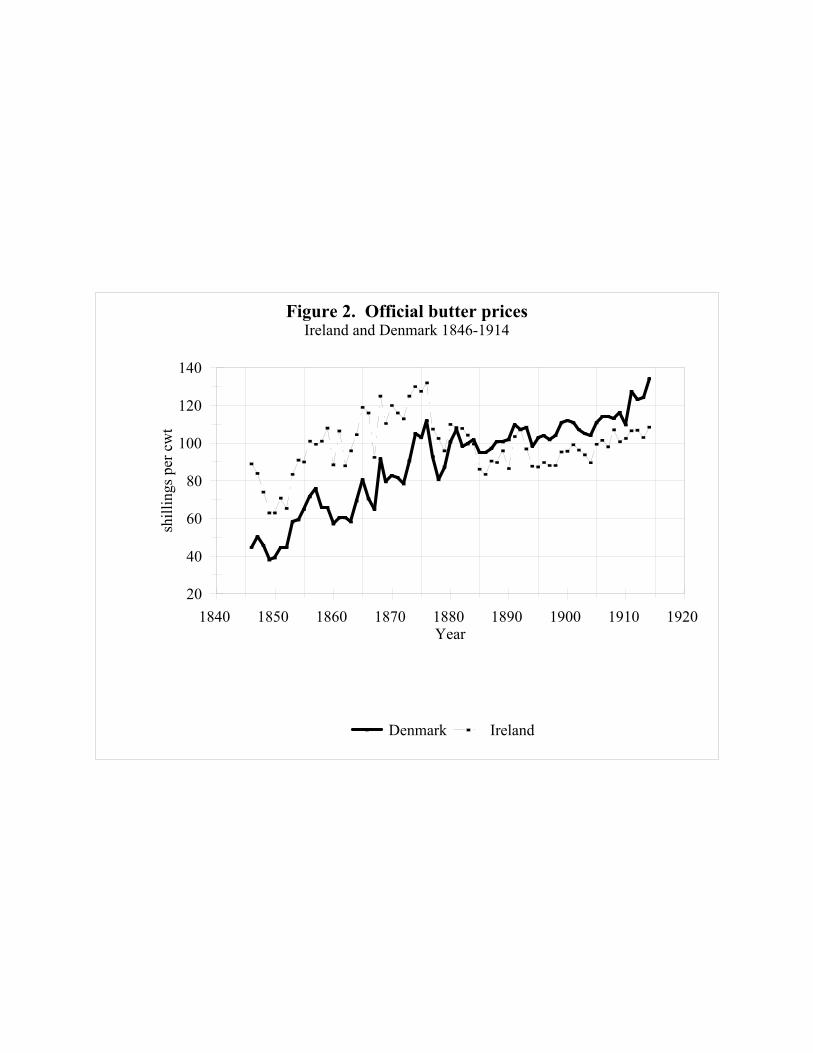
20
40
60
80
100
120
140
shill
ings
per
cw
t
1840 1850 1860 1870 1880 1890 1900 1910 1920 Year
Denmark Ireland
Figure 2. Official butter pricesIreland and Denmark 1846-1914
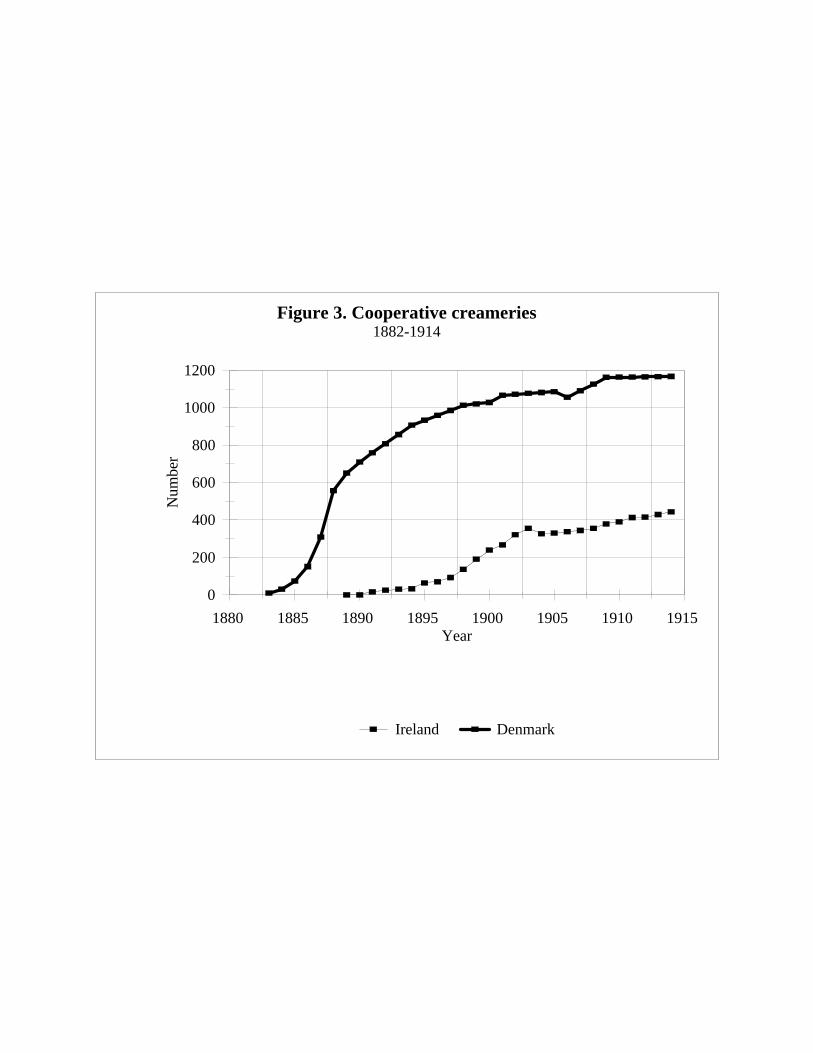
0
200
400
600
800
1000
1200
Num
ber
1880 1885 1890 1895 1900 1905 1910 1915 Year
Ireland Denmark
Figure 3. Cooperative creameries1882-1914