Embed Size (px)
Citation preview

“The diversity of agriculture and human
culture are bound together. In the end it is up
to all of us as governments and communities
and individuals to prize diversity.”
Cary Fowler and Pat Mooney

ORIGEN, DISPERSIÓN Y DIVERSIDAD DEL CHIRIMOYO (ANNONA CHERIMOLA MILL.)
EN EL CONTINENTE AMERICANO
Memoria de tesis doctoral presentada por
Nerea Larrañaga González
para optar al grado de Doctora por la Universidad Politécnica de Madrid, programa de
Doctorado en Biotecnología y Recursos Genéticos en Plantas y Microorganismos Asociados.
Director:
Dr. José Ignacio Hormaza Urroz, Profesor de Investigación.
Septiembre de 2016

Universidad de Málaga, Consejo Superior de Investigaciones Científicas
Instituto de Hortofruticultura Subtropical y Mediterránea La Mayora (IHSM-UMA-CSIC)
29750 Algarrobo –Costa (Málaga)
José Ignacio Hormaza Urroz, Profesor de Investigación del Consejo Superior de
Investigaciones Científicas en el Instituto de Hortofruticultura Subtropical y Mediterránea La
Mayora y director del Departamento de Fruticultura,
CERTIFICA
que Nerea Larrañaga González, Licenciada en Biología y Máster en Recursos Fitogenéticos
ha realizado en el Departamento de Fruticultura del Instituto de Hortofruticultura Subtropical y
Mediterránea La Mayora (IHSM-UMA-CSIC), bajo su dirección, el trabajo de investigación
que con el título “Origen, dispersión y diversidad del chirimoyo (Annona cherimola Mill.) en el
continente americano” presenta para optar al grado de Doctora por la Universidad Politécnica
de Madrid.
Septiembre de 2016
Fdo. Dr. José Ignacio Hormaza Urroz

Universidad Politécnica de Madrid
Escuela Técnica Superior de Ingeniería Agronómica, Alimentaria y de Biosistemas
Departamento de Biotecnología – Biología Vegetal
28040 Madrid
Juan Bautista Martínez Laborde, profesor titular del Departamento de Biotecnología-Biología
Vegetal de la Escuela Técnica Superior de Ingeniería Agronómica, Alimentaria y de
Biosistemas de la Universidad Politécnica de Madrid
AUTORIZA
la presentación de la Tesis Doctoral titulada “Origen, dispersión y diversidad del chirimoyo
(Annona cherimola Mill.) en el continente americano” de la doctoranda Nerea Larrañaga
González realizada en el Departamento de Fruticultura del Instituto de Hortofruticultura
Subtropical y Mediterránea La Mayora (IHSM-UMA-CSIC), para optar al grado de Doctora
por la Universidad Politécnica de Madrid.
Septiembre de 2016
Fdo. Dr. Juan Bautista Martínez Laborde

Este trabajo se ha llevado a cabo en el Departamento de Fruticultura del Instituto de
Hortofruticultura Subtropical y Mediterránea La Mayora, instituto mixto del Consejo Superior
de Investigaciones Científicas y la Universidad de Málaga gracias a una ayuda predoctoral
de Formación de Personal Investigador (FPI) (BES-2011-047451) del Ministerio de Economía
y Competitividad de España, asociada al proyecto AGL2010-1514.

Tribunal nombrado por el Magfco. y Excmo. Sr. Rector de la Universidad Politécnica de
Madrid, el día
Presidente:
Vocal:
Vocal:
Vocal:
Secretario:
Suplente:
Suplente:
Realizado el acto de defensa y lectura de la tesis el día ……………de …………… de 2016 en
la E.T.S. de Ingeniería Agronómica, Alimentaria y de Biosistemas de la Universidad
Politécnica de Madrid.
CALIFICACIÓN……….
………………..
PRESIDENTE
………………..
SECRETARIO
………………..
VOCALES

Parte de los resultados de esta Tesis Doctoral se incluyen en los siguientes artículos
publicados en revistas científicas recogidas en el SCI y capítulo de libro:
Larranaga N, Hormaza JI (2015) DNA barcoding of perennial fruit tree species of agronomic
interest in the genus Annona (Annonaceae). Frontiers in Plant Science, 6: 589 (Anexo 1).
Larranaga N, JI Hormaza (2016) Advances in genetic diversity analysis in fruit tree crops.
Lüttge U, Cánovas FM, Matyssek R. Progress in Botany 77. Springer International Publishing,
Switzerland, 245-264 (Anexo 2).
Larranaga N, Albertazzi F, Fontecha G, Palmieri M, Rainer H, van Zonneveld M, Hormaza, JI
(2016) A Mesoamerican origin of cherimoya (Annona cherimola Mill.), implications for the
conservation of plant genetic resources. Molecular Ecology (en revisión).
Y presentados en los congresos
Larrañaga N, Albertazzi F, Fontecha GA, Palmieri M, van Zonneveld M, Hormaza JI (2013)
Cherimoya (Annona cherimola Mill.) genetic diversity and structure across America: possible
Central American origin. V International congress on Annonaceae. Botucatu, Brasil, 19-23 de
agosto.
Larrañaga N, van Zonneveld M, Albertazzi F, Fontecha GA, Palmieri M, Hormaza JI (2014)
New insights on the center of origin of cherimoya (Annona cherimola Mill., Annonaceae)
combining molecular tools and Geographic Information Systems. XXII Plant & Animal
Genome conference. San Diego, EEUU, 11-15 de enero.

AGRADECIMIENTOS
Son muchas las personas que de alguna manera han contribuido a la concreción de este
trabajo de investigación y a las que quiero dar las gracias.
En primer lugar a agradezco a Iñaki Hormaza, director de esta tesis, por haberme dado la
oportunidad, la confianza y gran parte de su tiempo; por lo mucho que he aprendido tanto en
lo científico como en lo personal. A todo el grupo del laboratorio de Fruticultura que desde el
primer día me hicieron sentir parte de él; gracias a Yolanda, Librada, Carolina, Jorge L.,
Alicia, The, Celeste, Inma, Marta y Rosa. Y por supuesto a Vero, compañera y amiga.
Gracias a Juan B. Martínez, tutor académico de esta tesis, siempre dispuesto a recibirme y
echarme un cable con los trámites administrativos.
Gracias a Federico Albertazzi, Gustavo Fontecha, Maarten van Zonneveld y Lars Chatrou por
acogerme en sus respectivas instituciones (y ciudades) durante las estancias internacionales
en San José, Tegucigalpa, Cali y Wageningen. Han sido experiencias enriquecedoras en
todos los sentidos. No me olvido de Mariela, Clara, Elisa, Marlon, María, Óscar, Melisa, Dani,
Jenifer y el resto del equipo que me recibió durante esos meses. También agradezco las
colaboraciones con Margarita Palmeri (Guatemala) y Jorge Andrés (México).
Agradezco al resto de compañerxs del Centro y del cuartito, con quienes hemos compartido
mucho más que un lugar de trabajo: María, Anabel, Olaya, Yazmín, Jorge, Kike, Cañi,
Mariola, Willy, Reme, Rida, Sara, Jota, Paco, Elisa, Eduardo, Pedro, Martin, Anelise, Davinia,
Paola, Rima, Isa, Elvira, Antonio, Luis, Irene y tantos otrxs. Y en general, a todo el personal
de la Mayora, con especial mención al departamento de Informática por su ayuda en lo
referente a programas y otros dramas tecnológicos, a los compañerxs de campo y de
administración. Gracias también a Antonio Matas por darme acceso al servidor de R de la
UMA, a Silvia Martín de la UPM por la orientación con toda la documentación y a Ricardo
Ontiveros por su asesoría con R.
Gracias a mis amigxs de siempre, porque nunca han dejado de acompañarme y de tratar de
entender por qué el estudio de la diversidad genética del chirimoyo es tan importante. A mis
padres: Sabin (quien ha hecho la portada) y Ángeles (quien ha dibujado la chirimoya), y a mi
hermana Leire, que me apoyan incondicionalmente. A mi pareja, David, quien conoce cada
punto y coma de este trabajo y está a mi lado con cada decisión. A Trufa, mi perrita, que se
ha pasado las tardes de los últimos meses sin apenas salir y tumbada junto a mi mesa.
Finalmente, quiero dar las gracias a las instituciones responsables de esta Tesis: al CSIC, a
la Universidad Politécnica de Madrid y a la beca del Ministerio de Economía y Competitividad
que me fue otorgada. También a todas las entidades públicas y grupos de investigación
donde he recibido la formación académica y científica previa.

RESUMEN
En este trabajo se ha profundizado en las razones que pueden explicar la distribución actual
de la diversidad genética del chirimoyo (Annona cherimola Mill.), una especie frutal adaptada
a climas subtropicales, con claras implicaciones para su uso y conservación. Gracias a un
estudio de código de barras, se pudo comprobar el poder de discriminación del gen
cloroplastídico maturasa K (matK) entre las especies con mayor importancia agronómica del
género. Además, sobre los polimorfismos de nucleótido único (SNPs) interespecíficos, se
diseñaron marcadores que permitieron la identificación mediante presencia o ausencia de
bandas en geles de electroforesis de dichas especies tras PCR. El marcador específico del
chirimoyo se utilizó para amplificar un gran número de muestras y estudiar la variabilidad
intraespecífica respecto a los SNPs elegidos. Se verificó la existencia de dos haplotipos con
diferenciación espacial: (1) con presencia únicamente en Centroamérica y (2) en
Centroamérica y resto de orígenes de las accesiones del banco de germoplasma del IHSM-
UMA-CSIC. A través de un estudio filogenético, basado en cinco loci cloroplastídicos, se
determinó que esta especie conforma un grupo monofilético con otras especies cercanas, las
cuales tienen una distribución exclusivamente centroamericana y caribeña. De entre las
accesiones de chirimoyo incluidas en este ensayo, la mexicana y hondureñas (que presentan
el haplotipo único de Centroamérica para matk) se posicionaron en la base del clado que
reúne a todas las accesiones de la especie y no se distinguieron de las muestras de Annona
pruinosa. La aproximación espacial para analizar diferentes índices de diversidad genética a
partir de una base de datos final de 1843 accesiones de chirimoyo y nueve marcadores
microsatélite, mostró como los valores en la zona centroamericana (preferentemente
Honduras y Guatemala) fueron más altos en comparación con el norte de Perú, donde se
observaron los valores más altos de América del Sur. Además, diferentes análisis para
estudiar la estructura genética de estas poblaciones muestran que las accesiones tienden a
agruparse según su origen geográfico. A medida que se asumieron más poblaciones, fueron
las accesiones de América del Sur las que se fragmentaron en diferentes grupos norte-sur.
Por último, se estudió el flujo genético entre las diferentes poblaciones y la correlación con
las distancias geográficas de mínimo coste, teniendo en cuenta diferentes escenarios que, a
su vez, recogían distintas variables que pudieran estar implicadas en la distribución actual de
su diversidad, posibles rutas de dispersión o variables ambientales.
Todo lo anterior nos hace concluir que lo más probable es que esta especie se
originara en la zona centroamericana, concretamente en Honduras y Guatemala (o que las
poblaciones allí asentadas actualmente sean las más ancestrales) y desde allí se dispersara
hacia otras zonas de Centroamérica, gracias a sus dispersores naturales y sus amplios
corredores biológicos. La llegada, hace unos 12.000-20.000 años, y posterior asentamiento

de los humanos, mediaría la dispersión hacía America del Sur, posiblemente entre México y
Norte de Perú/Ecuador, vía marítima. A raíz de los resultados obtenidos, se recomienda
poner en marcha proyectos de conservación, ex situ e in situ, para la preservación de la
diversidad existente en las zonas rurales muestreadas de Honduras y Guatemala. Esto debe
tener en cuenta, además, que gran parte de las áreas de dichos países, donde se cumplen
las condiciones climáticas más propicias para la especie, podrían dejar de serlo en las
décadas futuras debido al cambio climático, como muestra el análisis de distribución futura
de la especie también llevado a cabo.

SUMARY
In this work, the reasons that could explain the current genetic diversity distribution of the
subtropical fruit tree species Annona cherimola, with clear implications in use and
conservation projects, were studied. DNA barcoding studies demonstrated the discrimination
power of the chloroplast gene maturase K (matK), among the most agronomical important
species of the genus. In addition, specific markers based on interspecific simple nucleotide
polymorphisms (SNPs) were designed and permitted the identification of the different
species, by presence/absence of bands in gel electrophoresis after PCR. The cherimoya
specific marker was used to amplify a large dataset, and analyze the intraspecific variability
with respect to the SNPs used. Two haplotypes were encountered with geographic
differentiation: one of them was just present in the samples from Central American countries,
while the other was also present in the rest of the accessions of the IHSM-UMA-CSIC
germplasm bank. A phylogenetic study with five cloroplastidic loci determined that this
species forms a monophyletic group with other genetically close species, which have an
exclusively Central American and Caribbean distribution. Among the cherimoya accessions
included in this study, the Mexican and the Honduran (that showed the matK Central
American haplotype) were in the base of the clade that included all the accessions of the
species, and could not be distinguished from the Annona pruinosa samples. The spatial
approach used to analyze several genetic diversity indexes of a 1843 cherimoya accession
dataset and nine microsatellite markers, showed higher values in Central America (mainly in
Honduras and Guatemala) in comparison with Northern Peru, where the highest values
among all South American locations were obtained. In addition, different analyses to study
the genetic structure of this dataset showed that all the accessions tended to cluster
depending on their geographic origin. The more populations were assumed to exist the more
fragmented in different groups the accessions of South America were, in a north-south range.
Finally, the genetic flow among different populations was studied and its correlation with the
geographic least cost distances was tested, based on different scenarios. These transition
layers took into account different variables that could be shaping the current genetic diversity
distribution, different dispersion routes or climatic variables.
For all the reasons explained above, we concluded that cherimoya very likely
originated in Central America, specifically in Honduras and Guatemala (or that these
populations are the most ancestral ones), and from there it was dispersed to other Central
American regions, by its natural dispersers and large biological corridors. The arrival and
posterior settlement of humans, 12,000-20,000 years ago, could have mediated the
cherimoya dispersion to South America, between Mexico and North of Peru, in particular by
the sea. The results obtained show the necessity of implementing conservation projects in

most of the rural areas sampled in Honduras and Guatemala. For this, we should also keep in
mind that most areas in these countries where the best climatic conditions for cherimoya
growth are present, would be probably lost during the next decades due to the global
warming, as shown in the future distribution analyses also carried out.

ÍNDICE
ÍNDICE
Introducción general 16
Árboles frutales, recursos genéticos de plantas 17
Código de barras (DNA Barcoding) 19
Marcadores moleculares para cuantificar la diversidad genética 20
Metodologías de filogenia 24
Genética del paisaje y sistemas de información geográfica 25
Familia Annonaceae y género Annona 26
Annona cherimola 28
Descripción botánica 28
Origen geográfico 29
Usos e importancia económica 30
Banco de chirimoyo del IHSM-UMA-CSIC 31
Objetivos 33
Capítulo 1: DNA barcoding of perennial fruit tree species of agronomic
interest in the genus Annona (Annonaceae)
Abstract 36
Introduction 36
Materials and methods 39
Results 44
Discussion 49
Capítulo 2: Application of cherimoya specific markers in a germplasm
collection with geographical implications on its diversity and dispersion
Abstract 52
Introduction 52
Materials and methods 53
Results 56
Discussion 59
Capítulo 3: Phylogenetic study of the Atta section and closely related
species in the genus Annona, Annonaceae
Abstract 63
35
51
62

ÍNDICE
Introduction 63
Materials and methods 65
Results 68
Discussion 70
Capítulo 4: A Mesoamerican origin of cherimoya (Annona cherimola
Mill.), implications for the conservation of plant genetic resources
Abstract 76
Introduction 76
Materials and methods 78
Results 82
Discussion 88
Capítulo 5: Crop exchange before 1492: cherimoya reveals pre-
columbian dispersal routes in the Americas
Abstract 92
Introduction 92
Materials and methods 95
Results 100
Discussion 107
Discusión general 111
Origen y dispersión de Annona cherimola 112
Conservación de los recursos de Annona cherimola 116
Taxonomía y relaciones filogenéticas de Annona cherimola y
especies cercanas
Conclusiones 119
Bibliografía 122
ANEXO 1
ANEXO 2
75
91
117

16
INTRODUCCIÓN GENERAL

INTRODUCCIÓN GENERAL
17
Árboles frutales, recursos genéticos de plantas
La aparición de la agricultura y la ganadería hace unos 7.000-10.000 años en diferentes
lugares del planeta simultáneamente, significó un punto de inflexión tanto para la especie
humana como para el resto de organismos y ecosistemas. Este hecho hizo posible el cambio
de una vida nómada basada en la caza y recolecta al sedentarismo basado en la
domesticación de plantas (Esquinas-Alcazar 2005). De hecho, el primer capítulo del Origen
de las Especies de Charles Darwin (Variation under domestication) está dedicado a la
variación a través de la domesticación y en él se defiende el paralelismo de los procesos de
domesticación con los evolutivos (Darwin 1959). El proceso de domesticación de plantas
puede entonces definirse como un proceso mediante el cual la selección humana de
fenotipos de poblaciones elegidas, manejadas o cultivadas resulta en cambios en los
genotipos de la población que las hacen más útiles a los humanos y mejor adaptadas a la
intervención humana en el paisaje (Clement 1999). De esta manera, se han ido generando
un gran número de cultivares a partir de especies silvestres, proceso que ha continuado en
las últimas décadas en programas de mejora formales para producir cultivares modernos.
Estos recursos permiten la subsistencia de la especie humana y, por tanto, es fundamental el
mantenimiento, el uso sostenible e incluso la creación de diversidad genética de los mismos
para las presentes y futuras generaciones. Cuanto más diverso es un acervo genético, más
capacidad potencial de resiliencia tiene ante cambios ambientales (Lin 2011; Neaves et al.
2013).
Este enfoque cobra todavía más importancia en el actual escenario de cambio
climático y otras amenazas ambientales/sociales causadas por el ser humano que han dado
lugar a una dramática pérdida de recursos genéticos (y otros), conocida como erosión
genética. Según la FAO (nd) dicha pérdida puede haber llegado al 75% en el último siglo,
reduciéndose dramáticamente la información disponible para una selección natural o artificial
por productores o mejoradores. Esto, a su vez, reduce la capacidad de adaptación a un
ambiente cambiante o, incluso, condiciones oscilantes de mercado y, por tanto, amenaza la
seguridad alimentaria. Además, cabe señalar que a nivel global, el uso y la conservación de
los recursos filogenéticos se ha centrado en unas pocas especies. Así, de las
aproximadamente 7.000 especies de plantas que han sido utilizadas por los seres humanos
a lo largo de su historia, actualmente sólo unas 30 suponen más del 90% del aporte a la
dieta humana y únicamente tres cereales (trigo, arroz y maíz) suman dos tercios (UNEP
2007; Cassman 1999). Sin embargo, hay cientos de especies abandonadas o infrautilizadas
(neglected and underutilized species) (NUS) que son importantes, al menos en mercados
locales, y cuyo cultivo podría ser extendido en un futuro.

INTRODUCCIÓN GENERAL
18
Ante esta perspectiva, el establecimiento de proyectos, políticas e investigaciones
para la conservación y el uso sustentable de la diversidad genética de los recursos
fitogenéticos de plantas y organismos asociados y necesarios en la producción agrícola
(polinizadores, simbiontes, parásitos, depredadores, competidores, etc) va en aumento y
muchos países a través de acuerdos nacionales o internacionales están empezando a
enfocarse en este problema; ejemplos incluyen el Convenio sobre la diversidad biológica de
1992 (http://www.cbd.int/history/) o el Tratado de los recursos genéticos de plantas para la
alimentación y cultura en 2001 (http://www.planttreaty.org/).
De las 30 especies de plantas cultivadas más importantes desde el punto de vista
productivo, en 2012, sólo cinco son frutales arbóreos o semi-arbóreos: plataneras, cítricos,
vides, manzanos y mangos (Faostat 2014) aunque los cultivos perennes ocupan la octava
parte de toda la superficie cultivada mundial (McClure et al. 2014). Algunas de las
características de los árboles frutales, como su naturaleza perenne, ciclos de muchas
generaciones y largos periodos juveniles, dificultan los programas de mejora y los esfuerzos
de conservación. Generalmente son especies de propagación vegetativa favoreciendo el
cultivo de unos pocos clones seleccionados como cultivares. Como resultado, es habitual
que la diversidad genética encontrada en la mayoría de estos cultivares comerciales sea baja
aunque con altas tasas de heterogeneidad (McClure et al. 2014). Mientras la mayoría de los
cultivos anuales han sido domesticados durante largos periodos de tiempo, solo unas pocas
especies de árboles frutales podrían ser consideradas como realmente domesticadas y la
mayoría están separadas por pocas generaciones de sus parientes silvestres, los cuales son
reservorios de genes con posible interés para condiciones actuales o futuras.
La conservación de especies, cultivares o genotipos de interés de árboles frutales, al
igual que en otras especies de interés agronómico, puede realizarse in situ o ex situ. La
primera puede ser llevada a cabo a través de la protección de áreas naturales y/o a través
del resguardo de campos de cultivo tradicionales (on farm) (Hammer 2003) lo que también
incluye la conservación de las metodologías tradicionales así como la interacción con
ecosistemas y, por tanto, la coevolución entre todos los elementos que generan nueva
diversidad. Los programas de conservación ex situ preservan genotipos aislados en
colecciones de campo, bancos de semillas, de tejidos, etc. Algunas de las estrategias
seguidas para la eficiencia en la conservación ex situ, principalmente cuando las semillas
son recalcitrantes y no pueden ser conservadas en bancos o cuando, en el caso de árboles,
el mantenimiento de colecciones muy numerosas es económicamente poco viable, es el
establecimiento de colecciones núcleo (van Hintum et al. 2000; Escribano et al. 2008a).
Una correcta identificación, el estudio de las relaciones filogenéticas entre las
especies de interés y sus parientes más cercanos, el establecimiento de los puntos de

INTRODUCCIÓN GENERAL
19
máxima diversidad genética o el estudio de la historia del cultivo para conocer las razones de
su distribución actual son medidas que aportan conocimiento y apoyan la optimización en el
manejo de los recursos genéticos.
Código de barras (DNA Barcoding)
La taxonomía, ciencia de la clasificación, se aplica dentro de la biología para la ordenación
jerarquizada y sistemática, con sus nombres, de los grupos de animales y de vegetales, y
resto de seres vivos. Para la unidad básica de jerarquización, la especie, se han propuesto
numerosos conceptos (De Queiroz 2007). Entre ellos, se incluye el concepto biológico de
especie como grupos de poblaciones naturales que se cruzan real o potencialmente entre sí
y que han quedado aislados reproductivamente de otros grupos (Mayr 1942); el concepto
fenético de especie como grupo de organismos que son fenotípicamente similares entre sí y
diferentes a otros grupos de organismos (Sokal & Crovello 1970); o variantes del concepto
filogenético de especie en las que una especie sería un grupo de organismos que conforman
una población o grupo de poblaciones definido por uno o más caracteres apomorfos (Rosen
1979). Ninguno de los conceptos se ha validado frente al resto, pero el concepto biológico de
especie es el más utilizado. Sin embargo, en el caso de plantas donde las hibridaciones son
frecuentes, este concepto ha de tomarse con cautela al igual que en especies con
reproducción asexual. A pesar de su complejidad, la identificación de especies, subespecies
o cultivares en el caso de las plantas cultivadas es de suma importancia para hacer una
buena planificación para su uso y conservación.
El uso de caracteres botánicos ha sido tradicionalmente la base para la identificación
y caracterización de especies nuevas. Actualmente los marcadores moleculares (que se
describen con más detenimiento en el siguiente apartado) o las técnicas de código de barras,
DNA barcoding, se han convertido en una potente herramienta para complementar el
conocimiento taxonómico así como para una rápida identificación para los no expertos en
caracterización fenotípica.
DNA barcoding fue definido por Hebert et al. (2003) como una forma de identificar
especies que se basa en la búsqueda y adquisición de una manera global de una corta
secuencia genética que, mediante comparación con otras, permitiría no solo la discriminación
entre especies sino también el descubrimiento de otras nuevas. En 2004 se fundó el
consorcio internacional del código de barras de la vida (Consortium for the Barcode of Life)
(CBOL) para el desarrollo de un método global. Seis años después se activó el proyecto
internacional del código de barras de la vida (iBOL) para el mantenimiento de la biblioteca de
referencia BOLD (Barcode of Life Data Systems) (Bhargava & Sharma 2013). En ella hay
disponible una metodología directa que permite hacer una comparación para ver que
INTRODUCCIÓN GENERAL
20
secuencias hasta ese momento almacenadas presentan los valores de distancia más
cercanos con la secuencia a analizar. Además, monitorea el número de secuencias y la
cobertura de especies. El 31 de marzo de 2016 había 4795777 secuencias de código de
barras indexadas en esta base de datos (http://www.boldsystems.org/).
El gen mitocondrial de la citocromo oxidasa (CO1) es la secuencia establecida por
consenso para el código de barras de animales (Hebert et al. 2003). Sin embargo, en el caso
de plantas los genes mitocondriales no son buenos candidatos por su baja tasa de cambio
comparada con la que presentan en animales y, por tanto, no discriminan correctamente en
el nivel de especies (Kress et al. 2005; Kress & Erickson 2007). En 2009 el Grupo de trabajo
CBOL recomendó usar la combinación de dos genes mitocondriales como código de barras:
maturasa K (matK) y ribulosa bifosfato carboxilasa (rbcL) (CBOL Plant Working Group 2009).
Sin embargo, la resolución de especies mediante estos dos marcadores es frecuentemente
incompleta, especialmente en taxones relacionados (Zhang et al. 2012) y se han propuesto
porciones adicionales del genoma como la zona intergénica transcrita del operón ribosomal
nuclear (internal transcribed spacer) (ITS e ITS2) o el espaciador cloroplastídico intergénico
trnH-psbA (China Plant BOL group et al. 2011; Kress et al. 2005; Pang et al. 2012; Chen et
al. 2010; Hollingsworth 2011). Los métodos más utilizados en el desarrollo de un estudio de
código de barras son los basados en distancias, aunque también se sigue la aproximación
basada en diferencias de caracteres entre las secuencias del alineamiento (DeSalle et al.
2005; Taylor & Harris 2012). Sea cual sea el caso, se necesitan bases de datos lo
suficientemente completas con las que comparar la secuencia enigma. En el capítulo 1 se
discute dicha aplicación a especies del género Annona (Larranaga & Hormaza 2015) y otros
ejemplos en árboles frutales incluyen: Prunus sect. persica (Quan & Zhou 2011) y Phoenix
dactylifera (Enan & Ahamed 2014).
Marcadores moleculares para la medida de la diversidad genética
La diversidad genética puede ser definida como la cantidad de variabilidad genética entre
individuos de una variedad, población o especie (Brown 1983). La nueva variación genética,
introducida a través de mutaciones, se reorganiza en poblaciones con una reproducción
sexual, a través de tres mecanismos; el sobrecruzamiento, la distribución independiente de
los cromosomas durante la meiosis (Alberts et al. 2002) y la fertilización aleatoria de
gametos. La distribución y estructura de la diversidad genética dentro y entre las poblaciones
depende, a su vez, del flujo genético entre ellas, la deriva genética y la selección natural
(Ramanatha Rao & Hodgkin 2002).
Tradicionalmente, los estudios de diversidad e identificación genotípica en especies
de plantas cultivadas, incluyendo árboles frutales, han sido llevados a cabo mediante el uso

INTRODUCCIÓN GENERAL
21
de marcadores morfológicos y caracterización fenotípica. Sin embargo, este proceso es lento
y costoso lo que limita el número de genotipos a analizar así como la precisión de las
observaciones. Algunas de ellas, como las relativas a las características fenológicas
necesitan ser analizadas en un estadio del desarrollo avanzado y algunas características
morfológicas o agronómicas pueden estar afectadas por una acción genética pleiotrópica (Le
Corre & Kremer 2003). Aunque estas observaciones son útiles para relacionar fenotipo con
genotipo, la caracterización genotípica y la diversidad genética en plantas requiere de
estrategias complementarias como las técnicas moleculares (Wünsch & Hormaza 2002).
Durante las últimas décadas se han producido rápidos e importantes avances en los
métodos usados en el estudio de los ácidos nucleicos dando lugar al desarrollo de diferentes
tipos de marcadores que permiten una estimación fiable de la diversidad genética a nivel de
individuo, población o grupo de poblaciones. Aunque el incremento de la disponibilidad de las
nuevas técnicas de secuenciación está dando lugar a un cambio, generalmente solo una
pequeña parte del genoma es explorado en la mayoría de estudios de diversidad genética y,
por ello, la selección de una cantidad correcta de individuos y loci es importante para hacer
una extrapolación de los estimadores a las poblaciones naturales o las colecciones de
germoplasma (de Vicente et al. 2004; Mondini et al. 2009; Porth & El-Kassaby 2014). Aunque
los marcadores que se describen a continuación a menudo amplifican material nuclear,
también son usados con ADN mitocondrial o cloroplastídico para estimar diversidad. Sin
embargo, estos genomas son más útiles a nivel inter-específico por su bajo nivel de
polimorfismo y son, por ello, de uso común en análisis de código de barras o filogenia.
Los marcadores moleculares pueden ser bioquímicos o basados en secuencias de
ADN. Los bioquímicos están basados en la separación de proteínas (alocimas e
isoencimas) en un patrón específico de bandas por electroforesis. Son codominantes y su
principal desventaja es que están limitados por el bajo número de encimas disponibles y por
tanto la resolución de la diversidad es limitada (Mondini et al. 2009). Han sido usados desde
1970 para analizar la diversidad genética de plantas (Brown 1978) y, por tanto, también de
árboles frutales como muestran algunos trabajos recientes en manzano (Wagner et al. 2014),
avellano (Leinemann et al. 2013) o madroño (Takrouni et al. 2012). Los marcadores basados
en ADN, generalmente llamados marcadores moleculares y en constante desarrollo desde
los 80, pueden estar asociados o no con una determinada característica funcional, y se
dividen en dominantes (como RAPDs o AFLPs) o codominantes (RFLPs, microsatellite o
SNPs) dependiendo de si los genotipos pueden ser diferenciados entre homocigotos y
heterocigotos. Los fragmentos de restricción de longitud polimórfica (Restriction Fragment
Length Polymorphism) (RFLPs), han sido ampliamente usados desde que Jeffreys (1979)
descubriera los polimorfismos de ADN después de tratar a esta macromolécula con encimas
de restricción. Sin embargo, dada la disponibilidad de nuevas técnicas moleculares, su

INTRODUCCIÓN GENERAL
22
aplicación en los estudios de diversidad genética está en desuso aunque hay algunos
ejemplos recientes en árboles frutales (Garcia-Ruiz et al. 2013). Desde el diseño de la
reacción en cadena de la polimerasa (Polymerase Chain Reaction) (PCR) en los 1980 (Mullis
et al. 1986), se han desarrollado diferentes tipos de marcadores basados en ella. Entre los
que rutinariamente se usan en trabajos de ecología, evolución, taxonomía, filogenia, y
diversidad genética está la amplificación aleatoria de ADN polimórfico (Random Amplification
of Polymorphic DNA) (RAPDs) mediante la cual fragmentos de ADN son amplificados
usando cebadores decámeros de secuencia aleatoria y, por tanto, el polimorfismo depende
de la presencia o ausencia de un producto de amplificación. Empezaron a ser usados en
diferentes organismos a final de los años 80 (Williams et al. 1990) y han sido usados
ampliamente en árboles frutales, algunos ejemplos recientes son: granado (Mansour et al.
2015), olivo (Brake et al. 2014), albaricoquero (Yilmaz et al. 2012) o mango (Samal et al.
2012). Los polimorfismos en la longitud de fragmentos amplificados (Amplified Fragment
Length Polymorfisms) (AFLPs) (Vos et al. 1995) son otra clase de marcadores que combinan
RFLPs y PCR. Algunos ejemplos recientes en árboles frutales serían los de palmera datilera
(Sabir et al. 2014), Prunus mira (Li et al. 2014a) o kiwi (Li et al. 2014b). Los polimorfismos de
nucleótido único o simple (Simple Nucleotide Polymorphism) (SNPs), que son variaciones en
nucleótidos simples, que no cambian la longitud de la secuencia de ADN y ocurren a lo largo
de todo el genoma, son cada vez más utilizados (FAO 2007; de Vicente et al. 2004)
especialmente desde 2004, fecha en la cual empezaron a ver la luz los métodos de
secuenciación de próxima generación (Next Generation Sequencing) (NGS) (Glenn 2011).
Estas tecnologías están revolucionando muchas áreas de la biología ya que permiten realizar
estudios de genomas enteros (whole-genome sequencing), de porciones funcionales del
genoma (exome sequencing), análisis del transcriptoma (RNA-seq) y lugares del ADN de
unión de proteínas (ChIP-seq). La principal característica de estas técnicas es la posibilidad
de realizar secuenciaciones masivas. Probablemente el factor más importante que hace
posible la extensión de estas técnicas es que sus precios cada vez son más accesibles
(Sboner et al. 2011).
SSR o microsatélites
Los marcadores microsatélite (Simple Sequence Repeat o Short Tandem Repeat) (SSR o
STR) están basados en la presencia de secuencias cortas de DNA (de 2 a 6 nucleótidos)
repetidas y flanqueadas por regiones específicas que permiten su amplificación por PCR.
Estos marcadores son codominantes, están ampliamente extendidos por todo el genoma
incluyendo los genomas de los organelos (mitocondria y cloroplasto), tienen naturaleza
multialélica, son relativamente abundantes, altamente polimórficos, reproducibles y

INTRODUCCIÓN GENERAL
23
presentan disposición para la automatización y buen rendimiento en genotipado. Los análisis
genéticos basados en microsatélites se fundamentan en las diferencias de tamaño de los
alelos que se asocian a la variación del número de motivos repetidos en tándem. La unión
incorrecta de las cadenas de ADN durante la replicación (Replication Slippage), debido a una
estructura terciaria anormal de la región repetitiva del ADN, se considera como el mecanismo
principal de generación de nuevos alelos microsatélite aunque también pueden ser
originados por sobrecruzamientos incorrectos durante la meiosis, y retrotransposición (Kalia
et al. 2011, Ellegren 2004, Parida et al. 2009). Se han propuesto varios modelos de mutación
para las secuencias microsatélites como el modelo de alelos infinitos (Infinite Allele Model)
(IAM), el de mutación paso a paso (Stepwise Mutation Model) (SMM), o el de formación de
un número k de alelos (K-Allele Model) (KAM). En cada modelo, excepto en el IAM, cada
mutación da lugar a la creación de un alelo nuevo, pudiéndose generar de manera
independiente alelos idénticos en tamaño. Además, la secuenciación de alelos de igual
tamaño ha permitido demostrar variaciones en las secuencias nucleotídicas originándose así
varios tipos de homoplasia. A pesar de que ésta puede dificultar el uso de estos marcadores
en estudios filogenéticos, parece no ser un inconveniente significativo en los análisis de
genética de poblaciones ya que queda compensada con la gran variabilidad que presentan
estos marcadores (Ellegren 2000; Estoup et al. 2002). Algunos ejemplos recientes de su uso
en estudio de diversidad en frutales son: vid (Basheer-Salimia et al. 2014), albaricoquero
(Raji et al. 2014; Martin et al. 2011), castaño (Beghe et al. 2013), litchi (Madhou et al. 2013) o
peral (Sehic et al. 2012).
Otros marcadores basados en PCR son los marcadores de intersecuencia simple
(Inter Simple Sequence Repeat) (ISSR), aplicados, por ejemplo, en higuera (Amel et al.
2004; 2005; Ikegami et al. 2009) o clementina (Breto et al. 2001), los de secuencia
polimórfica amplificada y cortada (Cleaved Amplified Polymorphism) (CAPs) usados, por
ejemplo, en Citrus spp. (Amar et al. 2011), la región amplificada caracterizada y secuenciada
(Sequenced Characterized Amplified Region) (SCAR) usados, por ejemplo, en caqui (Cho et
al. 2013), lugar etiquetado para la secuencia (Sequence Tagged Site) (STS) y lugar
etiquetado para la expresión (Expressed Sequence Tag) (EST) usados, por ejemplo, en
Musa acuminata (Passos et al. 2012) o Actinidia spp. (Crowhurst et al. 2008). Estudios
adicionales incluyen otros marcadores moleculares como polimorfismos del codón iniciación
(Start Codon Targeted Polymorphism) (SCoT), que usa cebadores únicos diseñados para
hibridar con las regiones flanqueantes al codón de iniciación ATG en ambas cadenas el cual
se ha usado, por ejemplo, en mango (Gajera et al. 2014; Luo et al. 2011). Otros, como
polimorfismo amplificado de secuencias relacionadas (Sequence Related Amplified

INTRODUCCIÓN GENERAL
24
Polymorphism) (SRAP) ha sido usado en albaricoquero (Li et al. 2014c), caqui (Jing et al.
2013a) o almendro (Jing et al. 2013b), así como los polimorfismos para la amplificación de
regiones blanco (Target Region Amplification Polymorphism) (TRAP) que se han usado en
manzano (Guo et al. 2009). Otro grupo de marcadores está basado en elementos móviles
como los polimorfismos en la amplificación de regiones inter-retrotransposon (Inter-
Retrotransposon Amplified Polymorphism) (IRAP), usados en Musa spp. (Nair et al. 2005) o
Dyospiros spp. (Du et al. 2009a, 2009b), los polimorfismos de microsatélites en
retrotransposones amplificados (Retrotransposon-Microsatellite Amplified Polymorphism)
(REMAP), usados en Dyospiros spp. (Du et al. 2009a, 2009b) o Prunus mume (Shen et al.
2011), los polimorfismos basados en retrotransposones insertados (Retrotransposon-Based
Insertion Polymorphisms) (RBIP) en Pyrus pirifolia (Kim et al. 2012) o los polimorfismos de
amplificación específica de secuencia (Retrotransposon based Sequence-Specific
Amplification Polymorphism) (SSAP) en Anacardium occidentale (Syed et al. 2005) o
Dyospiros spp. (Du et al. 2009a, 2009b).
Metodologías de filogenia
La sistemática cladista, surgida a partir de los escritos de Hennig (1950), se define como la
parte de la biología que se encarga de clasificar a las especies en función de su historia
evolutiva (filogénesis) basándose en el reconocimiento de grupos monofiléticos (clados) y la
importancia de los caracteres derivados (sinapomorfías) (Daly et al. 2001). Los resultados de
los análisis filogenéticos a partir del análisis de caracteres discretos homólogos (y sus
estados) son representados en árboles con ramas proporcionales a la cantidad de cambios o
con ramas que sólo muestran la topología sin información adicional (cladogramas) (Baldauf
2003), siendo hipótesis de las relaciones evolutivas. Tradicionalmente se han basado en el
análisis de caracteres morfológicos pero con la llegada de la secuenciación de ADN, las
secuencias nucleotídicas o aminoacídicas tanto nucleares como plastidiales han supuesto la
principal fuente de información. En plantas, se ha extendido el uso del cloroplasto para inferir
las relaciones históricas entre las especies por su pequeño y relativamente constante
tamaño, estructura y contenido genético entre las angiospermas (Palmer 1985), a pesar de
que, en la mayoría de los casos, sólo informa sobre la línea materna. El cloroplasto típico de
angiospermas tiene un tamaño que varía entre 135 y 160 kb y se caracteriza por un largo
fragmento invertido de ca. 25kb que divide al resto del genoma en una copia simple larga y
otra pequeña (Olmstead & Palmer 1994). Aunque existen diferentes métodos para la
inferencia de las relaciones filogenéticas, éstos se pueden agrupar en dos categorías:
métodos de distancia y métodos de caracteres. Los métodos de distancia convierten la
información de similitud entre los pares de secuencias en distancias de evolución y, mediante

INTRODUCCIÓN GENERAL
25
un algoritmo, construyen un único árbol siguiendo una serie de pasos definidos (UPGMA;
NJ). Son métodos bastante rápidos pero la desventaja es que la información evolutiva se
pierde cuando la similitud global es observada más que los eventos de mutación individuales.
Los métodos de caracteres se basan en un criterio de optimización para dar un valor a cada
posible árbol construido a partir de caracteres discretos y no matrices de distancias y,
posteriormente, seleccionan a aquellos que maximizan (o minimizan) dicho criterio (Saitou
1996; Swofford et al. 1996, Lewis 2001). Los tres métodos basados en el uso de criterios de
optimización más utilizados son: máxima parsimonia, que minimiza la longitud del árbol y ha
sido empleada, por ejemplo, en Citrus spp. (Uchoi et al. 2016) o en Malus spp. (Volk et al.
2015), máxima verosimilitud, que maximiza la probabilidad de los datos dada una hipótesis
(árbol) y modelo evolutivo y ha sido utilizada en un gran número de estudios de árboles
frutales como en la familia Rosaceae (Lo & Donoghue 2012), y la inferencia bayesiana que
maximiza la probabilidad posterior o la probabilidad de una hipótesis dados los datos y que
ha sido empleada, por ejemplo, en Prunus spp. (Shi et al. 2013). Los dos últimos permiten
introducir diferentes modelos de sustitución de nucleótidos, como, por ejemplo, el modelo
general de tiempo reversible (general time reversible model) (GTR) que permite, a diferentes
tasas, las posibles 6 transiciones entre los distintos estados de carácter (nucleótidos) (Lewis
2001).
Genética del paisaje y uso de Sistemas de Información Geográfica
Un genotipo determinado se genera como resultado de distintos procesos como mutación,
selección, flujo genético y deriva genética. Por ello, las consideraciones espaciales son
claves para entender la evolución (Jarvis et al. 2005), así como el patrón de diversidad
genética y estructura de cualquier especie para contribuir a mejorar el conocimiento de las
dinámicas temporales y espaciales (Thomas et al. 2012a). Guarino et al. (2002) define los
Sistemas de Información Geográfica (Geographic Information Systems) (GIS) como un
sistema de gestión de datos que puede simultáneamente manejar datos espaciales en forma
de gráficos, (dónde), y relacionado y lógicamente adjunto, atributos no espaciales, (qué).
Estas herramientas resultan muy útiles en el estudio de la distribución de la diversidad y
estructura genética pues “el dónde” puede ser la localización de los puntos de presencia de
diferentes individuos y “el qué” podrían ser, por ejemplo, nombres de especies o información
morfológica o molecular que caracteriza cada muestra. El análisis espacial a través de GIS
puede, por tanto, ser destinado a una amplia gama de aplicaciones en la caracterización,
conservación y uso de la diversidad de los recursos genéticos de plantas (Escudero et al.
2003; Scheldeman & van Zonneveld 2012). Algunos trabajos recientes han analizado la
diversidad genética de árboles frutales con una aproximación espacial para la obtención de

INTRODUCCIÓN GENERAL
26
índices de diversidad tanto con datos morfológicos como moleculares; Jatropha curcas (Sunil
et al. 2009), Annona cherimola (van Zonneveld et al. 2012), Theobroma cacao (Thomas et al.
2012a).
La genética del paisaje (Landscape genetics), un campo de estudio relativamente
nuevo, se trata de una aproximación que combina características espaciales de la zona de
estudio (ecológicas, geológicas, etc) y genética de poblaciones para proveer información
sobre procesos microevolutivos como flujo genético, deriva genética y selección (Manel et al.
2003, Manel & Holderegger 2013). En este campo naciente se pueden, por tanto, combinar
la alta resolución de los marcadores moleculares con datos espaciales y una variedad de
métodos estadísticos para evaluar el rol que las variables paisajísticas juegan en el
modelado de la diversidad genética y la estructura poblacional (Storfer et al. 2007). La
genética de paisaje se ha ocupado de distintos asuntos (Storfer et al. 2010; Cassini 2013):
identificación de barreras para la dispersión, cuantificación de la diversidad, inferencia de los
efectos por el cambio del paisaje, identificación de migrantes en relación con las condiciones
del paisaje, estimación de las dinámicas fuente-sumidero, predicción en la difusión de una
enfermedad o una especie invasiva y comparación de patrones genéticos observados entre
paisajes actuales y pasados. De acuerdo con Holderegger et al. (2010), tres son las
estrategias más usadas para estudiar fenómenos como la migración, dispersión o el flujo
genético a través de variaciones genéticas neutras; distancia/resistencia de paisaje
(Landscape distance/resistance), técnica de superposición (Overlay technique) y evaluación
del flujo genético actual (Assessment of contemporary gene flow). Por otro lado, se empieza
también a estudiar la interacción entre el ambiente y la variación genética adaptativa. Hasta
2010, los estudios de genética del paisaje habían estado basados principalmente en
vertebrados, (62%), invertebrados (18%) y plantas (14.5%) seguidos por bacterias (3%),
virus (3%), líquenes (1%) y hongos (0.5%) (Storfer et al. 2010). Recientemente, se han
publicado algunos estudios en árboles frutales con Castanea sativa (Martin et al. 2012) o
Juglans regia (Pollegioni et al. 2014).
Familia Annonaceae y género Annona
La familia Annonaceae incluye aproximadamente 108 géneros y 2400 especies de árboles y
lianas, tropicales y subtropicales, distribuidas por todo el mundo (Chatrou 1999, Chatrou et
al. 2012). Según la clasificación APG III (Stevens 2001), esta familia se sitúa en el orden
Magnoliales junto a otras cinco familias (Myristicaceae, Degeneriaceae, Himantandraceae,
Magnoliaceae y Eupomatiaceae) representando tres cuartas partes del mismo y el cual, junto
a los órdenes Canellales, Laurales y Piperales, forman el complejo Magnoliid (Zanis et al.
2002) dentro de las angiospermas basales (Soltis et al. 2005). Se cree que las anonáceas

INTRODUCCIÓN GENERAL
27
surgieron en el Cretácico Superior hace unos 82-98 millones de años, cuando los taxones
podían distribuirse entre Laurasia y el norte de Gondwana (Doyle & Le Thomas 1997;
Richardson et al. 2004; Scharaschkin & Doyle 2005; Su & Saunders 2009). Una escisión en
una línea de Laurasia dio lugar al género Anaxagorea (presente en los neotrópicos y Asia
tropical) y la línea de Gondwana dio lugar al resto de la familia. La familia cuenta con algunos
géneros que incluyen a más de 100 especies como Guatteria, Annona, Duguetia, Uvaria y
Polyalthia (Chatrou et al. 2004).
Desde la clasificación de Fries (1959) se han llevado a cabo varios trabajos
dedicados a la sistemática de esta familia o géneros que engloba basados en caracteres
reproductivos (Doyle & Le Thomas 1994, 2012; Gottsberger 2012; Saunders 2012; Goodrich
2012), morfológicos (Maas & Westra 1985a; 1985b; Doyle & Le Thomas 1996; Su &
Saunders 2006; Couvreur et al. 2009) y moleculares utilizando secuencias cloroplastídicas
(Chatrou et al. 2012; Richardson et al. 2004; Mols et al. 2004; Pirie et al. 2005; Su et al.
2010; Erkens et al. 2012a; Thomas et al. 2012b; Chaowasku et al. 2014) y secuencias
nucleares como marcadores RAPDs, y RFLPs (van Zuilen 1996). Existe una base de datos
en línea de la familia (Rainer & Chatrou 2006), una recopilación reciente de géneros,
especies y taxones intraespecíficos (Maas et al. 2011) así como una recopilación
bibliográfica (Erkens et al. 2012b).
Un número limitado de especies, pertenecientes a dos géneros, Annona y Asimina,
producen frutos comestibles (Figura I.1) ya que, recientemente, las especies pertenecientes
al género Rollinia han sido incluidas en el género Annona (Rainer 2007). Asimina, el único
género de la familia adaptado a climas templados, incluye 12 especies (Maas et al. 2011)
entre las que se encuentra Asimina triloba, especie nativa de zonas templadas del norte de
América con interés agronómico y que ha sido objeto de numerosos estudios con
isoencimas, RAPDs, AFLPs e ISSRs (Huang et al. 1997, 1998, 2000, 2003; Pomper et al.
2003; Wang et al. 2005). El género Annona engloba a unas 162 especies (Chatrou et al.
2012) y está distribuido principalmente por las zonas tropicales de América con unas pocas
especies nativas de África. Varias especies de este género son comestibles con diversa
importancia para los mercados, fundamentalmente, locales: Annona cherimola, A. reticulata,
A. squamosa, A. muricata, A. macroprophyllata, A. glabra o A. purpurea (Figura I.1). El
género Annona fue nombrado por Linnaeus en 1737 (Linnaeus 1737) y podría haber
emergido durante el Mioceno (Richardson et al. 2004; Su & Saunders 2009). Safford (1914)
describe el género y lo divide en 5 grupos y 15 secciones y Fries (1959) lo reorganiza en 17
secciones. Diversos estudios se han llevado a cabo con especies del género Annona tanto a
nivel morfológico y/o molecular bien en estudios de identificación, diversidad o filogenia
(Ronning et al. 1995; Pinto et al. 2005; Rahman et al. 1997; Chatrou et al. 2009).

INTRODUCCIÓN GENERAL
28
Figura I.1. Fotografías de hojas, frutos o flores; a) A. cherimola, b) A. reticulata, c) A. squamosa, d) A. macrophrophyllata, e) A. glabra, f) A. muricata y g) A. purpurea y h) Asimina triloba.
Annona cherimola
Descripción botánica
Annona cherimola Mill. (Figure I.2) es un árbol semi-caduco de la sección Atta del género
Annona (Fries 1959). Árbol que puede alcanzar los 7-8 metros en su madurez. Las hojas son
simples, enteras, de disposición alterna y de forma oval a elíptica: con un tamaño variable,
en general de 7-18 cm de largo y de 4 a 10 cm de ancho con un peciolo corto (Rosell et al.
1997). Las flores son hermafroditas, colgantes, poco llamativas y aromáticas. Por lo general
se originan en la madera de un año o más de edad, pudiendo aparecer solitarias o en grupos
de hasta 8 ó 9 por yema. Las piezas florales se disponen de manera helicoidal-piramidal
sobre el receptáculo. Cada flor posee tres pétalos grandes (de 2,5 a 4 cm) carnosos de color
verde y también tres pétalos internos rudimentarios, en forma de escama. Los estambres son
INTRODUCCIÓN GENERAL
29
muy numerosos (150-200). La pirámide de pistilos tiene aproximadamente 150 unidades
independientes, con un sólo ovulo, que deben ser polinizados para que los ovarios crezcan y
se desarrolle, al fusionarse, el fruto. Las flores presentan dicogamia (separación temporal del
estado funcional femenino y masculino) protogínica (maduración de la parte femenina antes
que la masculina) lo que dificulta la autofecundación dentro de la misma flor y entre flores del
mismo árbol al estar el estado sexual sincronizado (Wester 1910; Lora et al. 2010, 2011a,
2011b). La polinización manual es habitual en España y otros países donde la ausencia del
polinizador natural causa un cuajado natural deficiente. El número cromosómico de la
mayoría de las anonas es n = 7 o n = 8 excepto Annona glabra que es tetraploide 2n=28.
Annona cherimola ha sido reportada, mayoritariamente, con 2n=14 cromosomas (Thakur &
Sigh 1965; Walker 1972) aunque también con 2n=16 (Bowden 1948).
Origen geográfico
La palabra “chirimoya” parece provenir del quechua; chiri, "frío, fría" y muya, "semillas", lo
que podría ser debido a que es un árbol adaptado a altitudes elevadas en la región andina.
Se distribuye desde México y América Central hasta América del Sur en altitudes superiores
a 900-1.000 msnm. Pese a que su centro de origen está en discusión, la teoría más
defendida hasta ahora apoya un origen sudamericano de la especie, concretamente en los
valles interandinos del sur de Ecuador y norte de Perú, pues allí se han localizado las zonas
con mayor variabilidad fenotípica y restos arqueológicos que se consideraron semillas de la
especie o representaciones de los frutos (Popenoe 1921; van Damme et al. 2000). Sin
embargo, i) el hecho de que esta especie sea la única representante de la sección Atta que
se encuentra en Sudamérica mientras el resto de especies estrechamente relacionadas tiene
una distribución centroamericana, ii) que se haya reportado mayor disimilitud entre un
número limitado de muestras centroamericanas comparado con muestras sudamericanas
(Escribano et al. 2007) o iii) posibles confusiones en los restos preincaicos con la especie
Annona muricata (Pozorski & Pozorski 1997) sugieren una hipótesis alternativa en la que la
zona mesoamericana podría ser el lugar de origen de la especie. En cualquier caso, el
chirimoyo fue domesticado en la antigüedad (Popenoe et al. 1989) y el movimiento de
material vegetal entre Mesoamérica y norte de Sudamérica tuvo lugar en tiempos
precolombinos (van Damme et al. 2000).
El chirimoyo se introdujo en el sur de España en el siglo XVIII, de donde
probablemente se llevó a Italia y Madeira (Portugal), Islas Canarias, Argelia, Egipto y,
probablemente a través de Italia, a Libia, Eritrea y Somalia. También en la última década del
siglo XVIII se introduce en Hawai, Jamaica y Haití. Desde México se introdujeron semillas en
California y a comienzos del siglo XX el departamento de Agricultura de Estados Unidos

INTRODUCCIÓN GENERAL
30
importó semillas de Madeira. Actualmente se encuentra distribuido en casi todos los países
con clima subtropical. En España empezó a tener importancia comercial en las décadas 40 y
50 del siglo XX en la provincia de Granada, con una extensión en 1953 de 106 hectáreas
(Morton 1987). Actualmente hay aproximadamente 3.000 has de cultivo en España
(www.magrama.gob).
Usos e importancia económica
La chirimoya es una fruta dulce, debido a su alto contenido de azúcares y bajo en ácidos,
que principalmente se consume fresca aunque también se utiliza para la elaboración de
helados, batidos, sorbetes, yogurt o vino (Scheldeman 2002). En hojas, tallos, corteza y
semillas se han detectado metabolitos secundarios como la isoquinolina y, al igual que otras
especies de las anonáceas, presenta acetogeninas con diversas propiedades farmacológicas
como antitumorales o insecticidas (Alaly et al. 1999; Liaw et al. 2011; Cortes et al. 2014). De
hecho, tradicionalmente las semillas machacadas han sido utilizadas como insecticidas para
combatir los piojos y curar enfermedades de la piel (Scheldeman 2002)
A pesar de que el chirimoyo ya era cultivado por civilizaciones americanas en tiempos
precolombinos, actualmente se considera un frutal infrautilizado. Se cultiva en muchas áreas
subtropicales distribuidas en todo el mundo. Algunos de los países del continente americano
más importantes en la producción de chirimoya son Perú, Ecuador, Chile, Bolivia, México,
EEUU o Brasil (Scheldeman 2002). Sin embargo, es España el principal productor mundial,
con 3149 has en 2012 (www.magrama.gob). Fino de Jete y Campas son los cultivares más
importantes, principalmente el primero que ocupa alrededor del 95% de la superficie
cultivada. Otros países productores de chirimoya son Portugal, Italia e Israel entre los
mediterráneos y Australia, Nueva Zelanda, o Sudáfrica a nivel mundial (Scheldeman 2002).
El chirimoyo ha sido objeto de trabajos para el estudio de diversidad, herencia o
ligamiento con marcadores morfológicos (Pérez de Oteyza et al. 1999; Andrés et al. 2006),
isoencimas (Ellstrand & Lee 1987; Pascual et al. 1993; Perfectti & Pascual 1996, 1998a,
1998b, 2004, 2005), RAPDs (Ronning et al. 1995), AFLPs (Rahman et al. 1998) o
microsatélites (Escribano et al. 2004, 2007, 2008, 2008b; van Zonneveld et al. 2012).
También ha sido objeto de la construcción de diferentes mapas genéticos más o menos
saturados basados en marcadores microsatélite en una población de cruce intraespecífico
(Escribano 2007; Martin 2013) y en otra de cruce interespecífico con A. squamosa (Martin
2013). La aparición de un mutante natural de A. squamosa sin semillas ha permitido
identificar un gen (INO) indispensable para la formación de las mismas (Lora et al. 2011b).

INTRODUCCIÓN GENERAL
31
Banco de germoplasma de chirimoyo y otras anonáceas frutales del IHSM-UMA-CSIC
El Instituto de Hortofruticultura Subtropical y Mediterránea La Mayora se sitúa en la provincia
de Málaga, España, en el municipio de Algarrobo, concretamente a -4.0431º de longitud y
36.7561º de latitud (Google Earth). Esta zona presenta un clima mediterráneo con
condiciones subtropicales en la que hay cultivos comerciales o experimentales de varias
especies subtropicales: aguacate (Persea americana), mango (Mangifera indica), chirimoyo
(Annona cherimola), nuez de macadamia (Macadamia sp), carambola (Averrhoa carambola),
litchi (Litchi chinensis), lúcumo (Pouteria lucuma) o longan (Dimocarpus longan). En los años
1970 se comenzó a establecer un banco de germoplasma de chirimoyo en el IHSM-UMA-
CSIC con el objetivo de disponer de accesiones que suplieran las deficiencias del cultivar
local Fino de Jete y poder llevar a cabo proyectos de mejora genética. En la actualidad el
banco cuenta con más de 350 accesiones de chirimoyo y otras anonáceas frutales. El cultivo
de chirimoyo en la costa española depende en un 95% del cultivar Fino de Jete, el cual tiene
excelentes calidades organolépticas y está muy adaptado a la zona. Sin embargo, tiene
algunas desventajas como es el alto contenido de semillas, la susceptibilidad a la mosca del
mediterráneo (Ceratitis capitata), la concentración de la producción en tres meses (octubre-
diciembre) o una mala poscosecha. Recientemente se ha registrado un nuevo cultivar
denominado “Alborán” producto de los proyectos de mejora que se llevan a cabo en el IHSM-
UMA-CSIC. Éste tiene un índice de semillas inferior a “Fino de Jete” y una calidad excelente
en los meses de invierno. De una manera paralela se está buscando un cultivar que no
produzca semillas a partir de un cruzamiento inicial entre “Fino de Jete” y un mutante
espontáneo de Annona squamosa, Thai seedless (Ts) que produce frutos normales sin
semilla. La explicación de este carácter de Ts es la deleción del locus INNER NO OUTER
(INO) (Lora et al 2011b) que está implicado en el desarrollo del tegumento exterior del óvulo.
Los programas de mejora son mucho más escasos en los países de origen del chirimoyo,
donde, a pesar de contar con germoplasma muy diverso, no hay, hasta la fecha un gran
interés comercial (Vanhove & Van Damme 2013).

INTRODUCCIÓN GENERAL
32
Figura I.2. Árbol de chirimoyo en estado silvestre muestreado en Honduras; longitud -86.7467,
latitud 14.1374 medido en coordenadas geográficas WGS84 y a unos 1270 metros sobre el nivel
del mar.
33
OBJETIVOS

OBJETIVOS
34
El objetivo general del presente trabajo es profundizar en las razones que explican la
distribución actual de la diversidad genética de Annona cherimola en las poblaciones
silvestres y semi-cultivadas del continente americano, mediante su representación espacial,
la inferencia de rutas de dispersión y el estudio de las relaciones filogenéticas con especies
estrechamente emparentadas. Además, se desarrolla una metología basada en el código de
barras de plantas para su diferenciación con las principales especies de Annona con interés
agronómico. Este objetivo general se desglosa en distintos objetivos más específicos:
1. Diseño de marcadores específicos para la especie Annona cherimola y otras especies del
género con interés agronómico y estudio de diferenciación utilizando la secuencia matK y
rbcL propuestas para el código de barras de plantas (Capítulo 1).
2. Aplicación de los marcadores de chirimoyo diseñados en capítulo 1, en 296 accesiones
procedentes del banco de germoplasma del IHSM-UMA-CSIC así como en 250 recolectadas
en Guatemala, Honduras y Costa Rica (Capítulo 2).
3. Trabajo filogenético basado en cinco secuencias del ADN del cloroplasto obtenidas de 46
individuos pertenecientes a 17 especies del género Annona; la mayoría de ellas incluidas en
la sección Atta del género y secciones cercanas con distribución exclusivamente
centroamericana (Capítulo 3).
4. Representación de la distribución de la diversidad genética actual obtenida a partir de la
amplificación con marcadores microsatélite de 1762 accesiones y sistemas de información
geográfica. Estudio de la estructura de dichas poblaciones y modelo de la distribución
espacial de la especie bajo condiciones climáticas futuras (Capítulo 4).
5. Estudio de la dispersión de la especie mediante herramientas de genética del paisaje
gracias al desarrollo de diferentes escenarios con posibles variables que pudieran haber
condicionado dicho movimiento y la correlación entre las distancias genéticas y geográficas
(Capítulo 5).

35
CAPÍTULO 1

CAPÍTULO 1
36
DNA BARCODING OF PERENNIAL FRUIT TREE SPECIES OF AGRONOMIC INTEREST
IN THE GENUS ANNONA (ANNONACEAE)
ABSTRACT
The DNA barcode initiative aims to establish a universal protocol using short genetic
sequences to discriminate among animal and plant species. Although many markers have
been proposed to become the barcode of plants, the Consortium for the Barcode of Life
(CBOL) Plant Working Group recommended using as a core the combination of two portions
of plastid coding region, rbcL and matK. In this paper, specific markers based on matK
sequences were developed for 7 closely related Annona species of agronomic interest
(Annona cherimola, A. reticulata, A. squamosa, A. muricata, A. macroprophyllata, A. glabra,
and A. purpurea) and the discrimination power of both rbcL and matK was tested using also
sequences of the genus Annona available in the Barcode of Life Database (BOLD) data
systems. The specific sequences developed allowed the discrimination among all those
species tested. Moreover, the primers generated were validated in six additional species of
the genus (A. liebmanniana, A. longiflora, A. montana, A. senegalensis, A. emarginata and A.
neosalicifolia) and in an interspecific hybrid (A. cherimola x A. squamosa). The development
of a fast, reliable and economic approach for species identification in these underutilized
subtropical fruit crops in a very initial state of domestication is of great importance in order to
optimize genetic resource management.
INTRODUCTION
Annona L. is the type genus among the approximately 110 included in the Annonaceae
(Chatrou et al. 2012), an angiosperm family within the Magnoliales in the Magnoliid clade
(APG III 2009). Due to its phylogenetic situation among the early-divergent angiosperms, this
family has been subject of a considerable interest from taxonomic and evolutionary points of
view. Different molecular markers based on both chloroplast and nuclear sequences have
been used to infer phylogenetic relationships among species of the family. Among chloroplast
sequences, rbcL, matK, ndhF, trnL, trnT-L, trnL-F, trnS-G, atpB-rbcL, trnH-psbA, ycf1, rpl32-
trnL, or ndhF-rpl32 have been used in one or several studies (Richardson et al. 2004;
Chatrou et al. 2012; Thomas et al. 2012b; Chaowasku et al. 2014). Among nuclear markers,
microsatellite flanking regions were used by Chatrou et al. (2009). Additional molecular
markers have been developed in the Annona genus mainly for fingerprinting and genetic
diversity studies; isozymes (Ellstrand & Lee 1987; Pascual et al. 1993; Perfectti & Pascual
1998a, 2004, 2005), randomly amplified polymorphic DNA (RAPDs) (Ronning et al. 1995),

CAPÍTULO 1
37
amplified fragment length polymorphism (AFLPs) (Rahman et al. 1998) and, more recently,
microsatellites (Escribano et al. 2004, 2007b, 2008a, 2008b; Pereira et al. 2008a; van
Zonneveld et al. 2012).
Several species of the genus Annona produce edible fruits and have been cultivated
and used as a food source by pre-Columbian cultures in Central and South America
(Popenoe et al. 1989). Cultivation has continued to the present day and some of them now
are incipient but prosperous crops in several developing countries with tropical and
subtropical climates: cherimoya (Annona cherimola Mill.), sugar apple (A. squamosa L.),
atemoya (Annona x atemoya Mabb., a hybrid between A. cherimola and A. squamosa),
guanabana or soursop (A. muricata L.), custard apple (A. reticulata L.), ilama (A.
macroprophyllata Donn. Sm.), pond-apple (A. glabra L.) or soncoya (A. purpurea Moc. &
Sessé ex Dunal). All of them are native of the Neotropics and only A. cherimola is adapted to
subtropical climates in higher elevations of Central and South America (from 1000 to 3000
m). Among those, cherimoya, sugar apple, guanabana, and atemoya show some commercial
importance in various tropical and subtropical regions whereas the other species are
generally used only locally with very limited or nonexistent production at a commercial scale.
Production data are difficult to find for those species with perhaps the exception of cherimoya
which value chains in South American countries have been recently studied (Vanhove & van
Damme 2013). The presence of interspecific hybrids and the lack of flowers and fruits during
most of the year make rapid unequivocal identification of these species difficult in the field,
hindering studies in different areas such as diversity evaluation and germplasm collection,
conservation and management. Consequently a fast and reliable molecular method for
identification of closely related species of Annona will be an important advance in those kinds
of studies.
One of the best approaches to unequivocally identify species from leaf samples
collected in the field is the use of DNA barcoding techniques. DNA barcoding aims to the
adoption, in a great scale, of a few short standardized genome portions that allows a
complete species identification and discrimination, especially in cases where morphological
identification is difficult. In 2004 the international initiative Consortium for the Barcode of Life
(CBOL) was founded for the development of a global method for the identification of plant and
animal species. Six years later, the International Barcode of Life (iBOL) was activated for the
maintenance of the barcode reference library BOLD (Barcode of Life Data systems)
(Ratnasingham & Hebert 2007; Bhargava & Sharma 2013). Since Hebert et al. (2003)
proposed the mitochondrial gene cytochrome c oxidase 1 (CO1) as the barcode for animal
species, it has been widely used (Hebert et al. 2003; Nicolas et al. 2012). In the case of
plants, the CBOL Plant Working Group recommended a two locus combination of the

CAPÍTULO 1
38
chloroplast ribulose-1, 5-bisphosphate carboxylase/oxygenase large subunit gene (rbcL) and
maturase K gene (matK) as the core barcode (CBOL Plant Working Group 2009). However,
in some cases those two markers produce incomplete species resolution, especially in closely
related taxa (Zhang et al. 2012) or recently diverged species (van Velzen et al. 2012).
Consequently, the use of additional genome portions such as the internal transcribed spacer
(ITS) and the second internal transcribed spacer (ITS2) from nuclear ribosomal DNA or the
chloroplast trnH-psbA intergenic spacer have been proposed (Kress et al. 2005; Chen et al.
2010; China Plant BOL Group et al. 2011; Hollingsworth 2011; Pang et al. 2012). In addition,
the complete chloroplast genome is increasingly being used as super-barcode due to its
species discrimination power, resolving some problems derived from the single or multiple
loci barcode techniques (Li et al. 2015).
In order to have a fast and reliable method to discern between closely related Annona
species with agronomic interest, in this work we developed species specific primers to
unequivocally differentiate the seven most common agronomically interesting Annona species
present in Central and South America (Annona cherimola, A. reticulata, A. squamosa, A.
muricata, A. macroprophyllata, A. glabra and A. purpurea) based on newly sequenced data.
The sequences were validated in 6 additional species of Annona and in an interspecific
hybrid. The discrimination power of the most used plant barcode genes (rbcL and matK) was
tested, using also additional Annona sequences available in the BOLD database and new
sequences obtained were registered in the GenBank data base web page.
Table 1.1. Information of the plant material used. GB code refers to the code of the Germplasm Bank for the ex situ conserved material; “wild” stands for accessions not conserved ex situ.
Species Article Code
GB code
Country of origin
Coordinates (Long/Lat)
matK (GenBank)
rbcL (GenBank)
A. cherimola Che1 FDJ Spain -4.0438/36.7601 KM068846 KM068867
A. cherimola Che2 SP74 Peru -4.0439/36.7604 KM068847 KM068868
A. cherimola Che3 Wild Honduras -88.1799/14.3122 KM068848 KM068869
A. reticulata Ret1 Wild Honduras -88.5938/14.5798 KM068849 KM068870
A. reticulata Ret2 Wild Honduras -87.1867/14.5683 KM068850 KM068871
A. reticulata Ret3 Wild Guatemala -90.0005/14.9112 KM068851 KM068872
A. squamosa Squ1 Aus2 Australia -4.0416/36.758 KM068852 KM068873
A. squamosa Squ2 Asquts Unknown -4.0412/36.7544 KM068853 KM068874
A. squamosa Squ3 Wild Honduras -87.6429/14.5645 KM068854 KM068875
A. muricata Mur1 Amur1 Unknown -4.0415/36.758 KM068855 KM068876
A. muricata Mur2 Wild Honduras -87.2141/14.0768 KM068856 KM068877
A. muricata Mur3 Wild Guatemala -90.8859/14.1061 KM068857 KM068878
A. macroprophyllata Mac1 Amacro3 Honduras -4.0421/36.7612 KM068858 KM068879
A. macroprophyllata Mac2 Wild Honduras -88.9366/14.5584 KM068859 KM068880

CAPÍTULO 1
39
A. macroprophyllata Mac3 Wild Guatemala -91.7571/15.8353 KM068860 KM068881
A. glabra Gla1 Agla2 Unknown -4.0418/36.7584 KM068861 KM068882
A. glabra Gla2 Wild Honduras -88.8661/15.1714 KM068862 KM068883
A. glabra Gla3 Agla4 Unknown -4.0421/36.7611 KM068863 KM068884
A. purpurea Pur1 Wild Honduras -87.6564/14.606 KM068864 KM068885
A. purpurea Pur2 Wild Honduras -87.9475/14.6854 KM068865 KM068886
A. purpurea Pur3 Wild Costa Rica -84.95/10.7833 KM068866 KM068887
A. liebmanniana Lie1 Wild Honduras -87.4365/15.7968
A. longiflora Lon1 MA25S1 Mexico -4.0422/36.7611
A. montana Mon1 Amon1 Unknown -4.0418/36.7584
A. senegalensis Sen1 Asen1 Unknown -4.0419/36.7612
A. emarginata Ema1 Aema21 Paraguay -4.0421/36.761
A. neosalicifolia Sal1 Aneo20 Paraguay -4.0412/36.7597
Atemoya Ate1 JT3 Breeding material
-4.0412/36.7547
Atemoya Ate2 JT7 Breeding material
-4.0411/36.7548
Atemoya Ate3 JT153 Breeding material
-4.0413/36.7545
Atemoya Ate4 Ate Roja Breeding material
-4.0415/36.758
Atemoya Ate5 19Joy Breeding material
-4.042/36.7552
MATERIALS AND METHODS
Plant Material
Leaves from three different genotypes of each of seven Annona species (Annona cherimola,
A. reticulata, A. squamosa, A. muricata, A. macroprophyllata, A. glabra, and A. purpurea)
were sampled in order to detect intraspecific variability. The materials were either collected
from the wild or from an ex situ Annona germplasm collection maintained at the IHSM-UMA-
CSIC in Málaga (Spain) at latitude 36°45′N, longitude 4°4′ W and altitude 35 m above sea
level. Their geographic origin and codes are described in Table 1.1. All trees were previously
identified in the field using morphological characters. Leaf samples from 6 additional Annona
species (A. liebmanniana Baill., A. longiflora S. Watson, A. montana Macfad., A. senegalensis
Pers., A. emarginata (Schltdl.) H. Rainer, and A. neosalicifolia H. Rainer.) and 5 atemoya
hybrids (A. cherimola x A. squamosa), were used in order to test the validity of the primers
generated (Table 1.1).

CAPÍTULO 1
40
DNA Extraction, PCR Amplification, Visualization and Sequencing
Plant DNA extraction was performed from 50 mg of young leaf tissue by a modified CTAB
method (Viruel & Hormaza 2004). Each PCR reaction contained 16 mM (NH4)2SO4, 67 mM
Tris-ClH pH 8.8, 0.01% Tween-20, 3 mM MgCl2, 0.1 mM each dNTP, 0.3 μM each primer, 20
ng genomic DNA and 1 unit of BioTaq™ DNA polymerase (Bioline, London, UK) in a final
volume of 15 μl. For sequencing the final volume was increased to 35 μl maintaining the
concentration of the different ingredients. Universal primers used to amplify rbcL were rbcLaF
and rbcLaR, for matK MatK_1RKim-f and MatK_3FKim-r (Kuzmina & Ivanova 2011). For rbcL
the temperature profile was: an initial step of 4 min at 95ºC, 5 cycles of 30 s at 94ºC, 1 min at
55ºC and 1 min at 72ºC, 30 cycles of 30 s at 94ºC, 1 min at 54ºC and 1 min at 72ºC and a
final step of 10 min at 72ºC. For matK the temperature profile was: an initial step of 1 min at
94ºC, 35 cycles of 30 s at 94ºC, 20 s at 52ºC and 50 s at 72ºC and a final step of 5 min at
72ºC. PCRs were carried out in an I-cycler (Bio-Rad Laboratories, Hercules, CA, USA)
thermocycler using the following temperature profile: an initial step of 1 min at 94°C, 35 cycles
of 30 s at 94°C, 30 s at 60–69°C (Table 1.2), and 1 min at 72°C, and a final step of 5 min at
72°C. Amplicons were visualized in 1 or 3% agarose gels stained with Gel Red (1X).
Two multiplex PCR methods were developed for 6 of the 7 specific markers,
depending on their annealing temperature. At 65°C, primers AChF1, AChR1, AChReF1,
AReR1, AMuF1, AMuR1 were placed in the same master PCR mix, only decreasing the
concentration of AChF1 and AChR1 from 0.3 to 0.07 μM. At 69°C, primers ASquF1, ASquR1,
AMaF1, AMaR1, AGlaF1, AGlaR1 were also used together increasing every concentration
from 0.3 to 0.4 μM. Prior to sequencing, PCR solutions were purified with NucleoSpin®
Extract II (Macherey-Nagel). Sequencing was done by the fluorescent dye terminator
sequencing method (Macrogen).
Barcode Sequence Quality and Species Discrimination
Amplified matK and rbcL of the 21 different Annona DNA samples belonging to 7 species
were sequenced in the forward direction. Chromatograms were analyzed by Chromas Lite
version 2.1 (2012), Technelysium Pty Ltd, South Brisbane, Queensland, Australia. The
criteria used to establish an acceptable sequence were as follows (modified from Hanner
2009): (i) ends were trimmed to minimize low quality base calls on each end; all bases were
deleted until there were at least contiguous 10 pair bases with a PHRED score >20 (ii) bases
with PHRED values less than 20 were recorded as N; (iii) sequences with more than 40% N
base calls were deleted.

CAPÍTULO 1
41
To assess the discriminatory power of both genes at the specific level, the 42
sequences obtained, 21 of matK and 21 of rbcL, were aligned with MUSCLE implemented in
the software MEGA5 version 5.05 (Tamura et al. 2011) using the default options.
Table 1.2. Details of the primers designed for identification of species of Annona including sequence, PCR melting and annealing temperatures, expected PCR product size and target species.
Name Sense Sequence 5´-3´ Melting temp. (ºC)
Annealing temp. (ºC)
Expected size (bp)
Specificity
AChF1 F GTATATGAATGTGAATCGGTATTC 58.3 65 396
A. cherimola matK AChR1 R TTGACTCCTTACTGCGGAAT 61.7
AChReF1 F GCTTCGGAATGATTTTCC 60.1 65 364
A. reticulata matK AReR1 R CGCCTTAGCCAACGATT 61.9
ASqF1 F CCATTTCCGTTTGTTCAAAC 62.2 69 315
A. squamosa matK ASqR1 R GGTAAGATTTCCATTTCTTCATC 59.8
AMuF1 F CATTTACGATCAACATCCTTTA 58.6 65 332
A. muricata matK AMuR1 R GAAGAATTTTGGCGTACACTTA 60.2
AMaF1 F ATACAAGATGCTCCCTCTTTG 60.2 69 644
A. macro-prophyllata matK AMaR1 R TTAGCCAATGATCCAATCATT 61.2
AGlF1 F CGATCAACATCCTTTGGG 62.1 69 476 A. glabra matK
AGlR1 R GCCGGCTTACTAATAGGGTT 61.3
APuF1 F TTCTTGTTCCTATATAATATTCATA 53.2 61 619
A.purpurea matK APuR1 R GAGAAAGATTTCTGTATATGCGT 58.5
1R_kim F ACCCAGTCCATCTGGAAATCTTGGTTC 52 Universal matK
3F_kim R CGTACAGTACTTTTGTGTTTACGAG
rbcLa_F F ATGTCACCACAAACAGAGACTAAAGC 55-54 Universal rbcL
rbcLa_R R GTAAAATCAAGTCCACCRCG
Pairwise sequence distances were calculated using the Kimura-2-parameter (K2P) that takes
into account transitions and transversions, with the same software (Aubriot et al. 2013). For
each species, when the maximum intraspecific distance was lower than the minimum
interspecific distance, discrimination was considered successful (CBOL Plant Working Group
2009). In addition, a tree based identification approach was used. For that, all sequences of
the genus Annona available in BOLD for each of the two genes analyzed were downloaded
[access 08/2012] (Ratnasingham & Hebert 2007); in total 20 sequences of matK belonging to
10 different species and 36 sequences of rbcL belonging to 24 different species were
available (Table 1.3). Two Neighbor Joining (NJ) trees of K2P distances were constructed
using the same program and running 1000 bootstrap replicates (Figure 1.1).

CAPÍTULO 1
42
Design of Species-specific Markers
In order to design PCR-specific primers, newly sequenced alignments for matK and rbcL
Annona DNA samples and the sequences downloaded from BOLD were used. Inter-species
polymorphisms were studied manually using GENEDOC version 2.7. Intraspecific variations
were not considered. The gene matK was selected for the development of 7 Annona specific
markers. Pairs of specific primers were designed locating the 3′ end of each primer in specific
shared polymorphic regions compared to the sequences that belonged to all the other
species. Primers were designed to amplify targets of different length so PCR output could be
determined by its position in a gel. To calculate melting temperatures and avoid as much as
possible interaction among primers (also within different markers) we used the Multiple
Primer Analyzer available at http://www.thermoscientificbio.com/webtools/multipleprimer
[access 02/2013]. Primers designed are described in Table 1.2 and were validated in 6
additional Annona species through PCR amplification of DNA and visualization of the
amplification fragments in agarose gels.
Table 1.3. MatK and rbcL BOLD sequences downloaded from http://www.boldsystems.org/
BOLD Code Code Species rbcL (bp) matK (bp) Collected in
GBVG4966-11 AcuA A. acuminata
566 Panama
GBVG4967-11 AcuB A. acuminata 553
Panama
GBVG4968-11 AmaA A. amazonica 1317
Bolivia
GBVG4969-11 BicA A. bicolor 1369
Mexico
GBVG4970-11 CorA A. cornifolia 684
Bolivia
GBVG4971-11 DecA A. deceptrix 1427
Ecuador
GBVG4972-11 DemA A. deminuta 1291
Peru
GBVG4973-11 DumA A.dumetorum
978 -
GBVG4974-11 DumB A.dumetorum 1368
Dominican Republic
GBVG4975-11 GlaA A. glabra
831 United States
GBVG4976-11 GlaB A. glabra 1427
United States
GBVG4977-11 GlaC A. glabra
1524 -
GBVG4978-11 HolA A. holosericea 1369
Honduras
GBVG4979-11 HypA A. hypoglauca 1369
Bolivia
GBVG4980-11 MonA A. montana 1369
-
GBVG4981-11 MurA A. muricata
1524 -
GBVG4982-11 MurB A. muricata 1400
-
GBVG4983-11 MurC A. muricata
831 -
GBVG4984-11 MurD A. muricata 1421
-
GBVG4985-11 OliA A. oligocarpa 1269
Ecuador
GBVG4986-11 PruA A. pruinosa 1369
Costa Rica

CAPÍTULO 1
43
GBVG4987-11 RetA A. reticulata 1369
Bolivia
GBVG4988-11 ScaA A. scandens 676
Bolivia
GBVG4989-11 SclA A. sclerophylla
1524 -
GBVG4990-11 SenA A. senegalensis 1426
-
GBVG4991-11 SprA A. spraguei
783 Panama
GBVG4992-11 SprB A. spraguei 550
Panama
GBVG4993-11 SquA A. squamosa
842 -
GBVG4994-11 SquB A. squamosa 1369
Netherlands Antilles
GBVG4995-11 SymA A. symphyocarpa 1343
Guyana
GBVG4996-11 UrbA A. urbaniana 1369
Dominican Republic
INB080-12 MucA A. mucosa 552
Costa Rica
KNPA853-09 SenB A. senegalensis 555 1056 South Africa
MHPAC1050-11 HolB A. holosericea 552
Costa Rica
MHPAC1051-11 HolC A. holosericea 552
Costa Rica
MHPAC1052-11 HolD A. holosericea 552
Costa Rica
MHPAC370-08 RetB A. reticulata 553 1006 Costa Rica
MHPAC371-08 RetC A. reticulata 552 1006 Costa Rica
MHPAC378-08 RetD A. reticulata 552 975 Costa Rica
MHPAC397-08 PurA A. purpurea 551 1006 Costa Rica
MHPAC398-08 PurB A. purpurea 552 1006 Costa Rica
MHPAC399-08 PurC A. purpurea 552 1006 Costa Rica
MHPAD3022-10 GlaD A. glabra 552 1006 Costa Rica
MHPAD3023-10 GlaE A. glabra
1006 Costa Rica
MHPAD3024-10 GlaF A. glabra 552 995 Costa Rica
MHPAD3025-10 GlaG A. glabra 552 1006 Costa Rica
CAPÍTULO 1
44
RESULTS
Barcode Sequences Quality and Species Discrimination
All of the 42 sequences obtained fulfilled the established criteria to consider the sequencing
reactions successful. Sequence sizes after the trimming process varied from 752 to 820 bp in
the case of matK and from 470 to 528 in the case of rbcL. The number of bases with a
PHRED score below 20, so, therefore, substituted by N, was between 0 and 7, with the
exception of sample Mur2 amplified with matK primers which had 61 bad quality bp (less of
40% of the sequence). All sequences were uploaded to the GenBank database and their
accession numbers are indicated in Table 1.1.
Intraspecific sequence variability was only found in A. muricata. The maximum
intraspecific distance was then compared to the minimum interspecific distance; in almost all
cases the former was smaller than the latter (Table 1.4). Nucleotide sequence of the barcode
gene matK could discriminate all 7 species, while rbcL could not distinguish between A.
cherimola and A. squamosa samples.
The NJ trees obtained are shown in Figure 1.1 In the matK tree, new sequences from
the 7 tested species grouped in different clusters. Besides, where applicable, sequences from
the same species (newly obtained in this work and downloaded from BOLD) grouped
together. In the case of rbcL, all the 21 new sequences clustered by species except A.
cherimola and A. squamosa, that were grouped together. Furthermore, sequences from the
same species downloaded from BOLD and the newly obtained sequences grouped together
in the same cluster. Nevertheless, some species were mixed; in the cluster of A. cherimola
and A. squamosa samples, three additional species (A. urbaniana, A. reticulata and A.
pruinosa) downloaded from BOLD were present A. holosericea and A. spraguei BOLD
samples appeared also in the same cluster.

CAPÍTULO 1
45
Figure 1.1. Neighbour joining trees of pairwise K2P substitution rates using 41 matK sequences (1) and 57 rbcL sequences (2). Taxon codes are indicated in Table 1.1 and Table 1.3. Bootstrap values of 50% and above are shown on the clusters. The scale bar represents the substitution rate per site.

CAPÍTULO 1
46
Table 1.4. Intra- and interspecific 2KP distances among the new sequences obtained.
matK rbcL
Species (codes) Intraspecific distances
Interspecific distances
Intraspecific distances
Interspecific distances
Min Max Min Max Min Max Min Max
A. cherimola 0.000 0.000
0.008 0.023
0.000 0.000
0.000 0.013
(Che1, Che2, Che3)
A. reticulata 0.000 0.000 0.009 0.024 0.000 0.000 0.002 0.015
(Ret1, Ret2, Ret3)
A. squamosa 0.000 0.000 0.008 0.021 0.000 0.000 0.000 0.013
(Squ1, Squ2, Squ3)
A. muricata 0.000 0.001 0.009 0.023 0.000 0.000 0.004 0.015
(Mur1, Mur2, Mur3)
A. macroprophyllata 0.000 0.000 0.011 0.023 0.000 0.000 0.002 0.023
(Mac1, Mac2, Mac3)
A. glabra 0.000 0.000 0.014 0.018 0.000 0.000 0.009 0.018
(Gla1, Gla2, Gla3)
A. purpurea 0.000 0.000 0.009 0.024 0.000 0.000 0.009 0.024
(Pur1, Pur2, Pur3)
Specific Markers
Seven markers were developed for 7 different Annona species. Details on the primer features
and amplification conditions are summarized in Table 1.2. Primer specificity was verified
using 13 samples of different Annona species (Figure 1.2). For each species, just one band
appeared when the specific markers developed were used.
In order to optimize routine species identification two multiplex PCR methods were
developed; one for A. squamosa, A. macroprophyllata and A. glabra markers (all with 69°C
annealing temperature), whose expected size amplicons are 315, 644, and 476 bp
respectively and the other, for A. cherimola, A. muricata and A. reticulata markers (all with
65°C annealing temperature), whose expected size amplicons are 396, 332, and 364 bp
respectively. In addition, AChReF1 hybridizes with A. cherimola sequences so, when added
to the same reaction than the AChR1 markers, a new band of 271 bp appeared in the A.
cherimola samples (Figure 1.3).

CAPÍTULO 1
47
Figure 1.2. Electrophoresis in 1% agarose gels of specific PCR reactions using the primers developed in this work and 13 DNA samples from different species in the Annonaceae. Taxon codes are indicated in Table 1.1. W: water. 1) PCR with universal matK primers, 2) PCR with A. cherimola primers, 3) PCR with A. reticulata primers, 4) PCR with A. squamosa primers, 5) PCR with A. muricata primers, 6) PCR with A. macroprophyllata primers, 7) PCR with A. glabra primers, 8) PCR with A. purpurea primers. Hiperladder 1Kb of Bioline was used as size marker.
These markers could also be used to study interspecific hybrids. Five atemoya
samples, a hybrid of A. cherimola and A. squamosa, were analyzed with both loci. Four of the
hybrid atemoyas where known to have A. cherimola as maternal parent and, as expected,
those 4 samples only showed amplification bands when amplified with the A. cherimola
specific primers (Figure 1.4). The fifth sample, for which the direction of the cross was
unknown, also showed this band when amplified with the A. cherimola specific marker,
indicating A. squamosa as the pollen donor.

CAPÍTULO 1
48
Figure 1.3. Electrophoresis in 3% agarose gel of 2 multiplex PCR. Taxon codes are indicated in Table 1.1. W: water. 1) Multiplex PCR with A. cherimola, A. reticulata and A. muricata primers. 2) Multiplex PCR with A. squamosa, A. macroprophyllata and A. glabra primers. Hiperladder 1Kb of Bioline was used as size marker.
Figure 1.4. Electrophoresis in 1% agarose gel of 1) A. cherimola and 2) A. squamosa primers with atemoya DNA samples. Taxon codes are indicated in Table 1.1. W: water. Hiperladder 1Kb of Bioline was used as size marker.
1)
2)

CAPÍTULO 1
49
DISCUSSION
In this work we tested the two chloroplast loci, rbcL and matK, proposed for the barcode of
plants by the CBOL (CBOL Plant Working Group 2009), for differentiation of species of
agronomic interest in the genus Annona. Sequences of other species of the genus present in
the BOLD database were also included in the analysis. The results obtained by distance
analysis methods with 21 genotypes belonging to 7 agronomical important Annona species
showed almost no intraspecific variation, which could be due to the limited number of
samples analyzed. One criticism of this kind of analyses is that often a very few individuals
per species are studied or that incomplete geographic sampling is performed resulting in
possible poor representation of the intraspecific variation or interspecific divergence, given
rise to possible misleading results regarding barcoding gap and overlap between intra- and
interspecific variation (Meyer & Paulay 2005). Although for some species the samples used
here were obtained from different geographical areas, in other species the samples used just
cover a small part of their distribution range; consequently, additional intraspecific variation
could be present if samples from other regions were included in the analysis. Locus rbcL
could distinguish 5 of the 7 species, showing overlap between intra- and interspecific
variation, while locus matK could distinguish all of them, since intraspecific distances were
smaller than interspecific values, showing a barcode gap with the number of species studied.
Both rbcL and matK have been recommended as core plant barcodes by CBOL (CBOL Plant
Working Group 2009) although, as shown in this work, rbcL usually displays a lower
interspecific variation (Kress et al. 2005). Moreover, the universality of these two markers has
been questioned in some particular taxa (Chase et al. 2007; Roy et al. 2010).
This initial analysis was broadened with comparison with additional sequences from
other species of the genus Annona available in the BOLD database using NJ trees. Tree-
based methods are also used for the identification of query samples when comparing its
barcode sequences to a data set and the clustering position analyzed (van Velzen et al.
2012). Results, again, show a good performance of both genes, particularly of matK, since
sequences from different individuals of the same species were grouped together in different
clusters of the NJ tree. The mixed presence of some species in the NJ trees could be
explained by this lower identification power of rbcL (when this number of different species is
used) or by errors in species identification prior to uploading the sequences to the BOLD
database. A multilocus analysis was not carried out since matK could discriminate all the
species studied.
Newly obtained and BOLD matK sequences alignment was also used for the manual
finding of specific polymorphic nucleotides. These were used for the development of 7
specific markers, relying on the idea of diagnostic positions. In fact, character-based

CAPÍTULO 1
50
diagnosis methods are the other big group used in traditional barcode techniques. They count
just on relevant diagnostic positions of the sequence that would support a particular
classification (DeSalle et al. 2005).
In the case of Annona species, the development of fast, reliable and economic tools,
such as specific markers, to identify these promising subtropical resources in a very initial
state of domestication is of great importance in order to optimize genetic resource
management. In addition, since these markers are chloroplast based genes, their presence or
absence in interspecific hybrids could serve to discern hybridization processes in these
species; some of them are known to hybridize easily (such as A. cherimola and A. squamosa)
although some authors (Zill & Mahdeem 1998; George et al. 2002) have reported other
hybrids in the genus (such as A. cherimola x A. reticulata or A. squamosa x A. diversifolia) at
least as a result of artificial pollination. The markers described in this work are appropriate for
the discrimination of the most important species of the genus from an agronomic point of view
although, since the genus Annona includes about 160 species (Chatrou et al. 2012),
additional work will be needed to develop appropriate identification tools for all the species of
the genus.

51
CAPÍTULO 2

CAPÍTULO 2
52
APPLICATION OF CHERIMOYA SPECIFIC MARKERS IN A GERMPLASM COLLECTION
WITH GEOGRAPHICAL IMPLICATIONS ON ITS DIVERSITY AND DISPERSION
ABSTRACT
Previously developed A. cherimola specific primers based on the plant barcode gene matK
were tested in 296 cherimoya accessions from the word reference germplasm collection
maintained at the IHSM-UMA-CSIC in Málaga (Spain) and in 250 cherimoya samples
collected from three Central American countries (Honduras, Guatemala and Costa Rica).
Results showed the existence of two different haplotypes in the samples analyzed with
geographical correlation. A new marker that amplified all the samples analyzed was designed
based on the trnL-F locus.
INTRODUCTION
Taxonomy is the discipline that identifies and classifies all organisms in categorical levels.
Species is usually the smallest taxonomic category considered as lineages that evolve
independently and, consequently, species identification is a crucial process for many different
basic and applied research or management projects. The notion of species has been highly
controversial and several different concepts have been proposed (Hey 2001, 2006). One of
the most used, biological species concept, was developed by Mayr (1942) and defines
species as groups of natural populations that mate really or potentially and are reproductively
isolated from other groups. A phylogenetic concept defines species as a group of organisms
descendent from a common ancestor that share certain primitive and derived characters
(Cracraft 1983).
Both morphological and molecular (protein and nucleotide) characters have been used
for the identification and classification of taxons, relying on the idea that linages diverge in the
accumulation of variants. DNA based techniques provide some advantages in comparison to
morphological or protein-based molecular techniques since DNA is a very stable molecule
that provides a lot of information due to the degeneration of the genetic code and the high
rate of mutation of non informative sites. Some of the molecular methods used for species
identification are hybridization, restriction enzyme digestion, PCR-based techniques, real time
PCR and analysis of nucleotide sequences (Pereira et al. 2008b) such as barcoding. In this
sense, DNA barcoding is a taxonomic method whose final goals are to identify any species
and to characterize new ones, comparing each species sequences against robust databases.
Quite a few loci or a combination of them have been proposed for the barcode of plants; the
most important are matK, rbcL, trnH-psbA, trnL-F, ITS1, or ITS2, among others (CBOL Plant
CAPÍTULO 2
53
Working Group, 2009; Kress & Erickson, 2007; De Groot et al. 2011; Hollingsworth 2011;
China Plant BOL Group, 2011; Chen et al. 2010).
In a previous work (Larranaga & Hormaza 2015, chapter 1), one of the combinations
of two chloroplast loci (rbcL and matK) proposed for the barcode of plants (CBOL Plant
Working Group, 2009), were tested in Annona species with significant agronomic interest. In
addition, specific primers based on matK were designed to discriminate among them through
a single PCR and observation of presence/absence bands in agarose electrophoresis gels.
Annona cherimola, cherimoya, native to the Neotropics, is one of the most important species
of agronomic interest in the Annonaceae family, although it is considered as a neglected and
underutilized species (NUS) with a high agronomical potential in subtropical areas in different
regions of the world (Bioversity International and CHERLA 2008). In order to test whether the
primers designed for Annona cherimola included all the intraspecific variation, in this work
546 samples were analyzed, 410 were mapped and some of them were sequenced. A
second set of primers was designed based on the trnL-F locus, used in several phylogenetic
studies among the Annonaceae family (Chaowasku et al. 2014; Chatrou et al. 2012; Pirie et
al. 2007; Richardson et al. 2004).
MATERIAL AND METHODS
Plant material
A total of 296 cherimoya accessions, conserved in the field germplasm collection maintained
at the IHSM-UMA-CSIC, Spain, were collected. The number of samples per country of origin
is indicated in Table 2.1. In addition, 250 samples collected in Guatemala (40), Honduras
(137) and Costa Rica (73) were also analyzed. The design of new specific primers was
carried out following Larranaga and Hormaza (2015) (chapter 1), two individuals belonging to
each of the most important species of agronomical interest in the genus Annona (A.
cherimola Mill., A. reticulata L., A. squamosa L., A. muricata L., A. macroprophyllata Donn.
Sm., A. glabra L. and A. purpurea Moc. & Sessé ex Dunal) were selected. To validate these
new primers, one individual of six additional Annona species (Annona liebmaniana, A.
longiflora, A. montana, A. senegalensis, A. emarginata, and A. salicifolia) as well as one
Asimina triloba individual were also analyzed. Codes and geographic origin of the individuals
are indicated in Table 2.1.
DNA extraction, amplification, visualization and sequencing
Plant DNA extraction was performed from 50 mg of young leaf tissue by a modified CTAB
method (Viruel & Hormaza 2004). Each PCR reaction contained 16 mM (NH4)2SO4, 67 mM

CAPÍTULO 2
54
Tris-ClH pH 8.8, 0.01% Tween 20, 3 mM MgCl2, 0.1 mM of each dNTP, 0,3 M of each
primer, 20 ng of genomic DNA and 1 unit of BioTaqTM DNA polymerase (Bioline, London, UK)
in a final volume of 15 or 35 l. The analyzed loci are indicated in Table 2.2. PCR reactions
were carried out in an I-cycler (Bio-Rad Laboratories, Hercules, CA, USA) using the following
program: an initial step of 1 min at 94ºC, 35 cycles of 30 s at 94ºC, 30 s at 60-66ºC (Table
2.2) and 1 min at 72ºC and a final step of 5 min at 72ºC. For matK the temperature profile
was: an initial step of 1 min at 94ºC, 35 cycles of 30 s at 94ºC, 20 s at 52ºC and 50 s at 72ºC
and a final step of 5 min at 72ºC. Amplicons were visualized in 1% agarose gels stained with
Gel Red (1X) and/or with a Beckman Coulter Genome LabTM GeXP capillary DNA analysis
system after labeling forward primers with a fluorescent dye on the 5´-end. In this case,
samples were denatured at 90°C for 120 seconds, injected at 2.0 kV, 30 seconds, and
separated at 6.0 kV for 35 min.
Sequencing was done by the Fluorescent dye terminator sequencing method and,
prior to sequencing, PCR solutions were purified with NucleoSpin® Extract II (Macherey-
Nagel).
Specific markers design
In order to design a second pair of PCR-specific cherimoya primers (AChF2 and AChR2;
Table 2.2), trnL-F universal marker was selected to amplify and sequence 15 previously used
DNA samples (Larranaga & Hormaza 2015, chapter 1) (Table 2.1). Newly raw sequenced
trnL-F fragments were aligned by MUSCLE (MEGA5 version 5.05) (Tamura et al. 2011) using
the default options. Inter-species polymorphisms among A. cherimola and other species were
manually identified while intra-specific variations were not considered. Two specific primers
were designed locating the 3´-end of each primer targeting cherimoya specific variant sites.
The expected size of the amplicon was 197 bp. An optimal annealing temperature was
established by empirical means. A homology search was conducted with the BLAST tool to
indicate which species could be amplified with these new primers.
Application of specific primers
Specific A. cherimola matK-based primers (AChF1 and AChR1) (Larranaga & Hormaza 2015)
were tested in 546 cherimoya accessions, 296 from the cherimoya Spanish collection and
250 collected in Central America. Germplasm accession samples with an American origin and
a known geolocation (160) and all accessions from Central America (250) were mapped
using ArcMap 10.1 with presence/absence of amplification. WGS84 geographical projection
was settled, and a layer with country boundaries downloaded from the DIVA GIS web page

CAPÍTULO 2
55
and layer 1:10 Cross-blended Hypsometric Tints from Natural Earth was used. Specific A.
cherimola trnL-F-based primers (AChF2 and AChR2) were tested for the same 546
cherimoya accessions.
Table 2.1. Country of origin, codes and number of accessions and plant genotypes used in this study.
Country of Origin
Number of accessions
Code Species Country of origin
Cherimoya IHSM-UMA-CSIC collection accessions
Australia 13
Genotypes used for primers design
Che1 A. cherimola Spain
Bolivia 16 Che2 A. cherimola Ecuador
Chile 9 Che3 A. cherimola Peru
Colombia 5 Ret1 A. reticulata Honduras
Costa Rica 1 Ret2 A. reticulata Honduras
Ecuador 47 Squ2 A. squamosa Unknown
Italy 3 Squ3 A. squamosa Honduras
Japan 1 Mur2 A. muricata Honduras
Mexico 6 Mur3 A. muricata Guatemala
Peru 126 Mac2 A. macroprophyllata Honduras
Portugal 26 Mac3 A. macroprophyllata Guatemala
Spain 7 Gla1 A. glabra Unknown
USA 36 Gla3 A. glabra Unknown
Cherimoya Central America samples
Guatemala 40 Pur1 A. purpurea Honduras
Honduras 137 Pur3 A. purpurea Costa Rica
Costa Rica 73 Lie1 A. liebmanniana Honduras
Lon1 A. longiflora Mexico
Mon1 A. montana Unknown
Sen1 A. senegalensis Unknown
Ema1 A. emarginata Paraguay
Neo1 A. neosalicifolia Paraguay
Tri1 Asimina triloba Unknown
Sequence analysis
Fourteen DNA samples that did not amplify and 5 that showed amplification with AChF1 and
AChR1 were amplified and sequenced with universal matK primers to analyze the reason for
the absence of amplification. Since these specific primers were based on a single nucleotide
variant positioned on each 3´-end, these locations were primarily observed. Both forward and
reverse primers were designed to hybridize with a C and an A, while the rest of the
sequences belonging to the other species showed a T and a C respectively.

CAPÍTULO 2
56
Table 2.2. Details of the primers used and designed including sequence, PCR annealing temperatures, expected PCR product size, target species and references.
Name Sense Sequence 5´-3´ Annealing temp. (ºC)
Expected size (pb)
Specificity Reference
AChF1 F GTATATGAATGTGAATCGGTATTC
65 396 Annona cherimola
Larranaga & Hormaza, 2015 AChR1 R TTGACTCCTTACTGCGGAAT
AChF2 F CCATTTTCCCCCCCTAATT
66 197 Annona cherimola
AChR2 R CAATAGTGGAGATTCCTTGCCT
1RKim F ACCCAGTCCATCTGGAAATCTTGGTTC
52 Universal-matK
Kuzmina M & Ivanova N, 2011 3FKim R CGTACAGTACTTTTGTGTTTACGAG
C F CGAAATCGGTAGACGCTACG
60 Universal- trnL-F
Taberlet et al. 1991
F R ATTTGAACTGGTGACACGAG
RESULTS
Specific markers
Fifteen DNA samples belonging to 7 different Annona species (Table 2.1) were amplified with
trnL-F universal primers to design the primers AChF2 and AChR2 based on their sequences
(Table 2.2). Raw sequences were aligned and two SNPs were shared by all the A. cherimola
samples but reveal differences in the sequences of the rest of other species. These SNPs
were used to locate the 3´-end of each new primer. Primer specificity was verified using 15
samples of different Annona species and one Asimina triloba (Figure 2.1). Just one band of
the expected size (197 bp) appeared when the A. cherimola DNA was used.
Interestingly, some of the raw sequences showed an electropherogram with a mixed
pattern of peaks after a certain point, which could indicate a compression in the sequencing
process since it starts after several thymines or cytosines (Figure 2.2). In particular, both
sequences of A. reticulata, A. squamosa and A. muricata showed multiple peaks after the
position 285-315 (depending of each raw sequence) and 12-15 thymines. A. macrophyllata
sequences showed multiple peaks after the position 582 or 583 and 11 cytosines. These
results could also be due to the presence of more than one PCR product although just a
single band was observed in the agarose gels.
The homology search conducted with BLAST (03-2014) showed a 100% query cover
for the forward primer and identity with trnL-F sequences of A. cherimola, A. pruinosa, A.
dumetorum and A. bicolor, while the reverse primer showed identity in the 3´-end for trnL-F
entries of A. cherimola and A. pruinosa only.

CAPÍTULO 2
57
Figure 2.1. Electrophoresis in 1% agarose gels of cherimoya specific PCR reactions using the AChF2 and AChR2 primers and 14 DNA samples from different species in the Annonaceae used as templates. (C) A. cherimola; Che1, (R) A. reticulata ; Ret1 , (S) A. squamosa; Squ2, (M) A. muricata; Mur2, (Ma) A. macroprophyllata; Mac2 (G) A. glabra; Gla1, (P) A. purpurea; Pur1, (L) A. liebmaniana; Lie1, (Lo) A. longiflora; Lon1, (Mo) A. montana; Mon1, (T) A. triloba; Tri1, (Se) A. senegalensis; Sen1, (E) A. emarginata; Ema1, (N) A. neosalicifolia; Neo1, (W) Water. Taxon codes are indicated in Table 2.1. Hiperladder 1Kb of Bioline was used as size marker.
Application of specific primers
AChF1 and AChR1 primers were successful to amplify 291 (98.3%) DNA samples from the
cherimoya germplasm bank, while five (1.7%) failed to amplify. These five genotypes (coded
as Bolivia Seedling2, Bolivia Seedling3, Bonita, Booth and Lucida) came from a collection in
California, USA, with Mexican, Bolivian or unknown origin. In addition, 66% of the samples
samples classified as A. cherimola from Guatemala (35/40), Honduras (60/137) and Costa
Rica (70/73), amplified with the primers AChF1 and AChR1. American accessions from the
Spanish collection with well-known geographic coordinates, and all Central American
samples were mapped in Figure 2.3, indicating whether each sample showed amplification or
not.
Primers AChF2 and AChR2 amplified all accessions (546) but four (0.73%) of the
analyzed samples. Two of them belong to the germplasm field collection and their origin is the
island of Madeira, Portugal, and two were collected in Guatemala. These last two accessions
also failed to amplify with the first set of primers AChF1/AChR1
.
C R S M Ma G P L Lo Mo T Se E N W
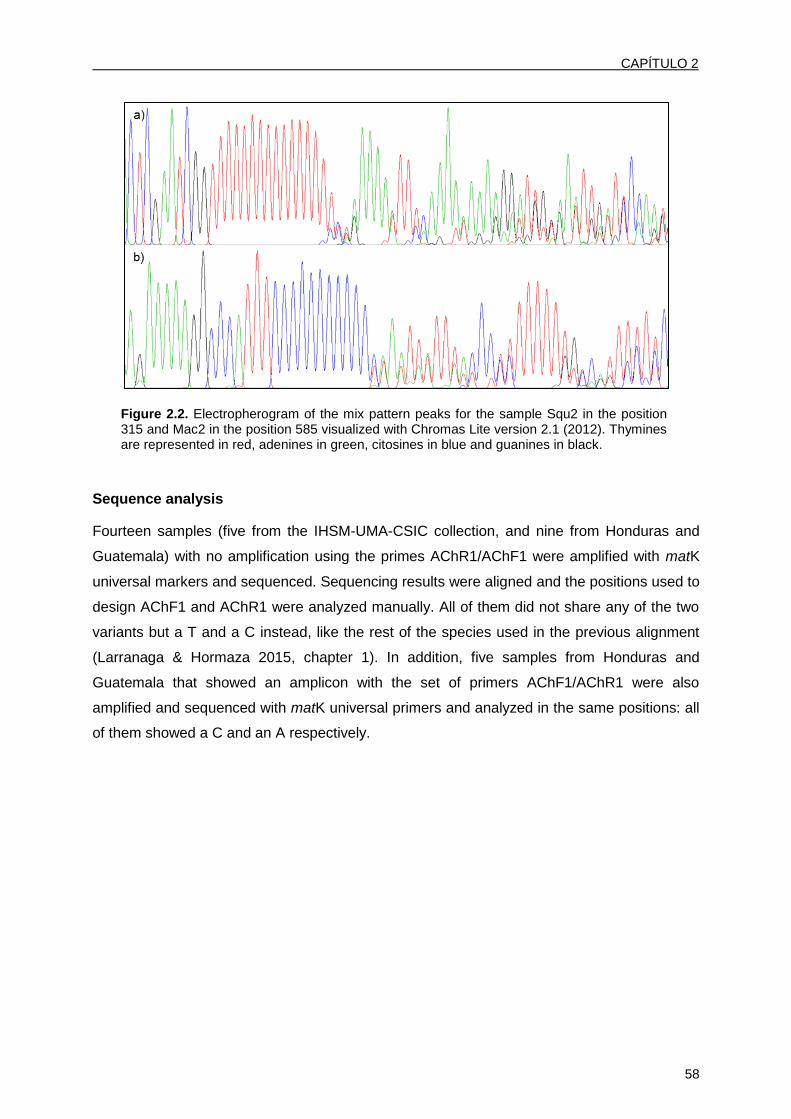
CAPÍTULO 2
58
Figure 2.2. Electropherogram of the mix pattern peaks for the sample Squ2 in the position 315 and Mac2 in the position 585 visualized with Chromas Lite version 2.1 (2012). Thymines are represented in red, adenines in green, citosines in blue and guanines in black.
Sequence analysis
Fourteen samples (five from the IHSM-UMA-CSIC collection, and nine from Honduras and
Guatemala) with no amplification using the primes AChR1/AChF1 were amplified with matK
universal markers and sequenced. Sequencing results were aligned and the positions used to
design AChF1 and AChR1 were analyzed manually. All of them did not share any of the two
variants but a T and a C instead, like the rest of the species used in the previous alignment
(Larranaga & Hormaza 2015, chapter 1). In addition, five samples from Honduras and
Guatemala that showed an amplicon with the set of primers AChF1/AChR1 were also
amplified and sequenced with matK universal primers and analyzed in the same positions: all
of them showed a C and an A respectively.
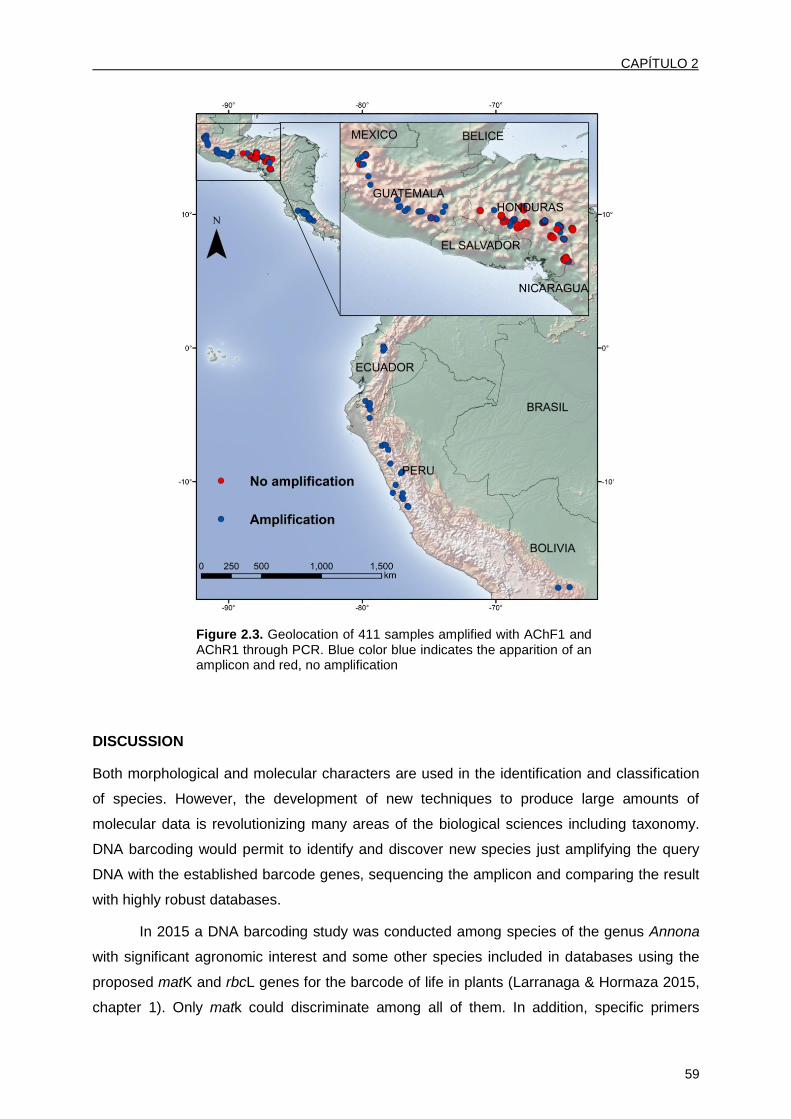
CAPÍTULO 2
59
Figure 2.3. Geolocation of 411 samples amplified with AChF1 and AChR1 through PCR. Blue color blue indicates the apparition of an amplicon and red, no amplification
DISCUSSION
Both morphological and molecular characters are used in the identification and classification
of species. However, the development of new techniques to produce large amounts of
molecular data is revolutionizing many areas of the biological sciences including taxonomy.
DNA barcoding would permit to identify and discover new species just amplifying the query
DNA with the established barcode genes, sequencing the amplicon and comparing the result
with highly robust databases.
In 2015 a DNA barcoding study was conducted among species of the genus Annona
with significant agronomic interest and some other species included in databases using the
proposed matK and rbcL genes for the barcode of life in plants (Larranaga & Hormaza 2015,
chapter 1). Only matk could discriminate among all of them. In addition, specific primers

CAPÍTULO 2
60
based on this locus were designed in order to have an even easier tool to recognize these
species by a simple PCR and visualization of a band in an agarose electrophoresis gel. The
presence of a band would indicate that the DNA template belongs to the species it was
designed for or to another species that was not included in the alignment and that could share
the same primers targets. When a genetic variant appears amongst a species its distribution
will depend on the reproductive success of the individuals carrying it, migration, and genetic
drift (Pereira et al. 2008b).
Primers AChF1 and AChR1 were designed using three cherimoya individuals from
three very distant regions (in order to recover as much intraspecific variability as possible):
Spain, Honduras and Peru. The amplification of 296 accessions of the Annona cherimola
world reference collection in Spain with those primers showed that just a few samples (n = 5)
did not show an amplification band. These samples were obtained from a USA collection with
North and South American origin. In addition, 85/250 DNA samples collected in Central
America did also show absence of amplification. A total of 411 samples were mapped
geographically and the results revealed that the samples that did not amplify were mainly
obtained in Honduras (56.2%), followed by Guatemala (12,5%) and Costa Rica (4.1%). This
could indicate a spatial correlation among the presence/absence of the PCR product. The two
Californian accessions with a Bolivian origin that did not amplify could be an indicator of a
very direct exchange between Central America and this South American country although the
possibility of an error in the passport information cannot be excluded.
In order to assess if the non-amplifying samples had missing one or both SNPs,
several samples were amplified with the matK universal primers and their sequences showed
just two haplotypes: genotypes with the two variants (showing amplification) or genotypes
without them (showing absence of amplification). If such pattern is true, the haplotype 1 is
present all over the cherimoya distribution area, while haplotype 2 is characteristic of Central
America, mainly Honduras. These results would support the hypothesis of a Mesoamerican
origin of the species (Larranaga et al. under revision, chapter 4, chapter 5). In addition, the
presence of two genotypes could also indicate a hybrid origin of the species in which each
chloroplast haplotype could derive from different species. Further research could provide
additional information on this hypothesis.
With the aim of finding a global specific marker for A. cherimola, the trnL-F locus from
several species was sequenced, and two shared SNPs among A. cherimola accessions were
used to design a species-specific set of primers. 546 DNA samples were analyzed with a
successful global amplification. Remarkably, several genotypes showed several peaks after a
certain point (after a group of approximately 10 thymines or cytosines) and although this
could be due to sequencing problems we cannot discard having more than one PCR product
CAPÍTULO 2
61
with similar electrophoresis mobility. Pierie et al. (2007) reported an ancient paralogy in the
cpDNA trnL-F region in Annonaceae and, although additional studies would be needed, the
observations made could be the result of the amplification of two copies. The homology
search conducted with the BLAST tool indicate that AChF2 and AChR2 could also amplify A.
pruinosa. Again, since not all species of Annona have been sampled here and their trnL-F
sequences has not been uploaded to GenBank, these new primers could also amplify other
taxonomically close species. In any case, the results obtained provide one marker
(AChF1/AChR1) that seems to be not present in some cherimoya individuals from Central
America, and another marker (AchF2/AChR2) present in all the cherimoya samples analyzed.
Both markers could be useful to discriminate this species from other taxonomically related
Annona species.
62
CAPÍTULO 3

CAPÍTULO 3
63
PHYLOGENETIC STUDY OF THE ATTA SECTION AND CLOSELY RELATED SPECIES IN THE
GENUS ANNONA, ANNONACEAE
ABSTRACT
Cherimoya (Annona cherimola Mill.) belongs to the Atta section of the genus Annona, which
is the type genus of the pantropical basal angiosperm family Annonaceae. However, while
most of the species in the Atta section are known to be native to Central America and the
Caribbean, the origin of the cherimoya is still under discussion. In this paper, a phylogenetic
study of this species and some of its taxonomically closest species in the Annonaceae is
carried out using five fragments of different coding and non-coding chloroplast regions.
Results did not show monophyly of the Atta section. Nevertheless, a common ancestor was
shared among species belonging to Atta and neighboring sections. A. cherimola samples
from 10 different countries showed a modest structure having at the base of the clade some
of the Mesoamerican samples. In addition, this species seems to be especially close to A.
pruinosa. Neighbour joining trees using the model kimura 2 parameters, maximum likelihood
and bayesian trees were constructed for the alignment of each five loci and all possible
concatenations.
INTRODUCTION
The Annonnaceae is the largest family in the early-divergent Magnoliid clade of angiosperms
with approximately 108 genera and 2400 species (Chatrou et al. 2012). It shows a pantropical
distribution and is about 82-98 Myr old (Richardson et al. 2004; Scharaschkin & Doyle 2005;
Su & Saunders 2009). A limited number of species, belonging to just two genera [Annona and
Asimina, since Rollinia has recently been included in the Annona genus (Rainer 2007)],
produce edible fruits. Most of them are included in the genus Annona [Annona cherimola
(cherimoya), A. squamosa (sugar apple), A. muricata (soursop), the hybrid among A.
cherimola and A. squamosa (atemoya), A. reticulata (custard apple), A. diversifolia (ilama), A.
glabra (pond apple), A. purpurea (soncoya) and one in Asimina [Asimina triloba (pawpaw)],
the only species in the family adapted to temperate climates. Different palynological,
morphological (Doyle & Le Thomas, 1994; 1996), and molecular phylogenetic studies have
been conducted in this family. The latter includes mainly chloroplast sequences: rbcL, matK,
ndhF, trnL, trnT-L, trnL-F, trnS-G, atpB-rbcL, trnH-psbA, ycf1, rpl32-trnL, or ndhF-rpl32
(Chatrou et al. 2012, Richardson et al. 2004, Mols et al. 2004, Pirie et al. 2005, Erkens et al.
2012, Thomas et al. 2012b, Chaowasku et al. 2014).

CAPÍTULO 3
64
The Annona genus described by Safford (1914), which includes about 162 species
(Chatrou et al. 2012) and is distributed mainly in tropical America with a few species native to
Africa, was first named by Linnaeus (Linnaeus 1737) and it could have emerged during the
Miocene (Richardsson et al. 2004; Su & Saunders 2009). In addition to chloroplast DNA
analyses, additional molecular studies have been carried out in Annona mainly for
fingerprinting and genetic diversity studies; those include isozymes (Ellstrand & Lee 1987;
Pascual et al. 1993; Perfectti & Pascual 1998a, 2004, 2005), randomly amplified polymorphic
DNA (RAPDs) (Ronning et al. 1995), amplified fragment length polymorphism (AFLPs)
(Rahman et al. 1998) and, more recently, microsatellites (Escribano et al. 2004, 2007, 2008a,
2008b; Pereira et al. 2008a; van Zonneveld et al. 2012) but also microsatellite flanking
regions for phylogenetic analyses (Chatrou et al. 2009). Safford (1914) divided this genus in 5
groups and 14 section whereas Fries (1959) reorganized it into 17 sections. The last included
12 species in the Atta section: Annona acutifolia Saff. Ex R.E.FR., A. cherimola Mill., A.
cubensis R. E. Fr., A. frutescens R. E. Fr., A. longiflora S. Wats., A. micrantha Bertero ex
Spreng, A. palmeri Saff., A. praetermisa Fawc. & Rendle, A. primigenia Standl. & Steyerm.,
A. reticulata L., A. squamosa L. and A. urbaniana R. E. Fr. A. acutifolia and A. micrantha are
currently considered as a synonymous of A. cherimola and A. reticulata respectively (Rainer
& Chatrou 2016). Annona pruinosa, described more recently (Schatz 1992), has also been
included in this section. According to the dichotomous key of Fries (1959) sections Pillanona,
Chelenocarpus and Ilama would be the closest to Atta. Most of these species are native to
Central America and Caribbean countries although they have been naturalized and cultivated
in other parts of the world.
The main aim of this phylogenetic study, based on chloroplast sequences, was to
analyze the monophyly of the Atta section, with a special focus on A. cherimola. A. cherimola
is a semi domesticated fruit tree species distributed mainly in tropical and subtropical America
in altitudes above 900-1000 masl, where the commercial and agronomic management of
cherimoya is limited. However, it is also cultivated in some countries with temperate climates
like USA, Spain or Australia. The fruit is normally consumed fresh although it is also being
used for the production of ice-creams, shakes or yogurts. The center of origin of the species
has been generally set in South America, specifically in the interandean valleys of Northern
Peru and Southern Ecuador. However, a recent study has demonstrated that higher
molecular diversity values based on microsatellites markers are obtained in Mesoamerica
(Larranaga et al. under revision, chapter 4). This fact could be pointing to this area as the
center of origin of the species, which has also been defended by other authors (Pozorski &
Pozorski 1997).

CAPÍTULO 3
65
In order to have a clearer picture of the phylogenetic relationships between cherimoya
and genetically close species in the Annonaceae, we studied in detail five fragments of
different coding and non-coding chloroplast regions. Two phylogenetic approaches were
applied: maximum likelihood and bayesian analysis. In addition, neighbor joining trees with
kimura 2 parameters model were also constructed for the same set of data.
MATERIALS AND METHODS
Taxon Sampling
Leaves from 46 Annona trees belonging to 17 species [Annona cherimola Mill. (13 samples),
A. conica (Ruiz & Pav. ex G. Don) Westra (1 sample), A. emarginata (Schltdl.) H. Rainer (3
samples), A. glabra L. (2 samples), A. liebmanniana Baill. (2 samples), A. longiflora S.
Watson (2 samples), A. macroprophyllata Donn. Sm. (2 samples), A. montana Macfad. (2
samples), A. muricata L. (2 samples), A. neosalicifolia H. Rainer (3 samples), A. pittieri Donn.
Sm. (3 samples), A. pruinosa G. E. Schatz (2 samples), A. purpurea Moc. &Sessé ex Dunal
(2 samples), A. rensoniana (Standl.) H. Rainer (2 samples), A. reticulata L. (2 samples), A.
senegalensis Pers. (1 sample), A. squamosa L. (2 samples)] were collected. Five of those
species (A. cherimola, A. longiflora, A. pruinosa, A. reticulata and A. squamosa) are included
in the Atta section (Fries 1959) of the Annona genus. The materials were either collected from
the wild or from an ex situ Annona germplasm collection maintained at the IHSM-UMA-CSIC
in Málaga (Spain), at latitude 36º45’N, longitude 4º4’ W and altitude 35 masl. Their
geographic origin and codes are described in Table 3.1. All trees sampled were previously
identified using morphological characters. As outgroups GenBank sequences of Annickia
pilosa (Annonaceae) were downloaded and its codes are also indicated in Table 3.1.
DNA extraction, amplification and sequencing
Plant DNA extraction was performed from 50 mg of young leaf tissues by a modified CTAB
method (Viruel & Hormaza 2004). Each PCR reaction, carried out in an I-cycler (Bio-Rad
Laboratories, Hercules, CA, USA) thermocycler, contained 16 mM (NH4)2SO4, 67 mM Tris-
ClH pH 8.8, 0.01% Tween-20, 3 mM MgCl2, 0.1 mM each dNTP, 0.3 M each primer, 20 ng
genomic DNA and 1 unit of BioTaqTM DNA polymerase (Bioline, London, UK) in a final volume
of 30 l. Universal primers used to amplify rbcL were rbcLaF and rbcLaR, for matK
MatK_1RKim-f and MatK_3FKim-r and for trnH-psbA psbA3-f and trnHf_05 (Kuzmina &
Ivanova 2011). For rbcL the temperature profile was: an initial step of 4 min at 95ºC, 5 cycles
of 30 s at 94ºC, 1 min at 55ºC and 1 min at 72ºC, 30 cycles of 30 s at 94ºC, 1 min at 54ºC
and 1 min at 72ºC and a final step of 10 min at 72ºC. For matK the temperature profile was:

CAPÍTULO 3
66
an initial step of 1 min at 94ºC, 35 cycles of 30 s at 94ºC, 20 s at 52ºC and 50 s at 72ºC and a
final step of 5 min at 72ºC. For trnH-psbA the temperature profile was: an initial step of 4 min
at 95ºC, 35 cycles of 30 s at 94ºC, 1 min at 55ºC and 1 min at 72ºC, and a final step of 10 min
at 72ºC. For intron trnL and ndhF, the universal primers c and d published in Taberlet et al.
(1991) and 972 and 2110 published in Olmstead and Sweere (1994) were used, respectively,
with the following temperature profile: an initial step of 1 min at 94ºC, 35 cycles of 30 s at
94ºC, 30 s at 55ºC and 1 min at 72ºC, and a final step of 5 min at 72ºC. Prior to sequencing,
3l PCR solutions were visualized in 1% agarose gels stained with Gel Red (1X) and the rest
purified with NucleoSpin® Extract II (Macherey-Nagel). Sequencing was done by the
fluorescent dye terminator sequencing method (Macrogen). New DNA sequences generated
for this study were uploaded to GenBank and their accession numbers indicated in Table 3.1.
Table 3.1. Information of the plant material used.
Species Country of origin
Code Section (Fries 1959)
matk (genbank)
rbcL (genbank)
ndhF (genbank)
intronL (genbank)
trnH-psbA (genbank)
A. cherimola Mill.
Mexico (BC) Ache1_mex
Atta
KX663840 KX663878 KX663916 KX663962 KX664007
Honduras (BC) Ache2_hon KX663841 KX663879 KX663917 KX663963 KX664008
Honduras (W) Ache3_hon KX663842 KX663880 KX663918 KX663964 KX664009
Guatemala (W) Ache4_gua KX663843 KX663881 KX663919 KX663965 KX664010
Costa Rica (W) Ache5_cr KX663844 KX663882 KX663920 KX663966 KX664011
Colombia (BC) Ache6_col KX663845 KX663883 KX663921 KX663967 KX664012
Ecuador-Norte (BC)
Ache7_ecu KX663846 KX663884 KX663922 KX663968 KX664013
Ecuador-Sur (BC)
Ache8_ecu KX663847 KX663885 KX663923 KX663969 KX664014
Peru-Norte (BC)
Ache9_per KX663848 KX663886 KX663924 KX663970 KX664015
Peru-Sur (BC) Ache10_per KX663849 KX663887 KX663925 KX663971 KX664016
Bolivia (BC) Ache11_per KX663850 KX663888 KX663926 KX663972 KX664017
Madeira (BC) Ache12_mad KX663851 KX663889 KX663927 KX663973 -
España (BC) Ache13_spa KM068846 KM068867 KX663928 KX663974 KX664018
A. reticulata L. Honduras (W) Aret1_hon
Atta KM068850 KM068871 KX663929 KX663975 KX664019
Costa Rica (W) Aret2_cr KX663852 KX663890 KX663930 KX663976 KX664020
A. squamosa L. Unknown (BC) Asqu1
Atta KM068853 KM068874 KX663931 KX663977 KX664021
Honduras (BC) Asqu2_hon KM068854 KM068875 KX663932 KX663978 KX664022
A. macrophrophyllata Donn. Sm.
Honduras (BC) Amac1_hon Ilama
KX663853 KX663891 KX663933 KX663979 KX664023
Guatemala (W) Amac2_gua KM068860 KM068881 KX663934 KX663980 KX664024
A. liebmaniana Baill.
Honduras (W) Alie1_hon Chalenocarpus
KX663854 KX663892 KX663935 KX663981 KX664025
Honduras (W) Alie2_hon KX663855 KX663893 KX663936 KX663982 KX664026
A. longiflora S. Watson
Mexico (W) Alon1_mex Atta
KX663856 KX663894 KX663937 KX663983 KX664027
Mexico (W) Alon2_mex KX663857 KX663895 KX663938 KX663984 KX664028

CAPÍTULO 3
67
A. pittieri Donn. Sm.
Costa Rica (W) Apit1_cr
Chalenocarpus
KX663858 KX663896 KX663939 KX663985 KX664029
Costa Rica (W) Apit2_cr KX663859 KX663897 KX663940 KX663986 <200pb
Costa Rica (W) Apit3_cr KX663860 KX663898 KX663941 KX663987 <200pb
A. pruinosa G. E. Schatz
Costa Rica (W) Apru2_cr Atta
KX663861 KX663899 KX663942 KX663988 KX664030
Costa Rica (W) Apru3_cr KX663862 KX663900 KX663943 KX663989 KX664031
A. purpurea Moc. & Sessé ex Dunal
Honduras (W) Apur1_hon Uloterpus
KM068864 KM068885 KX663944 KX663990 KX664032
Costa Rica (W) Apur2_cr KM068866 KM068887 KX663945 KX663991 KX664033
A. muricata L. Ecuador (BC) Amur1_ecu
Annona KX663863 KX663901 KX663946 - KX664034
Honduras (W) Amur2_hon KX663864 KX663902 KX663947 KX663992 KX664035
A. rensoniana (Standl.) H. Rainer
Honduras (W) Aren1_hon Former Rollinia (Rainer 2007)
KX663865 KX663903 KX663948 KX663993 KX664036
Honduras (W) Aren2_hon KX663866 KX663904 KX663949 KX663994 KX664037
A. montana Mcfad.
Unkown (BC) Amon1 Annona
KX663867 KX663905 KX663950 KX663995 KX664038
Unkown (BC) Amon2 KX663868 KX663906 KX663951 KX663996 KX664039
A. glabra L. Unkown (BC) Agla1
Phelloxylon KX663869 KX663907 KX663952 KX663997 KX664040
Honduras (W) Agla2_hon KM068862 KM068883 KX663953 KX663998 KX664041
A. senegalensis Pers.
Unknown (BC) Asen1 Helogenia KX663870 KX663908 KX663954 KX663999 <200pb
A. conica (Ruiz & Pav. ex G. Don) Westra
Unknown (BC) Acon1
Former Raimondia (Rainer & Chatrou 2016)
KX663871 KX663909 KX663955 KX664000 KX664042
A. neosalicifolia H.Rainer
Paraguay (BC) Aneo1_par
Former Rollinia (Rainer 2007)
KX663872 KX663910 KX663956 KX664001 KX664043
Paraguay (BC) Aneo2_par KX663873 KX663911 KX663957 KX664002 KX664044
Paraguay (BC) Aneo3_par KX663874 KX663912 KX663958 KX664003 KX664045
A emarginata (Schltdl.) H. Rainer
Paraguay (BC) Aema1_par Former Rollinia (Rainer 2007)
KX663875 KX663913 KX663959 KX664004 KX664046
Paraguay (BC) Aema2_par KX663876 KX663914 KX663960 KX664005 KX664047
Paraguay (BC) Aema3_par KX663877 KX663915 KX663961 KX664006 KX664048
A. pilosa (Exell) Setten & Maas
AY743488 AY743450 AY841402 AY743469 AY841444
Table 3.2. DNA chloroplast genes final alignments (not including the outgroup).
number of individuals
coding region
number of characters
number of variable characters
percentage of variable characters
Model of substitution (jModelTest)
matK 46 yes 813 91 11.2 HKY + G
rbcL 46 yes 522 33 6.32 SYM + I
ndhF 46 yes 445 93 20.9 GTR + G
intronL 45 no 268 48 17.91 GTR + G
trnH-psbA 45 no 233 57 24.46 HKY + G

CAPÍTULO 3
68
Phylogenetic Analysis
MAFFT (Multiple Alignment using Fast Fourier Transform) (Katoh et al. 2002) was used for
performing multiple alignments. Subsequence manual refinements and concatenation of
genes were carried out with the Mesquite 3.01 program (Maddison & Maddison 2014). All
possible concatenations were constructed and the last alignment performed with MAFFT.
Neighbor joining clustering algorithm using Kimura´s 2 parameters model with 1000 bootstrap
replications was performed using Mega 6 (Tamura et al. 2013). The Maximum likelihood (ML)
algorithm implemented in RAxML-HPC2 on XSEDE web-server program available at the
CIPRES portal in San Diego, CA, USA (http://www.phylo.org/sub_sections/portal/) was
utilized (Miller et al. 2010) with all combination matrices. A bootstrap of 1000 replicates was
performed, and the rest of the default parameters established. The jModeltest software was
run with each gene alignment to select the best substitution model (Darriba et al. 2012;
Guindon & Gascuel 2003) for each case. This program was run with 3 substitution schemes.
The Akaike information criterion (AIC) (Akaike 1974) was utilized to choose among models.
Bayesian analyses applied to the concatenated matrices were also conducted. The
alignments were partitioned, matching each partition to each gene when needed, and
different substitution models applied to them. Partitions 1 (matK), and 5 (trnH-psbA) were run
with the model HKY+G, partition 2 (rbcL) was run with SYM + I and partition 3 (ndhF) and 4
(intronL) with GTR+G. Markov chain Monte Carlo (MCMC) runs were extended for 5 million
generations, a burning fraction of 0.25, with trees sampled every 1000 generations. Resulting
trees (bipartitions. and con.tree files in ML and BA respectively) with their bootstrap/posterior
probability values were plotted with FigTree (http://tree.bio.ed.ac.uk/software/figtree/).
RESULTS
The properties of each of the five DNA chloroplast regions final alignments (not including the
outgroup) are shown in Table 3.2. The percentage of variation among the different regions
was quite different. Within the coding regions, rbcL shows the lowest variation whereas ndhF
shows the highest, even higher than the intron trnL. Overall, trnH-psbA showed the highest
level of variation.
A total of 30 alignments (5 of each loci and 25 of concatenations of 2, 3, 4 or 5 genes)
were assembled and three different trees constructed with neighbor joining (NJ), maximum
likelihood (ML) and bayesian analysis (BA). Table 3.3 summarizes the number of nodes with
a bootstrap or posterior probability ≥ 80% (0.8) and the number of monophyletic clades at the
level of species applying the criteria of reciprocal monophyly (Nicolas et al. 2012). With
concatenation number 15 it was not possible to construct a proper NJ tree since two different
sequences were missing and complete deletion removes all sites containing a gap on any
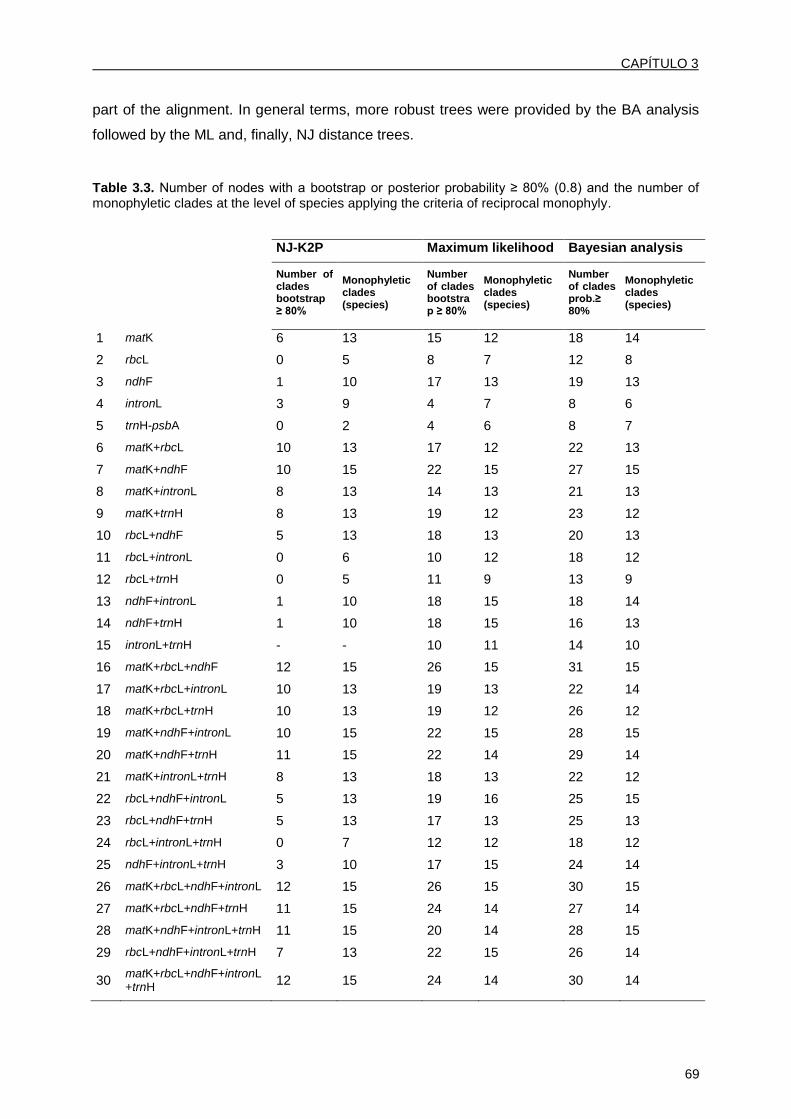
CAPÍTULO 3
69
part of the alignment. In general terms, more robust trees were provided by the BA analysis
followed by the ML and, finally, NJ distance trees.
Table 3.3. Number of nodes with a bootstrap or posterior probability ≥ 80% (0.8) and the number of monophyletic clades at the level of species applying the criteria of reciprocal monophyly.
NJ-K2P Maximum likelihood Bayesian analysis
Number of clades bootstrap ≥ 80%
Monophyletic clades (species)
Number of clades bootstrap ≥ 80%
Monophyletic clades (species)
Number of clades prob.≥ 80%
Monophyletic clades (species)
1 matK 6 13 15 12 18 14
2 rbcL 0 5 8 7 12 8
3 ndhF 1 10 17 13 19 13
4 intronL 3 9 4 7 8 6
5 trnH-psbA 0 2 4 6 8 7
6 matK+rbcL 10 13 17 12 22 13
7 matK+ndhF 10 15 22 15 27 15
8 matK+intronL 8 13 14 13 21 13
9 matK+trnH 8 13 19 12 23 12
10 rbcL+ndhF 5 13 18 13 20 13
11 rbcL+intronL 0 6 10 12 18 12
12 rbcL+trnH 0 5 11 9 13 9
13 ndhF+intronL 1 10 18 15 18 14
14 ndhF+trnH 1 10 18 15 16 13
15 intronL+trnH - - 10 11 14 10
16 matK+rbcL+ndhF 12 15 26 15 31 15
17 matK+rbcL+intronL 10 13 19 13 22 14
18 matK+rbcL+trnH 10 13 19 12 26 12
19 matK+ndhF+intronL 10 15 22 15 28 15
20 matK+ndhF+trnH 11 15 22 14 29 14
21 matK+intronL+trnH 8 13 18 13 22 12
22 rbcL+ndhF+intronL 5 13 19 16 25 15
23 rbcL+ndhF+trnH 5 13 17 13 25 13
24 rbcL+intronL+trnH 0 7 12 12 18 12
25 ndhF+intronL+trnH 3 10 17 15 24 14
26 matK+rbcL+ndhF+intronL 12 15 26 15 30 15
27 matK+rbcL+ndhF+trnH 11 15 24 14 27 14
28 matK+ndhF+intronL+trnH 11 15 20 14 28 15
29 rbcL+ndhF+intronL+trnH 7 13 22 15 26 14
30 matK+rbcL+ndhF+intronL+trnH
12 15 24 14 30 14
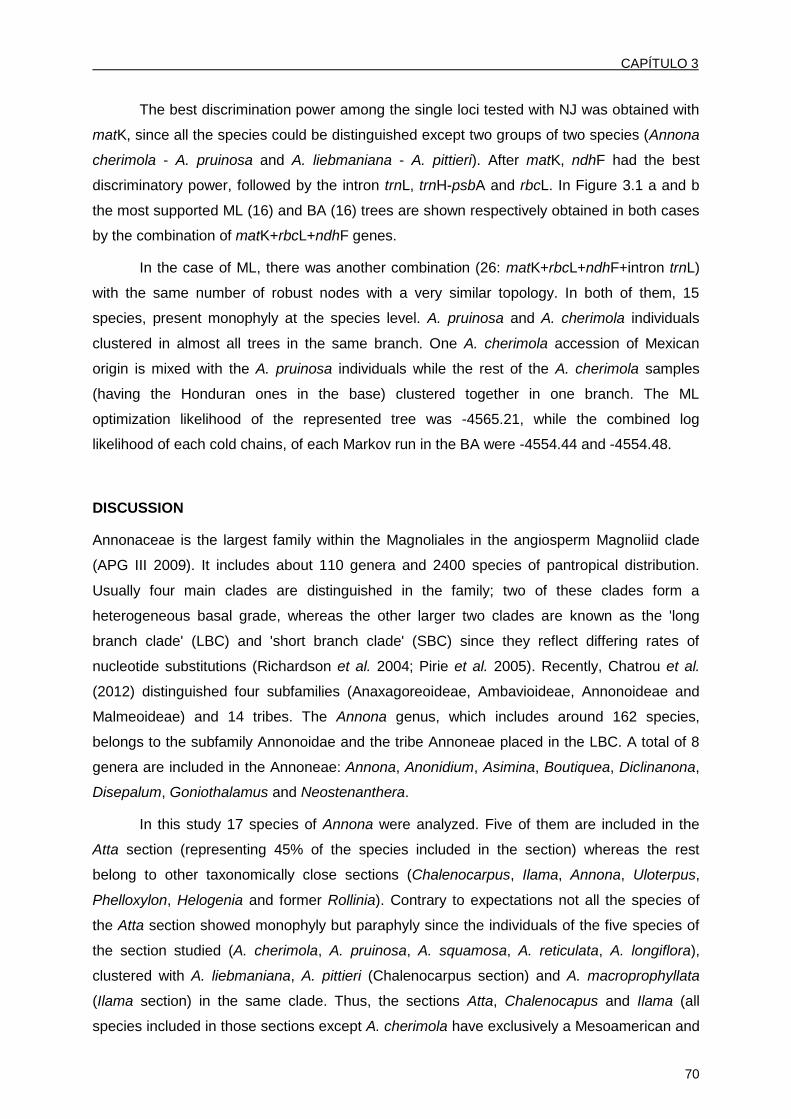
CAPÍTULO 3
70
The best discrimination power among the single loci tested with NJ was obtained with
matK, since all the species could be distinguished except two groups of two species (Annona
cherimola - A. pruinosa and A. liebmaniana - A. pittieri). After matK, ndhF had the best
discriminatory power, followed by the intron trnL, trnH-psbA and rbcL. In Figure 3.1 a and b
the most supported ML (16) and BA (16) trees are shown respectively obtained in both cases
by the combination of matK+rbcL+ndhF genes.
In the case of ML, there was another combination (26: matK+rbcL+ndhF+intron trnL)
with the same number of robust nodes with a very similar topology. In both of them, 15
species, present monophyly at the species level. A. pruinosa and A. cherimola individuals
clustered in almost all trees in the same branch. One A. cherimola accession of Mexican
origin is mixed with the A. pruinosa individuals while the rest of the A. cherimola samples
(having the Honduran ones in the base) clustered together in one branch. The ML
optimization likelihood of the represented tree was -4565.21, while the combined log
likelihood of each cold chains, of each Markov run in the BA were -4554.44 and -4554.48.
DISCUSSION
Annonaceae is the largest family within the Magnoliales in the angiosperm Magnoliid clade
(APG III 2009). It includes about 110 genera and 2400 species of pantropical distribution.
Usually four main clades are distinguished in the family; two of these clades form a
heterogeneous basal grade, whereas the other larger two clades are known as the 'long
branch clade' (LBC) and 'short branch clade' (SBC) since they reflect differing rates of
nucleotide substitutions (Richardson et al. 2004; Pirie et al. 2005). Recently, Chatrou et al.
(2012) distinguished four subfamilies (Anaxagoreoideae, Ambavioideae, Annonoideae and
Malmeoideae) and 14 tribes. The Annona genus, which includes around 162 species,
belongs to the subfamily Annonoidae and the tribe Annoneae placed in the LBC. A total of 8
genera are included in the Annoneae: Annona, Anonidium, Asimina, Boutiquea, Diclinanona,
Disepalum, Goniothalamus and Neostenanthera.
In this study 17 species of Annona were analyzed. Five of them are included in the
Atta section (representing 45% of the species included in the section) whereas the rest
belong to other taxonomically close sections (Chalenocarpus, Ilama, Annona, Uloterpus,
Phelloxylon, Helogenia and former Rollinia). Contrary to expectations not all the species of
the Atta section showed monophyly but paraphyly since the individuals of the five species of
the section studied (A. cherimola, A. pruinosa, A. squamosa, A. reticulata, A. longiflora),
clustered with A. liebmaniana, A. pittieri (Chalenocarpus section) and A. macroprophyllata
(Ilama section) in the same clade. Thus, the sections Atta, Chalenocapus and Ilama (all
species included in those sections except A. cherimola have exclusively a Mesoamerican and

CAPÍTULO 3
71
Caribean natural distribution) seem to define a monophyletic group making necessary a new
arrangement of these sections within the genus based on molecular markers. In order to get
additional information on the debated origin of A. cherimola, 13 individuals of A. cherimola
originating from different geographical areas where included in the analysis. Most authors
have considered the Andean region as the center of origin of the species (Popenoe 1921;
Bonavia et al. 2004) although recent biogeographical studies with SSR markers show higher
genetic diversity values in accessions from Mesoamerican countries supporting the
hypothesis of a Central American origin of A. cherimola. The observation of a monophyletic
group with all species of Central American origin and the way the A. cherimola individuals
clustered are in concordance with results recently obtained based on nuclear molecular
markers (Larranaga et al. under revision, chapter 4).
The A. cherimola and the A. pruinosa individuals analyzed in this work showed to
have a common ancestor. A. pruinosa showed paraphyly since the two representative
individuals of this species and an A. cherimola accession of Mexican origin were at the base
of this branch.This lack of reciprocal monophyly among these two sister species could be due
to a recent diversification since only after sufficient complementary haplotype extinction,
species can be recovered as monophyletic with respect to each other (Kizirian & Donnelly
2004).
Three different approaches have been carried out for the alignment analyses. First NJ
trees with the Kimura 2 parameters model were obtained with all alignments and
concatenations. This method was been widely used in DNA barcoding studies (De Vere et al.
2012; Nicolas et al. 2012, Zhang et al. 2015) for the discrimination/identification among
species, although it has also been criticized (Srivathsan & Meier 2012; Collins & Cruickshank
2013). Recently, Larranaga and Hormaza (2015) showed how matK sequences could
discriminate among 12 different species and polymorphisms were used to design new
specific primers for the 7 most commonly cultivated Annona species. The results obtained in
this work also showed how matK performed the best among the chloroplast regions analyzed,
although two groups of two species (Annona cherimola - A. pruinosa and A. liebmaniana - A.
pittieri) could not be discriminated with this region. After matK, ndhF had the best
discriminatory power, followed by the Intron trnL, trnH-psbA and rbcL. Using this technique,
combinations of 2, 3, 4, and 5 chloroplast regions that included matK and ndhF could
separate 15 out of 17 species, all except A. cherimola and A. pruinosa.

CAPÍTULO 3
72
Fig
ura
3.1
a.
Most sup
port
ed M
L t
ree o
bta
ined b
y t
he c
om
bin
atio
n o
f m
atK
+rb
cL+
ndhF
gen
es.

CAPÍTULO 3
73
Fig
ura
3.1
b. M
ost s
upp
orte
d B
A tre
e o
bta
ined
by th
e c
om
bin
atio
n o
f matK
+rb
cL+
ndhF
gen
es.
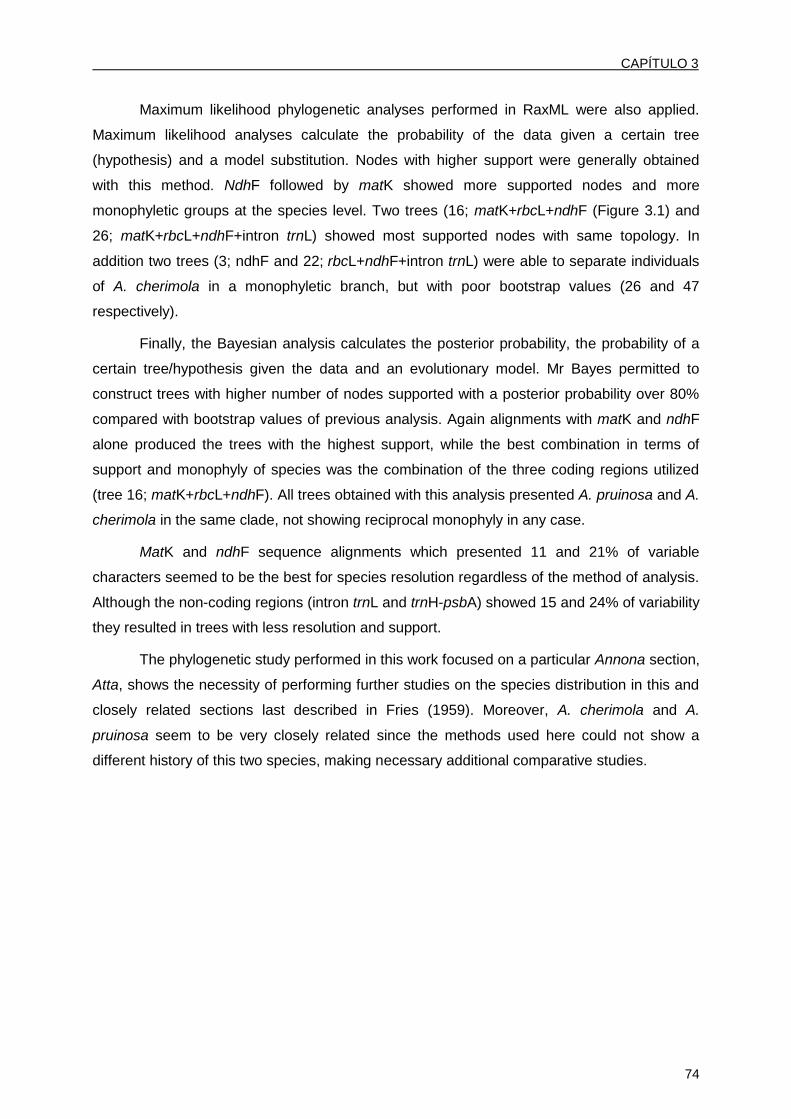
CAPÍTULO 3
74
Maximum likelihood phylogenetic analyses performed in RaxML were also applied.
Maximum likelihood analyses calculate the probability of the data given a certain tree
(hypothesis) and a model substitution. Nodes with higher support were generally obtained
with this method. NdhF followed by matK showed more supported nodes and more
monophyletic groups at the species level. Two trees (16; matK+rbcL+ndhF (Figure 3.1) and
26; matK+rbcL+ndhF+intron trnL) showed most supported nodes with same topology. In
addition two trees (3; ndhF and 22; rbcL+ndhF+intron trnL) were able to separate individuals
of A. cherimola in a monophyletic branch, but with poor bootstrap values (26 and 47
respectively).
Finally, the Bayesian analysis calculates the posterior probability, the probability of a
certain tree/hypothesis given the data and an evolutionary model. Mr Bayes permitted to
construct trees with higher number of nodes supported with a posterior probability over 80%
compared with bootstrap values of previous analysis. Again alignments with matK and ndhF
alone produced the trees with the highest support, while the best combination in terms of
support and monophyly of species was the combination of the three coding regions utilized
(tree 16; matK+rbcL+ndhF). All trees obtained with this analysis presented A. pruinosa and A.
cherimola in the same clade, not showing reciprocal monophyly in any case.
MatK and ndhF sequence alignments which presented 11 and 21% of variable
characters seemed to be the best for species resolution regardless of the method of analysis.
Although the non-coding regions (intron trnL and trnH-psbA) showed 15 and 24% of variability
they resulted in trees with less resolution and support.
The phylogenetic study performed in this work focused on a particular Annona section,
Atta, shows the necessity of performing further studies on the species distribution in this and
closely related sections last described in Fries (1959). Moreover, A. cherimola and A.
pruinosa seem to be very closely related since the methods used here could not show a
different history of this two species, making necessary additional comparative studies.

75
CAPÍTULO 4
CAPÍTULO 4
76
A MESOAMERICAN ORIGIN OF CHERIMOLA (ANNONA CHERIMOLA MILL.).
IMPLICATIONS FOR THE CONSERVATION OF PLANT GENETIC RESOURCES
ABSTRACT
Knowledge on the structure of genetic diversity is a key aspect in order to plan and execute
an efficient conservation and utilization of the genetic resources of any crop. In this work, a
large data set of 1765 accessions of cherimoya (Annona cherimola Mill), an underutilized fruit
tree crop native to the Neotropics and used as a food source by pre-Columbian cultures,
collected along the American continent has been studied with microsatellite markers and
geographic information systems. The fine representation of the spatial distribution and
structure of genetic diversity obtained suggests, contrary to previous reports, a
Mesoamerican origin of the crop with clear implications for the exchange of plant germplasm
between Central and South America in pre-Columbian times. These results together with the
potential distribution of the species in a climatic change context provide new insights for the
conservation of genetic resources of cherimoya and other fruit crops in the Americas.
INTRODUCTION
“There are two things in Lima which all travelers have discussed; the ladies ‘tapadas’, or
concealed in the saya and manta, and a fruit called chilimoya. To my mind the former is as
beautiful as the latter is delicious […]”. These words written by a young Charles Darwin during
the last stopover of the Beagle on the South American continent in Lima (Peru) in 1835 before
heading for the Galapagos islands (Darwin 1835) suggest that at that time the cherimoya
(Annona cherimola Mill.) fruit was well known in the Andean region. That fact together with the
presence of putative wild cherimoya populations in Northern Peru and Southern Ecuador and
archaeological discoveries of ancient vessels resembling cherimoya fruits and seeds have
resulted in the general consideration of the Andean region as the center of origin of the
species (Popenoe 1921; Bonavia et al. 2004). Consequently, most efforts to preserve the
genetic resources of cherimoya have been focused on accessions collected in South America.
However, the possibility that these putative wild cherimoya stands are indeed feral populations
cannot be excluded and, moreover, the archaeological remains of cherimoya-like structures in
South America could actually correspond to a sister species, guanabana (Annona muricata)
(Pozorski & Pozorski 1997). In addition, A. cherimola is the only representative of the Atta
section of Annona growing naturally in South America. The rest of the closely related species
within this clade occur exclusively in Mesoamerica and Southern Mexico. In fact, cherimoya
was surely already present in Central America at least in the seventeenth century (Cobo

CAPÍTULO 4
77
1653). Moreover, different common names are used for A. cherimola in Central and South
America. In South America the crop is known in Spanish as “chirimoya”, a word probably
derived from a quechua word which could mean “cold fruit or seed” (Pozorski & Pozorski
1997; Bonavia et al. 2004). In Central America, the common word for cherimoya and other
closely related species is anona. Interestingly, Linnaeus used the vernacular Central American
designation to name the genus but referred to it as derived from the Latin word “annona” that
can be translated as “the harvest of a year” (Linnaeus 1737).
A clear picture of the structure of genetic diversity is needed for efficient conservation
of the genetic resources of any crop, which is fundamental for guaranteeing food security for
future generations. This is becoming increasingly important in the current scenario of global
climatic change where conserving genomic pools of biological diversity will be critical to
develop cultivars resilient to a wide range of biotic and abiotic stresses. To date, conservation
of plant genetic resources worldwide has been concentrated on a very small group of species.
Thus, from about 7,000 plant species that have been used by humans (Hammer 2003) and
the 2500 that have undergone domestication (Meyer et al. 2012), currently about 30 species
contribute to more than 90% of human nutrition globally, and just three cereals (wheat, rice
and maize) account for about two thirds of human dietary needs (Cassman 1999). Genetic
erosion is even more dramatic in neglected or underutilized species (NUS), such as
cherimoya, many of them present in developing or underdeveloped countries, with great
potential for food and nutrition security (Padulosi et al. 2002).
The cherimoya belongs to the Annonaceae, an extremely diverse family within the
Magnoliales with approximately 110 genera and 2400 species, 900 of them found in the
neotropics (Chatrou et al. 2012). Nowadays this species diversity is mainly conserved in
traditional agricultural systems as backyards and living fences of rural areas, in Central
America, Mexico and South America between 1000 and 3000 masl, with few or non-
management. As other crop of Mesoamerica, it is grown and sold in the local scale and have
not yet undergone intensive selection and large scale cultivation characteristic of modern
agriculture (Miller & Schaal 2005). Propagation among cultivated specimens is mainly
mediated by seeds, vegetative propagation by cutting is very poor except in the few selected
cultivars commercially produced. Cherimoya fruits have excellent organoleptic and nutritive
qualities. Interest in cherimoya and other species of the Annonaceae has increased in recent
years due to the presence of acetogenins, compounds found only in this family with cytotoxic,
antitumor, antimalarial, and pesticide properties (Alaly et al. 1999; Liaw et al. 2011). Spain is
the most important commercial producing country of cherimoyas in the world with about 3,000
has and commercial production is also important near Lima in Peru and in Chile and, to a

CAPÍTULO 4
78
limited extent, in other countries such as Ecuador, Bolivia, Colombia, Portugal, USA, Argentina
or Mexico (Galán Sauco et al. 2014).
van Zonneveld et al. (2012) studied genetic diversity of cherimoya in Ecuador, Peru
and Bolivia using different microsatellite loci. The most diverse spots were located in Southern
Ecuador and Northern Peru. Following Vavilov´s idea that centers of crop diversity indicate
their geographical centers of origin (Dvorak et al. 2011), these results would corroborate the
hypothesis of the origin of the species in the Andean region, taking into account that, as most
NUS and vegetativelly propagated crops in which limited breeding has occurred (Zohary
2004), cultivated cherimoya is probably very few generations separated from its wild
ancestors. In order to test this hypothesis of the center of origin of the species, in this work
those samples previously analyzed from South America were compared with additional
samples collected in Central America, resulting in a final database of 1765 cherimoya samples
analyzed along the American continent. The results obtained from the diversity analyses
together with the potential future distribution in a climate change context will allow the
prioritization of the most vulnerable areas for in situ and ex situ conservation of cherimoya
germplasm and would provide additional information about how this and other crop resources
could have been handled in pre-Columbian times.
MATERIALS AND METHODS
Plant material, DNA extraction and amplification
Leaves from 262 A. cherimola Mill. trees were collected in the highlands (900 to 3000 meters
above sea level) of Guatemala, Honduras and Costa Rica and geopositioned in decimal
grades. Most of the samples were collected in private or community orchards in which usually
no proper tree management was performed while some were collected apparently in a wild
state. The study combined these samples with 1,503 additional DNA samples obtained from
different trees from Ecuador, Peru and Bolivia (van Zonneveld et al. 2012). The geographical
distribution of the 1,765 specimens analyzed is shown in Figure 4.1.
One sample of Annona pittieri from Costa Rica was used as outgroup. DNA extraction
was performed following Viruel and Hormaza (2004). Nine microsatellites previously shown to
be highly informative in A. cherimola (Escribano et al. 2008b; van Zonneveld et al. 2012) were
used: LMCH1, LMCH4, LMCH16, LMCH48, LMCH69, LMCH87, LMCH122, LMCH139 and
LMCH144. Each PCR reaction contained 16 mM (NH4)2SO4, 67 mM Tris-HCl pH 8.8, 0.01%
Tween® 20, 3 mM MgCl2, 0.1 mM of each dNTP, 0.3 µM of each primer, 20 ng of genomic
DNA and 1 unit of BioTaqTM DNA polymerase (Bioline, London, UK) in a final volume of 15 µl.
PCR reactions were carried out in an I-cycler (Bio-Rad Laboratories, Hercules, CA, USA)

CAPÍTULO 4
79
thermocycler using the following temperature program: an initial step of 1 min at 94ºC, 35
cycles of 30 s at 94ºC, 30 s at 55ºC, and 1 min at 72ºC, and a final step of 5 min at 72ºC.
Forward primers were labeled with a fluorescent dye on the 5-end and PCR products were
detected and sized with a Beckman Coulter Genome LabTM
GeXP capillary DNA analysis
system. Samples were denaturalized at 90°C for 120 seconds, injected at 2.0 kV, 30 seconds,
and separated at 6.0 kV for 35 min. A range of samples with the encountered alleles was used
as positive controls, to guarantee size accuracy and to minimize run-to-run variation. Each
PCR reaction and capillary electrophoresis was repeated at least twice to ensure the
reproducibility of the results.
Figure 4.1. Geographic distribution of the 1,765 Annona cherimola samples analyzed in the present study.
Genetic diversity
Calculation of genetic diversity parameters was done using the grid-based procedure
described previously (Thomas et al. 2012a; van Zonneveld et al. 2012). These parameters
were allelic richness per locus, expected and observed heterozygosities, and the Shannon
information index. Grid-based spatial diversity analyses were performed using 10 minute grid
CAPÍTULO 4
80
cells (18 km at the equator) as the unit of analyses. Circular neighborhood of 60 minutes
diameter was applied to every sample in order to achieve a continental work scale assuming
that each genotype is representative for the circular area of the mentioned diameter (111 km
at the equator) around it. This replication exercise resulted in a total of 50,218 data points. The
sample size was set to be equal or superior to the first quartile of the distribution of the
number of trees per grid cell, i.e. 7 trees or 14 gene copies. For each of the retained grid cells
(1,231), genetic diversity parameters were calculated and averaged on bootstrapped
subsamples (without repetition). Calculations were performed in R. ArcMap 10.1 was used to
map and visualize the results and to calculate basic statistics (minimum, maximum, mean and
standard deviation) per parameter. WGS 84 geographical projection was settled, layer with
country boundaries downloaded from the DIVA GIS web page and layer 1:10 Cross-blended
Hypsometric Tints from Natural Earth was used.
Genetic structure
Different approaches were utilized to evaluate the genetic structure of the A. cherimola
samples analyzed along the American continent. First, a rooted neighbor joining tree was
constructed based on the Dice similarity matrix using the software NTSYSpc 2.11 (Exeter
Software, Stauket, N.Y.). The resulting figure was plotted with FigTree
(http://tree.bio.ed.ac.uk/software/figtree/) using different tip colors to differentiate samples from
each country.
Second, the software Structure (Pritchard et al. 2000), which carries a Bayesian
analysis assuming Hardy-Weinberg equilibrium and linkage equilibrium between loci within
populations, was used to determine the number of possible populations and the probability of
each sample belonging to each population. The program was run 5 times, setting K (number
of populations) from 1 to 10 with the admixture model and 5 replications per K. Each run was
implemented with a burn-in period of 20,000 steps followed by 200,000 Monte Carlo Markov
Chain replicates (Pritchard et al. 2010; Martin et al. 2011). Evanno´s (Evanno et al. 2005)
algorithm, in which an ad hoc statistic, K, that estimates the optimal number of populations is
calculated, was applied in order to determine the optimum number of populations.
The R package Adegenet (Jombart 2008)
was also used. It runs the K-means
algorithm for increasing values of K. The classification of each individual into a determinate
cluster was obtained by the Discriminant Analysis of Principal Components (K). Both Structure
and Adegenet samples membership probability for K 1 to 6 was plotted using DISTRUCT
(Rosenberg 2004) ordering samples per country and from North to South.

CAPÍTULO 4
81
Total number of alleles and their sizes were enlisted. In addition, alleles from Central
and South American samples were compared. Finally, alleles of South American samples that
clustered in the Structure and Adegenet (Kmeans + DAPC) results (K=2) with Central America
were also analyzed.
Central American distribution in a context of climate change
The MaxEnt software, which uses maximum entropy modeling to predict the species
geographic distribution on the basis of the species environmental niche (Phillips et al. 2006),
was run. A systematic resampling was executed among the 1,765 samples in order to reduce
the aggregation of presence points (Fourcade et al. 2014). A grid of 2.5% side cell of the total
extension of all data points was constructed and one point per cell selected, resulting in a new
training data set of 46, used to construct the models; 10 different training and test data sets
were obtained to make results more consistent and validate the model. The mean of the area
under the ROC curve (AUC) values for 10 training/test models obtained by cross validation
with the maxent model was compared to 10 null models obtained by the Inverse Distance
Weighted method using same training and test data sets. Background points were resampled
for the construction of both types of models. Current 19 bioclimatic 2.5 minute cell resolution
variables were downloaded from Worldclim (http://www.worldclim.org/). To remove highly
correlated climate variables, a Pearson correlation was carried out following Brown (2014)
eliminating all variables that showed r2 ≥0.8 (Shrestha & Bawa 2014). Thus, 9 variables were
used: Bio1, 2, 3, 5, 12, 14, 15, 18, 19. For future climate projections, the same variables with
the same resolution were used under two scenarios of global climate models of the four
published by the Intergovernmental Panel on Climate Change (IPCC) Fifth Assessment
Report (AR5): Representative Concentration Pathway (RCP) 4.5 and 8.5. RCP 4.5 is a
stabilization scenario in which total radiative forcing is stabilized shortly after 2,100, while RCP
8.5 is characterized by increasing greenhouse gas emissions over time (Wayne 2013). Two
global circulation models, HadGEM2-CC (HG) (Hadley Global Environment Model 2 Carbon
Cycle) (Collins et al. 2011; Shrestha & Bawa 2014)
and MRI-CGCM3 (MG) of the
Meteorological Research Institute (Yukimoto et al. 2012) for the year 2,070, were selected.
Binary current and future projected potential distribution areas were obtained with a maximum
training sensitivity plus specificity threshold (Liu et al. 2005). In order to display the stable,
jeopardized and new areas of cherimoya distribution in Central America and Southern Mexico,
current and future models were overlayered. All operations were done with R using the
following packages: raster (Hijmans & van Etten 2012), dismo (Hijmans et al. 2011), maptools
(Bivand & Lewin-Koh 2015), maptree (White & Gramacy 2012), rgeos (Bivand & Rundel
2015), rJava (Urbanek 2013) and rgdal (Bivand et al. 2014). Resulting maps were displayed

CAPÍTULO 4
82
using the ArcGis 10.1, WGS 84 geographical projection was settled, layered with country
boundaries downloaded from the DIVA GIS web page (www.diva-gis.org) and 1:10 Cross-
blended Hypsometric Tints layer from Natural Earth was used.
RESULTS
Genetic diversity
Genetic diversity parameters measured within the selected 1,231 grids are shown in Figure
4.2. Figure 4.2a shows one of the most used parameters in genetic diversity studies and
conservation genetics, allelic richness (AR), i.e. the average number of alleles per locus
(Foulley & Ollivier 2006) and per grid encountered. This parameter varied from 2.32 to 7.33,
with a mean of 3.62 and standard deviation of 1.18. Figure 4.2b shows the Shanon Index (SI),
which takes into account allele numbers and frequencies (Ernest et al. 2014). Its values varied
from 0.63 to 1.8, with a mean of 1.0 and a standard deviation of 0.29. Expected and Observed
Heterozygosities (He, Ho) are shown in Figure 4.2c and 4.2d respectively. He values varied
from 0.38 to 0.80, with a mean of 0.55 and a standard deviation of 0.11. Ho varied from 0.27
to 0.86, with a mean of 0.54 and a standard deviation of 0.13. In all cases, the grids with the
highest values were located in Honduras and Guatemala and the lowest mainly in Bolivia and
Southern Peru. High levels of heterozygosity are observed in central Peru, near Lima, which
could be due to the presence (and introgression) of the heterogeneous commercially
cultivated variety Cumbe as reported by van Zonneveld et al. (2012).
Genetic structure
The rooted neighbor joining tree constructed with the Dice similarity index is shown in Figure
4.3. It shows a clustering of the samples by geographical origin, differentiating Central from
South American samples. Central American samples presented longer branches indicating
higher distance values. Some samples from Peru clustered near those of Central America,
while the rest appeared mixed in two main groups; one included mainly samples from Ecuador
and Peru and the other from Peru and Bolivia.

CAPÍTULO 4
83
Figure 4.2. Genetic diversity parameters measured within the selected grids after applying circular neighborhood: 2a) Allelic richness, 2b) Shannon index, 2c) Expected heterozygosity, 2d) Observed heterozygosity.

CAPÍTULO 4
84
Assignation of samples to population probabilities provided by one randomly selected
Structure and Kmeans + DPCA result for number of populations (K) = 2, 3, 4, 5 and 6 are
shown in Figure 4.4a and 4.4b respectively. Results from these two approaches are very
similar. For K = 2, samples are divided in two populations (Central and South America)
according to their origin, with the exception of a few samples from Northern Peru. The higher
the number of populations, the more separated in different populations the samples from Peru
are, following, in almost all cases, a geographical north-south pattern. After implementing
Evanno´s algorithm (Evanno et al. 2005) for the Structure results, the highest value of K was
obtained for K = 2 followed by K = 3.
Figure 4.3. Rooted neighbor joining tree based on the similarity matrix obtained using the Dice index with the 1,765 Annona cherimola samples analyzed in the present study.
.
A total of 176 alleles were obtained, of which 172 (97.72%) were present in Central
American samples and 66 (37.5%) in South American samples with 110 and 4 unique alleles
present in the Central and South American samples, respectively. For K = 2, samples

CAPÍTULO 4
85
collected in South America but assigned to the Central American population with a
membership probability above 0.7 with Structure (14 samples) or Adegenet (Kmeans +
Discriminant Analysis of Principal Components) (226 samples) showed 42 and 56 alleles
respectively; this means 63.6% and 84.8% of all the alleles obtained in South American
samples, respectively. Allele sizes are shown in Figure 4.5.
Figure 4.4. Assignation of probabilities of each sample to each cluster provided by one randomly selected 4.4a) Structure and 4.4b) Kmeans + DPCA result for K = 2, 3, 4, 5 and 6. Each accession is represented by a vertical line, its length indicates the probability of belonging to each cluster. Accessions are ordered according to country and latitude from North to South.

CAPÍTULO 4
86
Potential distribution of A. cherimola in Central America in a context of climate change
Potential distribution of stable, jeopardized and new areas for A. cherimola in Central America
and Mexico under current and future climatic conditions are shown in Figure 4.6a (RCP 4.5)
and 4.6b (RCP 8.5) for the HG, and in Figure 4.6c (RCP 4.5) and 4.6d (RCP 8.5) for MG. AUC
values for the null IDW model were already high: 0.92 ± 0.02 but the Maxent AUC results were
even higher 0.97 ± 0.01 meaning this distribution model performed better. Predictions for 2070
using both climate models and two representative concentration pathways were very similar
although more areas seem to be jeopardized when the climate model HG is used compared to
MG. In both cases RCP 8.5 resulted in higher jeopardized areas, since this model assumes
higher emission values and, thus, more intense climate warming. In general terms, A.
cherimola distribution areas are lost in Honduras and eastern Guatemala and the common
areas reduced to higher mountains. Just a few new areas are predicted to be gained: Western
Guatemala, Central Mexico and Costa Rica.
Figure 4.5. Microsatellite allele sizes found in Central American (yellow) and South American (blue) samples.

CAPÍTULO 4
87
Figure 4.6. Potential distribution of stable, jeopardized and new areas for cultivation of A. cherimola in Central America and Mexico under current and future climatic conditions based on the model HG for 6a) RCP 4.5, 6b) RCP 8.5 and MG for 6c) RCP 4.5 and 6d) RCP 8.5.

CAPÍTULO 4
88
DISCUSSION
Genetic diversity studies, especially in NUS in which the extent of germplasm diversity is still
largely unknown and the distribution of that diversity could reflect historical events, are of
great importance for the use and conservation of crop germplasm. In this study, diversity of A.
cherimola in Central and South America was studied with highly polymorphic nuclear DNA
markers to address the origin of this crop. The highest values of diversity are located in
Central America, mainly in Honduras and Guatemala, followed by Costa Rica. The values are
lower in South America where a decrease is observed from Northern Peru both northwards
(Ecuador) and southwards (Southern Peru and Bolivia). Consequently, our results strongly
suggest a Mesoamerican origin of A. cherimola with a secondary center of diversity in the
Andean region of South America.
The analyses of private alleles (alleles found in a single population) showed that all
alleles (except four) present in South America are present in Central America and that a few
samples in Northern Peru represent most of the alleles encountered in South America. Since
those four alleles have size differences of just two bp with other alleles reported, it is possible
that they could be also present in Central America but were not found in the current sampling.
Before a mutant allele is either lost or migrated, it will be a private allele and would be found in
just one of numerous populations in a large collection (Slatkin & Takahata 1985). Szpiech and
Rosenberg (2011) reported that private alleles tend to be found in the tails rather than in the
interior of the allele size distribution. Here, private alleles of Central America are both in the
tails and in the middle of the distribution, which could reflect a limited number of alleles
distributed to South America from Central America.
The population structure results corroborate the hypothesis of cherimoya dispersal
from Central America to Northern Peru and then to the rest of the Andean region, since NJ,
Structure and Adegenet outputs showed that a few samples from Northern Peru are closer to
the Central American samples than any other samples from South America. Structure and
Adegenet outputs showed that the higher the number of populations we assume to have, the
more separated in different populations the samples from South America are, following, in
almost all cases, a geographical north-south pattern. After implementing Evanno´s algorithm
for the Structure results, the highest value of K was obtained for K = 2 followed by K = 3. The
last confirmed previous results (van Zonneveld et al. 2012), since the two populations
described in South America had the same pattern; 1) Ecuador and Northern Peru, 2) Southern
Peru and Bolivia, with the third population being composed of new samples from Central
America. Nevertheless, comparing this new data set, greater differences occur between
Central and South America.

CAPÍTULO 4
89
All those results lead us to hypothesize that the most likely origin of A. cherimola is
Mesoamerica (mainly Guatemala and Honduras) and probably Southern Mexico, although no
samples from the latter area were available for this study. From this area, cultivation of
cherimoya could have moved northwards to Mexico and southwards to Nicaragua and Costa
Rica, using ecological corridors, and to South America, most likely carried by traders in
Neolithic times. Cherimoya germplasm could have reached South America by sea (Wolters
2001) first in Northern Peru from where it was further dispersed north towards Ecuador and
south towards Southern Peru. Andean cherimoya is characterized by high levels of phenotypic
diversity already present in pre-Columbian times (Scheldeman et al. 2003). In contrast, low
phenotypic diversity has been observed in Central America. Therefore Central America, where
most of cherimoya genetic diversity can be found, could be the primary center of origin of
cherimoya. From there, its cultivation was expanded to South America were phenotypic
diversity increased probably due to human selection. The lower genetic diversity observed in
the Andean region would be due to the bottleneck that took place before domestication in that
area due to the absence of wild germplasm. A very similar situation to that shown in this work
has been reported for Phaseolus vulgaris, the common bean, in which a Mesoamerican origin
has also been proposed although most of the current improved varieties have an Andean
origin (Bitocchi et al. 2012; 2013).
Since Northern Peru and Southern Ecuador were assumed to be the areas with the
highest genetic diversity of cherimoya, most efforts to preserve cherimoya genetic resources
both ex situ and in situ have been made following this hypothesis. Thus, the cherimoya
germplasm collection of Spain, the largest in the world with more than 350 accessions, shows
a clear overrepresentation of accessions from Peru, Ecuador and Bolivia compared to few
accessions obtained from Central America. Interestingly, part of the Central American
germplasm could have been indirectly preserved in the cherimoya material bred in California
that probably included genetic material from Southern Mexico (Morton 1987). Regarding the
future potential distribution of the crop, climate change models suggest that A. cherimola will
be driven to higher altitudes sites. Most areas from Honduras and Guatemala, where the most
diverse spots have been located, are predicted to be inadequate for cherimoya by the year
2,070. Consequently, efforts to prioritize conservation of the endangered cherimoya genetic
resources in its area of origin, both ex situ and in situ, should be encouraged before the extant
diversity is lost.
The results obtained in this work strongly suggest a Mesoamerican origin of A.
cherimola and a pre-Columbian movement of plant material (probably seeds) to South
America resulting in a secondary center of diversity in the Andean region. Additional work in
other fruit crops, such as avocado (Persea americana) which seems to be originated and

CAPÍTULO 4
90
domesticated in Central America but that was also present in South America in pre-Columbian
times (Bost et al. 2013), could provide more information on the domestication, cultivation and
germplasm exchange of native American fruit crops in pre-Columbian times.

91
CAPÍTULO 5

CAPÍTULO 5
92
CROP EXCHANGE BEFORE 1492: CHERIMOYA REVEALS PRE-COLUMBIAN
DISPERSAL ROUTES IN THE AMERICAS
ABSTRACT
Dispersion routes of plant genetic resources are of great importance for conservation and
genetic improvement programs, because it shapes their current diversity distribution. Many
crops are known to have been domesticated in the Americas. Most have gone through a wide
domestication process, ending in fixation of morphological traits and, hence, genetic
differences distinguishing domesticated genotypes from their wild progenitors. On the other
hand, tropical fruit tree crops are often not clearly genetically divergent from their progenitors
because of low selection pressure, few cycles if any of genetic improvement, and low
regeneration rates compared annual crops. This is especially the case within neglected and
underutilized native fruit tree crops, several of which lost importance after 1492 with the
introduction of new crops from other continents. In this scenario, one of those neglected and
underutilized crop as Annona cherimola, seems to be a good model to explore the origin and
cultivation of the species as well as provide better insight to crop movement by humans in
pre-Columbian times. In this work, population and landscape genetic tools applied to a
dataset of 1842 cherimoya accessions dataset amplified with microsatellite markers are used
to infer the most likely dispersion routes of the crop from its center of origin in Central
America. Results points out a direct connection among Southeastern Mexico and Northern
Peru/Southern Ecuador.
INTRODUCTION
New archaeological, genetic and geographic techniques offer unprecedented possibilities in
understanding processes of domestication and agricultural origins (Perry et al. 2007; Larson
et al. 2014). Not only does this type of research provide further insights on our human history
and capability of developing food systems but it also helps identifying hotspots of
agrobiodiversity, which are source areas of valuable genetic resources to sustain current and
future agrofood systems around the world. Contemporary geographic patterns of genetic
diversity of any species are the result of past processes such as mutation, migration, genetic
drift and natural and/or human selection. Thus, looking into the current molecular diversity the
history of diversity distribution can be inferred. Genetic diversity analysis also provide support
for the conservation of genetic crop resources, which are essential to select new material and
design breeding programs in order to develop better varieties adapted to biotic and abiotic
stresses.

CAPÍTULO 5
93
In the Americas, at least four centres of agriculture originated independently; Eastern
North America, Mesoamerica, the Andean region and Tropical lowland South America
(Pickersgill 2007; Larson et al. 2014). People from these centres were connected in pre-
Columbian times, as evidenced by the exchange of several crops between North and South
America including maize, beans, cocoa, and Capsicum peppers as well as metallurgy or
pottery. Molecular studies for maize and bean show how these exchanges expanded
domestication processes and increased crop diversity (Matsuoka et al. 2002; Vigouroux et al.
2008; Bittocchi et al. 2012, 2013). However, pre-Columbian crop and human dispersal routes
remain poorly understood.
Fruit trees are an important part of traditional food systems in tropical America. Most
fruit trees are often not clearly genetically divergent from their progenitors because of low
selection pressure and low regeneration rates compared to annual crops. Some of the
neglected and underutilized species (NUS) in the Americas which were more important for
humans in the past could, in addition, provide some information about their incipiently
domesticated or semi-domesticated state (Clement 1999) as well as their initial dispersion
footprints. Because of their close genetic relationship with their ancestor populations, we
propose here that neglected and underutilized fruit trees are a good model to explore
agriculture origins and processes of crop domestication and dissemination in Tropical and
Subtropical America.
Cherimoya (A. cherimola Mill.) is one of those American NUS, a subtropical fruit tree
grown from Mexico until Chile, probably in pre-Columbian times. In recent times, it has gained
some commercial importance for fresh and processed fruit consumption in Spain and some
Latin-American countries. In addition, diverse pharmacology properties have been discovered
in this and other species of the Annonaceae (Liaw et al. 2011). The origin and domestication
state of this species is still under discussion. It was generally believed that South America,
and specifically the interandean valleys of Northern Peru and Southern Ecuador, was the
center of origin of cherimoya due to the high phenotypic diversity that this species shows in
this area or the presence of archaeological remains of seeds and ancient vessels resembling
cherimoya fruits (Bonavia et al. 2004; Popenoe 1921). However, recent molecular studies
(Larranaga et al. under revision, chapter 4) suggest that Central America is the region with
the highest genetic diversity from where the species could have dispersed to South America.
This hypothesis is also supported by a phylogenetic study of the section Atta of the
Annonaceae (chapter 3), which places cherimoya in a Mexican-Mesoamerican clade of
Annona species. Thus, an alternative hypothesis suggests a Mesoamerican center of origin
for the species which has also been proposed previously by some authors (Pozorski and
Pozorski 1997) and a pre-Columbian dispersion of the crop to South America. As most

CAPÍTULO 5
94
tropical fruit tree species, cherimoya is a predominantly outcrossing species pollinated by
small beetles mainly of the Nitidulidae family (Gottsberger 1999). Natural seed dispersers,
which could explain current distribution, have not been clearly characterized. Original
dispersers that coevolved with cherimoya and other tropical fruit species like avocado or
mombins (Persea americana Mill., Spondias purpurea L) could have belonged to the
American megafauna that existed until the last Pliocene when they were extinguished. Since
then, humans and, more recently, introduced horses and cattle could have been the main
responsible agents for the dispersion of these species (Janzen & Martin 1982; Barlow 2000).
Figure 5.1. Hypothesis for the cherimoya dispersion.
The objective of this paper is to get further insights on Pre-Columbian crop exchange
and dispersal routes in the Americas using cherimoya as a model species and apply concepts
of population and landscape genetics to test three alternative hypotheses for its dispersion
(Figure 5.1):
Hypothesis i) after the latest glacial period (approximately 110,000 to 12,000 years
ago), cherimoya was dispersed from fragmented refugia of natural cherimoya
populations in Central America and Northern Peru.
Hypothesis ii) cherimoya dispersed from its center of diversity located in Central
America to the Andes after the latest glacial period by humans and/or other animals.
Hypothesis iii) cherimoya was dispersed by sea traders in pre-Columbian times from
Mesoamerica to the Andes.
To our knowledge, this study represents the most extensive molecular study of a new
world fruit tree crop up to date with more than 1,800 georeferenced trees covering all the
cherimoya range in the Americas from Mexico to Bolivia. Cherimoya diversity is mapped to
identify diversity hotspots in its pre-Columbian distribution range. Second, population
differentiation and allele’s composition are analyzed. Third, it is presented a crop dispersal
model to test several alternative dispersal routes from cherimoya´s center of diversity. We

CAPÍTULO 5
95
then analyze how dispersal routes of cherimoya match with those of maize on the basis using
the Panzea maize SSR dataset (www.panzea.org). Finally, it is discussed how the results
provide insights to domestication processes and plant material exchange in Pre-Columbian
America.
MATERIALS AND METHODS
Plant material, DNA extraction and amplification
An Annona cherimola microsatellite dataset, with 1765 different samples, used in Larranaga
et al. (under revision, chapter 4) plus five amplified Colombian samples taken from the IHSM-
UMA-CSIC cherimoya germplasm bank and 72 samples obtained from two cherimoya
collections in Mexico (CITACMEX in Estado de Mexico and a private garden centre in
Michoacan) were used in this work. In all cases, geographic coordinates of the sampled trees
were collected. Its distribution over 7 American countries is shown in Figure 5.2a. Extracted
DNA from the total 1843 geo-referenced cherimoya trees was amplified using 9
microsatellites loci chosen due to their widely dispersion along the cherimoya genome and
their very high polymorphism (Larranaga et al. under revision, chapter 4; van Zonneveld et al.
2012): LMCH1 (CT as the unit repetition unit), LMCH4 (GA), LMCH16 (GA), LMCH48 (GA),
LMCH69 (GA and GT), LMCH87 (GA), LMCH122 (GA), LMCH139 (CT), LMCH144 (CT)
(Escribano et al. 2004, 2008). Fragment sizes were determined using a Beckman Coulter
Genome LabTM GeXP capillary DNA analysis system. For further details of sampling, DNA
extraction and amplification see Larranaga et al. (under revision, chapter 4). Every map figure
was constructed in ArcMap 10.1. Layer with country boundaries was downloaded from the
DIVA GIS web page and layer 1:10 Cross-blended Hypsometric Tints from Natural Earth. In
order to test the simplest scenarios obtained in this work in other species, all samples
obtained from North, Central and South America, and which were previously used by
Vigouroux et al. (2008) were selected from the Panzea SSR maize dataset (panzea.org).
Their distribution is shown in Figure 5.2b.
Geographic patterns of diversity
Maps based on spatial diversity indexes [allelic richness (AR) and expected heterozygosity
(HE)] were obtained following Larranaga et al. (under revision, chapter 4), Thomas et al.
(2012a) and van Zonneveld et al. (2012) for the whole cherimoya data set. The applied
Circular Neighborhood had 60 minutes of diameter and all grids of 10 min side size with more
than 7 trees were taken into account to obtain the different diversity indexes.

CAPÍTULO 5
96
Figure 5.2. Geolocalization of cherimoya (a) and maize (b) accession data set.
Population differentiation and allele analysis
Although population distribution generally does not fit with geopolitical boundaries, here, to
test the structure of the cherimoya data, samples from 9 countries were divided in two groups.
Group 1 was composed by samples from the four Central American countries studied:
Mexico, Guatemala, Honduras and Costa Rica. Group 2 included samples from Colombia,
Ecuador, Northern Peru (NPeru), Southern Peru (SPeru) and Bolivia. Distribution of genetic
diversity was inferred by the analysis of molecular variance (AMOVA) based on the number of
different alleles using the ARLEQUIN software version 3.5.2.2 (Excoffier et al. 2005) and
1000 permutations. Pairwise Fst (Weir and Cockerham 1984) and Rst derived from
(Michalakis & Excoffier 1996) (p<0.05) matrixes for the analysis of differentiation between
defined populations were calculated using the same software and 1000 permutations. Fst
values can be indicative of current gene flow between populations or the recent/ancient
common ancestry (Schwartz et al. 2002).
Number of alleles and number of private alleles per country were calculated with and
without rarefaction with Arlequin software version 3.5.2.2 and ADZE (Szpiech et al. 2008). For
rarefaction, the maximum standardized sample size was set to twice the number of samples
of Guatemala while Colombian samples were not taken into account due to the small number
of samples available.
Dispersal pathways of cherimoya from its center of origin
Least-cost distances among randomly selected 50% of the 10 min cell mid points that include
4 or more trees (median of the trees distribution among cells), were calculated. These
geographic distance matrixes were obtained based on several heterogeneous geographic

CAPÍTULO 5
97
spaces (transition layers) represented as grids of 10min sides storing the data about the
probability or cost of transitioning from one cell to another (van Etten 2011) (Table 5.1). In
addition, two approaches implemented in the packages adegenet and mmod of R to obtain
the Nei´s pairwise Fst (1973) pairwise distances were employed among all mid-point cells
selected. Correlation between the geographic and genetic distance matrixes was calculated
by a Mantel test. The process was repeated 100 times. Averaged correlation, standard
deviation and averaged pvalues of the 100 replicates were recorded. In addition, correlation
with an Euclidian distance matrix (Crow) was also calculated. Average correlation values
were compared by ANOVA and Tukey analysis. All calculations were performed in R using
the following packages; gdistance (van Etten 2015), adegenet (Jombart 2008; Jombart &
Ahmed 2011), dismo (Hijmans et al. 2011), raster (Hijmans & van Etten 2015), ncf (Bjornstad
2013) and mmod (Winter 2012).
Figure 5.3. Variables taken into account for the construction of the different transition layers.

CAPÍTULO 5
98
Table 5.1. Variables and conductance values of the transition layers constructed.
Code Land Darien
Sea Routes N Clima
S Clima
S Trade Routes
M-NP
H-NP
CR-NP
M-NE
H-NE
CR-NE
CR-SP
H-SP
CR-SP
Se
a R
ou
tes
Control1B1 1 - 0 0 0 0 0 0 0 0 0 0 0 0
Control2B1 1 0 0 0 0 0 0 0 0 0 0 0 0 0
Sea1B1 1 0 1 0 0 0 0 0 0 0 0 0 0 0
Sea2B1 1 0 0 1 0 0 0 0 0 0 0 0 0 0
Sea3B1 1 0 0 0 1 0 0 0 0 0 0 0 0 0
Sea4B1 1 0 0 0 0 1 0 0 0 0 0 0 0 0
Sea5B1 1 0 0 0 0 0 1 0 0 0 0 0 0 0
Sea6B1 1 0 0 0 0 0 0 1 0 0 0 0 0 0
Sea7B1 1 0 0 0 0 0 0 0 1 0 0 0 0 0
Sea8B1 1 0 0 0 0 0 0 0 0 1 0 0 0 0
Sea9B1 1 0 0 0 0 0 0 0 0 0 1 0 0 0
Se
a R
ou
tes +
NS
Cli
ma
tic
Control1B2 0 - 0 0 0 0 0 0 0 0 0 0 0 0
Control2B2 0 - 0 0 0 0 0 0 0 0 0 1 1 0
Control3B2 0 0 0 0 0 0 0 0 0 0 0 1 1 0
Sea1B2 0 0 1 0 0 0 0 0 0 0 0 1 1 0
Sea2B2 0 0 0 1 0 0 0 0 0 0 0 1 1 0
Sea3B2 0 0 0 0 1 0 0 0 0 0 0 1 1 0
Sea4B2 0 0 0 0 0 1 0 0 0 0 0 1 1 0
Sea5B2 0 0 0 0 0 0 1 0 0 0 0 1 1 0
Sea6B2 0 0 0 0 0 0 0 1 0 0 0 1 1 0
Sea7B2 0 0 0 0 0 0 0 0 1 0 0 1 1 0
Sea8B2 0 0 0 0 0 0 0 0 0 1 0 1 1 0
Sea9B2 0 0 0 0 0 0 0 0 0 0 1 1 1 0
Se
a R
ou
tes +
NS
Cli
ma
tic
+
S T
rad
e R
ou
tes
Control1B3 0 - 0 0 0 0 0 0 0 0 0 1 1 1
Control2B3 0 0 0 0 0 0 0 0 0 0 0 1 1 1
Sea1B3 0 0 1 0 0 0 0 0 0 0 0 1 1 1
Sea2B3 0 0 0 1 0 0 0 0 0 0 0 1 1 1
Sea3B3 0 0 0 0 1 0 0 0 0 0 0 1 1 1
Sea4B3 0 0 0 0 0 1 0 0 0 0 0 1 1 1
Sea5B3 0 0 0 0 0 0 1 0 0 0 0 1 1 1
Sea6B3 0 0 0 0 0 0 0 1 0 0 0 1 1 1
Sea7B3 0 0 0 0 0 0 0 0 1 0 0 1 1 1
Sea8B3 0 0 0 0 0 0 0 0 0 1 0 1 1 1
Sea9B3 0 0 0 0 0 0 0 0 0 0 1 1 1 1
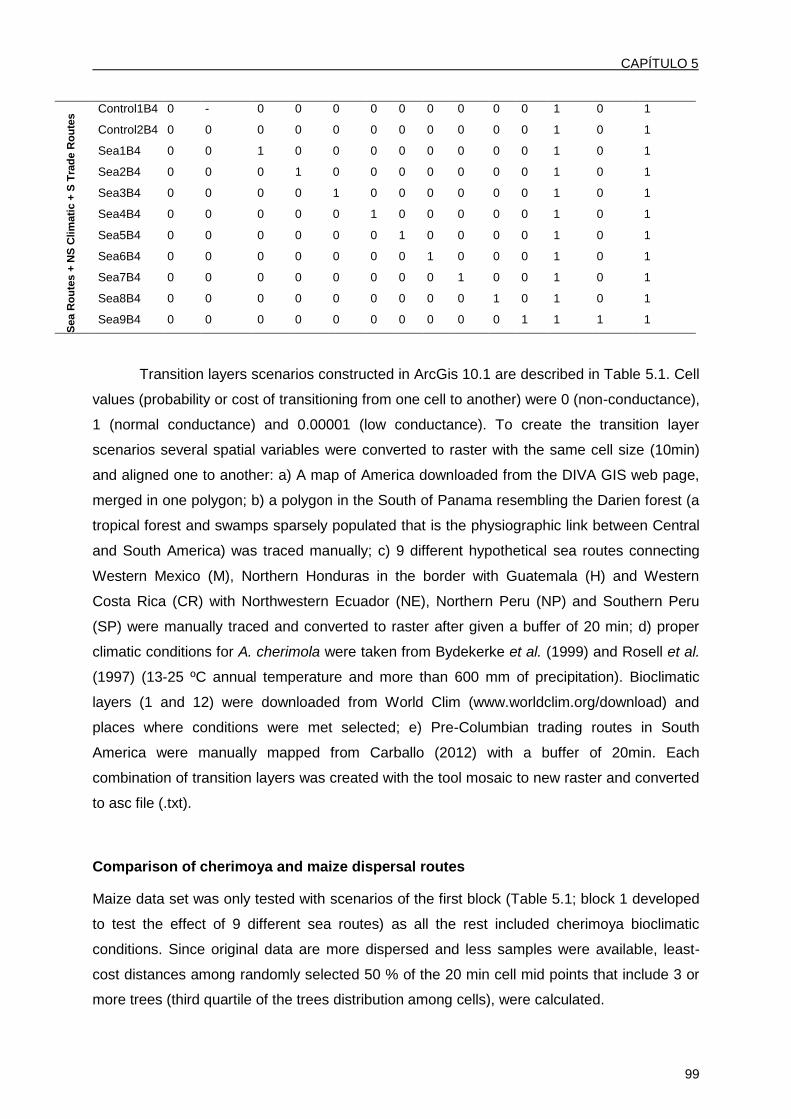
CAPÍTULO 5
99
Sea R
ou
tes +
NS
Clim
ati
c +
S T
rad
e R
ou
tes Control1B4 0 - 0 0 0 0 0 0 0 0 0 1 0 1
Control2B4 0 0 0 0 0 0 0 0 0 0 0 1 0 1
Sea1B4 0 0 1 0 0 0 0 0 0 0 0 1 0 1
Sea2B4 0 0 0 1 0 0 0 0 0 0 0 1 0 1
Sea3B4 0 0 0 0 1 0 0 0 0 0 0 1 0 1
Sea4B4 0 0 0 0 0 1 0 0 0 0 0 1 0 1
Sea5B4 0 0 0 0 0 0 1 0 0 0 0 1 0 1
Sea6B4 0 0 0 0 0 0 0 1 0 0 0 1 0 1
Sea7B4 0 0 0 0 0 0 0 0 1 0 0 1 0 1
Sea8B4 0 0 0 0 0 0 0 0 0 1 0 1 0 1
Sea9B4 0 0 0 0 0 0 0 0 0 0 1 1 1 1
Transition layers scenarios constructed in ArcGis 10.1 are described in Table 5.1. Cell
values (probability or cost of transitioning from one cell to another) were 0 (non-conductance),
1 (normal conductance) and 0.00001 (low conductance). To create the transition layer
scenarios several spatial variables were converted to raster with the same cell size (10min)
and aligned one to another: a) A map of America downloaded from the DIVA GIS web page,
merged in one polygon; b) a polygon in the South of Panama resembling the Darien forest (a
tropical forest and swamps sparsely populated that is the physiographic link between Central
and South America) was traced manually; c) 9 different hypothetical sea routes connecting
Western Mexico (M), Northern Honduras in the border with Guatemala (H) and Western
Costa Rica (CR) with Northwestern Ecuador (NE), Northern Peru (NP) and Southern Peru
(SP) were manually traced and converted to raster after given a buffer of 20 min; d) proper
climatic conditions for A. cherimola were taken from Bydekerke et al. (1999) and Rosell et al.
(1997) (13-25 ºC annual temperature and more than 600 mm of precipitation). Bioclimatic
layers (1 and 12) were downloaded from World Clim (www.worldclim.org/download) and
places where conditions were met selected; e) Pre-Columbian trading routes in South
America were manually mapped from Carballo (2012) with a buffer of 20min. Each
combination of transition layers was created with the tool mosaic to new raster and converted
to asc file (.txt).
Comparison of cherimoya and maize dispersal routes
Maize data set was only tested with scenarios of the first block (Table 5.1; block 1 developed
to test the effect of 9 different sea routes) as all the rest included cherimoya bioclimatic
conditions. Since original data are more dispersed and less samples were available, least-
cost distances among randomly selected 50 % of the 20 min cell mid points that include 3 or
more trees (third quartile of the trees distribution among cells), were calculated.

CAPÍTULO 5
100
RESULTS
Geographic patterns of cherimoya diversity
The highest levels of allelic richness (AR) and expected heterozygosity (EH) corrected by
sampling bias were observed in Central America, more specifically Honduras, and declined in
the surrounding areas in Costa Rica and Mexico and were further reduced in South America
(Figure 5.4, Table 5.2). The lowest values were found in the southernmost margins of the
study range in Bolivia as well as in the five Colombian samples.
Table 5.2. Allelic Richness and Expected Heterozygosity values per country.
Nº Grids
Allelic Richness
Expected Heterozygosity
Average SD Average SD
Mexico 151
3.94 0.7
0.63 0.04
Guatemala 69
6.14 0.36
0.75 0.02
Honduras 98
6.14 1.13
0.73 1.13
Costa Rica 51
3.92 0.16
0.64 0.01
Colombia 2
2.8 0.15
0.48 0
Ecuador 203
3.1 0.19
0.5 0.03
Perú 537
3.34 0.39
0.54 0.06
Bolivia 227 2.61 0.13 0.44 0.04
Of a total of 177 alleles, 175 are present in Central America and Mexico, while 67 are
present in South America. Mexico showed 33% of the total of alleles, Guatemala 60%,
Honduras 90%, Costa Rica 28%, Colombia just 9%, and Ecuador, NPeru, SPeru and Bolivia
32%, 30%, 32% and 22%, respectively. Thus, Central America and Mexico showed 110
alleles not present in South America and just 2 in the other way around. By country, Mexico
had 1 unique allele, Guatemala 13, Honduras 48 and SPeru 1 while the rest is present in
more than one of the populations. Rarefacted allelic richness and private allelic richness is
shown in Figure 5.5. In both cases Honduras and Guatemala show the highest levels, which
do not decrease with increasing number of sampled alleles.
Population differentiation and gene flow
AMOVA results on population differentiation indicate that more diversity is explained between
Central and South American groups than among the different countries within each group
(Table 5.3). The pairwise Fst and Rst matrixes are represented in Figure 5.6 a and b. All p-
values showed significant differences (p<0.05). Values are higher for Rst but relative
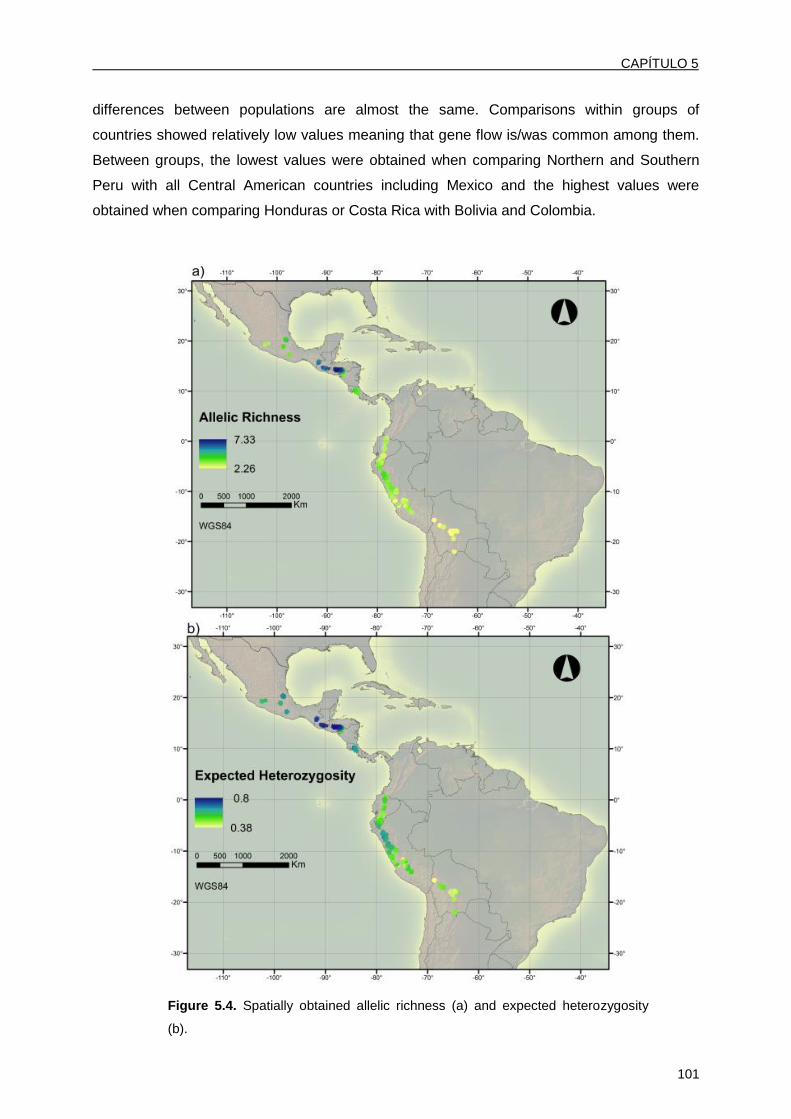
CAPÍTULO 5
101
differences between populations are almost the same. Comparisons within groups of
countries showed relatively low values meaning that gene flow is/was common among them.
Between groups, the lowest values were obtained when comparing Northern and Southern
Peru with all Central American countries including Mexico and the highest values were
obtained when comparing Honduras or Costa Rica with Bolivia and Colombia.
Figure 5.4. Spatially obtained allelic richness (a) and expected heterozygosity
(b).

CAPÍTULO 5
102
Figure 5.5. Allelic richness (a) and private allelic richness (b) with rarefaction obtain within each country accessions. Maximum sample size (86) corresponded to double the smallest population size (Guatemala=43).
Table 5.3. AMOVA results
Source of Variation
d.f. Sum of Squares
Variance Components
Percentage of Variation
F Statistics
p-value
Among Groups
1 510.489 0.3832 11.03 0.19633 <0.001
Among Populations within Groups
7 838.756 0.29918 8.61 0.09675 <0.001
Within Populations
3675 10265.04 2.79321 80.37 0.11025 <0.05
Total 3683 11614.29 3.47558

CAPÍTULO 5
103
Figure 5.6. Pair-wise Fst (a) and Rst (b) among each
country accessions.

CAPÍTULO 5
104
Cherimoya dispersal pathways
Isolation by distance models to test different alternative dispersal routes of cherimoya from its
Central American origin were developed (Fig. 3). The models differ in their geographic
distances, least cost distances with specific transition matrixes for each dispersal scenario
(see method). Mantel test analyses were used to correlate the geographic distances of each
scenario with the genetic distances (Fst implemented in two R packages) in order to identify
the dispersal model that could best explain the contemporary patterns of cherimoya genetic
variation (Figure 5.7). Averaged p values of the Mantel test for 100 repetitions were significant
(<0.05) in almost all cases. One way ANOVA indicated that some of the means were
significantly different (p value <0.05) in each set of correlations and the Tukey test permitted
to compared all pairs of means.
Four different blocks of scenarios were tested taking into account different variables
that could shape current A. cherimola distribution (Table 5.1). Controls of each block
(Control1B1, Control1B2, Control1B3, Control1B4) showed similar values with Crow (distance
as the crow flies; euclidean distance). Significant differences with controls were considered
positive when shown by both sets of correlations (adegenet and mmod):
Block 1 (Sea Routes)
Developed to test the effect of 9 different sea routes. Conductance values in land cells,
except Darien forest, and traced sea routes were 1. Control1B1 and Control2B1 were
constructed as controls. Scenarios Sea1B1, Sea2B1, Sea4B1, Sea5B1, Sea7B1 and
Sea8B1, routes that connected Mexico or Honduras with South America, showed significantly
higher values when compared to Control1B1, same scenario without sea routes or Darien
forest. Sea1B1 and Sea4B1, routes that connected Mexico with NPeru or NEcuador,
respectively, showed the highest values.
Block 2 (Sea Routes + NS Climatic)
Developed to test the effect of 9 different sea routes together with proper climatic conditions
for A. cherimola. Conductance values in land cells (except Darien forest), were almost 0,
(0.00001), to avoid as much as possible but not completely transition among cells, while
proper climatic condition areas and traced sea routes were 1. Control1B2, Control2B2 and
Control3B2 were constructed as controls. Scenarios Sea1B2 to Sea6B2 tested showed
significantly lower differences with Control1B2, scenario with same surface probabilities of
movement without sea routes, Darien forest or proper climatic conditions. Routes connecting
any Central or North American country with SPeru showed no significant differences.
CAPÍTULO 5
105
Block 3 (Sea Routes + NS Climatic + S Trade Routes)
Developed to test the effect of 9 different sea routes, proper climatic conditions for A.
cherimola in the whole continent, and land trade routes in pre-Columbian South America.
Conductance values in land cells, except the Darien forest, were almost 0, 0.00001, to avoid
as much as possible but not completely transition among cells, while proper climatic condition
areas, land SA pre-Columbian trade routes and traced sea routes were 1. Control1B3 and
Control2B3 were constructed as controls. Scenarios Sea1B3 and Sea4B3 (routes that
connected Mexico with NPeru or NEcuador, respectively) showed significantly higher values
compared to Control1B3, same scenario without sea routes or Darien forest.
Block 4: (Sea Routes + N Climatic + S Trade Routes)
Developed to test the effect of 9 different sea routes, proper climatic conditions for cherimoya
north of the Darien forest, and land trade routes in pre-Columbian South America.
Conductance values in land cells, except the Darien forest, were almost 0, 0.00001, to avoid
as much as possible but not completely transition among cells, while proper climatic condition
areas Northern Darien, land SA pre-Columbian trade routes and traced sea routes were 1.
Control1B4 and Control2B4 were constructed as controls. All results in this block were
significantly lower compared to the control.
Comparison between maize and cherimoya dispersal routes
In the case of maize, just the first block of scenarios was tested and the results obtained are
shown in Figure 5.8. Similarly to cherimoya, averaged p values of the Mantel test for 100
repetitions were significant (<0.05) in all cases. The one way ANOVA indicated that some of
the means were significantly different (p value <0.05) in both sets of correlations and the
Tukey test permitted to compared all pair of means. Control1B1 showed similar values with
Crow. All correlation values were lower than the control1B1, showing significant differences
except the routes that connected Central America with Northern Ecuador.

CAPÍTULO 5
106
Figure 5.7. In the X axis each scenario is represented. Y axis corresponds to averaged Mantel correlation values and its standard deviation between genetic (Fst implemented in two R packages) and geographic distances (least cost distances under different scenarios) of the cherimoya dataset among 100 repetitions that took randomly 50% of the data that was included in10 min grids with more than the mean of its distribution among all of them.

CAPÍTULO 5
107
Figure 5.8. In the X axis each scenario is represented. Y axis corresponds to averaged Mantel correlation values and its standard deviation between genetic (Fst implemented in two R packages) and geographic distances (least cost distances under different scenarios) of the maize dataset among 100 repetitions that took randomly 50% of the data that was included in 20 min grids with more than the third quartile of its distribution among all of them.
DISCUSSION
The first hypothesis for the cherimoya dispersion that assumes that the species was
dispersed from fragmented refugia of natural cherimoya populations in Central America and
Northern Peru, could be rejected when looking into the shared and private alleles distribution.
Only two private alleles were found exclusively in South America while 110 where
encountered in Central American samples. This supports that cherimoya reached South
America from Central America, maybe through a few individuals, carrying most of the alleles
currently present in the area. Two of the previously 4 private alleles found in South America
(Larranaga et al. under revision, chapter 4) were found in this work to be present in Mexico
further reducing the number of private alleles found in South American samples. If cherimoya
was dispersed over the continent before the last glacial period, which initiated around
110,000 years ago, and stayed in refuges both in Central America and Northern Peru, more
unique alleles would be predictable within the South American samples. Microsatellite
mutation rate is often quoted in the range of 10-3 to 10-4 per locus per generation (Ellegren
2000; Guichoux et al. 2011), which means one mutation per 100 to 1,000 generations. Since
one generation of A. cherimola lasts a minimum of 4-5 years, we could expect that in the last
110,000 years, 275 to 27.5 mutation events would have taken place per locus. Allele sizes
already existing in one population could emerge again after one mutation event being similar

CAPÍTULO 5
108
by state but not by descend (homoplasy). Nevertheless just two private alleles have been
found in South America (NPeru and SPeru) in different loci and, if the step mutation model
(SMM) is assumed, alleles of similar sizes would be expected to have emerged over this
period of time and we would not expect big gaps in the alleles size distribution
The second hypothesis that humans, rodents or other biotic agents dispersed
cherimoya across the continent after the last glacial period from Central America to South
America, can be also rejected looking into the allelic richness, expected heterozygosity, and
Fst/Rst (by country) distribution. Between both continents diversity values does not follow a
continuous decrease from the center of diversity as would be expected if cherimoya was
planted or eaten and germinated along the way. However, within each continent this premise
is met. The addition of 72 samples obtained in Central Mexico did not change previous
reported results where higher values of allelic richness or expected heterozygosity were
located in Mesoamerican countries (Honduras and Guatemala) followed by the rest of
locations in Central America, Mexico and North Peru (Larranaga et al. under revision, chapter
4). The high standard deviation obtained in Honduras seems to be due to the lower values
recorded in the Nicaraguan border, corresponding to samples isolated from the rest in a
mountain range separated by lowlands. Same happens with pairwise Fst/Rst values. The
fixation index (Fst) has been widely used as a population differentiation estimator but its value
is highly dependent on the level of diversity within subpopulations (Hs). Thus, Fst becomes
very small when Hs is large, which could be the case here. Many Fst analogs have been
described since; among them Gst, st, Rst or D. Rst was developed for microsatellites under
the step mutation model (SMM). It does not depend on Hs but when SMM is not always met,
this estimator could not be reliable. In addition it does not perform better that Fst when the
timescale of interest is short and the influence of mutation is then relatively small (Meirmans
& Hedrick 2011; Slatkin 1995). All the alleles studied did meet the SMM since different sizes
among them are pair numbers, with the exception of the allele 157 of the marker LMCH169.
Among each group: Mexico, Guatemala, Honduras and Costa Rica samples, or Ecuador,
NPeru, SPeru and Bolivia values were generally low, and even lower among pairs of
countries geographically closer, pointing to a gene flow connected zone where migration
(dispersion) could have occur in a linear manner. On the other hand, between groups, less
differentiated zones (or sharing the most recent common ancestry) seem to be Northern and
Southern Peru with all Central American countries including Mexico and the opposite among
Honduras or Costa Rica with Bolivia and Colombia. Colombian results must be taken
carefully since just 5 samples were available.
Thus, a model to test the last hypothesis “Cherimoya was dispersed by sea traders in
pre-Columbian times from Mesoamerica to the Andes”, was constructed based on landscape

CAPÍTULO 5
109
genetics tools. The main goal of this approach (Manel et al. 2003, Manel & Holderegger
2013), is to combine the high resolution obtained from molecular information with spatial data
and a variety of statistical methods to evaluate the role that landscape variables play in
shaping genetic diversity and population structure (Storfer et al. 2007). Thus, landscape
genetics integrates more landscape characteristics than beeline distance to give a more
realistic estimate of the effective distance between demes (Holderegger & Wagner 2006).
Four different blocks of different scenarios were tested, taking into account different variables
that could shape current A. cherimola distribution. The isolation-by-distance models (Wright
1943), which best explained the genetic variation indicate that cherimoya travelled from
Mexico to Northern Peru after suffering an important bottleneck. From there it dispersed
northwards and southwards along the interandean valleys. These results are in concordance
with previous observation of allelic richness, expected heterozygosity and allele frequency
distribution as well as Fst/Rst observed values among countries samples. Wolters (2001)
hypothesized the existence of trade routes among Mesoamerica and South America
(Ecuador/Peru) on the basis of resemblance archeological pottery, metallurgy, linguistic or
sea vessels evidences. Thanks to these trade routes many other crops could have also been
exchanged between both areas; those include for example peanut (Arachis hypogaea),
manioc (Manihot esculenta), cacao (Theobroma cacao) or tobacco (Nicotiana tabacum) from
South to North or avocado (Persea americana), pepper (Capsicum annuum), grain
amaranthus (Amaranthus spp.), chayote (Sechium edule) or jimsonweed (Datura
stramonium) the other way round. Here it is provided evidence that the latter was also the
case for cherimoya. Actually, Bitocchi et al. (2012; 2013) reported a Mexican origin of the
common bean (Phaseolus vulgaris) and a bottleneck that dramatically reduced the diversity of
the Andean genepool compared to the Mesoamerican one before two independent
domestication processes took place. In addition, certain populations in the North of Peru-
Ecuador remained genetically closer to some Mexican samples suggesting a migration in
ancient times.
Our results also suggest that after cherimoya`s arrival in Northern Peru, climatic
conditions and trade routes in South America had an important role in the dissemination of
this crop along the South American continent. These results could explain the presence of
trees collected in areas with no proper climatic conditions for growing this crop but located
close to the ancient South American trade routes. The Inca road network adapted to this
model from Carballo (2012) represents the final pre-Columbian manifestation of imperial
trading systems.
In the case of maize a dispersion mediated by pre-Columbian traders along sea routes
does not seem probable. Scenarios taking into account sea routes showed lower correlation

CAPÍTULO 5
110
values when compared with its control (land movement). This species, known to have been
domesticated in Mesoamerica between 9 and 10 thousands of years ago (Matsuoka et al.
2002; Pickersgill 2007; Larson et al. 2014), could have been dispersed and exchange by land
in very early times and accompanied the foundation of great civilizations probably before the
establishment of sea routes.
In short, Annona cherimola could have emerged as species in Central America from
where it would have been dispersed to central Mexico and Costa Rica along natural corridors
probably before the last glacial period when still American megafauna existed. In this area,
high genetic diversity is encountered although there is little evidence of phenotypic diversity
and varietal differentiation. It would have started to be cultivated by humans and from
Southern Mexico a few seeds (probably in different trips) would have been carried to South
America (Ecuador/Peru) where cultivation continued thanks to the existence of proper climatic
conditions and advanced agricultural systems. As a result, high phenotypic variation
appeared (Scheldeman et al. 2003), although the genetic variation decreased considerably;
showing the characteristics of a (semi) domestication paradox. From there it could have been
carried by humans to Colombia or along the Andes to Bolivia where the heterogeneity of the
landscape and the terrace agrosystem developed by pre-incaic cultures permitted to reach
warm temperatures to grow this and other horticultural and fruit tree crops at high altitudes
(National Research Council Panel on Lost Crops of the Incas 1990). A similar situation could
also be shared by other American crops and, thus, this initial model could also help to
understand their dissemination along the continent and cultural exchange among the existing
strong civilizations before the Spanish conquest. Additional work to tune up the model would
include analyzing additional proper climatic conditions, change the number of trees per cells,
include other or more defined routes or the possibility of doing a resampling with the raw data.

111
DISCUSIÓN GENERAL

DISUSIÓN GENERAL
112
Los resultados obtenidos en este trabajo permiten avanzar en el conocimiento de la
distribución y estructura de la diversidad genética a lo largo del continente americano del
chirimoyo (Annona cherimola Mill), una especie infrautilizada y adaptada a climas
subtropicales. En primer lugar se aportan nuevos marcadores para las siete especies del
género con mayor importancia agronómica y un análisis de diferenciación de especies de
este grupo por DNA barcoding que permiten distinguir claramente el chirimoyo de otras
especies cultivadas cercanas genéticamente (capítulo 1 y 2). A su vez, estas especies se
incluyen en el análisis filogenético de 17 especies del género (capítulo 3). Una vez disponible
la metodología para la identificación de las muestras de la especie Annona cherimola se ha
podido establecer la distribución de su diversidad genética desde el extremo norte al extremo
sur de su distribución en el continente americano (capítulo 4). Finalmente, se ha llevado a
cabo un estudio de genética del paisaje que ayuda a entender su dispersión (capítulo 5). Los
resultados obtenidos, además de tener claras implicaciones para la conservación y uso
sostenible de los recursos genéticos de este cultivo, puede ayudar a inferir la región de
origen de esta especie y abren las puertas para llevar a cabo estudios similares en otros
cultivos frutales nativos de Latinoamérica, como el aguacate (Persea americana Mill.).
Origen y dispersión de A. cherimola
El chirimoyo pertenece al género Annona, que habría surgido durante el Mioceno, hace 5 -
23 Ma (Richardsson et al. 2004; Su & Saunders 2009), y éste, a su vez, es parte de la familia
de angiospermas basales Annonaceae. Los resultados obtenidos en este trabajo indican que
esta especie probablemente tuvo su origen en la región centroamericana, donde actualmente
sus parientes más cercanos, pertenecientes también a la sección Atta o similares (Fries
1959), con los que mostró conformar un grupo monofilético (capítulo 3), están distribuidos.
Además, los individuos de Annona cherimola incluidos en este trabajo de filogenia, elaborado
con la secuencia de cinco regiones parciales de loci cloroplastídicos, provenientes de 10
países diferentes (México, Guatemala, Honduras, Costa Rica, Colombia, Ecuador, Perú,
Bolivia, Madeira (Portugal) y España) revelaron una cierta estructura poblacional. En la base
de la rama que incluía a todas ellas, se encontraron las muestras hondureñas y mexicana,
dando a entender que se trata de los individuos que portan un genotipo (para los cinco
marcadores estudiados) más ancestral. Por otro lado, la distribución espacial de diferentes
índices utilizados en la medida de diversidad genética (heterocigosidad esperada,
heterocigosidad observada, índice de Shannon o riqueza alélica) muestran valores más
elevados en la región centroamericana, concretamente en Guatemala y Honduras (capítulos
4 y 5) después de analizar un total de 1.843 accesiones, provenientes de ocho países
diferentes (México, Guatemala, Honduras, Costa Rica, Colombia, Ecuador, Perú y Bolivia),

DISUSIÓN GENERAL
113
con marcadores neutros (tipo microsatélite). La diversidad actual de las especies que se
genera como resultado de mutación, selección natural, deriva genética y flujo genético, se ha
creado, en gran parte, durante tiempos geológicos. Y, por tanto, pese a que centros de
diversidad no necesariamente señalan los centros de origen de las especies, sí nos pueden
dar una idea del “reloj biológico” de sus poblaciones. Así, es razonable pensar que las
poblaciones situadas en Guatemala y Honduras podrían ser las que lleven asentadas más
tiempo. El hecho de que de un total de 177 alelos encontrados en todas las muestras, el
98.9% (175) estén presentes en las muestras centroamericanas y mexicanas (capítulo 5),
pese a que el número de accesiones de esta zona suponen un 18.45% (340 de 1843) del
total muestreado, también apoya esta hipótesis. Sin embargo, ello no necesariamente
significa que estas accesiones no puedan provenir, a su vez, de otras poblaciones
procedentes de lugares de los que no se disponen muestras para su análisis en este estudio
o donde ya no esté presente esta especie.
La dispersión inicial de esta especie por la región central y septentrional de América
pudo haber estado mediada por la megafauna que habitó este continente durante 20 Ma y
que se extinguió hace unos 13.000 años (Barlow 2001). A las especies cuyos frutos tienen
características típicas que se explicarían por interacción con animales extintos, se les llama
anacronismos y tanto el chirimoyo y otras anonáceas como el aguacate pueden ser
consideradas como tales. Se han descrito dos tipos de frutos carnosos cuya dispersión pudo
depender de la megafauna extinta en el pleistoceno: i) entre 4 y 10 cm de diámetro, con
hasta cinco semillas de más de 2 cm de diámetro y ii) mayores a 10 cm de diámetro con más
de cien semillas en su interior (Guimaraes et al. 2008). La chirimoya sería como otros frutos
del género Theobroma, con multiples semillas relativamente grandes. Una vez extinguida la
megafauna americana la dispersión posterior de estas especies dependería principalmente
del ser humano.
Es posible que la civilización maya, que se extendió por buena parte de
Mesoamérica, concretamente en el sureste de México, Guatemala, Belice, El Salvador y
oeste de Honduras, utilizase los recursos genéticos del chirimoyo. Esta civilización, cuyo
progreso se divide en tres etapas; preclásico (2000 AC - 250 DC), clásico (250 - 900DC) y
postclásico (900 - 1524 DC) (Sharer 2012; Osuna 2015) se caracterizaba, entre otras cosas,
por su desarrollada escritura y sistema métrico, observaciones astronómicas y sofisticada
agricultura. De hecho, Lhullier (1981) nombra a la chirimoya o anona (nombre vulgar dado en
la región centroamericana a la A. cherimola y a otras especies cercanas del género) como un
recurso habitual de los pueblos mayas. Es de interés que Linneo utilizase esta denominación
centroamericana para designar al género pero refiriéndose a él como derivado del término
latín “annona” que puede traducirse como “la producción annual de un cultivo” (Linnaeus

DISUSIÓN GENERAL
114
1737). Además de los mayas, otras culturas se desarrollaron también en Mesoamérica
durante tiempos precolombinos. Entre ellas, en el periodo preclásico la Cultura Olmeca en la
Costa del Golfo de México (1.200-500 AC) o Cultura de Izapa en Guatemala (300-100 AC).
En el periodo clásico la Cultura de Teotihuacán, en el centro de México (200 - 650 DC), o
Cultura de Monte Albán en el oeste del territorio (10 - 950 DC) y en el postclásico la Cultura
Tolteca (950 DC - 1250 DC) y Mexica - Tenocha (1325 DC-1519 DC) en el centro; y Mixtecos
en el oeste (1250 DC -1.519 DC) del mismo país norteamericano (Morgado 2007). Varios de
estos pueblos pudieron contribuir a la dispersión de la chirimoya por el continente. Muchas
son las especies que se consideran haber sido domesticadas en la zona Mesoamericana,
desde hace ~7000 años hasta la actualidad, como Zea mays, Cucurbita pepo, Amaranthus
cruentus o varias especies del género Phaseolus (Pickersgill 2007).
La especie Annona cherimola pudo haber empezado a ser recolectada y cultivada por
los pueblos mesoamericanos para, en algún momento, ser trasportada a Sudamérica donde
continuaría su cultivo y diversificación mediada por la actividad humana de las diferentes
civilizaciones Andinas. De hecho, los análisis de estructura genética muestran que unas
pocas accesiones, presentes en el norte de Perú, se agruparían con las accesiones de
Guatemala, Honduras y Costa Rica (capítulo 4). Entre las muestras colectadas en los
diferentes países centroamericanos para el presente estudio, hubo algunas accesiones que
parecían provenir de poblaciones silvestres, mientas que una gran parte de las muestras
provenían de hojas de árboles semi-cultivados (sin apenas manejo o cuidados) en los patios
traseros de la casas o en lindes de zonas rurales. La variación fenotípica observada (no
medida) en la región centroamericana parece ser menor de la que se observa en las zonas
del norte de Perú y sur de Ecuador (Scheldeman, comunicación personal) mientras que
ocurre completamente lo contrario con la diversidad genética analizada (Capítulos 3 y 5). Así,
el chirimoyo encajaría en la descripción de una especie semi-domesticada (Clement 1999),
pues hay poblaciones que difieren en su variación fenotípica de las poblaciones silvestres,
siendo en muchos casos mayor (Sudamérica vs Centroamérica), mientras que la variación
genética va disminuyendo a medida que hay más selección humana (norte de Ecuador
Colombia o sur de Perú y Bolivia). De la misma manera todos los alelos amplificados con los
marcadores microsatélites presentes en Sudamérica (excepto dos) están también presentes
en individuos de las poblaciones de Centroamérica (Capítulo 4 y 5), mientras que tan sólo
uno de los dos haplotipos encontrados en la secuencia matK parece haberse dispersado
desde Honduras, donde aparecen los dos a partes iguales (capítulo 2). Todo esto apunta a
un gran cuello de botella previo a la formación de las poblaciones del sur, como ya ha sido
reportado para otras especies de origen Mesoamericano como Phaseolus vulgaris (Bitochi et
al. 2012, 2013).
DISUSIÓN GENERAL
115
Además de los datos obtenidos a raíz de los marcadores microsatélite, otras
observaciones apuntan a un origen centroamericano de la especie. Así, Annona cherimola
sería la única representante de la sección Atta y especies genéticamente próximas en
América del Sur, ya que el resto de las especies de la sección están naturalmente presentes
solamente en América Central y sur de América del Norte. Por tanto, si asumimos un origen
centroamericano de la especie, las evidencias apuntan a que un pequeño número de
accesiones pudo haber llegado al norte de Perú y dispersado a partir de ahí tanto hacia el
norte (Ecuador y Colombia) como hacia el sur (sur de Perú y Bolivia y, quizás Chile). De
hecho, sería interesante poder estudiar un mayor número de poblaciones colombianas y
chilenas lo más semi-cultivadas posible (para evitar movimientos de material recientes) y
comprobar si siguen el mismo patrón encontrado en este trabajo. Esta hipótesis se
contrapone con la hipótesis hasta la fecha aceptada, de que A. cherimola se habría originado
en los valles interandinos del norte de Perú y sur de Ecuador. Las evidencias que apoyaban
esta hipótesis eran la alta diversidad fenotípica encontrada en estas áreas (Popenoe 1912),
la aparición de cerámicas con la forma de chirimoya en yacimientos arqueológicos de las
culturas Mochica y Chimu (Museo de la Nación 1995), y de semillas que se atribuyen a esta
especie (Bonavia et al. 2004). Así, semillas de A. cherimola se habrían encontrado en la
península de Santa Elena en Ecuador (Berry 1929), en la cueva de los Gavilanes (2700 años
AC), en el valle de Huarmey al sur de Ancash (Museo de la Nación, 1995) o en Ancón (2000
años AC), cerca de Lima (Towle 1961), pero no así en la cueva de Ancash (Guitarrero) que
se ha datado en 8.000 años AC y donde se han descrito restos de otras plantas. A pesar de
que las semillas no pueden ser consideradas como un buen discriminante entre especies de
género Annona ya que son muy parecidas entre especies cercanas (Koek-Noorman 1987) o
que las cerámicas arqueológicas pudieran representar otras especies como A. squamosa
(también de origen centroamericano) o A. muricata (especie de requerimientos más
tropicales de origen todavía incierto), estos datos ponen de manifiesto que la especie pudo
estar presente entre 2000/2700 AC en Sudamérica. Los resultados aquí expuestos señalan
al centro de Perú como el centro de diversificación en América del Sur (capítulos 4 y 5; van
Zonneveld et al. 2012). La llegada del chirimoyo, desde Mesoamérica, pudo haber sido por
mar, posiblemente desde el oeste de México (capítulo 5), aunque no debe descartarse
ninguna otra posibilidad que no haya sido incluida en las nueve rutas testadas en este
trabajo. La existencia de rutas e intercambios entre Ecuador/Perú y México está
documentada en la bibliografía basada en datos arqueológicos, metalúrgicos o lingüísticos
(Wolters 2001; Marcos 2005). Esta vía de dispersión pudo ser también la responsable de la
extensión de otros recursos fitogenéticos por el continente americano en tiempos
precolombinos, no así el maíz, que probablemente se dispersara por tierra con los primeros
intercambios entre las poblaciones humanas (capítulo 5).

DISUSIÓN GENERAL
116
El hecho de utilizar una especie arbórea infrautilizada actualmente en la mayoría de
las áreas dónde ha mostrado más diversidad genética, y semi domesticada, hace que las
accesiones (semi) cultivadas estén separadas por pocas generaciones de sus parientes
silvestres y mantengan una parte intacta de la huella de sus primeros movimientos, lo que es
de gran ayuda para inferir los procesos de migración y flujo genético, que han llevado a la
distribución actual de la diversidad.
Conservación de los recursos de Annona cherimola
La conservación y uso sostenible de los recursos genéticos del chirimoyo en su lugar de
origen es de gran importancia para el mantenimiento de su diversidad y su utilización para
proyectos de mejora genética de la especie en el futuro. Según nuestro conocimiento, sólo
existen dos colecciones de campo, ex situ, de accesiones de chirimoyo y otras anonas en
Mesoamérica, concretamente en los estados de Michoacán y de México (México). En
Guatemala y, especialmente en Honduras, da la sensación de que las frutas de chirimoyo
son un recurso de difícil acceso en las grandes ciudades quedando confinado a las zonas
rurales y donde se ha producido una disminución en la importancia del cultivo dando lugar,
posiblemente, a una significante erosión genética. Hoy en día, el banco de germoplasma de
referencia mundial de esta especie es el situado en el Instituto de Hortofruticultura
Mediterránea y Subtropical La Mayora (IHSM-UMA-CSIC) instituto mixto del Consejo
Superior de Investigaciones Científicas y la Universidad de Málaga, con unas 300 accesiones
de Annona cherimola. De éstas, aproximadamente 2/3 provienen de América del Sur,
principalmente de Perú y Ecuador. De la zona Mesoamericana sólo 6 tienen un origen
mexicano y una costarricense aunque 36 provienen de una colección de California
mantenida en un vivero comercial teniendo, a su vez, posiblemente un origen
centroamericano. Por tanto, existe un sesgo en esta colección de referencia hacia la
sobrerrepresentación en la misma de accesiones sudamericanas debido a la hipótesis
generalmente admitida de un origen sudamericano de la especie. Sería de interés completar
las accesiones del banco con material genético procedente de América Central.
Por otra parte, los modelos de distribución bajo el contexto de las predicciones
actuales de cambio climático, señalan que las áreas en las que ahora se encuentran las
poblaciones más diversas de chirimoyo dejarían de ser propicias para el cultivo de esta
especie (capítulo 4). En este sentido, la especie se vería desplazada a localizaciones más
altas (y por tanto más frías) en su lugar de origen, pudiéndose perder numerosos genotipos
en el proceso. Todo esto, sumado a otras amenazas, incluso más inminentes, como el
cambio de uso de suelo, la fragmentación de hábitats o el aumento de la accesibilidad (van
Zonneveld et al. 2009, Samuel et al. 2013) hacen urgentes los proyectos de conservación,

DISUSIÓN GENERAL
117
tanto in situ como ex situ, en la zona de origen o de máxima diversidad. En una fase
posterior podrían empezarse diversos ensayos de caracterización agronómica para empezar
a seleccionar genotipos de interés adaptados a las diferentes regiones ecológicas de la
región.
Relaciones filogenéticas en el género Annona
En la mayoría de los proyectos relacionados con la conservación y el uso de los recursos
genéticos de plantas, es necesaria una correcta identificación de la especie o especies en
cuestión. En este sentido, el gen matK cloroplastídico es capaz de diferenciar las especies
con mayor interés agronómico del género Annona (A. cherimola, A. reticulata, A. squamosa,
A. muricata, A. macroprophyllata, A. glabra, y A. purpurea), así como otras especies del
género disponibles en la base de datos BOLD (capítulo 1). Conjuntamente, se utilizaron
SNPs presentes en cada una de las siete especies mencionadas para el diseño de
marcadores que permitieran una identificación rápida mediante ausencia o presencia de
banda en gel. Se amplificaron varios individuos de cada una de ellas para captar la mayor
variabilidad genética intraespecífica posible. A pesar de esto último, la aplicación de los
marcadores diseñados de chirimoyo en un gran número de accesiones (546) de esta
especie, provenientes del banco de referencia mundial localizado en el IHSM-UMA-CSIC, y
de recolecciones realizadas en tres países centroamericanos, pusieron de manifiesto la
existencia de dos haplotipos diferentes en cuanto a los SNPs utilizados para el diseño de los
cebadores (capítulo 2). Así, solamente se han encontrado dos combinaciones (presencia o
ausencia) de ambos SNPs; además dichas combinaciones están correlacionadas con la
región geográfica. El haplotipo con los dos SNPs variantes habría sido dispersado desde
Honduras/Guatemala, mientras que el similar al resto de especies estudiadas habría
permanecido principalmente en Mesoamérica. Se reporta un nuevo marcador de chirimoyo
(capítulo 2), basado en el locus trnL-F, capaz de amplificar todas las accesiones estudiadas
pero que también podría hacerlo en la especie Annona pruinosa y otras no incluidas en el
análisis. En este sentido, ninguna de las combinaciones de los cinco genes utilizados en el
capítulo 4 es capaz de diferenciar ni de permitir elaborar una historia evolutiva diferente para
las especies Annona cherimola y Annona pruinosa. De hecho, tanto los dos individuos de
Annona pruinosa como las dos chirimoyas, que agrupan con ellas en la base del clado que
conforman, carecen de los SNPs específicos de chirimoya del gen matK. Una posible
explicación para todo esto, que requeriría de estudios comparativos adicionales, sería el
posible origen híbrido del chirimoyo. Así, algunos linajes del chirimoyo habrían heredado el
ADN del cloroplasto de una especie parental (que podría ser Annona pruinosa) y otros, el de
la otra. Estos resultados podrían explicar las frecuentes anomalías meióticas descritas en

DISUSIÓN GENERAL
118
cruzamientos intraespecíficos e interespecíficos en los que participa A. cherimola (Martín
2013). En este sentido, recientemente, se ha comenzado en el Departamento de Fruticultura
del IHSM-UMA-CSIC un proyecto de secuenciación por Illumina HiSeq de ADN rico en ADN
cloroplastídico de cuatro accesiones de chirimoyo con diferente origen geográfico y una
accesión de A. pruinosa. La obtención de los genomas ensamblados y anotados, usando
como ADN de referencia la secuencia de ADN cloroplastídico de una accesión de chirimoyo
recientemente publicada (Blazier et al. 2016), permitirán profundizar en la relación entre
estas dos especies y algunas de sus variantes geográficas. Finalmente los resultados del
ensayo filogenético (capítulo 3) muestran que las secciones del género Annona, Atta y
cercanas, como Ilama o Chalenocarpus, necesitan ser revisadas puesto que a pesar de estar
englobadas en un mismo clado, no muestran grupos monofiléticos independientes.

119
CONCLUSIONES

CONCLUSIONES
120
1) La secuencia parcial del gen cloroplastídico matK permitió diferenciar 12 especies de
Annona, incluyendo las secuencias de tres individuos con distinto origen geográfico de cada
una de las 7 especies con mayor importancia agronómica y aquellas descargadas de BOLD,
con técnicas de distancia de código de barras de plantas.
2) El alineamiento construido anteriormente con la secuencia matK seleccionada, permitió el
diseño de cebadores para cada una de las 7 especies mencionadas con objeto de poder
diferenciarlas realizando una reacción en cadena de la polimerasa y comprobación de
presencia o ausencia de banda en gel.
3) El marcador de chirimoyo previamente diseñado se utilizó para analizar 546 accesiones, lo
que puso de manifiesto la presencia de dos combinaciones con dos polimorfismos de
nucleótido simple diferentes cada una. Una de ellas estuvo presente únicamente en las
accesiones de la zona centroamericana (principalmente en Honduras) mientras que la otra lo
estuvo también en el resto de lugares de origen de las muestras analizadas.
4) Se diseñó un segundo marcador para la diferenciación de chirimoyo respecto al resto de
especies de interés agronómico basado en la secuencia trnL-F que permitió amplificar
prácticamente todas las accesiones anteriores.
5) Las especies de la sección Atta y cercanas, Chalenocarpus e Ilama, todas (excepto A.
cherimola) con distribución centroamericana, conformaron un grupo monofilético a pesar de
no mostrar reciprocidad monofilética (a nivel de sección), tanto en el árbol de máxima
verosimilitud como en el de inferencia bayesiana construidos a partir del alineamiento de 46
muestras de ADN pertenecientes a 17 especies del género Annona y tres genes
cloroplastídicos codificantes, apuntando a un origen mesoamericano de A. cherimola.
6) Las 13 accesiones de chirimoyo incluidas en el trabajo filogenético se agruparon en un
mismo clado del árbol estando en la base del mismo las muestras hondureñas, mexicana, y
las accesiones de Annona pruinosa, señalando la cercanía de ambas especies y apoyando
el origen mesoamericano del chirimoyo.
7) El estudio de la distribución espacial de la diversidad de Annona cherimola medida con
microsatélites en más de 1800 especímenes a lo largo de todo su área de distribución en el

CONCLUSIONES
121
continente americano, mostró que las zonas de máxima diversidad genética se localizan en
Centroamérica (principalmente Honduras y Guatemala), seguidas, con una disminución
marcada, por el norte de Perú y sur de Ecuador. Este patrón también se reproduce por el
número de alelos total y número de alelos únicos presentes en cada una de las zonas lo que
apoya la hipótesis del origen mesoamericano de la especie.
8) Gran parte de las zonas actuales climáticamente propicias para el crecimiento del
chirimoyo, donde se sitúan las poblaciones más diversas, dejarían de serlo en 50 años, lo
que manifiesta la necesidad de poner en marcha proyectos de conservación de los recursos
genéticos de esta especie en su centro de máxima diversidad, según los modelos de máxima
entropía generados.
9) Los modelos de aislamiento por distancia construidos revelaron que la dispersión desde
Norteamérica/Centroamérica a Sudamérica pudo tener lugar a través de una ruta marítima
entre el suroeste de México y el Norte de Perú. Además, el clima y rutas de comercio
precolombinas parecen tener una clara importancia en la diseminación del cultivo por
América del Sur.
122
BIBLIOGRAFÍA

BIBLIOGRAFÍA
123
Alaly FQ, Liu XX, McLaughlin JL (1999) Annonaceous acetogenins: recent progress. Journal of
Natural Products, 62: 504–540.
Alberts B, Johnson A, Lewis J, Raff M, Roberts K, Walter P (2002) Molecular Biology of the Cell.
4th edition. Garland Science, New York.
Akaike H (1974) A new look at the statistical identification model. IEEE Transactions on Automatic
Control, 19(6): 716-723.
Amar MH, Biswas MK, Zhang Z, Guo WW (2011) Exploitation of SSR, SRAP and CAPS-SNP
markers for genetic diversity of Citrus germplasm collection. Scientia Horticulturae, 128: 220-227.
Amel SH, Mokhtar T, Salwa Z, Jihene H, Messaoud M, Abdelmajid R, Mohamed M (2004) Inter-
simple sequence repeat fingerprints to assess genetic diversity in Tunisian fig (Ficus carica L.)
germplasm. Genetic Resources and Crop Evolution, 51: 269-275.
Amel SH, Khaled C, Messaoud M, Mohamed M, Mokhtar T (2005) Comparative analysis of genetic
diversity in two Tunisian collections of fig cultivars based on random amplified polymorphic DNA and
inter simple sequence repeats fingerprints. Genetic Resources and Crop Evolution, 52: 563-573.
Andrés J, González F, Nieto R, Barrientos AF (2006) Morphometry of the organs of cherimoya
(Annona cherimola Mill.) and analysis of fruit parameters for the characterization of cultivars, and
Mexican germplasm selections. Scientia Horticulturae, 107: 337-346.
APG III (2009) An update of the Angiosperm Phylogeny Group classification for the orders and families
of flowering plants: APG III. Botanical Journal of the Linnean Society, 161: 105–121.
Aubriot X, Lowry PP 2nd, Cruaud C, Couloux A, Haevermans T (2013) DNA barcoding in a
biodiversity hot spot: potential value for the identification of Malagasy Euphorbia L. listed in CITES
Appendices I and II. Molecular Ecology Resources, 13: 57–65.
Baldauf SL (2003) Phylogeny for the faint of heart: a tutorial. Trends in Genetics, 19(6): 345-51.
Barlow C (2000) The ghosts of evolution: nonsensical fruit, missing partners, and other ecological
anachronisms. Basic Books, New York.
Basheer-Salimia R, Lorenzi S, Batarseh F, Moreno-Sanz P, Emanuelli F, Grando MS (2014)
Molecular identification and genetic relationships of Palestinian grapevine cultivars. Molecular
Biotechnology, 56: 546-556.
Beghe D, Ganino T, Dall'Asta C, Silvanini A, Cirlini M, Fabbri A (2013) Identification and
characterization of ancient Italian chestnut using nuclear microsatellite markers. Scientia Horticulturae
164: 50-57.
Berry EW (1929) Fossil fruits in the Ancon Sandstone of Ecuador. Journal of Paleontology, 3: 298-299.
Bioversity International and CHERLA (2008) Cherimoya descriptors for cherimoya (Annona
cherimola Mill.). Bioversity International, Rome, Italy. CHERLA Project, Malaga, Spain.

BIBLIOGRAFÍA
124
Bitocchi E, Nanni L, Bellucci E, Rossi M, Giardini A, Zeuli PS, Logozzo G, Stougaard J, McClean
P, Attene G, Papa R (2012) Mesoamerican origin of the common bean (Phaseolus vulgaris L.) is
revealed by sequence data. Proceedings of the National Academy of Sciences USA, 109: 788–796.
Bitocchi E, Bellucci E, Giardini A, Rau D, Rodriguez M, Biagetti E, Santilocchi R, Zeuli PS, Gioia
T, Logozzo G, Attene G, Nanni L, Papa R (2013) Molecular analysis of the parallel domestication of
the common bean (Phaseolus vulgaris) in Mesoamerica and the Andes. New Phytologist, 197: 300-
313.
Bhargava M, Sharma A (2013) DNA barcoding in plants: evolution and applications of in silico
approaches and resources. Molecular Phylogenetics and Evolution, 67: 631-641.
Bivand R, Lewin-Koh N (2015) Maptools: Tools for reading and handling spatial objects. R package
version 0.8-34. [WWW document] URL http://CRAN.R-project.org/package=maptools [accessed 29
March 2016].
Bivand R, Rundel C (2015) Rgeos: Interface to Geometry Engine - Open Source (GEOS). R package
version 0.3-12. [WWW document] URL http://CRAN.R-project.org/package=rgeos [accessed 29 March
2016].
Bivand R, Keitt T, Rowlingson B (2014) Rgdal: Bindings for the geospatial data abstraction library. R
package version 0.9-1. [WWW document] URL http://CRAN.R-project.org/package=rgdal [accessed 29
March 2016].
Bjornstad ON (2013) ncf: spatial nonparametric covariance functions. R package version 1.1-5.
http://CRAN.R-project.org/package=ncf [accessed 29 March 2016].
Blazier JC, Ruhlman TA, Weng ML, Rehman SK, JSM Sabir, Jansen RK (2016) Divergence of RNA
polymerase α subunits in angiosperm plastid genomes is mediated by genomic rearrangement.
Scientific Reports, 6: 24595.
Bonavia D, Ochoa CM, Tovar SO, Palomino RC (2004) Archaeological evidence of cherimoya
(Annona cherimola Mill.) and guanabana (Annona muricata L.) in ancient Peru. Economic Botany, 58:
509–522.
Bost JB, Smith NJH, Crane JH (2013) History, distribution and uses. The Avocado: Botany,
Production and Uses. Eds: Schaffer B, Wolstenholme BN, Whiley AW. CAB International, Wallingford,
UK, 10-30.
Bowden WM (1948) Chromosome numbers in the Annonaceae. American Journal of Botany, 35(7):
377-381.
Brake M, Migdadi H, Al-Gharaibeh M, Ayoub S, Haddad N, El Oqlah A (2014) Characterization of
Jordanian olive cultivars (Olea europaea L.) using RAPD and ISSR molecular markers. Scientia
Horticulturae, 176: 282-289.
Breto MP, Ruiz C, Pina JA, Asins MJ (2001) The diversification of Citrus clementina Hort. ex Tan., a
vegetatively propagated crop species. Molecular Phylogenetics and Evolution, 21: 285-293.
BIBLIOGRAFÍA
125
Brown AHD (1978) Isozymes, plant population genetic structure and genetic conservation. Theoretical
and Applied Genetics, 52: 145-157.
Brown W (1983) Genetic diversity and genetic vulnerability: an appraisal. Economic Botany, 37: 4-12.
Brown JL (2014) SDM toolbox: a python-based GIS toolkit for landscape genetic, biogeographic, and
species distribution model analyses. Methods in Ecology and Evolution, 5: 694-700.
Bydekerke L, Van Ranst E, Scheldeman X, Van Damme P (1999) Edaphoclimatological study of
cherimoya (Annona cherimola Mill.) in Loja province, Southern Ecuador. Proceedings of the first
international symposium on cherimoya. Acta Horticulturae, 497: 71-90.
Carballo DM (2012) Trade routes in the Americas before Columbus. The great trade routes: A
history of cargos and commerce over land and sea. Ed: Philip Parker. Conway Publishing, London,
166-170.
Cassini MH (2013) Distribution ecology. From individual habitat use to species biogeographical range.
Springer-Verlag, New York.
Cassman KG (1999) Ecological intensification of cereal production systems: Yield potential, soil
quality, and precision agriculture. Proceedings of the National Academy of Sciences USA, 96: 5952–
5959.
CBOL Plant Working Group (2009) A DNA barcode for land plants. Proceedings of the National
Academy of Sciences, 106: 12794–12797.
Chaowasku T, Thomas DC, van der Ham RW, Smets EF, Mols JB, Chatrou LW (2014) A plastid
DNA phylogeny of tribe Miliuseae: insights into relationships and character evolution in one of the most
recalcitrant major clades of Annonaceae. American Journal of Botany, 101: 691–709.
Chase MW, Cowan RS, Hollingsworth PM, van den Berg C, Madrinan S, Petersen G, Seberg O,
Jørgsensen T, Cameron KM, Carine M, Pedersen N, Hedderson TAJ, Conrad F, Salazar GA,
Richardson JE, Hollingsworth ML, Barraclough TG, Kelly L, Wilkinson M (2007) A proposal for a
standardised protocol to barcode all land plants. Taxon, 56: 295–299.
Chatrou LW (1999). Annonaceae and the Annonaceae Project: A brief overview of the state of affairs.
Acta Horticulturae 497: 43-49.
Chatrou LW, Rainer H, Maas PJM (2004) Annonaceae, Flowering plants of the neotropics. Eds:
Smith N, Mori SA, Henderson A, Stevenson DW, Heald SV. Princeton University Press, Princeton, 18-
20.
Chatrou LW, Escribano MP, Viruel MA, Maas JW, Richardson JE, Hormaza JI (2009) Flanking
regions of monomorphic microsatellite loci provide a new source of data for plant species-level
phylogenetics. Molecular Phylogenetics and Evolution, 53: 726–733.
Chatrou LW, Pirie MD, Erkens RHJ, Couvreur TLP, Neubig KM, Abbott JR, Mols JB, Maas JW,
Saunders RMK, Chase MW (2012) A new subfamilial and tribal classification of the pantropical
flowering plant family Annonaceae informed by molecular phylogenetics. Botanical Journal of the
Linnean Society, 169: 5-40.

BIBLIOGRAFÍA
126
Chen SL, Yao H, Han JP, Liu C, Song JY, Shi LC, Zhu YJ, Ma XY, Gao T, Pang XH, Luo K, Li Y, Li
XW, Jia XC, Lin YL, Leon C (2010) Validation of the ITS2 region as a novel DNA barcode for
identifying medicinal plant species. PLoS One, 5: e8613.
China Plant BOL Group, Li DZ, Gao LM, Li HT, Wang H, Ge XJ, Liu JQ, Chen ZD, Zhou SL, Chen
SL, Yang JB, Fu CX, Zeng CX, Yan HF, Zhu YJ, Sun YS, Chen SY, Zhao L, Wang K, Yang T, Duan
GW (2011) Comparative analysis of a large dataset indicates that internal transcribed spacer (ITS)
should be incorporated into the core barcode for seed plants. Proceedings of the National Academy of
Sciences of the United States of America, 108: 19641-19646.
Cho KH, Cho KS, Han JH, Kim HR, Shin IS, Kim SH, Chun JA, Hwang HS (2013) Development of
sequence characterized amplified region markers for cultivar identification in persimmon. Korean
Journal of Horticultural Science & Technology, 31:798-806.
Clement CR (1999) 1492 and the loss of Amazonian crop genetic resources. The relation between
domestication and human population decline. Economic Botany, 53: 188-202.
Cobo PB (1653) Historia del Nuevo Mundo. Sociedad de Bibliófilos Andaluces, Seville, Spain (1891).
Collins RA, Cruickshank RH (2013) The seven deadly sins of DNA barcoding. Molecular Ecology
Resources, 13: 969-975.
Collins WJ, Bellouin N, Doutriaux-Boucher M, Gedney N, Halloran P, Hinton T, Hughes J, Jones
CD, Joshi M, Liddicoat S, Martin G, O’Connor F, Rae J, Senior C, Sitch S, Totterdell I, Wiltshire
A, Woodward S. (2011) Development and evaluation of an Earth-System model – HadGEM2.
Geoscientific Model Development, 4: 1051-1075.
Cortes D, Moreno L, Párraga J, Galán A, Cabedo N (2014) Nuevos fármacos inspirados en
Annonáceas. Revista Brasileira de Fruticultura, 36(spe1): 22-31.
Couvreur TL, van der Ham RW, Mbele YM, Mbago FM, Johnson DM (2009) Molecular and
morphological characterization of a new monotypic genus of Annonaceae, Mwasumbia, from Tanzania.
Systematic Botany, 34(2): 266-276.
Cracraft J (1983) Species concepts and speciation analysis. Current Ornitology, 1: 159-187.
Crowhurst RN, Gleave AP, MacRae EA, Ampomah-Dwamena C, Atkinson RG, Beuning LL,
Bulley SM, Chagne D, Marsh KB, Matich AJ, Montefiori M, Newcomb RD, Schaffer RJ, Usadel B,
Allan AC, Boldingh HL, Bowen JH, Davy MW, Eckloff R, Ferguson AR, Fraser LG, Gera E,
Hellens RP, Janssen BJ, Klages K, Lo KR, MacDiarmid RM, Nain B, McNeilage MA, Rassam M,
Richardson AC, Rikkerink EHA, Ross GS, Schröder R, Snowden KC, Souleyre EJF, Templeton
MD, Walton EF, Wang D, Wang MY, Wang YY, Wood M, Wu R, Yauk YK, Laing WA (2008)
Analysis of expressed sequence tags from Actinidia: Applications of a cross species EST database for
gene discovery in the areas of flavor, health, color and ripening. BMC Genomics, 9: 351.
Daly DC, Cameron KM, Stevenson DW (2001) Plant systematics in the age of genomics. Plant
Physiology, 127:1328–1333.

BIBLIOGRAFÍA
127
Darriba D, Taboada GL, Doallo R, Posada D (2012) jModelTest 2: more models, new heuristics and
parallel computing. Nature Methods 9(8): 772.
Darwin CR (1835) Beagle diary (1831-1836). [WWW document] URL http://darwinonline.org.uk/
content/frameset?pageseq=1&itemID=EHBeagleDiary&viewtype=text. [accessed 29 March 2016].
Darwin CR (1859) Variation under domestication. On the Origin of Species by Means of Natural
Selection, or the Preservation of Favoured Races in the Struggle for Life. John Murray, London.
De Groot GA, During HJ, Maas JW, Schneider H, Vogel JC, Erkens RHJ (2011) Use of rbcL and
trnL-F as a Two-Locus DNA Barcode for Identification of NW-European Ferns: An Ecological
Perspective. PLoS ONE, 6(1): e16371.
De Queiroz K (2007) Species concepts and species delimitation. Systematic Biology, 56 (6): 879-886.
DeSalle R, Egan MG, Siddall M (2005) The unholy trinity: taxonomy, species delimitation and DNA
barcoding. Philosophical Transactions of the Royal Society B-Biological Sciences, 360: 1905-1916.
De Vere N, Rich TCG, Ford CR, Trinder SA, Long C, Moore CW, Satterthwaite D, Davies H,
Allainguillaume J, Ronca S, Tatarinova T, Garbett H, Walker K, Wilkinson MJ (2012) DNA
barcoding the native flowering plants and conifers of Wales. PLoS One, 7: e37945.
De Vicente MC, López C, Fulton T (eds.) (2004) Genetic diversity analysis with molecular marker
data: Learning Module. International Plant Genetic Resources Institute (IPGRI), Rome, Italy.
Doyle JA, Le Thomas A (1994) Cladistic analysis and pollen evolution in Annonaceae. Acta Botanica
Gallica, 141: 149–170.
Doyle JA, Le Thomas A (1996) Phylogenetic analysis and character evolution in Annonaceae. Bulletin
du Muséum National d’Histoire Naturelle, Section B, Adansonia, 18: 279–334.
Doyle JA, Le Thomas A (1997) Phylogeny and geographic history of Annonaceae. Geographie
Physique et Quaternaire, 51: 353-361.
Doyle JA, Le Thomas A (2012) Evolution and phylogenetic significance of pollen in Annonaceae.
Botanical Journal of the Linnean Society, 169: 190–221.
Du X, Zhang Q, Luo Z (2009a) Development of retrotransposon primers and their utilization for
germplasm identification in Diospyros spp. (Ebenaceae). Tree Genetics & Genomes, 5:235-245.
Du XY, Zhang QL, Luo Z (2009b) Comparison of four molecular markers for genetic analysis in
Diospyros L. (Ebenaceae). Plant Systematics and Evolution, 281: 171-18.
Dvorak J, Luo MC, Akhunov ED (2011) N.I. Vavilov’s theory of centres of diversity in the light of
current understanding of wheat diversity, domestication and evolution. Czech Journal of Genetics and
Plant Breeding, 47: 20-27.
Ellegren H (2000) Microsatellite mutations in the germline: implications for evolutionary inference.
Trends in Genetics, 16: 551–558.
Ellegren H (2004) Microsatellites: simple sequences with complex evolution. Nature Reviews
Genetics, 5: 435-445.

BIBLIOGRAFÍA
128
Ellstrand NC, Lee JM (1987) Cultivar identification of cherimoya (Annona cherimola Mill) using
isozyme markers. Scientia Horticulturae, 32: 25-31.
Enan MR, Ahamed A (2014) DNA barcoding based on plastid matK and RNA polymerase for
assessing the genetic identity of date (Phoenix dactylifera L.) cultivars. Genetic and Molecular
Research, 13(2): 3527-3536.
Erkens RHJ, Chatrou LW, Couvreur, TLP (2012a) Radiations and key innovations in an early
branching angiosperm lineage (Annonaceae; Magnoliales). Botanical Journal of the Linnean Society,
169(1): 117–134.
Erkens RHJ, Mennega EA, Westra LYT (2012b) A concise bibliographic overview of Annonaceae.
Botanical Journal of the Linnean Society, 169:41–73.
Ernest HB, Vickers TW, Morrison SA, Buchalski MR, Boyce WM (2014) Fractured genetic
connectivity threatens a Southern California puma (Puma concolor) population. PLoS One, 9: e107985.
Escribano P (2007) Desarrollo de marcadores moleculares para la identificación de genotipos,
estudios de diversidad y mejora de chirimoyo (Annona cherimola Mill.). Tesis doctoral, Universidad de
Málaga.
Escribano P, Viruel MA, Hormaza JI (2004) Characterization and cross-species amplification of
microsatellite markers in cherimoya (Annona cherimola Mill., Annonaceae). Molecular Ecology Notes,
4: 746-748.
Escribano P, Viruel MA, Hormaza JI (2007) Molecular analysis of genetic diversity and geographic
origin within an ex situ germplasm collection of cherimoya by using SSRs. Journal of the American
Society for Horticultural Science, 132(3): 357-367.
Escribano P, Viruel MA, Hormaza JI (2008a) Comparison of different methods to construct a core
germplasm collection in woody perennial species with SSR markers. A case study in cherimoya
(Annona cherimola Mill.), an underutilized subtropical fruit tree species. Annals of Applied Biology, 153:
25-32.
Escribano P, Viruel MA, Hormaza JI (2008b) Development of new 52 polymorphic SSR markers from
cherimoya (Annona cherimola Mill.). Transferability in related taxa and selection of a reduced set for
DNA fingerprinting and diversity studies. Molecular Ecology Resources, 8: 317-321.
Escudero A, Iriondo JM, Torres ME (2003) Spatial analysis of genetic diversity as a tool for plant
conservation. Biological Conservation, 113: 351–365.
Esquinas-Alcazar J (2005) Protecting crop genetic diversity for food security: political, ethical and
technical challenges. Nature Reviews Genetics, 6:946-953.
Estoup A, Jarne P, Cornuet J-M (2002) Homoplasy and mutation model at microsatellite loci and their
consequences for population genetic analysis. Molecular Ecology, 11:1591-1604.
Evanno G, Regnaut S, Goudet J (2005) Detecting the number of clusters of individuals using the
software STRUCTURE: a simulation study. Molecular Ecology, 14: 2611-2620.

BIBLIOGRAFÍA
129
Excoffier L, Laval G, Schneider S (2005) Arlequin ver. 3.0: An integrated software package for
population genetics data analysis. Evolutionary Bioinformatics Online, 1: 47-50.
Faostat (2014) FAO Statistics Database on the World Wide Web.
http://faostat.fao.org/site/339/default.aspx) [accessed 10 May 2016].
Food and Agriculture Organization (FAO) (2007) Molecular markers - a tool for exploring genetic
diversity. The state of the World's animal genetic resources for food and agriculture. Eds: Rischkowsky
B, Pilling D. Food and Agriculture Organization, Rome, 359-379.
Food and Agriculture Organization (FAO) (nd) Biodiversity to nurture people. Available at
http://www.fao.org/docrep/004/v1430e/V1430E04.htm [Accessed 10 May 2016].
Fries RE (1959) Annonaceae. Die natürlichen Pflanzenfamilien. Eds: Engler A, Prantl K. Ed. 2, Band
17 a II. Duncker & Humblot, Berlin.
Foulley JL, Ollivier L (2006) Estimating allelic richness and its diversity. Livestock Science, 101: 150-
158.
Fourcade Y, Engler JO, Rödder D, Secondi J (2014) Mapping species distributions with MAXENT
using a geographically biased sample of presence data: A performance assessment of methods for
correcting sampling bias. PLoS One, 9: e97122.
Gajera HP, Bambharolia RP, Domadiya RK, Patel SV, Golakiya BA (2014) Molecular
characterization and genetic variability studies associated with fruit quality of indigenous mango
(Mangifera indica L.) cultivars. Plant Systematics and Evolution, 300:1011-1020.
Galán Sauco V, Herrero M, Hormaza JI (2014) Tropical and subtropical fruits. Horticulturae: Plants
for People and Places. Eds: Dixon GR, Aldous DE. Springer, Dordrecht, Holland, 123-157.
Garcia-Ruiz MT, Mendoza-Castillo VM, Valadez-Moctezuma E, Muratalla-Lua A (2013) Initial
assessment of natural diversity in Mexican fig landraces. Genetic and Molecular Research, 12: 3931-
3943.
George AP, Broadley RH, Nissen RJ, Hamill SD (2002) Breeding new varieties of atemoya (Annona
spp. hybrids). Acta Horticulturae, 575: 323–328.
Glenn TC (2011) Field guide to next-generation DNA sequencers. Molecular Ecology Resources, 11:
759-769.
Goodrich KR (2012) Floral scent in Annonaceae. Botanical Journal of the Linnean Society, 169: 262–
279.
Gottsberger G (1999) Pollination and evolution in neotropical Annonaceae. Plant Species Biology, 14:
143-152.
Gottsberger G (2012) How diverse are Annonaceae with regard to pollination? Botanical Journal of
the Linnean Society, 169: 245-261.

BIBLIOGRAFÍA
130
Guarino L, Jarvis A, Hijmans RJ, Maxted N (2002) Geographic information systems (GIS) and the
conservation and use of plant genetic resources. Managing Plant Genetic Diversity. Eds: Engels JEA.
CAB International, Wallingford, 387–404.
Guichoux E, Lagache L, Wagner S, Chaumeil P, Leger P, Lepais O, Lepoittevin C, Malausa T,
Revardel E, Salin F, Petit, RJ (2011) Current trends in microsatellite genotyping. Molecular Ecology
Resources 11, 591-611.
Guimarães PR Jr, Galetti M, Jordano P (2008) Seed dispersal anachronisms: Rethinking the fruits
extinct megafauna ate. PLoS ONE, 3(3): e1745.
Guindon S, Gascuel O (2003) A simple, fast and accurate method to estimate large phylogenies by
maximum-likelihood. Systematic Biology, 52: 696-704.
Guo L, Palumbo R, Zhang ZS, Wang GL, Tay D, Zhang DL, Shen X, Shu HR (2009) Target region
amplification polymorphism (TRAP) for evaluating genetic diversity in Malus Mill. genus. HortScience,
44: 1117-1117.
Hammer K (2003) A paradigm shift in the discipline of plant genetic resources. Genetic Resources and
Crop Evolution, 50: 3-10.
Hanner R (2009). Data standards for barcode records in INSDC (BRis). [WWW document] URL
http://barcoding.si.edu/pdf/dwg_data_standards-final.pdf. [Accessed March 2015].
Hebert PD, Cywinska A, Ball SL, DeWaard JR (2003) Biological identifications through DNA
barcodes. Proceedings of the Royal Society B-Biological Sciences, 270(1512): 313-321.
Hennig W (1950) Grundzüge einer Theorie der phylogenetischen Systematik. Deutscher Zentralverlag,
Berlin.
Hey J (2001) The mind of species problem. Tends in Ecology and Evolution, 16(7): 326-329.
Hey J (2006) On the failure of modern species concepts. Trends in ecology and evolution, 21(8): 447–
445.
Hijmans RJ, van Etten J (2012) Raster: Geographic analysis and modeling with raster data. R
package version 2.3-24. [WWW document] URL http://CRAN.R-project.org/package=raster. [accessed
29 March 2016].
Hijmans RJ, Phillips S, Leathwick J, Elith J (2011) Dismo: Species Distribution Modeling. R package
version 1.0-12. [WWW document] URL http://CRAN.R-project.org/package=dismo. [accessed 29
March 2016].
Holderegger R, Wagner HH (2006) A brief guide to landscape genetics. Landscape Ecology, 21: 793–
796.
Holderegger R, Buehler D, Gugerli F, Manen S (2010) Landscape genetics of plants. Trends in plant
science, 15(12): 675–683.
Hollingsworth PM (2011) Refining the DNA barcode for land plants. Proceedings of the National
Academy of Sciences of the United States of America, 108: 19451-19452.

BIBLIOGRAFÍA
131
Huang HW, Layne DR, Peterson RN (1997) Using isozyme polymorphisms for identifying and
assessing genetic variation in cultivated pawpaw (Asimina triloba (L) Dunal). Journal of the American
Society for Horticultural Science, 122: 504-511.
Huang HW, Layne DR, Riemenschneider DE (1998) Genetic diversity and geographic differentiation
in pawpaw (Asimina triloba (L) Dunal) populations from nine states as revealed by allozyme analysis.
Journal of the American Society for Horticultural Science 123: 635-641.
Huang H, Layne DR, Kubisiak TL (2000) RAPD inheritance and diversity in pawpaw (Asimina triloba).
Journal of the American Society for Horticultural Science 125: 454-459.
Huang HW, Layne DR, Kubisiak TL (2003) Molecular characterization of cultivated pawpaw (Asimina
triloba) using RAPD markers. Journal of the American Society for Horticultural Science, 128: 85-93.
Ikegami H, Nogata H, Hirashima K, Awamura M, Nakahara T (2009) Analysis of genetic diversity
among European and Asian fig varieties (Ficus carica L.) using ISSR, RAPD, and SSR markers.
Genetic Resources and Crop Evolution, 56: 201-209.
Janzen DH, Martin PS (1982) Neotropical anachronisms: the fruits the gomphotheres ate. Science,
215(1): 19-27.
Jarvis A, Yeaman S, Guarino L, Tohme J (2005) The role of geographic analysis in locating,
understanding, and using plant genetic diversity. Methods in Enzymology, 395: 279–298.
Jeffreys AJ (1979) DNA sequence variants in the G gamma-, A gamma-, delta- and beta-globin genes
of man. Cell, 18: 1-10.
Jing ZB, Ruan X, Wang R, Yang Y (2013a) Genetic diversity and relationships between and within
persimmon (Diospyros L.) wild species and cultivated varieties by SRAP markers. Plant Systematics
and Evolution, 299: 1485-1492.
Jing ZB, Cheng, Guo CH, Wang XP (2013b) Seed traits, nutrient elements and assessment of
genetic diversity for almond (Amygdalus spp.) endangered to China as revealed using SRAP markers.
Biochemical Systematics and Ecology, 49:51-57.
Jombart T (2008) adegenet: a R package for the multivariate analysis of genetic markers.
Bioinformatics, 24: 1403-1405.
Jombart T, Ahmed I (2011) adegenet 1.3-1: new tools for the analysis of genome-wide SNP data.
Bioinformatics, 27(21): 3070-1.
Kalia RK, Rai MK, Kalia S, Singh R, Dhawan AK (2011) Microsatellite markers: an overview of the
recent progress in plants. Euphytica, 177: 309-334.
Katoh K, Misawa K, Kuma K, Miyata T (2002) MAFFT: a novel method for rapid multiple sequence
alignment based on fast Fourier transform. Nucleic Acids Research, 30: 3059-3066.
Kim H, Terakami S, Nishitani C, Kurita K, Kanamori H, Katayose Y, Sawamura Y, Saito T,
Yamamoto T (2012) Development of cultivar-specific DNA markers based on retrotransposon-based
insertional polymorphism in Japanese pear. Breeding Science, 62:53-62.

BIBLIOGRAFÍA
132
Kizirian D, Donnelly MA (2004) The criterion of reciprocal monophyly and classification of nested
diversity at the species level. Molecular Phylogenetics and Evolution, 32: 1072-1076.
Koek-Noorman J (1987) Multidisciplinary approach to the systematics of neotropical Annonaceae.
Annonaceae Newsletter, 6: 2-6.
Kress WJ, Erickson DL (2007) A two-locus global DNA barcode for land plants: the coding rbcL gene
complements the non-coding trnH-psbA spacer region. PLoS ONE, 2(6): e508.
Kress WJ, Wurdack KJ, Zimmer EA, Weigt LA, Janzen DH (2005) Use of DNA barcodes to identify
flowering plants. Proceedings of the National Academy of Sciences of the United States of America,
102: 8369-8374
Kuzmina M, Ivanova N (2011) Canadian Center for DNA Barcoding (CCDB) Protocols. Primers sets
for plants and fungi [WWW document] URL http://www.dnabarcoding.ca/CCDB_DOCS/CCDB
_PrimerSets-Plants.pdf [accesed May 2016]
Larranaga N, Hormaza JI (2015) DNA barcoding of perennial fruit tree species of agronomic interest
in the genus Annona (Annonaceae). Frontiers in Plant Science, 6: 589.
Larson G, Piperno DR, Allaby RG, Purugganan MD, Andersson L, Arroyo-Kalin M, Barton L,
Vigueira CC, Denham T, Dobney K, Doust AN, Gepts P, Gilbert MTP, Gremillion KJ, Lucas L,
Lukens L, Marshall FB, Olsen KM, Pires JC, Richerson PJ, de Casas RR, Sanjur OI, Thomas MG,
Fuller DQ (2014) Current perspectives and the future of domestication studies. Proceedings of the
National Academy of Sciences of the United States of America, 111(17): 6139-6146.
Le Corre V, Kremer A (2003) Genetic variability at neutral markers, quantitative trait loci and trait in a
subdivided population under selection. Genetics, 164: 1205–1219.
Leinemann L, Steiner W, Hosius B, Kuchma O, Arenhoevel W, Fussi B, Haase B, Kaetzel R,
Rogge M, Finkeldey R (2013) Genetic variation of chloroplast and nuclear markers in natural
populations of hazelnut (Corylus avellana L.) in Germany. Plant Systematics and Evolution, 299: 369-
378.
Lewis PO (2001) Phylogenetic systematics turns over a new leaf. Trends in Ecology & Evolution, 16:
30–37.
Li TF, Liu JR, Xie YN, Wang QY, Meng FJ (2014a) Analysis of genetic diversity in Prunus mira
Koehne ex Sargent populations using AFLP markers. Plant Systematics and Evolution, 300: 475-482.
Li D, Liu Y, Li X, Rao J, Yao X, Zhong C (2014b) Genetic diversity in kiwifruit polyploid complexes:
insights into cultivar evaluation, conservation, and utilization. Tree Genetics & Genomes, 10: 1451-
1463.
Li M, Zhao Z, Miao X (2014c) Genetic diversity and relationships of apricot cultivars in North China
revealed by ISSR and SRAP markers. Scientia Horticulturae, 173: 20-28.
Li X, Yang Y, Henry RJ, Rossetto M, Wang Y, Chen S (2015) Plant DNA barcoding: from gene to
genome. Biological Reviews, 90: 157–166.

BIBLIOGRAFÍA
133
Liaw CC, Wu TY, Chang FR, Wu YC (2011) Historic perspectives on annonaceous acetogenins from
the chemical bench to preclinical trials. Planta Medica, 76: 1390-1404.
Lin BB (2011) Resilience in agriculture through crop diversification: adaptive management for
environmental change. Bioscience, 61(3):183-193.
Linnaeus C (1737) Hortus Cliffortianus, Amsterdam.
Liu C, Berry PM, Dawson TP, Pearson RG (2005) Selecting thresholds of occurrence in the
prediction of species distributions. Ecography, 28: 385-393.
Lo EYY, Donoghue MJ (2012) Expanded phylogenetic and dating analyses of the apples and their
relatives (Pyreae, Rosaceae). Molecular Phylogenetics and Evolution, 63: 230-243.
Lora J, Hormaza JI, Herrero M (2010) The progamic phase of an early-divergent angiosperm, Annona
cherimola (Annonaceae). Annals of Botany, 105(2): 221-31.
Lora J, Herrero M, Hormaza JI (2011a) Stigmatic receptivity in a dichogamous early-divergent
angiosperm species, Annona cherimola (Annonaceae): influence of temperature and humidity.
American Journal of Botany, 98(2): 265-74.
Lora J, Hormaza JI, Herrero M, Gasser CS (2011b) Seedless fruits and the disruption of a conserved
genetic pathway in angiosperm ovule development. Proceedings of the National Academy of Sciences
of the United States of America, 108(13): 5461–5465.
Luo C, He X, Chen H, Ou S, Gao M, Brown JS, Tondo CT, Schnell RJ (2011) Genetic diversity of
mango cultivars estimated using SCoT and ISSR markers. Biochemical Systematics and Ecology, 39:
676-68.
Maas PJM, Westra LYT (1985a) Studies in Annonaceae II: A monograph of the genus Anaxagorea.
Part 1. Botanische Jahrbücher fur Systematik, Pflanzengeschichte und Pflanzengeographie, (1): 73-
134.
Maas PJM, Westra LYT (1985b) Studies in Annonaceae II: A monograph of the genus Anaxagorea.
Part 2. Botanische Jahrbücher fur Systematik, Pflanzengeschichte und Pflanzengeographie, 105: 145-
204.
Maas PJM, Westra LYT, Rainer H, Lobão AQ, Erkens RHJ (2011) An updated index to genera,
species, and infraspecific taxa of Neotropical Annonaceae. Nordic Journal of Botany, 29: 257–356.
Maddison WP, Maddison RD (2014) Mesquite: a modular system for evolutionary analysis. Version
3.01 (http://mesquiteproject.org).
Madhou M, Normand F, Bahorun T, Hormaza JI (2013) Fingerprinting and analysis of genetic
diversity of litchi (Litchi chinensis Sonn.) accessions from different germplasm collections using
microsatellite markers. Tree Genetics & Genomes, 9: 387-396.
Manel S, Holderegger R (2013) Ten years of landscape genetics. Trends in Ecology & Evolution, 28:
614-621.

BIBLIOGRAFÍA
134
Manel S, Schwartz MK, Luikart G, Taberlet P (2003) Landscape genetics: combining landscape
ecology and population genetics. Trends in Ecology & Evolution, 18: 189-197.
Mansour E, Ben Khaled A, Triki T, Abid M, Bachar K, Ferchichi A (2015) Evaluation of genetic
diversity among South Tunisian pomegranate (Punica granatum L.) accessions using fruit traits and
RAPD markers. Journal of Agricultural Science and Technology, 17: 109-119.
Marcos JG (2005) Los pueblos navegantes del Ecuador Prehispánico. Abya-Yala, Quito, Ecuador,
137-170
Martin C (2013) Desarrollo de un mapa genético, variación de ploidía y anomalías meióticas en el
género Annona. Tesis doctoral, Universidad de Málaga.
Martin C, Herrero M, Hormaza JI (2011) Molecular characterization of apricot germplasm from an old
stone collection. PLoS One 6(8): e23979.
Martin M, Mattioni C, Molina JR, Alvarez JB, Cherubini M, Herrera MA, Villani F, Martin LM (2012)
Landscape genetic structure of chestnut (Castanea sativa Mill.) in Spain. Tree Genetics and Genomes,
8:127-136.
Matsuoka Y, Vigouroux Y, Goodman MM, Sanchez GJ, Buckler E, Doebley J (2002) A single
domestication for maize shown by multilocus microsatellite genotyping. Proceedings of the National
Academy of Sciences of the United States of America, 99: 6080-6084.
Mayr E (1942) Systematics and the origin of species. Columbia University Press, New York.
McClure KA, Sawler J, Gardner KM, Money D, Myles S (2014) Genomics: A potential panacea for
the perennial problem. American Journal of Botany, 101: 1780-1790.
Meirmans PG, Hedrick PW (2011) Assessing population structure: FST and related measures.
Molecular Ecology Resources, 11: 5-18.
Meyer CP, Paulay G (2005) DNA barcoding: error rates based on comprehensive sampling. PLoS
Biology, 3: e422.
Meyer RS, DuVal AE, Jensen HR (2012) Patterns and processes in crop domestication: an historical
review and quantitative analysis of 203 global food crops. New Phytologist, 196: 29-48.
Michalakis Y, Excoffier L (1996) A generic estimation of population subdivision using distances
between alleles with special reference to microsatellite loci. Genetics, 142: 1061-1064.
Miller A, Schaal B (2005) Domestication of a Mesoamerican cultivated fruit tree, Spondias purpurea.
Proceedings of the National Academy of Sciences of the United States of America, 15(12): 675–683.
Miller MA, Pfeiffer W, Schwartz T (2010) Creating the CIPRES Science Gateway for inference of
large phylogenetic trees. Proceedings of the Gateway Computing Environments Workshop (GCE).
New Orleans, LA, 1 - 8.
Mols JB, Gravendeel B, Chatrou LW, Pirie MD, Bygrave PC, Chase MW, Kessler PJA (2004)
Identifying clades in Asian Annonaceae: Monophyletic genera in the polyphyletic Miliuseae. American
Journal of Botany, 91: 590–600.

BIBLIOGRAFÍA
135
Mondini L, Noorani A, Pagnotta MA (2009) Assessing plant genetic diversity by molecular tools.
Diversity, 1: 19-35.
Morgado RR (2007) Mesoamérica: concepto y realidad de un espacio cultural. Arqueoweb: Revista
sobre Arqueología en Internet, 8(2).
Morton JF (1987) Fruits of Warm Climates. Creative Resources Systems, Winterville, NC, USA.
Mullis K, Faloona F, Scharf S, Saiki R, Horn G, Erlich H (1986) Specific enzymatic amplification of
DNA in vitro: The polymerase chain reaction. Cold Spring Harbor Symposia on Quantitative Biology,
51: 263–273.
Museo de la Nación (1995) Culturas precolombinas. Lima, Perú.
Nair AS, Teo CH, Schwarzacher T, Harrison PH (2005) Genome classification of banana cultivars
from South India using IRAP markers. Euphytica, 144: 285-290.
National Research Council Panel on Lost Crops of the Incas (1990) Lost crop of the Incas.
Arnoldia, 50(4): 2-15.
Neaves LE, Whitlock R, Piertney SB, Burke T, Butlin RK, Hollingsworth PM (2013) 15.
Implications of climate change for genetic diversity and evolvability in the UK. Terrestrial biodiversity
climate change impacts report card technical paper.
Nei M (1973) Analysis of gene diversity in subdivided populations. Proceedings of the National
Academy of Sciences of the United States of America, 70: 3321-3323.
Nicolas V, Schaeffer B, Missoup AD, Kennis J, Colyn M, Denys C, Tatard C, Cruaud C, Laredo C
(2012) Assessment of three mitochondrial genes (16S, Cytb, CO1) for identifying species in the
praomyini tribe (Rodentia: Muridae). PLoS ONE, 7: e36586.
Olmstead RG, Palmer JD (1994) Chloroplast DNA systematics: a review of methods and data
analysis. American Journal of Botany, 81(9): 2015-1224.
Olmstead RG, Sweere JA (1994) Combining data in phylogenetic systematics- an empirical approach
using three molecular data sets in the Solanaceae. Systematic Biology, 43: 467-481.
Osuna ES (2015) The Aztec, Maya, and Inca civilizations. Eds: Sudhansu Chokroverty, Michel Billiard.
Sleep Medicine Springer, New York, 55-59.
Padulosi S, Hodgkin T, Williams JT, Haq N (2002) Underutilised crops: trends, challenges and
opportunities in the 21st Century. Eds: Engels J, Rao VR, Jackson M. Managing plant genetic diversity.
CAB International, Wallingford, UK, 323-338.
Palmer JD (1985) Chloroplast DNA and molecular phylogeny. Bioessays, 2: 263-266.
Pang XH, Liu C, Shi LC, Liu R, Liang D, Li H, Cherny SS, Chen SL (2012) Utility of the trnH-psbA
intergenic spacer region and its combinations as plant DNA barcodes: A meta-analysis. PLoS One 7:
e48833.
Parida SK, Kalia SK, Sunita K (2009) Informative genomic microsatellite markers for efficient
genotyping applications in sugarcane. Theoretical and Applied Genetics, 118: 327–38.

BIBLIOGRAFÍA
136
Pascual L, Perfectti F, Gutierrez M, Vargas AM (1993) Characterizing isozymes of Spanish
cherimoya cultivars. HortScience, 28: 845-847.
Passos MAN, de Oliveira Cruz V, Emediato FL, de Camargo Teixeira C, Souza MT, Matsumoto T,
Renno Azevedo VC, Ferreira CF, Amorim EP, de Alencar Figueiredo LF, Martins NF, de Jesus
Barbosa Cavalcante M, Baurens FC, da Silva OB Jr, Pappas GJ Jr, Pignolet L, Abadie C, Ciampi
AY, Piffanelli P, Miller RN (2012) Development of expressed sequence tag and expressed sequence
tag-simple sequence repeat marker resources for Musa acuminata. AoB Plants, 2012: pls030.
Pereira MF, Bandeira LF, Blanco AJ, Ciampi AY, Coelho AS (2008a) Development of microsatellite
markers in Annona crassiflora Mart., a Brazilian Cerrado fruit tree species. Molecular Ecology
Resources, 8: 1329–1331.
Pereira F, Carneiro J, Amorim A (2008b). Identification of species with DNA-based technology:
current progress and challenges. Recent patents on DNA & Gene Sequences Journal, 2(3): 187-199.
Pérez de Oteyza MA, Farré-Massip JM, Hermoso-González JM, Ruiz-Nieto A (1999) El banco
español de germoplasma de chirimoyo. Parámetros estudiados y su variabilidad. Actas de Horticultura,
25: 7-12.
Perfectti F, Pascual L (1996) Segregation distortion of isozyme loci in cherimoya (Annona cherimola
Mill). Theoretical and Applied Genetics, 93: 440-446.
Perfectti F, Pascual L (1998a) Characterization of cherimoya germplasm by isozyme markers. Fruit
Varieties Journal, 52: 53–62.
Perfectti F, Pascual L (1998b) Genetic linkage of isozyme loci in Annona cherimola. Hereditas, 128:
87-90.
Perfectti F, Pascual L (2004) Geographic variation for isozymes in cherimoya (Annona cherimola
Mill.). Genetic Resources and Crop Evolution, 51: 837-843.
Perfectti F, Pascual L (2005) Genetic diversity in a worldwide collection of cherimoya cultivars.
Genetic Resources and Crop Evolution, 52: 959-966.
Perry L, Dickau R, Zarrillo S, Holst I, Pearsall DM, Piperno DR, Berman MJ, Cooke RG,
Rademaker K, Ranere AJ, Raymond JS (2007) Starch fossils and the domestication and dispersal of
chili peppers (Capsicum spp. L.) in the Americas. Science, 315 (5814): 986-988.
Phillips SJ, Anderson RP, Schapire RE (2006) Maximum entropy modeling of species geographic
distributions. Ecological Modelling, 190: 231-259.
Pickersgill B (2007) Domestication of Plants in the Americas: Insights from Mendelian and Molecular
Genetics. Annals of Botany, 100: 925-940.
Pinto AC, Cordeiro MCR, Andrade SRM, Ferreira FR, Filgueiras HA, Alves RE, Kinpara DJ (2005)
Annona Species. International Centre for Underutilised Crops, University of Southampton,
Southampton.
Pirie MD, Chatrou LW, Erkens RHJ, Maas JW, van der Niet T, Mols JB, Richardson JE (2005)
Phylogeny reconstruction and molecular dating in four Neotropical genera of Annonaceae: the effect of
BIBLIOGRAFÍA
137
taxon sampling in age estimations. Eds: Bakker FT, Chatrou LW, Gravendeel B, Pelser PB. Plant
species-level systematics: new perspectives on pattern & process. Regnum Vegetabile 143. A. R. G.
Gantner Verlag, Vaduz, Liechtenstein, 149-174.
Pirie MD, Balcázar Vargas MP, Botermans M, Bakker FT, Chatrou LW (2007) Ancient paralogy in
the cpDNA trnL-F region in Annonaceae: implications for plant molecular systematics. American
Journal of Botany, 94: 1003-1016.
Pollegioni P, Woeste KE, Chiocchini F, Olimpieri I, Tortolano V, Clark J, Hemery GE, Mapelli S,
Malvolti ME (2014) Landscape genetics of Persian walnut (Juglans regia L.) across its Asian range.
Tree Genetics & Genomes, 10: 1027-1043.
Pomper KW, Crabtree SB, Brown SP, Jones SC, Bonney TM, Layne DR (2003) Assessment of
genetic diversity of pawpaw (Asimina triloba) cultivars with intersimple sequence repeat markers.
Journal of the American Society for Horticultural Science, 128: 521-525.
Popenoe W (1921) The native home of the cherimoya. Journal of Heredity, 12: 331-336.
Popenoe H, King SR, Leon J, Kalinowski LS, Vietmeyer ND, Dafforn M (1989) Lost crops of the
Incas. Little-known plant of the Andes with promise for worldwide cultivation. National Academy Press,
Washington, D.C.
Porth I, El-Kassaby YA (2014) Assessment of the genetic diversity in forest tree populations using
molecular markers. Diversity, 6: 283-295.
Pozorski T, Pozorski S (1997) Cherimoya and guanabana in the archaeological record of Peru.
Journal of Ethnobiology 17(2): 235-248.
Pritchard JK, Stephens M, Donnelly P (2000) Inference of population structure using multilocus
genotype data. Genetics, 155: 945-959.
Pritchard JK, Wen X, Falush D (2010) Documentation for structure software: version2.3 [WWW
document] URL http://pritchardlab.stanford.edu/structure_software/release_versions/v2.3.4/structure
_doc.pdf [accessed 29 March 2016].
Quan X, Zhou SL (2011) Molecular identification of species in Prunus sect. Persica (Rosaceae), with
emphasis on evaluation of candidate barcodes for plants. Journal of Systematics and Evolution, 49:
138–145.
Rahman M, Yamada M, Yoshida M (1997) Relationship of Annona species as revealed by PCR-
RPLP analysis. Breeding Science, 47: 335-339.
Rahman MSM, Shimada T, Yamamoto T, Yonemoto JY, Yoshida M (1998) Genetical diversity of
cherimoya cultivars revealed by amplified fragment length polymorphism (AFLP) analysis. Breeding
science, 48: 5–10.
Rainer H (2007) Monographic studies in the genus Annona L. (Annonaceae): inclusion of the genus
Rollinia A.St.-Hil. Annalen des Naturhistorischen Museums in Wien. Serie B, Botanik und Zoologie
Vienna, 108: 191–205.

BIBLIOGRAFÍA
138
Rainer H, Chatrou LW (eds) (2016) AnnonBase: Annonaceae GSD (version Jan 2014). In: Species
2000 & ITIS Catalogue of Life, 26th August 2016. Eds: Roskov Y, Abucay L, Orrell T, Nicolson D.,
Kunze T, Flann C, Bailly N, Kirk P, Bourgoin T, DeWalt RE, Decock W, De Wever A. Digital resource at
www.catalogueoflife.org/col. Species 2000: Naturalis, Leiden, the Netherlands
Raji R, Jannatizadeh A, Fattahi R, Esfahlani MA (2014) Investigation of variability of apricot (Prunus
armeniaca L.) using morphological traits and microsatellite markers. Scientia Horticulturae, 176: 225-
231.
Ramanatha Rao V, Hodgkin T (2002) Genetic diversity and conservation and utilization of plant
genetic resources. Plant Cell, Tissue and Organ Culture, 68: 1-19.
Ratnasingham S, Hebert PDN (2007) BOLD: the barcode of life data system (www.barcodinglife.org).
Molecular Ecology Notes, 7: 355–364.
Richardson JE, Chatrou LW, Mols JB, Erkens RHJ, Pirie MD (2004) Historical biogeography of two
cosmopolitan families of flowering plants: Annonaceae and Rhamnaceae. Philosophical Transactions
of the Royal Society of London Series B-Biological Sciences, 359: 1495-1508.
Ronning C, Schnell R, Gazit S (1995) Using randomly amplified polymorphic DNA (RAPD) markers to
identify Annona cultivars. Journal of the American Society for Horticultural Science, 120: 726-729.
Rosell P, Galán-Saúco V, Hernández PM (1997) Cultivo del chirimoyo en Canarias. Cuadernos de
divulgación. Departamento de Fruticultura Tropical Instituto Canario de Investigaciones Agradas. ICIA.
Gobierno de canarias consejería de agricultura, ganadería, pesca y alimentación. España.
Rosen DE (1979) Fishes from the upland and intermontane basins of Guatemala: revisionary studies
and comparative geography. Bulletin American Museum of Natural History, 162: 267-376.
Rosenberg NA (2004) DISTRUCT: a program for the graphical display of population structure.
Molecular Ecology Notes, 4: 137-138.
Roy S, Tyagi A, Shukla V, Kumar A, Singh UM, Chaudhary LB, Datt B, Bag SK, Singh PK, Nair
NK, Husain T, Tuli R (2010) Universal plant DNA barcode loci may not work in complex groups: a
case study with Indian Berberis species. PLoS One, 5: e13674.
Sabir JSM, Abo-Aba S, Bafeel S, Zari TA, Edris S, Shokry AM, Atef A, Gadalla NO, Ramadan AM,
Al-Kordy MA, El-Domyati FM, Jansen RK, Bahieldin A (2014) Characterization of ten date palm
(Phoenix dactylifera L.) cultivars from Saudi Arabia using AFLP and ISSR markers. Comptes Rendus
Biologies, 337:6-18.
Saitou N (1996) Reconstruction of gene trees from sequence data. Methods in Enzymology, 266: 427-
449.
Safford WE (1914) Classification of the genus Annona, with descriptions of new and imperfectly known
species. Contributions from the United States National Herbarium, 18(1): 1-68.
Samal KC, Jena RC, Swain SS, Das BK, Chand PK (2012) Evaluation of genetic diversity among
commercial cultivars, hybrids and local mango (Mangifera indica L.) genotypes of India using
cumulative RAPD and ISSR markers. Euphytica, 185: 195-213.

BIBLIOGRAFÍA
139
Samuel AF, Drucker AG, Andersena SB, Simianer H, van Zonneveld M (2013) Development of a
cost-effective diversity-maximising decision-support tool for in situ crop genetic resources conservation:
The case of cacao. Ecological Economics, 96: 155-164.
Saunders RMK (2012) The diversity and evolution of pollination systems in Annonaceae. Botanical
Journal of the Linnean Society, 169: 222–244.
Sboner A, Mu XJ, Greenbaum D, Auerbach RK, Gerstein MB (2011) The real cost of sequencing:
higher than you think! Genome Biology, 12: 125.
Scharaschkin T, Doyle JA (2005) Phylogeny and historical biogeography of Anaxagorea
(Annonaceae) using morphology and non-coding chloroplast DNA sequence data. Systematic Botany,
30: 712-735.
Schatz GE (1992) Taxonomic notes on Mesoamerican Annona section Atta (Annonaceae), including
Annona pruinosa sp. Nov. Novon, 2: 249-251.
Scheldeman X (2002) Distribution and potential of cherimoya (Annona cherimola Mill.) and highlands
papayas (Vasconcellea spp.) in Ecuador. Faculteit Landbouwkundige en Toegepaste Biologische
Wetenschappen. Universidad de Gante, Holanda.
Scheldeman X, van Zonneveld M (2012) Training Manual on Spatial Analysis of Plant Diversity and
Distribution. Bioversity International, Rome.
Scheldeman X, Van Damme P, Ureña Alvarez JV, Romero Motoche JP (2003) Horticultural
potential of Andean fruit crops exploring their centre of origin. Acta Horticulturae, 598: 97-102.
Schwartz MK, Mills LS, McKelvey KS, Ruggiero LF, Allendorf FW (2002) DNA reveals high
dispersal synchronizing the population dynamics of Canada lynx. Nature, 415: 520-522.
Sehic J, Garkava-Gustavsson L, Fernandez-Fernandez F, Nybom H (2012) Genetic diversity in a
collection of European pear (Pyrus communis) cultivars determined with SSR markers chosen by
ECPGR. Scientia Horticulturae, 145: 39-45.
Sharer R (2012) Who were the Maya? Expedition, 54(1): 12-16 [WWW document] URL
www.penn.museum. [accesed 29 March 2016]
Shen Y, Ding X, Wang F, Cai B, Gao Z, Zhang Z (2011) Analysis of genetic diversity in Japanese
apricot (Prunus mume Sieb. et Zucc.) based on REMAP and IRAP molecular markers. Scientia
Horticulturae, 132: 50-58.
Shi S, Li JL, Sun JH, Yu J, Zhou SL (2013) Phylogeny and Classification of Prunus sensu lato
(Rosaceae). Journal of Integrative Plant Biology, 55: 1069-1079.
Shrestha UB, Bawa KS (2014) Impact of climate change on potential distribution of chinese caterpillar
fungus (Ophiocordyceps sinensis) in Nepal Himalaya. PLoS One, 9: e106405.
Slatkin M (1995) A measure of population subdivision based on microsatellite allele frequencies.
Genetics, 139: 457-462.

BIBLIOGRAFÍA
140
Slatkin M, Takahata N (1985) The average frequency of private alleles in a partially isolated
population. Theoretical Population Biology, 28: 314-331.
Sokal RR & Crovello TJ (1970) The biological species concept: a critical evaluation. American
Naturalist, 104, 127–153.
Soltis DE, Soltis PS, Endress PK, Chase MW (2005) Angiosperm phylogeny and evolution. Sinauer
Associates, Sunderland.
Srivathsan A, Meier R (2012) On the inappropriate use of Kimura-2-parameter (K2P) divergences in
the DNA-barcoding literature. Cladistics, 28: 190-194.
Stevens PF (2001 onwards) Angiosperm Phylogeny Website. Version 12, July 2012 [www document]
URL http://www.mobot.org/MOBOT/research/APweb/ [accesed March 2016].
Storfer A, Murphy MA, Evans JS, Goldberg CS, Robinson S, Spear SF, Dezzani R, Delmelle E,
Vierling L, Waits LP (2007) Putting the 'landscape' in landscape genetics. Heredity, 98: 128-142.
Storfer A, Murphy MA, Spear SF, Holderegger R, Waits LP (2010) Landscape genetics: where are
we now? Molecular Ecology 19:3496–3514.
Su YC, Saunders RM (2006) Monograph of Pseuduvaria (Annonaceae). Monographs in Systematic
Botany, 79: 1–204.
Su YCF, Saunders RMK (2009) Evolutionary divergence times in the Annonaceae: evidence of a late
Miocene origin of Pseuduvaria in Sundaland with subsequent diversification in New Guinea. BMC
Evolutionary Biology, 9.
Su YC, Chaowasku T, Saunders RM (2010) An extended phylogeny of Pseuduvaria (Annonaceae)
with descriptions of three new species and a reassessment of the generic status of Oreomitra.
Systematic Botany 35, 1, 30-39.
Sunil N, Sivaraj N, Anitha K, Abraham B, Kumar V, Sudhir E, Vanaja M, Varaprasad KS (2009)
Analysis of diversity and distribution of Jatropha curcas L. germplasm using Geographic Information
System (DIVA-GIS). Genetic resources and crop evolution, 56:115-119.
Swofford DL, Olsen GJ, Waddell PJ & Hillis DM (1996) Phylogenetic inference. Molecular
Systematics. Eds: Hiillis DM, Moritz D, Mable BK. Sinauer Associates, Sunderland, 407-514.
Syed NH, Sureshsundar S, Wilkinson MJ, Bhau BS, Cavalcanti JJV, Flavell AJ (2005) Ty1-copia
retrotransposon-based SSAP marker development in cashew (Anacardium occidentale L.). Theoretical
and Applied Genetics, 110:1195-1202.
Szpiech ZA, Rosenberg NA (2011) On the size distribution of private microsatellite alleles. Theoretical
Population Biology, 80: 100-113.
Szpiech ZA, Jakobsson M, Rosenberg NA (2008) ADZE: A rarefaction approach for counting alleles
private to combinations of populations. Bioinformatics, 24(21): 2498-2504.
Taberlet P, Gielly L, Pautou G, and Bouvet J (1991) Universal primers for amplification of three
noncoding regions of chloroplast DNA. Plant Molecular Biology, 17: 1105-1109.

BIBLIOGRAFÍA
141
Takrouni MM, Ali IB, Messaoued C, Boussaid M (2012) Genetic variability of Tunisian wild
strawberry tree (Arbutus unedo L.) populations interfered from isozyme markers. Scientia Horticulturae,
146: 92-98
Tamura K, Peterson D, Peterson N, Stecher G, Nei M, Kumar S (2011) MEGA5: molecular
evolutionary genetics analysis using maximum likelihood, evolutionary distance, and maximum
parsimony methods. Molecular Biology and Evolution, 28; 2731–2739.
Tamura K, Stecher G, Peterson D, Filipski A, Kumar S (2013) MEGA6: Molecular Evolutionary
Genetics Analysis version 6.0. Molecular Biology and Evolution, 30: 2725-2729.
Taylor HR, Harris WE (2012) An emergent science on the brink of irrelevance: a review of the past 8
years of DNA barcoding. Molecular Ecology Resources, 12 (3): 377–388.
Thakur D, Singh R (1965) Studies on pollen morphology, pollination and fruit set in some Annonas.
Indian Journal of Horticulture 22: 10-18.
Thomas E, van Zonneveld M, Loo J, Hodgkin T, Galluzzi G, van Etten J (2012a) Present spatial
diversity patterns of Theobroma cacao L. in the neotropics reflect genetic differentiation in Pleistocene
refugia followed by human-influenced dispersal. PLoS One, 7: e47676.
Thomas DC, Surveswaran S, Xue B, Sankowsky G, Mols, JB, Keler PJA, Saunders RMK (2012b)
Molecular phylogenetics and historical biogeography of the Meiogyne-Fitzalania clade (Annonaceae):
Generic paraphyly and late Miocene-Pliocene diversification in Australasia and the Pacific. Taxon, 61:
559–575.
Towle MA (1961) The ethnobotany of precolumbian Peru. Aldine Publishing Co, Chicago.
Uchoi A, Malik SK, Choudhary R, Kumar S, Rohini MR, Pal D1, Ercisli S, Chaudhury R (2016)
Inferring phylogenetic relationships of Indian citron (Citrus medica L.) based on rbcL and matK
sequences of chloroplast DNA. Biochemical Genetics, 54(3): 249-69.
United Nations Environment Programme (UNEP) (2007) Chapter 5: Biodiversity. Global
Environment Outlook (GEO 4): Environment for Development. United Nations Environment
Programme. Nairobi. [WWW document] URL http://www.unep.org/geo/geo4/report/geo-
4_report_full_en.pdf [Accesed 10 May 2016].
Urbanek S (2013) rJava: Low-level R to Java interface. R package version 0.9-6. [WWW document]
URL http://CRAN.R-project.org/package=rJava. [accessed 29 March 2016].
van Etten J (2011) gdistance: distances and routes on geographical grids. R package version 1.1-2.
[WWW document] URL http://CRAN.R-project.org/package=gdistance [accessed 29 March 2016].
van Etten J (2015) gdistance: Distances and Routes on Geographical Grids. R package version 1.1-7.
[WWW document] URL http://CRAN.R-project.org/package=gdistance [accessed 29 March 2016].
van Damme P, van Damme V, Scheldeman X (2000) Ecology and cropping of cherimoya (Annona
cherimola Mill.) in Latin America. New data from Ecuador. Fruits, 55; 195-206.
van Hintum T, Brown AHD, Spillane C, Hodgkin T (2000) Core collections of plant genetic
resources. IPGRI Technical Bulletin No.3. International Plant Genetic Resources Institute, Rome.

BIBLIOGRAFÍA
142
Vanhove W, van Damme P (2013) Value chains of cherimoya (Annona cherimola Mill.) in a centre of
diversity and its on-farm conservation implications. Tropical Conservation Science, 6: 158–180.
van Velzen R, Weitschek E, Felici G, Bakker FT (2012) DNA barcoding of recently diverged species:
relative performance of matching methods. PLoS ONE 7: e30490.
van Zonneveld M, Scheldeman X, Escribano P, Viruel MA, Van Damme P, Garcia W, Tapia C,
Romero J, Siguenas M, Hormaza JI (2012) Mapping genetic diversity of cherimoya (Annona
cherimola Mill.): application of spatial analysis for conservation and use of plant genetic resources.
PLoS One 7: e29845.
van Zuilen CM (1996). Patterns and affinities in the Duguetia alliance (Annonaceae): molecular and
morphological studies. PhD. Dissertation, Utrecht University, Utrecht, Netherlands.
Vigouroux Y, Glaubitz JC, Matsuoka Y, Goodman MM, Sánchez GJ, Doebley J (2008) Population
structure and genetic diversity of New World maize races assessed by DNA microsatellites. American
Journal of Botany, 95(10): 1240-1253.
Viruel MA, Hormaza JI (2004) Development, characterization and variability analysis of microsatellites
in lychee (Litchi chinensis Sonn., Sapindaceae). Theoretical and Applied Genetics, 108: 896–902.
Volk GM, Henk AD, Baldo A, Fazio G, Chao CT, Richards CM (2015) Chloroplast heterogeneity and
historical admixture within the genus Malus. American Journal of Botany, 102(7): 1198-208.
Vos P, Hogers R, Bleeker M, Reijans M, van de Lee T, Hornes M, Fritjters A, Pot J, Peleman J,
Kuiper M, Zabeau M (1995) AFLP: a new technique for DNA fingerprinting. Nucleic Acids Research,
23: 4407-4414.
Wagner I, Maurer WD, Lemmen P, Schmitt HP, Wagner M, Binder M, Patzak P (2014) Hybridization
and genetic diversity in wild apple (Malus sylvestris (L.) Mill) from various regions in Germany and from
Luxembourg. Silvae Genetica, 63: 81-94.
Walker JW (1972) Chromosome numbers, phylogeny, phytogeography of the Annonaceae and their
bearing on the (original) basic chromosome number of Angiosperms. Taxon, 21(1): 57-65.
Wang Y, Reighard GL, Layne DR, Abbott AG, Huang HW (2005) Inheritance of AFLP markers and
their use for genetic diversity analysis in wild and domesticated pawpaw (Asimina triloba (L.) Dunal).
Journal of the American Society for Horticultural Science, 130: 561-568.
Wayne GP (2013) The beginner’s guide to representative concentration pathways, Version 1.0. [WWW
document] URL http://www.skepticalscience.com/docs/RCP_Guide.pdf. [accessed 29 March 2016].
Weir BS, Cockerham CC (1984) Estimating F-statistics for the analysis of population structure.
Evolution, 38: 1358-1370.
Wester PJ (1910) Pollination experiments with Anonas. Bulletin of the Torrey Botanical Club, 37: 529-
539.
White D, Gramacy RB (2012) Maptree: Mapping, pruning, and graphing tree models. R package
version 1.4-7. [WWW document] URL http://CRAN.R-project.org/package=maptree. [accessed 29
March 2016].

BIBLIOGRAFÍA
143
Williams JGK, Kuberik AR, Livak KJ, Rafalski, JA, Tingey SV (1990) DNA polymorphisms amplified
by arbitrary primers are useful as genetic markers. Nucleic Acids Research,18: 6531-6535.
Winter DJ (2012) mmod: an R library for the calculation of population differentiation statistics.
Molecular Ecology Resources, 12(6): 1158-60.
Wolters B (2001) Dissemination of American economic plants on precolumbian sea routes by
Amerindians. Migration & Diffusion, 1: 40-58.
Wright S (1943) Isolation by Distance. Genetics, 28: 114–138.
Wünsch A, Hormaza JI (2002) Cultivar identification and genetic fingerprinting of temperate fruit tree
species using DNA markers. Euphytica, 125: 59-67.
Yilmaz KU, Paydas-Kargi S, Dogan Y, Kafkas S (2012) Genetic diversity analysis based on ISSR,
RAPD and SSR among Turkish apricot germplasms in Iran Caucasian eco-geographical group.
Scientia Horticulturae, 138: 138-143.
Yukimoto S, Adachi Y, Hosaka M, Sakami T, Yoshimura H, Hirabara M, Tanaka TY, Shindo E,
Tsujino H, Deushi M, Mizuta R, Yabu S, Obata A, Nakano H, Koshiro T, Ose T, Kitoh A (2012) A
new global climate model of the Meteorological Research Institute: MRI-CGCM3-model description and
basic performance. Journal of the Meteorological Society of Japan, 90A: 23-64.
Zanis MJ, Soltis DE, Soltis PS, Mathews S, Donoghue MJ (2002) The root of the angiosperms
revisited. Proceedings of the National Academy of Sciences of the United States of America, 99: 6848-
6853.
Zhang CY, Wang FY, Yan HF, Hao G, Hu CM, Ge XJ (2012) Testing DNA barcoding in closely related
groups of Lysimachia L. (Myrsinaceae). Molecular Ecology Resources, 12: 98-108.
Zhang JQ, Meng SY, Wen J, Rao GY (2015) DNA Barcoding of Rhodiola (Crassulaceae): A case
study on a group of recently diversified medicinal plants from the Qinghai-Tibetan Plateau. PLoS One,
10: e0119921.
Zill GE, Mahdeem H (1998) General observations on hybridizing Annona species. Selected
Proceedings of the Florida State Horticultural Society, 111: 314–315.
Zohary D (2004) Unconscious selection and the evolution of domesticated plants. Economic Botany,
58: 5-10.

ANEXO 1 Larranaga N, Hormaza JI (2015) DNA barcoding of perennial fruit tree species of
agronomic interest in the genus Annona (Annonaceae). Frontiers in Plant
Science, 6:589.
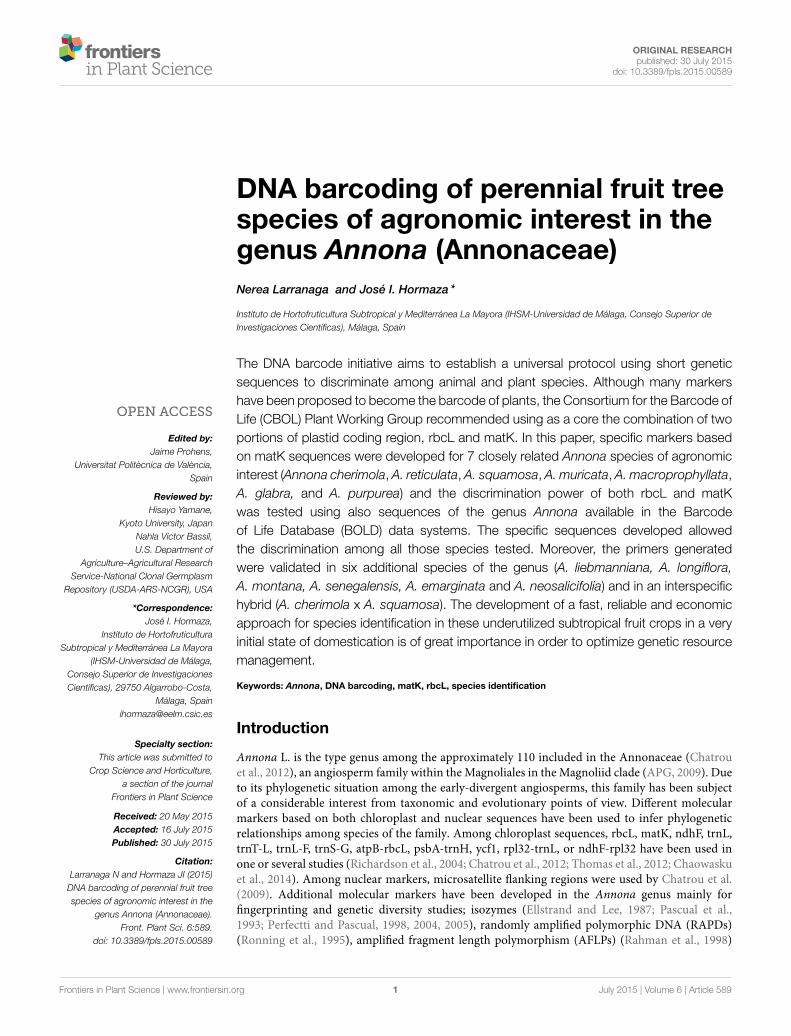
ORIGINAL RESEARCHpublished: 30 July 2015
doi: 10.3389/fpls.2015.00589
Frontiers in Plant Science | www.frontiersin.org 1 July 2015 | Volume 6 | Article 589
Edited by:
Jaime Prohens,
Universitat Politècnica de València,
Spain
Reviewed by:
Hisayo Yamane,
Kyoto University, Japan
Nahla Victor Bassil,
U.S. Department of
Agriculture–Agricultural Research
Service-National Clonal Germplasm
Repository (USDA-ARS-NCGR), USA
*Correspondence:
José I. Hormaza,
Instituto de Hortofruticultura
Subtropical y Mediterránea La Mayora
(IHSM-Universidad de Málaga,
Consejo Superior de Investigaciones
Científicas), 29750 Algarrobo-Costa,
Málaga, Spain
Specialty section:
This article was submitted to
Crop Science and Horticulture,
a section of the journal
Frontiers in Plant Science
Received: 20 May 2015
Accepted: 16 July 2015
Published: 30 July 2015
Citation:
Larranaga N and Hormaza JI (2015)
DNA barcoding of perennial fruit tree
species of agronomic interest in the
genus Annona (Annonaceae).
Front. Plant Sci. 6:589.
doi: 10.3389/fpls.2015.00589
DNA barcoding of perennial fruit treespecies of agronomic interest in thegenus Annona (Annonaceae)Nerea Larranaga and José I. Hormaza*
Instituto de Hortofruticultura Subtropical y Mediterránea La Mayora (IHSM-Universidad de Málaga, Consejo Superior de
Investigaciones Científicas), Málaga, Spain
The DNA barcode initiative aims to establish a universal protocol using short genetic
sequences to discriminate among animal and plant species. Although many markers
have been proposed to become the barcode of plants, the Consortium for the Barcode of
Life (CBOL) Plant Working Group recommended using as a core the combination of two
portions of plastid coding region, rbcL and matK. In this paper, specific markers based
on matK sequences were developed for 7 closely related Annona species of agronomic
interest (Annona cherimola, A. reticulata, A. squamosa, A. muricata, A. macroprophyllata,
A. glabra, and A. purpurea) and the discrimination power of both rbcL and matK
was tested using also sequences of the genus Annona available in the Barcode
of Life Database (BOLD) data systems. The specific sequences developed allowed
the discrimination among all those species tested. Moreover, the primers generated
were validated in six additional species of the genus (A. liebmanniana, A. longiflora,
A. montana, A. senegalensis, A. emarginata and A. neosalicifolia) and in an interspecific
hybrid (A. cherimola x A. squamosa). The development of a fast, reliable and economic
approach for species identification in these underutilized subtropical fruit crops in a very
initial state of domestication is of great importance in order to optimize genetic resource
management.
Keywords: Annona, DNA barcoding, matK, rbcL, species identification
Introduction
Annona L. is the type genus among the approximately 110 included in the Annonaceae (Chatrouet al., 2012), an angiosperm family within theMagnoliales in the Magnoliid clade (APG, 2009). Dueto its phylogenetic situation among the early-divergent angiosperms, this family has been subjectof a considerable interest from taxonomic and evolutionary points of view. Different molecularmarkers based on both chloroplast and nuclear sequences have been used to infer phylogeneticrelationships among species of the family. Among chloroplast sequences, rbcL, matK, ndhF, trnL,trnT-L, trnL-F, trnS-G, atpB-rbcL, psbA-trnH, ycf1, rpl32-trnL, or ndhF-rpl32 have been used inone or several studies (Richardson et al., 2004; Chatrou et al., 2012; Thomas et al., 2012; Chaowaskuet al., 2014). Among nuclear markers, microsatellite flanking regions were used by Chatrou et al.(2009). Additional molecular markers have been developed in the Annona genus mainly forfingerprinting and genetic diversity studies; isozymes (Ellstrand and Lee, 1987; Pascual et al.,1993; Perfectti and Pascual, 1998, 2004, 2005), randomly amplified polymorphic DNA (RAPDs)(Ronning et al., 1995), amplified fragment length polymorphism (AFLPs) (Rahman et al., 1998)

Larranaga and Hormaza DNA barcoding of Annona species
and, more recently, microsatellites (Escribano et al., 2004, 2007,2008a,b; Pereira et al., 2008; van Zonneveld et al., 2012).
Several species of the genus Annona produce edible fruitsand have been cultivated and used as a food source by pre-Columbian cultures in Central and South America (Popenoe,1989). Cultivation has continued to the present day and someof them now are incipient but prosperous crops in severaldeveloping countries with tropical and subtropical climates:cherimoya (Annona cherimola Mill.), sugar apple (A. squamosaL.), atemoya (Annona x atemoya Mabb., a hybrid between A.cherimola and A. squamosa), guanabana or soursop (A. muricataL.), custard apple (A. reticulata L.), ilama (A. macroprophyllataDonn. Sm.), pond-apple (A. glabra L.) or soncoya (A. purpureaMoc. & Sessé ex Dunal). All of them are native of the Neotropicsand only A. cherimola is adapted to subtropical climates inhigher elevations of Central and South America (from 1000 to2500m). Among those, cherimoya, sugar apple, guanabana, andatemoya show some commercial importance in various tropicaland subtropical regions whereas the other species are generallyused only locally with very limited or nonexistent production at acommercial scale. Production data are difficult to find for thosespecies with perhaps the exception of cherimoya which valuechains in South American countries have been recently studied(Vanhove and van Damme, 2013). The presence of interspecifichybrids and the lack of flowers and fruits during most ofthe year make rapid unequivocal identification of these speciesdifficult in the field, hindering studies in different areas such asdiversity evaluation and germplasm collection, conservation andmanagement. Consequently a fast and reliable molecular methodfor identification of closely related species of Annona will be animportant advance in those kinds of studies.
One of the best approaches to unequivocally identify speciesfrom leaf samples collected in the field is the use of DNAbarcoding techniques. DNA barcoding aims to the adoption,in a great scale, of a few short standardized genome portionsthat allows a complete species identification and discrimination,especially in cases where morphological identification is difficult.In 2004 the international initiative Consortium for the Barcodeof Life (CBOL) was founded for the development of a globalmethod for the identification of plant and animal species. Sixyears later, the International Barcode of Life (iBOL) was activatedfor the maintenance of the barcode reference library BOLD(Barcode of Life Data systems) (Ratnasingham and Hebert, 2007;Bhargava and Sharma, 2013). Since Hebert et al. (2003) proposedthe mitochondrial gene cytochrome c oxidase 1 (CO1) as thebarcode for animal species, it has been widely used (Hebert et al.,2003; Nicolas et al., 2012). In the case of plants, the CBOL PlantWorking Group recommended a two locus combination of thechloroplast ribulose-1, 5-bisphosphate carboxylase/oxygenaselarge subunit gene (rbcL) andmaturase K gene (matK) as the corebarcode (CBOL Plant Working Group, 2009). However, in somecases those two markers produce incomplete species resolution,especially in closely related taxa (Zhang et al., 2012) or recentlydiverged species (van Velzen et al., 2012). Consequently, the useof additional genome portions such as the internal transcribedspacer (ITS) and the second internal transcribed spacer (ITS2)from nuclear ribosomal DNA or the chloroplast psbA-trnH
intergenic spacer have been proposed (Kress et al., 2005; Chenet al., 2010; China Plant BOL Group et al., 2011; Hollingsworth,2011; Pang et al., 2012). In addition, the complete chloroplastgenome is increasingly being used as super-barcode due to itsspecies discrimination power, resolving some problems derivedfrom the single or multiple loci barcode techniques (Li et al.,2015).
In order to have a fast and reliable method to discernbetween closely related Annona species with agronomicinterest, in this work we developed species specific primersto unequivocally differentiate the seven most commonagronomically interesting Annona species present in Central andSouth America (Annona cherimola, A. reticulata, A. squamosa,A. muricata, A. macroprophyllata, A. glabra and A. purpurea)based on newly sequenced data. The sequences were validatedin 6 additional species of Annona and in an interspecific hybrid.The discrimination power of the most used plant barcode genes(rbcL and matK) was tested, using also additional Annonasequences available in the BOLD database and new sequencesobtained were registered in the GenBank data base webpage.
Materials and Methods
Plant MaterialLeaves from three different genotypes of each of seven Annonaspecies (Annona cherimola, A. reticulata, A. squamosa, A.muricata, A. macroprophyllata, A. glabra, and A. purpurea) weresampled in order to detect intraspecific variability. The materialswere either collected from the wild or from an ex situ Annonagermplasm collection maintained at the IHSM la Mayora inMálaga (Spain) at latitude 36◦45′N, longitude 4◦4′ Wand altitude35m above sea level. Their geographic origin and codes aredescribed in Table 1. All trees were previously identified inthe field using morphological characters. Leaf samples from 6additional Annona species (A. liebmanniana Baill., A. longifloraS. Watson, A. montana Macfad., A. senegalensis Pers., A.emarginata (Schltdl.) H. Rainer, and A. neosalicifolia H. Rainer.)and 5 atemoya hybrids (A. cherimola x A. squamosa), wereused in order to test the validity of the primers generated(Table 1).
DNA Extraction, PCR Amplification, Visualizationand SequencingPlant DNA extraction was performed from 50mg of youngleaf tissue by a modified CTAB method (Viruel and Hormaza,2004). Each PCR reaction contained 16mM (NH4)2SO4, 67mMTris-ClH pH 8.8, 0.01% Tween-20, 3mM MgCl2, 0.1mMeach dNTP, 0.3µM each primer, 20 ng genomic DNA and1 unit of BioTaq™ DNA polymerase (Bioline, London, UK)in a final volume of 15µl. For sequencing the final volumewas increased to 35µl maintaining the concentration of thedifferent ingredients. Universal primers and PCR protocols usedto amplify rbcL and matK genes were those proposed by thePlant Working Group of the Consortium for the Barcode of Life(www.barcoding.si.edu/plant_working_group.html). Primersdeveloped in this work are described in Table 2. PCRs were
Frontiers in Plant Science | www.frontiersin.org 2 July 2015 | Volume 6 | Article 589

Larranaga and Hormaza DNA barcoding of Annona species
TABLE 1 | Information of the plant material used.
GenBank accession number
Species Article code GB code Country of origin Coordinates (Longitude/Latitude) matK rbcL
A. cherimola Che1 FDJ Spain −4.0438/36.76006 KM068846 KM068867
A. cherimola Che2 SP74 Peru −4.0439/36.7604 KM068847 KM068868
A. cherimola Che3 Wild Honduras −88.17990/14.31218 KM068848 KM068869
A. reticulata Ret1 Wild Honduras −88.59383/14.57977 KM068849 KM068870
A. reticulata Ret2 Wild Honduras −87.18667/14.56833 KM068850 KM068871
A. reticulata Ret3 Wild Guatemala −90.00049/14.91117 KM068851 KM068872
A. squamosa Squ1 Aus2 Australia −4.04158/36.75799 KM068852 KM068873
A. squamosa Squ2 Asquts Unknown −4.04116/36.75443 KM068853 KM068874
A. squamosa Squ3 Wild Honduras −87.64287/14.56442 KM068854 KM068875
A. muricata Mur1 Amur1 Unknown −4.04146/36.75797 KM068855 KM068876
A. muricata Mur2 Wild Honduras −87.21413/14.07677 KM068856 KM068877
A. muricata Mur3 Wild Guatemala −90.88593/14.10615 KM068857 KM068878
A. macroprophyllata Mac1 Amacro3 Honduras −4.04212/36.76117 KM068858 KM068879
A. macroprophyllata Mac2 Wild Honduras −88.93664/14.55843 KM068859 KM068880
A. macroprophyllata Mac3 Wild Guatemala −91.75712/15.83533 KM068860 KM068881
A. glabra Gla1 Agla2 Unknown −4.04180/36.75841 KM068861 KM068882
A. glabra Gla2 Wild Honduras −88.86609/15.17136 KM068862 KM068883
A. glabra Gla3 Agla4 Unknown −4.04206/36.7611 KM068863 KM068884
A. purpurea Pur1 Wild Honduras −87.65640/14.60604 KM068864 KM068885
A. purpurea Pur2 Wild Honduras −87.94751/14.68543 KM068865 KM068886
A. purpurea Pur3 Wild Costa Rica −84.95000/10.78333 KM068866 KM068887
A. liebmanniana Lie1 Wild Honduras −87.43655/15.79678
A. longiflora Lon1 MA25S1 Mexico −4.04224/36.76108
A. montana Mon1 Amon1 Unknown −4.04178/36.75845
A. senegalensis Sen1 Asen1 Unknown −4.04187/36.7612
A. emarginata Ema1 Aema21 Paraguay −4.04212/36.76102
A. neosalicifolia Sal1 Aneo20 Paraguay −4.04124/36.75969
Atemoya Ate1 JT3 Breeding material −4.04125/36.75475
Atemoya Ate2 JT7 Breeding material −4.04113/36.7548
Atemoya Ate3 JT153 Breeding material −4.04132/36.75449
Atemoya Ate4 Ate Roja Breeding material −4.04147/36.75802
Atemoya Ate5 19Joy Breeding material −4.04204/36.75521
GB code refers to the code of the Germplasm Bank for the ex situ conserved material; “wild” stands for accessions not conserved ex situ.
carried out in an I-cycler (Bio-Rad Laboratories, Hercules, CA,USA) thermocycler using the following temperature profile: aninitial step of 1min at 94◦C, 35 cycles of 30 s at 94◦C, 30 s at60–69◦C (Table 2), and 1min at 72◦C, and a final step of 5min at72◦C. Amplicons were visualized in 1 or 3% agarose gels stainedwith Gel Red (1X).
Two multiplex PCR methods were developed for 6 of the7 specific markers, depending on their annealing temperature.At 65◦C, primers AChF1, AChR1, AChReF1, AReR1, AMuF1,AMuR1 were placed in the same master PCR mix, onlydecreasing the concentration of AChF1 and AChR1 from 0.3 to0.07µM. At 69◦C, primers ASquF1, ASquR1, AMaF1, AMaR1,AGlaF1, AGlaR1 were also used together increasing everyconcentration from 0.3 to 0.4µM.
Prior to sequencing, PCR solutions were purified withNucleoSpin R© Extract II (Macherey-Nagel). Sequencing wasdone by the fluorescent dye terminator sequencing method(Macrogen).
Barcode Sequence Quality and SpeciesDiscriminationAmplified matK and rbcL of the 21 different Annona DNAsamples belonging to 7 species were sequenced in the forwarddirection. Chromatograms were analyzed by Chromas Liteversion 2.1 (2012). The criteria used to establish an acceptablesequence were as follows (modified from Hanner, 2009): (i) endswere trimmed to minimize low quality base calls on each end;all bases were deleted until there were at least contiguous 10 pairbases with a PHRED score>20 (ii) bases with PHRED values lessthan 20 were recorded as N; (iii) sequences with more than 40%N base calls were deleted.
To assess the discriminatory power of both genes at the
specific level, the 42 sequences obtained, 21 of matK and
21 of rbcL, were aligned with MUSCLE implemented in thesoftware MEGA5 version 5.05 (Tamura et al., 2011) using thedefault options. Pairwise sequence distances were calculatedusing the Kimura-2-parameter (K2P) that takes into account
Frontiers in Plant Science | www.frontiersin.org 3 July 2015 | Volume 6 | Article 589

Larranaga and Hormaza DNA barcoding of Annona species
TABLE 2 | Details of the primers designed for identification of species of Annona including sequence, PCR melting and annealing temperatures,
expected PCR product size and target species.
Name Sense Sequence 5′-3′ Melting temp. (◦C) Annealing temp. (◦C) Expected size (bp) Specificity
AChF1 F GTATATGAATGTGAATCGGTATTC 58.3 65 396 Annona cherimola matK
AChR1 R TTGACTCCTTACTGCGGAAT 61.7
AChReF1 F GCTTCGGAATGATTTTCC 60.1 65 364 Annona reticulata matK
AReR1 R CGCCTTAGCCAACGATT 61.9
ASqF1 F CCATTTCCGTTTGTTCAAAC 62.2 69 315 Annona squamosa matK
ASqR1 R GGTAAGATTTCCATTTCTTCATC 59.8
AMuF1 F CATTTACGATCAACATCCTTTA 58.6 65 332 Annona muricata matK
AMuR1 R GAAGAATTTTGGCGTACACTTA 60.2
AMaF1 F ATACAAGATGCTCCCTCTTTG 60.2 69 644 Annona macroprophyllata matK
AMaR1 R TTAGCCAATGATCCAATCATT 61.2
AGlF1 F CGATCAACATCCTTTGGG 62.1 69 476 Annona glabra matK
AGlR1 R GCCGGCTTACTAATAGGGTT 61.3
APuF1 F TTCTTGTTCCTATATAATATTCATA 53.2 61 619 Annona purpurea matK
APuR1 R GAGAAAGATTTCTGTATATGCGT 58.5
1R_kim F ACCCAGTCCATCTGGAAATCTTGGTTC 52 Universal matK
3F_kim R CGTACAGTACTTTTGTGTTTACGAG
rbcLa_F F ATGTCACCACAAACAGAGACTAAAGC 55–54 Universal rbcL
rbcLa_R R GTAAAATCAAGTCCACCRCG
transitions and transversions, with the same software (Aubriotet al., 2013). For each species, when the maximum intraspecificdistance was lower than the minimum interspecific distance,discrimination was considered successful (CBOL Plant WorkingGroup, 2009). In addition, a tree based identification approachwas used. For that, all sequences of the genus Annona availablein BOLD for each of the two genes analyzed were downloaded(access 08/2012) (Ratnasingham and Hebert, 2007); in total 20sequences of matK belonging to 10 different species and 36sequences of rbcL belonging to 24 different species were available(Supporting Information 1). Two Neighbor Joining (NJ) treesof K2P distances were constructed using the same program andrunning 1000 bootstrap replicates (Figure 1).
Design of Species-specific MarkersIn order to design PCR-specific primers, newly sequencedalignments for matK and rbcL Annona DNA samples and thesequences downloaded from BOLD were used. Inter-speciespolymorphisms were studiedmanually using GENEDOC version2.7. Intraspecific variations were not considered. The genematK was selected for the development of 7 Annona specificmarkers. Pairs of specific primers were designed locating the3′ end of each primer in specific shared polymorphic regionscompared to the sequences that belonged to all the other species.Primers were designed to amplify targets of different length soPCR output could be determined by its position in a gel. Tocalculate melting temperatures and avoid as much as possibleinteraction among primers (also within different markers)we used the Multiple Primer Analyzer available at http://www.thermoscientificbio.com/webtools/multipleprimer (access02/2013). Primers designed are described in Table 2 andwere validated in 6 additional Annona species through PCRamplification of DNA and visualization of the amplificationfragments in agarose gels.
Results
Barcode Sequences Quality and SpeciesDiscriminationAll of the 42 sequences obtained fulfilled the established criteriato consider the sequencing reactions successful. Sequence sizesafter the trimming process varied from 752 to 820 bp in the caseof matK and from 470 to 528 in the case of rbcL. The numberof bases with a PHRED score below 20, so, therefore, substitutedby N, was between 0 and 7, with the exception of sample Mur2amplified with matK primers which had 61 bad quality bp (lessof 40% of the sequence). All sequences were uploaded to theGenBank database and their accession numbers are indicated inTable 1.
Intraspecific sequence variability was only found inA. muricata. The maximum intraspecific distance was thencompared to the minimum interspecific distance; in almost allcases the former was smaller than the latter (Table 3). Nucleotidesequence of the barcode gene matK could discriminate all 7species, while rbcL could not distinguish between A. cherimolaand A. squamosa samples.
The NJ trees obtained are shown in Figure 1. In thematK tree, new sequences from the 7 tested species groupedin different clusters. Besides, where applicable, sequencesfrom the same species (newly obtained in this work anddownloaded from BOLD) grouped together. In the case ofrbcL, all the 21 new sequences clustered by species exceptA. cherimola and A. squamosa, that were grouped together.Furthermore, sequences from the same species downloaded fromBOLD and the newly obtained sequences grouped togetherin the same cluster. Nevertheless, some species were mixed;in the cluster of A. cherimola and A. squamosa samples,three additional species (A. urbaniana, A. reticulata and A.pruinosa) downloaded from BOLD were present. A. holosericea
Frontiers in Plant Science | www.frontiersin.org 4 July 2015 | Volume 6 | Article 589

Larranaga and Hormaza DNA barcoding of Annona species
FIGURE 1 | Neighbor joining trees of pairwise K2P substitution rates using 41 matK sequences (A) and 57 rbcL sequences (B). Taxon codes are indicated
in Table 1 and Supporting information 1. Bootstrap values of 50% and above are shown on the clusters. The scale bar represents the substitution rate per site.
TABLE 3 | Intra- and interspecific 2KP distances among the new sequences obtained.
matK rbcL
Species (codes) Intraspecific distances Interspecific distances Intraspecific distances Interspecific distances
Min Max Min Max Min Max Min Max
A. cherimola (Che1, Che2, Che3) 0.000 0.000 0.008 0.023 0.000 0.000 0.000 0.013
A. reticulata (Ret1, Ret2, Ret3) 0.000 0.000 0.009 0.024 0.000 0.000 0.002 0.015
A. squamosa (Squ1, Squ2, Squ3) 0.000 0.000 0.008 0.021 0.000 0.000 0.000 0.013
A. muricata (Mur1, Mur2, Mur3) 0.000 0.001 0.009 0.023 0.000 0.000 0.004 0.015
A. macroprophyllata (Mac1, Mac2, Mac3) 0.000 0.000 0.011 0.023 0.000 0.000 0.002 0.023
A. glabra (Gla1, Gla2, Gla3) 0.000 0.000 0.014 0.018 0.000 0.000 0.009 0.018
A. purpurea (Pur1, Pur2, Pur3) 0.000 0.000 0.009 0.024 0.000 0.000 0.009 0.024
and A. spraguei BOLD samples appeared also in the samecluster.
Specific MarkersSeven markers were developed for 7 different Annona species.Details on the primer features and amplification conditions aresummarized in Table 2. Primer specificity was verified using 13samples of different Annona species (Supporting Information2). For each species, just one band appeared when the specificmarkers developed were used.
In order to optimize routine species identification twomultiplex PCR methods were developed. One for A. squamosa,A. macroprophyllata and A. glabra markers (all with 69◦Cannealing temperature), whose expected size ampliconsare 315, 644, and 476 bp respectively. The other, for A.cherimola, A. muricata and A. reticulata markers (all with
65◦C annealing temperature), whose expected size ampliconsare 396, 332, and 364 bp respectively. In addition, AChReF1hybridizes with A. cherimola sequences so, when added tothe same reaction than the AChR1 markers, a new band of271 bp appeared in the A. cherimola samples (SupportingInformation 3).
These markers could also be used to study interspecifichybrids. Five atemoya samples, a hybrid of A. cherimola andA. squamosa, were analyzed with both loci. Four of the hybridatemoyas where known to have A. cherimola as maternal parentand, as expected, those 4 samples only showed amplificationbands when amplified with the A. cherimola specific primers(Supporting Information 4). The fifth sample, for which thedirection of the cross was unknown, also showed this band whenamplified with the A. cherimola specific marker, indicating A.squamosa as the pollen donor.
Frontiers in Plant Science | www.frontiersin.org 5 July 2015 | Volume 6 | Article 589

Larranaga and Hormaza DNA barcoding of Annona species
Discussion
In this work we tested the two chloroplast loci, rbcL andmatK, proposed for the barcode of plants by the CBOL (CBOLPlant Working Group, 2009), for differentiation of speciesof agronomic interest in the genus Annona. Sequences ofother species of the genus present in the BOLD databasewere also included in the analysis. The results obtained bydistance analysis methods with 21 genotypes belonging to7 agronomical important Annona species showed almost nointraspecific variation, which could be due to the limited numberof samples analyzed. One criticism of this kind of analysesis that often a very few individuals per species are studiedor that incomplete geographic sampling is performed resultingin possible poor representation of the intraspecific variationor interspecific divergence, given rise to possible misleadingresults regarding barcoding gap and overlap between intra-and interspecific variation (Meyer and Paulay, 2005). Althoughfor some species the samples used here were obtained fromdifferent geographical areas, in other species the samples usedjust cover a small part of their distribution range; consequently,additional intraspecific variation could be present if samples fromother regions were included in the analysis. Locus rbcL coulddistinguish 5 of the 7 species, showing overlap between intra-and interspecific variation, while locus matK could distinguishall of them, since intraspecific distances were smaller thaninterspecific values, showing a barcode gap with the number ofspecies studied. Both rbcL and matK have been recommendedas core plant barcodes by CBOL (CBOL Plant Working Group,2009) although, as shown in this work, rbcL usually displays alower interspecific variation (Kress et al., 2005). Moreover, theuniversality of these two markers has been questioned in someparticular taxa (Chase et al., 2007; Roy et al., 2010).
This initial analysis was broadened with comparison withadditional sequences from other species of the genus Annonaavailable in the BOLD database using NJ trees. Tree-basedmethods are also used for the identification of query sampleswhen comparing its barcode sequences to a data set and theclustering position analyzed (van Velzen et al., 2012). Results,again, show a good performance of both genes, particularly ofmatK, since sequences from different individuals of the samespecies were grouped together in different clusters of the NJtree. The mixed presence of some species in the NJ trees couldbe explained by this lower identification power of rbcL (whenthis number of different species is used) or by errors in speciesidentification prior to uploading the sequences to the BOLDdatabase. A multilocus analysis was not carried out since matKcould discriminate all the species studied.
Newly obtained and BOLD matK sequences alignment wasalso used for the manual finding of specific polymorphic
nucleotides. These were used for the development of 7 specificmarkers, relying on the idea of diagnostic positions. In fact,character-based diagnosis methods are the other big group usedin traditional barcode techniques. They count just on relevantdiagnostic positions of the sequence that would support aparticular classification (DeSalle et al., 2005).
In the case of Annona species, the development of fast,reliable and economic tools, such as specific markers, toidentify these promising subtropical resources in a very initialstate of domestication is of great importance in order tooptimize genetic resource management. In addition, since thesemarkers are chloroplast based genes, their presence or absencein interspecific hybrids could serve to discern hybridizationprocesses in these species; some of them are known to hybridizeeasily (such as A. cherimola and A. squamosa) although someauthors (Zill and Mahdeem, 1998; George et al., 2002) havereported other hybrids in the genus (such as A. cherimolax A. reticulata or A. squamosa x A. diversifolia) at least asa result of artificial pollination. The markers described inthis work are appropriate for the discrimination of the mostimportant species of the genus from an agronomic point ofview although, since the genus Annona includes about 160species (Chatrou et al., 2012), additional work will be needed todevelop appropriate identification tools for all the species of thegenus.
Author Contributions
JH and NL conceived, designed the study and wrote the paper.NL performed the molecular experiments and analyzed the data.
Acknowledgments
This work was supported by Ministerio de Economía yCompetitividad – European Regional Development Fund,European Union (AGL2010-15140, AGL2013-43732-R), theBBVA Foundation (BIOCON 08 - 184/09) and INIA (RF2012-00010 and RFP2012-00016). NL was supported by an FPIfellowship from Ministerio de Economía y Competitividad. Wethank Javier Ajú for providing some sequences for primerdesign, Federico Albertazzi, Marlon Durón, Gustavo Fontechaand Margarita Palmieri for collecting some of the leaf samplesused in this work and Yolanda Verdún for technical assistance.
Supplementary Material
The Supplementary Material for this article can be foundonline at: http://journal.frontiersin.org/article/10.3389/fpls.2015.00589
References
APG, III. (2009). An update of the Angiosperm Phylogeny Group classification
for the orders and families of flowering plants: APG III. Bot. J. Linn. Soc. 161,
105–121. doi: 10.1111/j.1095-8339.2009.00996.x
Aubriot, X., Lowry, I. I. P. P., Cruaud, C., Couloux, A., and Haevermans,
T. (2013). DNA barcoding in a biodiversity hot spot: potential value
for the identification of Malagasy Euphorbia L. listed in CITES
Appendices I and II. Mol. Ecol. Resour. 13, 57–65. doi: 10.1111/1755-0998.
12028
Frontiers in Plant Science | www.frontiersin.org 6 July 2015 | Volume 6 | Article 589

Larranaga and Hormaza DNA barcoding of Annona species
Bhargava, M., and Sharma, A. (2013). DNA barcoding in plants: evolution and
applications of in silico approaches and resources. Mol. Phylogenet. Evol. 67,
631–641. doi: 10.1016/j.ympev.2013.03.002
CBOL Plant Working Group. (2009). A DNA barcode for land plants.
Proc. Natl. Acad. Sci. U.S.A. 106, 12794–12797. doi: 10.1073/pnas.0905
845106
Chaowasku, T., Thomas, D. C., van der Ham, R. W., Smets, E. F., Mols, J. B., and
Chatrou, L. W. (2014). A plastid DNA phylogeny of tribe Miliuseae: insights
into relationships and character evolution in one of the most recalcitrant major
clades of Annonaceae. Am. J. Bot. 101, 691–709. doi: 10.3732/ajb.1300403
Chase, M. W., Cowan, R. S., Hollingsworth, P. M., van den Berg, C., Madrinan, S.,
Petersen, G., et al. (2007). A proposal for a standardised protocol to barcode all
land plants. Taxon 56, 295–299.
Chatrou, L. W., Escribano, M. P., Viruel, M. A., Maas, J. W., Richardson, J. E.,
and Hormaza, J. I. (2009). Flanking regions of monomorphic microsatellite
loci provide a new source of data for plant species-level phylogenetics. Mol.
Phylogenet. Evol. 53, 726–733. doi: 10.1016/j.ympev.2009.07.024
Chatrou, L. W., Pirie, M. D., Erkens, R. H. J., Couvreur, T. L. P.,
Neubig, K. M., Abbott, J. R., et al. (2012). A new subfamilial and tribal
classification of the pantropical flowering plant family Annonaceae informed
by molecular phylogenetics. Bot J Linnn Soc, 169, 5–40. doi: 10.1111/j.1095-
8339.2012.01235.x
Chen, S. L., Yao, H., Han, J. P., Liu, C., Song, J. Y., Shi, L. C., et al. (2010). Validation
of the ITS2 region as a novel DNA barcode for identifying medicinal plant
species. PLoS ONE 5:e8613. doi: 10.1371/journal.pone.0008613
China Plant BOL Group, Li, D. Z., Gao, L. M., Li, H. T., Wang, H., Ge,
X. J. et al. (2011). Comparative analysis of a large dataset indicates that
internal transcribed spacer (ITS) should be incorporated into the core
barcode for seed plants. Proc. Natl. Acad. Sci. U.S.A. 108, 19641–19646. doi:
10.1073/pnas.1104551108
DeSalle, R., Egan, M. G., and Siddall, M. (2005). The unholy trinity: taxonomy,
species delimitation and DNA barcoding. Phil. Trans. R Soc. B 360, 1905–1916.
doi: 10.1098/rstb.2005.1722
Ellstrand, N. C., and Lee, J. M. (1987). Cultivar identification of cherimoya
(Annona cherimola Mill.) using isozyme markers. Sci. Hortic. 32, 25–31. doi:
10.1016/0304-4238(87)90013-6
Escribano, P., Viruel, M. A., and Hormaza, J. I. (2004). Characterization and
cross-species amplification of microsatellite markers in cherimoya (Annona
cherimolaMill., Annonaceae).Mol. Ecol. Notes 4, 746–748. doi: 10.1111/j.1471-
8286.2004.00809.x
Escribano, P., Viruel, M. A., and Hormaza, J. I. (2007). Molecular analysis of
genetic diversity and geographic origin within an ex situ germplasm collection
of cherimoya by using SSRs. J. Am. Soc. Hortic. Sci. 132, 357–367.
Escribano, P., Viruel, M. A., and Hormaza, J. I. (2008a). Development of 52
new polymorphic SSR markers from cherimoya (Annona cherimola Mill.):
transferability to related taxa and selection of a reduced set for DNA
fingerprinting and diversity studies. Mol. Ecol. Resour. 8, 317–321. doi:
10.1111/j.1471-8286.2007.01941.x
Escribano, P., Viruel, M. A., and Hormaza, J. I. (2008b). Comparison of different
methods to construct a core germplasm collection in woody perennial species
with SSR markers. A case study in cherimoya (Annona cherimola Mill.), an
underutilized subtropical fruit tree species. Ann. Appl. Biol. 153, 25–32. doi:
10.1111/j.1744-7348.2008.00232.x
George, A. P., Broadley, R. H., Nissen, R. J., and Hamill, S. D. (2002). Breeding new
varieties of atemoya (Annona spp. hybrids). Acta Hort. 575, 323–328.
Hanner, R. (2009). Data standars for barcode records in INSDC (BRis). Available
online at: http://barcoding.si.edu/pdf/dwg_data_standards-final.pdf. Accessed
March 2015
Hebert, P. D. N., Cywinska, A., Ball, S. L., and DeWaard, J. R. (2003). Biological
identifications through DNA barcodes. Proc. R. Soc. B. Biol. Sci. 270, 313–321.
doi: 10.1098/rspb.2002.2218
Hollingsworth, P. M. (2011). Refining the DNA barcode for land plants.
Proc. Natl. Acad. Sci. U.S.A. 108, 19451–19452. doi: 10.1073/pnas.111
6812108
Kress, W. J., Wurdack, K. J., Zimmer, E. A., Weigt, L. A., and Janzen, D. H. (2005).
Use of DNA barcodes to identify flowering plants. Proc. Natl. Acad. Sci. U.S.A.
102, 8369–8374. doi: 10.1073/pnas.0503123102
Li, X., Yang, Y., Henry, R. J., Rossetto, M., Wang, Y., and Chen, S. (2015).
Plant DNA barcoding: from gene to genome. Biol. Rev. 90, 157–166. doi:
10.1111/brv.12104
Meyer, C. P., and Paulay, G. (2005). DNA barcoding: error rates based on
comprehensive sampling. PLoS Biol. 3:e422. doi: 10.1371/journal.pbio.00
30422
Nicolas, V., Schaeffer, B., Missoup, A. D., Kennis, J., Colyn, M., Denys, C.,
et al. (2012). Assessment of three mitochondrial genes (16S, Cytb, CO1) for
identifying species in the praomyini tribe (Rodentia: Muridae). PLoS ONE
7:e36586. doi: 10.1371/journal.pone.0036586
Pang, X. H., Liu, C., Shi, L. C., Liu, R., Liang, D., Li, H., et al. (2012).
Utility of the trnH-psbA intergenic spacer region and its combinations
as plant DNA barcodes: a meta-analysis. PLoS ONE 7:e48833. doi:
10.1371/journal.pone.0048833
Pascual, L., Perfectti, F., Gutierrez, M., and Vargas, A. M. (1993). Characterizing
isozymes of Spanish cherimoya cultivars. Hort. Sci. 28, 845–846.
Pereira, M. F., Bandeira, L. F., Blanco, A. J., Ciampi, A. Y., and Coelho, A. S.
(2008). Development of microsatellite markers in Annona crassiflora Mart.,
a Brazilian Cerrado fruit tree species. Mol. Ecol. Resour. 8, 1329–1331. doi:
10.1111/j.1755-0998.2008.02275.x
Perfectti, F., and Pascual, L. (1998). Characterization of cherimoya germplasm by
isozyme markers. Fruit Varieties J. 52, 53–62.
Perfectti, F., and Pascual, L. (2004). Geographic variation for isozymes in
cherimoya (Annona cherimola Mill). Genet. Resour. Crop Ev. 51, 837–843. doi:
10.1007/s10722-005-0925-5
Perfectti, F., and Pascual, L. (2005). Genetic diversity in a wordwide collection of
cherimoya cultivars. Genet. Resour. Crop Ev. 52, 959–966. doi: 10.1007/s10722-
003-6093-6
Popenoe, H. (1989). Lost Crops of the Incas: Little-known Pof the Andes with
Promise for Worldwide Cultivation.Washington, DC: National Academy Press.
Rahman, M. S. M., Shimada, T., Yamamoto, T., Yonemoto, J. Y., and Yoshida,
M. (1998). Genetical diversity of cherimoya cultivars revealed by amplified
fragment length polymorphism (AFLP) analysis. Breeding Sci. 48, 5–10.
Ratnasingham, S., and Hebert, P. D. N. (2007). BOLD: the barcode of life
data system (www.barcodinglife.org). Mol. Ecol. Notes 7, 355–364. doi:
10.1111/j.1471-8286.2007.01678.x
Richardson, J. E., Chatrou, L. W., Mols, J. B., Erkens, R. H. J., and Pirie, M.
D. (2004). Historical biogeography of two cosmopolitan families of flowering
plants: annonaceae and Rhamnaceae. Phil. Trans. R. Soc. B Biol. Sci. 359,
1495–1508. doi: 10.1098/rstb.2004.1537
Ronning, C. M., Schell, J. R., and Gazit, S. (1995). Using randomly amplified
polymorphic DNA (RAPD) markers to identify Annona cultivars. J. Amer. Soc.
Hort. Sci. 120, 26–729.
Roy, S., Tyagi, A., Shukla, V., Kumar, A., Singh, U. M., Chaudhary, L. B.,
et al. (2010). Universal plant DNA barcode loci may not work in complex
groups: a case study with Indian Berberis species. PLoS ONE 5:e13674. doi:
10.1371/journal.pone.0013674
Tamura, K., Peterson, D., Peterson, N., Stecher, G., Nei, M., and Kumar, S. (2011).
MEGA5: molecular evolutionary genetics analysis using maximum likelihood,
evolutionary distance, and maximum parsimony methods. Mol. Biol. Evol. 28,
2731–2739. doi: 10.1093/molbev/msr121
Thomas, D. C., Surveswaran, S., Xue, B., Sankowsky, G., Mols, J. B., Keßler,
P. J. A., et al. (2012). Molecular phylogenetics and historical biogeography
of the Meiogyne-Fitzalania clade (Annonaceae): Generic paraphyly and late
Miocene-Pliocene diversification in Australasia and the Pacific. Taxon 61,
559–575.
Vanhove, W., and van Damme, P. (2013). Value chains of cherimoya (Annona
cherimola Mill.) in a centre of diversity and its on-farm conservation
implications. Trop. Cons. Sci. 6, 158–180.
van Velzen, R., Weitschek, E., Felici, G., and Bakker, F. T. (2012). DNA barcoding
of recently diverged species: relative performance of matching methods. PLoS
ONE 7:e30490. doi: 10.1371/journal.pone.0030490
van Zonneveld, M., Scheldeman, X., Escribano, P., Viruel, M. A., Van Damme,
P., Garcia, W., et al. (2012). Mapping genetic diversity of cherimoya (Annona
cherimola Mill.): application of spatial analysis for conservation and use
of plant genetic resources. PLoS ONE 7:e29845. doi: 10.1371/journal.pone.
0029845
Frontiers in Plant Science | www.frontiersin.org 7 July 2015 | Volume 6 | Article 589

Larranaga and Hormaza DNA barcoding of Annona species
Viruel, M. A., and Hormaza, J. I. (2004). Development, characterization
and variability analysis of microsatellites in lychee (Litchi chinensis Sonn.,
Sapindaceae). Theor. Appl. Genet. 108, 896–902. doi: 10.1007/s00122-003-
1497-4
Zhang, C. Y., Wang, F. Y., Yan, H. F., Hao, G., Hu, C. M., and Ge, X.
J. (2012). Testing DNA barcoding in closely related groups of Lysimachia
L. (Myrsinaceae). Mol. Ecol. Resour. 12, 98–108. doi: 10.1111/j.1755-
0998.2011.03076.x
Zill, G. E., and Mahdeem, H. (1998). General observations on hybridizing Annona
species. Proc. Fla. State Hort. Soc. 111, 314–315.
Conflict of Interest Statement: The authors declare that the research was
conducted in the absence of any commercial or financial relationships that could
be construed as a potential conflict of interest.
Copyright © 2015 Larranaga andHormaza. This is an open-access article distributed
under the terms of the Creative Commons Attribution License (CC BY). The use,
distribution or reproduction in other forums is permitted, provided the original
author(s) or licensor are credited and that the original publication in this journal
is cited, in accordance with accepted academic practice. No use, distribution or
reproduction is permitted which does not comply with these terms.
Frontiers in Plant Science | www.frontiersin.org 8 July 2015 | Volume 6 | Article 589

ANEXO 2 Larranaga N, Hormaza JI (2016) Advances in genetic diversity analysis in fruit
tree crops. Lüttge U, Cánovas FM, Matyssek R. Progress in Botany 77. Springer
International Publishing, Switzerland, 245-264.

Advances in Genetic Diversity Analysis
in Fruit Tree Crops
Nerea Larra~naga and Jose Ignacio Hormaza
Contents
1 Introduction . . . . . . . . . . . . . . . . . . . . . . . . . . . . . . . . . . . . . . . . . . . . . . . . . . . . . . . . . . . . . . . . . . . . . . . . . . . . . . . . . 246
2 Molecular Markers and Genetic Diversity in Fruit Tree Crops . . . . . . . . . . . . . . . . . . . . . . . . . . . 248
2.1 Main Types of Molecular Markers Used in Genetic Diversity Analyses in Fruit
Trees . . . . . . . . . . . . . . . . . . . . . . . . . . . . . . . . . . . . . . . . . . . . . . . . . . . . . . . . . . . . . . . . . . . . . . . . . . . . . . . . . . . 248
2.2 Evolution of the Use of Different DNA-Based Markers for Diversity Analyses
in Fruit and Nut Crops . . . . . . . . . . . . . . . . . . . . . . . . . . . . . . . . . . . . . . . . . . . . . . . . . . . . . . . . . . . . . . . . 250
2.3 Interpretation of the Results Obtained: Parameters and Software Tools . . . . . . . . . . . 251
3 Perspectives of Next-Generation DNA Sequencing (NGS) for Studies of Genetic
Diversity . . . . . . . . . . . . . . . . . . . . . . . . . . . . . . . . . . . . . . . . . . . . . . . . . . . . . . . . . . . . . . . . . . . . . . . . . . . . . . . . . . . . . 252
3.1 Next-Generation Sequencing . . . . . . . . . . . . . . . . . . . . . . . . . . . . . . . . . . . . . . . . . . . . . . . . . . . . . . . . . 252
3.2 Applications of NGS in Fruit and Nut Tree Crops . . . . . . . . . . . . . . . . . . . . . . . . . . . . . . . . . . 253
4 Use of Geographic Tools and Landscape Genetics in the Study of Genetic Diversity . . . 254
4.1 Geographic Information Systems . . . . . . . . . . . . . . . . . . . . . . . . . . . . . . . . . . . . . . . . . . . . . . . . . . . . . 254
4.2 Landscape Genetics . . . . . . . . . . . . . . . . . . . . . . . . . . . . . . . . . . . . . . . . . . . . . . . . . . . . . . . . . . . . . . . . . . . 255
5 Conclusions . . . . . . . . . . . . . . . . . . . . . . . . . . . . . . . . . . . . . . . . . . . . . . . . . . . . . . . . . . . . . . . . . . . . . . . . . . . . . . . . . . 256
References . . . . . . . . . . . . . . . . . . . . . . . . . . . . . . . . . . . . . . . . . . . . . . . . . . . . . . . . . . . . . . . . . . . . . . . . . . . . . . . . . . . . . . . 256
Abstract Critical advances in the application of molecular tools to analyze genetic
diversity in annual and perennial crops have taken place in the last two decades.
Although in most cases the new technologies are first developed in annual crops,
some particularities of most fruit crops, such as their perennial nature, long gener-
ation time, large individual size, or vegetative propagation, make the advantages of
using these new approaches even more relevant in these species. In this work, the
information available on the different strategies used to analyze genetic diversity in
temperate and tropical fruit tree species using molecular approaches is reviewed.
Special attention is given to the potential of next-generation sequencing and the
combination of genomic tools with geographic information systems.
N. Larra~naga • J.I. Hormaza (*)
Instituto de Hortofruticultura Subtropical y Mediterranea La Mayora (IHSM-UMA-CSIC),
Estaci�on Experimental La Mayora, Algarrobo-Costa, Malaga 29750, Spain
e-mail: [email protected]
© Springer International Publishing Switzerland 2016
U. Luttge et al. (eds.), Progress in Botany, Progress in Botany 77,
DOI 10.1007/978-3-319-25688-7_8
245

1 Introduction
Conservation and sustainable management of crop genetic resource diversity is the
key for guaranteeing food security for future generations since this will determine
the ability of populations and crops as a whole to adapt to environmental changes.
This is becoming increasingly important in the current scenario of global climatic
change where conserving genomic pools that will allow the development of resil-
ient cultivars to a wide range of biotic and abiotic stresses is an increasing necessity.
In this sense, it is important to keep in mind that conservation of plant genetic
resources worldwide has been concentrated on a small group of species. Thus, from
about 7,000 plant species that have been indeed used by humans (Hammer 2003),
currently about 30 species contribute to more than 90 % of human nutrition
globally, and just three cereals (wheat, rice, and maize) account for about
two-thirds of human dietary needs (Cassman 1999). Moreover, in order to be
effective in the long term, this conservation effort should also include crop wild
relatives that can be source of interesting genes (Ford-Lloyd et al. 2011).
Of the 30 most important crops in terms of production worldwide, only five can
be considered as fruit crops (bananas, oranges, grapes, apples, and mangoes)
(Faostat 2014) although perennial crops account for about one-eighth of the
world cultivated area (McClure et al. 2014). However, there are hundreds of
neglected and underutilized fruit crops that are important in specific local markets
and which cultivation can be extended in the future. As an example, it is considered
that less than 5 % of the edible tropical fruit trees are cultivated commercially
(Wijeratnam 2000) and just five species [banana (several species of the genus
Musa), mango (Mangifera indica), pineapple (Ananas comosus), avocado (Perseaamericana), and papaya (Carica papaya)] comprise more than 90 % of the export
of tropical fruits of those countries. In many cases, especially for underutilized fruit
tree crops, most of the extant diversity is present in developing countries, and,
consequently, the long-term conservation of their genetic resources is at risk since
the capacity for studying and managing germplasm collections, including qualified
personnel, is generally directly related to the degree of economic development of
the country where the collection is situated.
Common characteristics of most fruit crops compared to domesticated annual
crops are their perennial nature, long generation cycles, and long juvenile periods
that often limit breeding programs and hinder genetic conservation efforts. Addi-
tionally, most fruit crops are highly heterozygous and usually propagated vege-
tatively favoring the cultivation of a few clones of selected cultivars. As a result,
often the genetic diversity found in most of the commercially cultivated fruit tree
crops is low (McClure et al. 2014). However, while most annual crops have been
domesticated over a long period of time, only very few woody perennial tree
species can be considered as truly domesticated. Consequently, most are separated
by few generations from their wild relatives which can become interesting sources
of additional genes.
246 N. Larra~naga and J.I. Hormaza
The significant loss in biodiversity during the last decades has resulted in an
increasing interest worldwide in conservation of plant genetic resources as shown
through different national/international agreements and treaties such as the Con-
vention on Biological Diversity in 1992 (http://www.cbd.int/history/) or the Inter-
national Treaty on Plant Genetic Resources for Food and Agriculture in 2001
(http://www.planttreaty.org/), among many others. Genetic diversity, which can
be defined as the amount of genetic variability among individuals of a variety,
population, or species (Brown 1983), can be preserved through the conservation of
germplasm. This can be performed both in situ and ex situ, two complementary
approaches that, especially for the in situ component, should be integrated into a
sustainable development strategy in the regions where biodiversity is present. In
situ conservation of agricultural biodiversity can be carried out through the preser-
vation of protected wild areas and/or the preservation of traditional cultivated fields
(“on farm” conservation). The latter also includes the accompanying traditional
agricultural methods and knowledge of local farmers and preserves interaction that
takes place in ecosystems and, thus, the coevolution between all the elements that
generate new diversity. Ex situ conservation programs preserve isolated genotypes
(e.g., vegetative field collections, seeds, or in vitro culture banks). Most current ex
situ germplasm collections show important limitations in the number of accessions
and in the genetic variability and quality of the samples conserved. This situation is
aggravated for certain species with recalcitrant seeds, such as many fruit trees,
where conservation is not performed through seed collections but in living field
collections which are very expensive to maintain. At least two complementary
approaches can be envisaged to reduce maintenance costs in perennial fruit tree
species. One approach involves the development of core collections that represent
most of the diversity conserved in a small number of genotypes (van Hintum
et al. 2000; Escribano et al. 2008). Another approach is based on a shift toward
on-farm management of agrobiodiversity as a form of in situ conservation for the
use of plant genetic resources in a dynamic production system (Hammer 2003). In
any case, the establishment of appropriate measures for the conservation of the
extant diversity in any crop species requires the availability of appropriate infor-
mation on the distribution and structure of its current diversity.
Characterization of conserved and existent but as yet still unexplored genetic
diversity is necessary to preserve the genetic resources of crop species for a
sustainable use by future generations. The optimization of the management of
genetic resources requires not only a precise identification and evaluation of the
accessions already conserved but also to establish where hot spots of diversity exist
in order to provide guidelines for future conservation of as yet non-collected
variability. Recent advances in molecular genetics and the application of geo-
graphic information systems could represent new opportunities both for the man-
agement of biodiversity in situ and for the conservation of biodiversity in ex situ
germplasm collections.
In this chapter we will focus on the most popular approaches used in recent years
to study genetic diversity of fruit trees, with special attention to molecular tech-
niques and the application of spatial analysis tools.
Advances in Genetic Diversity Analysis in Fruit Tree Crops 247

2 Molecular Markers and Genetic Diversity in Fruit Tree
Crops
Traditionally, genotype identification and diversity studies in cultivated plant
species including fruit trees have been carried out through morphological markers
and phenotypic trait characterization. However, this is a slow and expensive
process that limits the number of genotypes that can be studied as well as the
accuracy of the observations. Some of those observations, like those related to
phenological characters, need to be analyzed late in development, and some can
affect other morphological characters or agronomical traits due to pleiotropic gene
action (Le Corre and Kremer 2003). Although these observations can still be very
useful tools to match phenotype with genotype and a good phenotyping is ulti-
mately needed to link molecular markers with traits of interest, genotype charac-
terization and genetic diversity studies in plants require research strategies that
complement phenotypic characterization and estimation of diversity such as mole-
cular techniques (Wunsch and Hormaza 2002). During the last two decades, fast and
important advances in the methods used to study nucleic acids in both animals and
plants have taken place resulting in the continuous development of different types of
genetic markers. These allow reliable estimations of allelic richness reflected in the
number and distribution of alleles per locus, which is the main parameter to measure
genetic diversity. This information can be used to analyze the population structure
of in situ and ex situ germplasm collections and wild stands of cultivated species
and crop wild relatives in order to develop appropriate strategies to optimize the
conservation of genetic diversity.
2.1 Main Types of Molecular Markers Used in GeneticDiversity Analyses in Fruit Trees
Molecular markers can be biochemical or based on DNA sequences. Biochemical
markers involve the separation of proteins (allozymes and isozymes) into specific
banding patterns by electrophoresis. They are codominant, and their main dis-
advantage is that the number of available enzymes is limited and, thus, their power
to analyze diversity is reduced (Mondini et al. 2009). They have been used since the
1970s to analyze genetic diversity in plants (Brown 1978), but they can still provide
valuable information for diversity studies in fruit trees shown in some recent works
in apple (Wagner et al. 2014), hazelnut (Leinemann et al. 2013), or Arbutus unedo(Takrouni et al. 2012).
DNA-based markers, commonly known as molecular markers, have been conti-
nuously developed since the 1980s and can be associated or not to a functional trait;
they can, in general terms, be classified into dominant (such as RAPDs or
AFLPs) or codominant (such as RFLPs, microsatellites, or SNPs) markers
depending on whether heterozygous and homozygous genotypes can be
248 N. Larra~naga and J.I. Hormaza

distinguished. RFLPs, widely used since Alec Jeffreys discovered the poly-
morphism in the fragment size after treating the DNA with restriction enzymes
(Jeffreys 1979), have been applied in numerous works to assess fruit tree diversity;
although due to the availability of new molecular approaches their application for
genetic diversity studies is in disuse, some recent examples can still be found in
fruit tree crops (Garcia-Ruiz et al. 2013).
Since the development of PCR in the mid-1980s by the Noble Prize winner in
Chemistry 1993, Kary Mullis (Mullis et al. 1986), different types of PCR-based
molecular markers have been developed. Among those routinely used in ecological,
evolutionary, taxonomic, phylogenetic, and genetic diversity studies are randomly
amplified polymorphic DNAs (RAPDs), in which fragments of genomic DNA are
amplified using a decamer primer of random sequence and where polymorphism
depends upon the presence or absence of an amplification product. They started to
be used in different organisms in the late 1980s (Williams et al. 1990) and have
been used extensively in a wide range of fruit tree crops; recent examples include
pomegranate (Mansour et al. 2015), olive (Brake et al. 2014), apricot (Yilmaz
et al. 2012), or mango (Samal et al. 2012). Amplified fragment length poly-
morphisms (AFLPs) (Vos et al. 1995) combine RFLP and PCR techniques. They
have also been used in studies of diversity of different plant species (Mba and
Tohme 2005); recent examples in fruit trees include Prunus mira (Li et al. 2014a),
date palm (Sabir et al. 2014), or kiwifruit (Li et al. 2014b). Simple sequence repeats
(SSRs) or microsatellites (Litt and Luly 1989), based in the presence of repetitive
DNA sequences in eukaryote genomes flanked by specific conserved regions that
allow their amplification by PCR, became the markers of choice for fingerprinting
and diversity analyses in recent years (Ellegren 2004; Kalia et al. 2011; Arias
et al. 2012). Some recent examples of their use for diversity studies in fruit trees
include grapevine (Basheer-Salimia et al. 2014), apricot (Raji et al. 2014; Martin
et al. 2011), chestnut (Beghe et al. 2013), litchi (Madhou et al. 2013), or pear (Sehic
et al. 2012). Additional PCR-based markers used to some extent are inter-simple
sequence repeats (ISSRs), applied, for example, in fig (Amel et al. 2004, 2005;
Ikegami et al. 2009) or clementine (Breto et al. 2001); cleaved amplified poly-
morphisms (CAPs) used, for example, in Citrus spp. (Amar et al. 2011); sequenced
characterized amplified regions (SCARs) used, for example, in persimmon (Cho
et al. 2013); or sequence-tagged sites and expressed sequence tags (STS and ESTs,
respectively) used, for example, in Musa acuminata (Passos et al. 2012) or
Actinidia spp. (Crowhurst et al. 2008). Other less used molecular markers include
start codon targeted polymorphisms (SCoT) that uses single primers designed to
anneal to the flanking regions of the ATG initiation codon on both DNA strands and
has been used in Mangifera indica (Gajera et al. 2014; Luo et al. 2011) and SRAP
and TRAP, which stand for sequence-related amplified polymorphism and targeted
region amplified polymorphism, respectively, that have been used in several fruit
tree species. In the case of SRAP, recent works in fruit trees include apricot
(Li et al. 2014c), persimmon (Jing et al. 2013a), or almond (Jing et al. 2013b),
and, in the case of TRAP, apple (Guo et al. 2009). Another group of markers is
based on mobile elements; examples include inter-retrotransposon amplified
Advances in Genetic Diversity Analysis in Fruit Tree Crops 249

polymorphism (IRAP) that has been used in Musa spp. (Nair et al. 2005) or
Diospyros spp. (Du et al. 2009a, b), the retrotransposon-microsatellite amplified
polymorphism (REMAP) that has been used in Diospyros spp. (Du et al. 2009a, b)
or Prunus mume (Shen et al. 2011), retrotransposon-based insertion polymorphism
(RBIP) in Pyrus pyrifolia (Kim et al. 2012), or the retrotransposon-based sequence-
specific amplification polymorphism (SSAP) in Anacardium occidentale (Syed
et al. 2005) or Diospyros spp. (Du et al. 2009a, b).
More recently, simple nucleotide polymorphisms (SNPs), which are variations
of single nucleotides which do not change the overall length of the DNA sequence
in the region and occur throughout the genome, are being increasingly used (FAO
1997; de Vicente et al. 2004) especially due to the increasingly more economic
availability of next-generation sequencing methods (see next section).
Whereas the previous markers usually target nuclear DNA, chloroplast and
mitochondrial DNA can also be used to some extent to estimate genetic diversity
although they are more useful at the interspecific level due to the usually low level
of intraspecific polymorphism. Chloroplast and mitochondrial DNA analysis are of
common use in barcode and phylogenetic studies in plant and animals, respectively,
and they can be useful tools to assign unknown sample to the correct species and
avoid errors that can affect the results obtained in genetic diversity analyses
(Larra~naga and Hormaza 2015).
2.2 Evolution of the Use of Different DNA-Based Markersfor Diversity Analyses in Fruit and Nut Crops
Although genetic diversity studies in annual crops clearly outnumber those in
woody perennial crops, a great number of studies have been published on the
application of molecular markers to study genetic diversity in temperate and
tropical fruit tree crops. Thus, a basic search in the ISI web of knowledge for the
seven most common types of markers (AFLP, ISSR, RAPD, SSR, RFLP, SNP
+EST, and NGS), with the keyword “diversity”, and 32 important genera of
temperate and tropical tree fruit crops (Actinidia, Anacardium, Annona, Averrhoa,Carica, Carya, Castanea, Citrus, Cocos, Cydonia, Dimocarpus, Diospyros,Eryobotria, Ficus, Juglans, Litchi, Malus, Mangifera, Musa, Olea, Passiflora,Persea, Phoenix, Pistacia, Prunus, Psidium and Vitis) provides the following
results as of February 2015: 1,229 studies for SSRs, 776 for RAPDs, 418 for
AFLPs, 236 for RFLPs, 193 for ISSRs, 159 for SNP+EST, and 25 for NGS.
These results are represented in Fig. 1 by year to show the variation in the number
of studies with time. It is interesting to note that, although new molecular marker
technologies are being developed continuously, some of the ones used 20 years ago
(such as RAPDs) are still being used.
Molecular markers have been mainly used in fruit tree species commercially
important at a global level; those include, for example, Prunus spp., Malus spp.,
250 N. Larra~naga and J.I. Hormaza

Citrus spp., Vitis vinifera, or Theobroma cacao. However, some works have also
been performed in crops that can be considered as “neglected” or “underutilized”
species such as the Ethiopian banana, Ensete ventricosum (Birmeta et al. 2004);
highland papayas, Vasconcellea sp. (van Droogenbroeck et al. 2004, 2006); cheri-
moya, Annona cherimola (Escribano et al. 2007; van Zonneveld et al. 2012); guava,Psidium guajava (Coser et al. 2012); or baobab, Adansonia digitata (Munthali
et al. 2013). An additional set of studies have also focused on fruit tree crop wild
relatives (CWR) such as Rubus idaeus (Graham et al. 2003); Pistacia khinjuk andPistacia atlantica (Shanjani et al. 2009); Olea europaea subsp. cuspidata(Koehmstedt et al. 2011);Malus sylvestris,M. orientalis, andM. sieversii (Cornilleet al. 2013); or Citrus macroptera (Malik et al. 2013). The characterization and
conservation of genetic diversity in CWRs is becoming of increasing interest
especially in the current context of climate change since they can be useful to
incorporate into crops a range of useful genes to increase resiliency and productiv-
ity (Warschefsky et al. 2014). Clearly, additional resources and international
cooperation networks should be devoted to address diversity studies and germplasm
conservation programs in those two last groups, neglected and CWR species (Ford-
Lloyd et al. 2011; Mba et al. 2012).
2.3 Interpretation of the Results Obtained: Parametersand Software Tools
The variances or polymorphisms shown by the different molecular markers can be
analyzed with a range of different diversity parameters based (i) on the number of
variants (number of percentage of polymorphic loci or allelic richness, i.e., mean
number of alleles per locus) or (ii) on the frequencies of the alleles obtained
(effective population size, expected and observed heterozygosities, or fixation
index). Genetic diversity between different (sub)populations/collections is based
on significant differences in allele frequencies among the different groups that can
020406080
100120140160180
1990 1995 2000 2005 2010 2015
AFLP
ISSR
RAPD
SSR
RFLP
SNP+EST
NGS
Fig. 1 Number of studies per year and per type of molecular marker shown by the Web of
knowledge
Advances in Genetic Diversity Analysis in Fruit Tree Crops 251

be estimated with F-statistics, Rst, Gst, or AMOVA, among others. In addition,
graphic representation of genetic distances and cluster analyses are usually
performed to visualize relationships among the different genotypes studied.
Although this is starting to change due to the increasing availability of new
generation sequencing technologies, usually just a small portion of the genome is
explored in most genetic diversity studies, and, thus, the selection of a correct
amount of individuals and loci to be analyzed is of great importance to make
reliable extrapolation from the estimators to the natural populations or germplasm
collections (de Vicente et al. 2004; Mondini et al. 2009; Porth and El-Kassaby
2014). Different software packages have been developed in the last two decades to
obtain these genetic diversity measures; among them, some of the most commonly
used are Genepop (Raymond and Rousset 1995), Popgene (Yeh et al. 1997),
Arlequin (Excoffier et al. 2005), PowerMarker (Liu and Muse 2005), Ntsys-pc
(Rohlf 2008), GenAlEx (Peakall and Smouse 2012), and Mega (Tamura
et al. 2013). In addition, several software packages based in R (www.r-project.
org) also allow the analysis of marker data for genetic diversity studies; among
them, the most commonly used are Hierfstat (Goudet 2005), Adegenet (Jombart
2008), and DiveRsity (Keenan et al. 2013). The genetic structure of populations can
be assessed using a method developed by Pritchard et al. (2000) implemented in the
software program Structure. The program assigns probable individual haplotypes to
multiple clusters relying on the allele frequencies at each locus identifying clusters
of individuals on the basis of their genotypes at multiple loci using a Bayesian
approach.
3 Perspectives of Next-Generation DNA Sequencing (NGS)
for Studies of Genetic Diversity
3.1 Next-Generation Sequencing
During the 1970s, two different sequencing methods were developed by Frederick
Sanger and Allan Maxam and Walter Gilbert, respectively (Sanger et al. 1977;
Maxam and Gilbert 1977). The first became widely used for more than 25 years. In
2001, when the first draft of the human genome project was released, the scientific
community started to look for cheaper and other approaches not based on cloning
fragments (Mardis 2008). It was not until 2004 that next-generation DNA sequenc-
ing methods, sometimes classified in second and third generation automatic
sequencers, depending whether prior amplification of the DNA template is needed
(Glenn 2011), appeared in the market. These technologies provide several advan-
tages and have revolutionized many areas in biology since they allow genome-wide
characterization and profiling of mRNAs, small RNAs, transcription factor regions,
structure of chromatin and DNA methylation patterns, microbiology, and
metagenomics (Ansorge 2009). The main characteristic of these techniques is the
252 N. Larra~naga and J.I. Hormaza

possibility of performing massive sequencing in a parallel manner, which means
that the number of sequences obtained in a single run is much higher than before.
But probably the most important fact that is making possible the widespread use of
these technologies is their continuously decreasing prices. Generally studies based
on NGS have been applied to a single or to a small number of samples although
multiplexing is allowing the application of NGS to larger data sets (Harrison and
Kidner 2011).
Although the sequencing biochemistry differs among the different methods, the
basic steps of most of the next-generation sequencers are similar, involving DNA
fragmentation, in vitro adaptor ligation, generation of clonally clustered amplicons,
and cyclic sequencing (Shendure and Ji 2008). Massively parallel scale of data
production requires enormous computational analysis that includes image analysis,
signal processing, background subtraction, base calling, and quality assessment to
produce the final sequence reads for each run (Mardis 2008). Magi et al. (2010)
reviewed several available software packages for the alignment of sequence reads
to a reference, base-calling and/or polymorphism detection, de novo assembly from
paired or unpaired reads, structural variant detection, and genome browsing.
3.2 Applications of NGS in Fruit and Nut Tree Crops
These NGS techniques are allowing to obtain sequences of entire genomes.
Although the number of sequenced genomes is much higher in annual crops,
there are some examples of published whole genome sequences in fruit tree crops
such as grapevine (Vitis vinifera, Jaillon et al. 2007), papaya (Carica papaya, Ming
et al. 2008), apple (Malus domestica, Velasco et al. 2010), date palm (Phoenixdactylifera, Al-Dous et al. 2011), cacao (Theobroma cacao, Argout et al. 2011;Motamayor et al. 2013), peach (Prunus persica, Arus et al. 2012; Verde et al. 2013),Japanese apricot (Prunus mume, Zhang et al. 2012), banana (Musa acuminata,D’Hont et al. 2012), Chinese white pear (Pyrus bretschneideri, Wu et al. 2013),
orange (Citrus sinensis, Xu et al. 2013), or wild banana (Musa balbisiana, Daveyet al. 2013), and the number of species will surely increase dramatically in the
next years.
NGS technologies are permitting to reach every nucleotide on a genome and,
thus, variants, common and rare, can be discovered with the appropriate sequencing
read coverage and algorithm methods to identify them (Koboldt et al. 2013). In
other words, these methodologies allow to detect genomic variation on a wide scale,
from single nucleotide polymorphisms (SNPs) to copy number variations in large
sequences blocks (Mardis 2008), being a technology with huge potential to allow
the study of genetic/genomic diversity, even in non-model species (Garvin
et al. 2010). In this sense, one of the most promising recent uses of new generation
sequencing technologies is the genotyping-by-sequencing (GBS) approach that
provides a high-throughput and cost-effective tool for a genome-wide analysis of
genetic diversity (Spindel et al. 2013; Peterson et al. 2014). One of the main
Advances in Genetic Diversity Analysis in Fruit Tree Crops 253

advantages of this approach is that it does not require a reference genome and
allows the development of thousands of SNPs becoming an excellent tool espe-
cially for species in which genomic data are limited, such as most fruit tree crops.
Deschamps et al. (2012) reviewed the applications of this technology in plant
science.
Recently, new generation sequencing approaches have started to be used for
diversity analyses in some fruit tree crops. Thus, in date palm (Phoenix dactylifera),nine different varieties were analyzed using NGS technologies, and 3.5 million
polymorphic sites were found, including more than 10,000 genic copy number
variations (Al-Dous et al. 2011). Kaya et al. (2013) analyzed the transcriptome and
genome of five different olive genotypes (Olea europaea) obtaining 126,542,413
reads of cDNA. After assembling, SNPs were filtered and 2,987 high-quality
putative SNPs were identified. From three European pear (Pyrus communis) culti-vars, using NGS technologies, a subset of 1,096 SNPs were developed into infor-
mative markers by combining them with a set of 7,692 apple SNPs (Montanari
et al. 2013).
Initiatives like the Genome Database for Rosaceae (GDR) (http://www.rosaceae.
org/node/1) which is a curated and integrated web-based relational database that
provides centralized access to Rosaceae genomics, genetics and breeding data and
analysis tools to facilitate basic, translational, and applied Rosaceae research should
be extended to other groups of fruit trees in the next future. In this sense, Russell
et al. (2014) have recently developed an open-access, online database, tropiTree
(http://bioinf.hutton.ac.uk/tropiTree). Here, simple sequence repeat (EST-SSR)
markers for a range of 24 tropical tree species, encountered by bar-coded
multiplexed paired-end Illumina NGS, are available to new genetic diversity
studies. The sequences developed could also be used for SNP discovery. In fact,
sequences already uploaded to databases could serve for developing this promising
genome-wide genotyping application; for instance, Sun et al. (2013) downloaded
sequences of two Prunus mume cultivars and developed SNPs, indels and SSRs
from them.
4 Use of Geographic Tools and Landscape Genetics
in the Study of Genetic Diversity
4.1 Geographic Information Systems
Spatial considerations have to be taken into account in order to understand evolu-
tion and, consequently, the development and maintenance of distinct genotypes,
population differentiation, and, thus, diversity analysis and conservation (Jarvis
et al. 2005). Understanding the spatial patterns of the genetic diversity and popu-
lation structure of a species can contribute to improve knowledge of temporal and
spatial dynamics (Thomas et al. 2012) and optimize diversity conservation and
management projects by providing information on how diversity is distributed.
254 N. Larra~naga and J.I. Hormaza
Guarino et al. (2002) stressed the importance of geographic information systems
(GIS) as a tool to handle spatial data in graphic form like the location of the
presence points and related different set of nonspatial data, such as species name
and morphological, agronomical, or molecular data. GIS can then complement the
information obtained from molecular markers to assess the influence of the envi-
ronment on the presence of specific alleles providing new insights on genotype x
environment interactions. GIS and ecogeographical analysis can then be applied for
planning efficient germplasm collection, conservation, characterization, or man-
agement. The availability of increasing desktop processing power and the wide-
spread use of GPS receivers allow a detailed study of the spatial components of
diversity. There are several software packages available that can handle this type of
information, and, besides allowing a spatial visualization of the data, they allow
performing multiple statistical analyses. Among the free programs available online,
some widely used are QGIS (http://www2.qgis.org/es/site/), DIVA-GIS (http://
www.diva-gis.org/), or Grass (http://grass.osgeo.org/), whereas among those that
require a license, the most popular is ArcGIS (https://www.arcgis.com/features).
Several recent works analyzing genetic diversity of fruit trees have used a spatial
approach for obtaining different diversity indexes both with morphological or
molecular data: Annona cherimola (van Zonneveld et al. 2012) or Theobromacacao (Thomas et al. 2012). The information obtained can be useful to propose
different approaches for establishing priorities in conservation based on that diver-
sity as has been shown in Annona cherimola (van Zonneveld et al. 2012) or Prunusafricana (Vinceti et al. 2013).
4.2 Landscape Genetics
A step forward would be the application of landscape genetics, an approach that
combines landscape ecology and population genetics to provide information about
microevolutionary processes, such as gene flow and genetic drift and selection
(Manel et al. 2003; Manel and Holderegger 2013). The main goal of this new
approach is to combine the high resolution obtained from molecular information
with spatial data and a variety of statistical methods to evaluate the role that
landscape variables play in shaping genetic diversity and population structure
(Storfer et al. 2007). A recent and thorough review (Storfer et al. 2010) has
described the different topics that have been so far addressed by landscape genetics
which include identifying specific barriers to dispersal, quantifying diversity,
inferring the effects of landscape change, identifying migrants in relation to land-
scape conditions, estimating source-sink dynamics, predicting spread of disease or
invasive species, and comparing observed genetic patterns between contemporary
and historic landscapes. According to Holderegger et al. (2010), three different
approaches are currently the most used to assess genetic flow, landscape distance/
resistance, the overlay technique, and the assessment of contemporary gene flow.
Storfer et al. (2010) reported that by 2010, landscape studies had been used mainly
on vertebrates (62 %), invertebrates (18 %), and plants (14.5 %), followed by
Advances in Genetic Diversity Analysis in Fruit Tree Crops 255
bacteria (3 %), viruses (3 %), lichens (1 %), and fungi (0.5 %). Recently, landscape
genetics has started to be applied to studies of genetic diversity and gene structure
in some fruit tree crops such as Castanea sativa (Martin et al. 2012) or Juglansregia (Pollegioni et al. 2014). A new toolbox for ArcGIS has been created by
Vandergast et al. (2011) to map patterns of genetic divergence and diversity using a
landscape genetic approach.
5 Conclusions
Conservation and sustainable use of genetic diversity in fruit tree crops is a global
commitment for present and future generations. Locating neutral genetic diversity
could be a starting point for selecting material for both conservation and agronomic
assessment/breeding programs. As it has been shown in this review, studies of
genetic diversity in most fruit trees still use a combination of traditional morpho-
logical and molecular markers, although NGS methods will likely replace them
since they provide larger amount of information for a continuously decreasing
price. In addition, bioinformatic systems to analyze the increasingly larger data
sets are also continuously improving both in terms of costs and analyzing power.
On the other hand, it is necessary to keep in mind that the huge amount of molecular
data that are becoming available will still need phenotypic studies. A paradigm shift
that is already taking place is that, in many cases, appropriate phenotyping rather
than genotyping is becoming the main limiting factor. Association between nucleo-
tide sequences and functional traits will be needed for agronomic, genetic mapping,
functional diversity, breeding, or evolutionary studies. The combination of geo-
graphic information systems and vast molecular data sets that will be available in
the following years as a result of NGS has a huge potential to both estimate the
genetic diversity in a spatial context and to understand the structure and evolution
of populations and domestication processes. This would be applicable to both wild
and cultivated fruit trees.
Acknowledgments This work was supported by the Spanish Ministerio de Economıa y
Competitividad—European Regional Development Fund, European Union (AGL2013-43732-
R), and INIA (RF2012-00010 and RFP2012-00016). NL was supported by an FPI fellowship
from the Spanish Ministerio de Economıa y Competitividad.
References
Al-Dous EK, George B, Al-Mahmoud ME, Al-Jaber MY, Wang H, Salameh YM, Al-Azwani EK,
Chaluvadi S, Pontaroli AC, DeBarry J, Arondel V, Ohlrogge J, Saie IJ, Suliman-Elmeer KM,
Bennetzen JL, Kruegger RR, Malek JA (2011) De novo genome sequencing and comparative
genomics of date palm (Phoenix dactylifera). Nat Biotechnol 29:521–527
256 N. Larra~naga and J.I. Hormaza
Amar MH, Biswas MK, Zhang Z, Guo WW (2011) Exploitation of SSR, SRAP and CAPS-SNP
markers for genetic diversity of Citrus germplasm collection. Sci Hortic 128:220–227
Amel SH, Mokhtar T, Salwa Z, Jihene H, Messaoud M, Abdelmajid R, Mohamed M (2004) Inter-
simple sequence repeat fingerprints to assess genetic diversity in Tunisian fig (Ficus carica L.)germplasm. Genet Resour Crop Evol 51:269–275
Amel SH, Khaled C, Messaoud M, Mohamed M, Mokhtar T (2005) Comparative analysis of
genetic diversity in two Tunisian collections of fig cultivars based on random amplified
polymorphic DNA and inter simple sequence repeats fingerprints. Genet Resour Crop Evol
52:563–573
Ansorge WJ (2009) Next-generation DNA sequencing techniques. New Biotechnol 25:195–203
Argout X, Salse J, Aury JM, Guiltinan MJ, Droc G, Gouzy J, Allegre M, Chaparro C, Legavre T,
Maximova SN, Abrouk M, Murat F, Fouet O, Poulain J, Ruiz M, Roguet Y, Rodier-Goud M,
Barbosa-Neto JF, Sabot F, Kudrna D, Ammiraju JSS, Schuster SC, Carlson JE, Sallet E,
Schiex T, Dievart A, Kramer M, Gelley L, Shi Z, Berard A, Viot C, Boccara M, Risterucci
AM, Guignon V, Sabau X, Axtell MJ, Ma Z, Zhang Y, Brown S, Bourge M, Golser W, Song X,
Clement D, Rivallan R, Tahi M, Akaza JM, Pitollat B, Gramacho K, D’Hont A, Brunel D,Infante D, Kebe I, Costet P, Wing R, McCombie WR, Guiderdoni E, Quetier F, Panaud O,
Wincker P, Bocs S, Lanaud C (2011) The genome of Theobroma cacao. Nat Genet 43:101–108Arias R, Borrone J, Tondo C, Kuhn D, Irish B, Schnell R (2012) Genomics of tropical fruit tree
crops. In: Schnell RJ, Priyadarshan PM (eds) Genomics of tree crops. Springer, New York,
pp 209–239
Arus P, Verde I, Sosinski B, Zhebentyayeva T, Abbott AG (2012) The peach genome. Tree Genet
Genomes 8:531–547
Basheer-Salimia R, Lorenzi S, Batarseh F, Moreno-Sanz P, Emanuelli F, Grando MS (2014)
Molecular identification and genetic relationships of Palestinian grapevine cultivars. Mol Bio-
technol 56:546–556
Beghe D, Ganino T, Dall’Asta C, Silvanini A, Cirlini M, Fabbri A (2013) Identification and
characterization of ancient Italian chestnut using nuclear microsatellite markers. Sci Hortic
164:50–57
Birmeta G, Nybom H, Bekele E (2004) Distinction between wild and cultivated enset (Enseteventricosum) gene pools in Ethiopia using RAPD markers. Hereditas 140:139–148
Brake M, Migdadi H, Al-Gharaibeh M, Ayoub S, Haddad N, El Oqlah A (2014) Characterization
of Jordanian olive cultivars (Olea europaea L.) using RAPD and ISSR molecular markers.
Sci Hortic 176:282–289
Breto MP, Ruiz C, Pina JA, Asins MJ (2001) The diversification of Citrus clementina Hort.
ex Tan., a vegetatively propagated crop species. Mol Phylogenet Evol 21:285–293
Brown AHD (1978) Isozymes, plant population genetic structure and genetic conservation.
Theor Appl Genet 52:145–157
Brown W (1983) Genetic diversity and genetic vulnerability—an appraisal. Econ Bot 37:4–12
Cassman KG (1999) Ecological intensification of cereal production systems: yield potential, soil
quality, and precision agriculture. Proc Natl Acad Sci USA 96:5952–5959
Cho KH, Cho KS, Han JH, Kim HR, Shin IS, Kim SH, Chun JA, Hwang HS (2013) Development
of sequence characterized amplified region markers for cultivar identification in persimmon.
Korean J Hortic Sci 31:798–806
Cornille A, Gladieux P, Giraud T (2013) Crop-to-wild gene flow and spatial genetic structure in
the closest wild relatives of the cultivated apple. Evol Appl 6:737–748
Coser SM, da Silva Ferreira MF, Ferreira A, Mitre LK, Carvalho CR, Clarindo WR (2012)
Assessment of genetic diversity in Psidium guajava L. using different approaches. Sci Hortic
148:223–229
Crowhurst RN, Gleave AP, MacRae EA, Ampomah-Dwamena C, Atkinson RG, Beuning LL,
Bulley SM, Chagne D, Marsh KB, Matich AJ, Montefiori M, Newcomb RD, Schaffer RJ,
Usadel B, Allan AC, Boldingh HL, Bowen JH, DavyMW, Eckloff R, Ferguson AR, Fraser LG,
Gera E, Hellens RP, Janssen BJ, Klages K, Lo KR, MacDiarmid RM, Nain B, McNeilage MA,
Advances in Genetic Diversity Analysis in Fruit Tree Crops 257

Rassam M, Richardson AC, Rikkerink EHA, Ross GS, Schr€oder R, Snowden KC, Souleyre
EJF, Templeton MD, Walton EF, Wang D, Wang MY, Wang YY, Wood M, Wu R, Yauk YK,
Laing WA (2008) Analysis of expressed sequence tags from Actinidia: applications of a
cross species EST database for gene discovery in the areas of flavor, health, color and ripening.
BMC Genomics 9:351
D’Hont A, Denoeud F, Aury JM, Baurens FC, Carreel F, Garsmeur O, Noel B, Bocs S, Droc G,
Rouard M, Da Silva C, Jabbari K, Cardi C, Poulain J, Souquet M, Labadie K, Jourda C,
Lengelle J, Rodier-Goud M, Alberti A, Bernard M, Correa M, Ayyampalayam S, Mckain MR,
Leebens-Mack J, Burgess D, Freeling M, Mbeguie-A-Mbeguie D, Chabannes M, Wicker T,
Panaud O, Barbosa J, Hribova E, Heslop-Harrison P, Habas R, Rivallan R, Francois P,
Poiron C, Kilian A, Burthia D, Jenny C, Bakry F, Brown S, Guignon V, Kema G, Dita M,
Waalwijk C, Joseph S, Dievart A, Jaillon O, Leclercq J, Argout X, Lyons E, Almeida A,
Jeridi M, Dolezel J, Roux N, Risterucci AG, Weissenbach J, Ruiz M, Glaszmann JC, Quetier F,
Yahiaoui N, Wincker P (2012) The banana (Musa acuminata) genome and the evolution of
monocotyledonous plants. Nature 488:213–217
Davey MW, Gudimella R, Harikrishna JA, Sin LW, Khalid N, Keulemans J (2013) A draft Musabalbisiana genome sequence for molecular genetics in polyploid, inter- and intra-specificMusahybrids. BMC Genomics 14:683
De Vicente MC, L�opez C, Fulton T (eds) (2004) Genetic diversity analysis with molecular marker
data: learning module. International Plant Genetic Resources Institute (IPGRI), Rome
Deschamps S, Llaca V, May GD (2012) Genotyping-by-sequencing in plants. Biology 1:460–483
Du X, Zhang Q, Luo Z (2009a) Development of retrotransposon primers and their utilization for
germplasm identification in Diospyros spp. (Ebenaceae). Tree Genet Genomes 5:235–245
Du XY, Zhang QL, Luo Z (2009b) Comparison of four molecular markers for genetic analysis in
Diospyros L. (Ebenaceae). Plant Syst Evol 281:171–181Ellegren H (2004) Microsatellites: simple sequences with complex evolution. Nat Rev Genet 5:
435–445
Escribano P, Viruel MA, Hormaza JI (2007) Molecular analysis of genetic diversity and geo-
graphic origin within an ex situ germplasm collection of cherimoya by using SSRs. J Am Soc
Hortic Sci 132:357–367
Escribano P, Viruel MA, Hormaza JI (2008) Comparison of different methods to construct a core
germplasm collection in woody perennial species with SSR markers. A case study in cheri-
moya (Annona cherimolaMill.), an underutilized subtropical fruit tree species. Ann Appl Biol
153:25–32
Excoffier L, Laval G, Schneider S (2005) Arlequin ver. 3.0: an integrated software package for
population genetics data analysis. Evol Bioinform Online 1:47–50
FAO (1997) The state of the world’s plant genetic resources for food and agriculture. Food and
Agriculture Organization of the United Nations, Rome, p 501
Faostat (2014) FAO statistics database on the World Wide Web. http://faostat.fao.org/site/339/
default.aspx. Accessed 12–2014
Ford-Lloyd BV, Schmidt M, Armstrong SJ, Barazani O, Engels J, Hadas R, Hammer K, Kell SP,
Kang D, Khoshbakht K, Li Y, Long C, Lu BR, Ma K, Nguyen VT, Qiu L, Ge S, Wei W,
Zhang Z, Maxted N (2011) Crop wild relatives-undervalued, underutilized and under threat?
Bioscience 61:559–565
Gajera HP, Bambharolia RP, Domadiya RK, Patel SV, Golakiya BA (2014) Molecular character-
ization and genetic variability studies associated with fruit quality of indigenous mango
(Mangifera indica L.) cultivars. Plant Syst Evol 300:1011–1020
Garcia-Ruiz MT, Mendoza-Castillo VM, Valadez-Moctezuma E, Muratalla-Lua A (2013) Initial
assessment of natural diversity in Mexican fig landraces. Genet Mol Res 12:3931–3943
Garvin MR, Saitoh K, Gharrett AJ (2010) Application of single nucleotide polymorphisms to
non-model species: a technical review. Mol Ecol Resour 10:915–934
Glenn TC (2011) Field guide to next-generation DNA sequencers. Mol Ecol Resour 11:759–769
258 N. Larra~naga and J.I. Hormaza

Goudet J (2005) Hierfstat, a package for R to compute and test hierarchical F-statistics. Mol Ecol
Notes 5:184–186
Graham J, Marshall B, Squire GR (2003) Genetic differentiation over a spatial environmental
gradient in wild Rubus ideaus populations. New Phytol 157:667–675
Guarino L, Jarvis A, Hijmans RJ, Maxted N (2002) Geographic information systems (GIS) and the
conservation and use of plant genetic resources. In: Engels JEA (ed) Managing plant genetic
diversity. CAB International, Wallingford, pp 387–404
Guo L, Palumbo R, Zhang ZS, Wang GL, Tay D, Zhang DL, Shen X, Shu HR (2009) Target
Region Amplification Polymorphism (TRAP) for evaluating genetic diversity in Malus Mill.
genus. Hortscience 44:1117
Hammer K (2003) A paradigm shift in the discipline of plant genetic resources. Genet Resour Crop
Evol 50:3–10
Harrison N, Kidner CA (2011) Next-generation sequencing and systematics: what can a billion
base pairs of DNA sequence data do for you? Taxon 60:1552–1566
Holderegger R, Buehler D, Gugerli F, Manel S (2010) Landscape genetics of plants. Trends Plant
Sci 15:675–683
Ikegami H, Nogata H, Hirashima K, Awamura M, Nakahara T (2009) Analysis of genetic diversity
among European and Asian fig varieties (Ficus carica L.) using ISSR, RAPD, and SSR
markers. Genet Resour Crop Evol 56:201–209
Jaillon O, Aury M, Noel B, Policriti A, Clepet C, Casagrande A, Choisne N, Aubourg S, Vitulo N,
Jubin C, Vezzi A, Legeai F, Hugueney P, Dasilva C, Horner D, Mica E, Jublot D, Poulain J,
Bruyere C, Billault A, Segurens B, Gouyvenoux M, Ugarte E, Cattonaro F, Anthouard V,
Vico V, Del Fabbro C, Alaux M, Di Gaspero G, Dumas V, Felice N, Paillard S, Juman I,
Moroldo M, Scalabrin S, Canaguier A, Le Clainche I, Malacrida D, Durand E, Pesole G,
Laucou V, Chatelet P, Merdinoglu D, Delledonne M, Pezzotti M, Lecharny A, Scarpelli C,
Artiguenave F, Pe ME, Valle G, Morgante M, Caboche M, Adam-Blondon AF, Weissenbach J,
Quetier F, Wincke P (2007) The grapevine genome sequence suggests ancestral hexaploid-
ization in major angiosperm phyla. Nature 449:463–467
Jarvis A, Yeaman S, Guarino L, Tohme J (2005) The role of geographic analysis in locating,
understanding, and using plant genetic diversity. Methods Enzymol 395:279–298
Jeffreys AJ (1979) DNA sequence variants in the G gamma-, A gamma-, delta- and beta-globin
genes of man. Cell 18:1–10
Jing ZB, Ruan X,Wang R, Yang Y (2013a) Genetic diversity and relationships between and within
persimmon (Diospyros L.) wild species and cultivated varieties by SRAP markers. Plant Syst
Evol 299:1485–1492
Jing ZB, Cheng J, Guo CH, Wang XP (2013b) Seed traits, nutrient elements and assessment
of genetic diversity for almond (Amygdalus spp.) endangered to China as revealed using
SRAP markers. Biochem Syst Ecol 49:51–57
Jombart T (2008) Adegenet: a R package for the multivariate analysis of genetic markers.
Bioinformatics 24:1403–1405
Kalia RK, Rai MK, Kalia S, Singh R, Dhawan AK (2011) Microsatellite markers: an overview of
the recent progress in plants. Euphytica 177:309–334
Kaya HB, Cetin O, Kaya H, Sahin M, Sefer F, Kahraman A, Tanyolac B (2013) SNP discovery by
illumina-based transcriptome sequencing of the olive and the genetic characterization of
Turkish olive genotypes revealed by AFLP, SSR and SNP markers. PLoS One 8(9):e73674
Keenan K, McGinnity P, Cross T, Crozier WW, Prod€ohl PA (2013) DiveRsity: an R package for
the estimation and exploration of population genetics parameters and their associated errors.
Methods Ecol Evol 8:782–788
Kim H, Terakami S, Nishitani C, Kurita K, Kanamori H, Katayose Y, Sawamura Y, Saito T,
Yamamoto T (2012) Development of cultivar-specific DNAmarkers based on retrotransposon-
based insertional polymorphism in Japanese pear. Breed Sci 62:53–62
Koboldt DC, Steinberg KM, Larson DE, Wilson RK, Mardis ER (2013) The next-generation
sequencing revolution and its impact on genomics. Cell 155:27–38
Advances in Genetic Diversity Analysis in Fruit Tree Crops 259

Koehmstedt AM, Aradhya MK, Soleri D, Smith JL, Polito VS (2011) Molecular characterization
of genetic diversity, structure, and differentiation in the olive (Olea europaea L.) germplasm
collection of the United States Department of Agriculture. Genet Resour Crop Evol 58:
519–531
Larra~naga N, Hormaza JI (2015) DNA barcoding of perennial fruit tree species of agronomic
interest in the genus Annona (Annonaceae). Front Plant Sci 6:589
Le Corre V, Kremer A (2003) Genetic variability at neutral markers, quantitative trait loci and trait
in a subdivided population under selection. Genetics 164:1205–1219
Leinemann L, Steiner W, Hosius B, Kuchma O, Arenhoevel W, Fussi B, Haase B, Kaetzel R,
Rogge M, Finkeldey R (2013) Genetic variation of chloroplast and nuclear markers in natural
populations of hazelnut (Corylus avellana L.) in Germany. Plant Syst Evol 299:369–378
Li TF, Liu JR, Xie YN, Wang QY, Meng FJ (2014a) Analysis of genetic diversity in Prunus miraKoehne ex Sargent populations using AFLP markers. Plant Syst Evol 300:475–482
Li D, Liu Y, Li X, Rao J, Yao X, Zhong C (2014b) Genetic diversity in kiwifruit polyploid
complexes: insights into cultivar evaluation, conservation, and utilization. Tree Genet
Genomes 10:1451–1463
Li M, Zhao Z, Miao X (2014c) Genetic diversity and relationships of apricot cultivars in
North China revealed by ISSR and SRAP markers. Sci Hortic 173:20–28
Litt M, Luly JA (1989) A hypervariable microsatellite revealed by in vitro amplification of a
dinucleotide repeat within the cardiac muscle actin gene. Am J Hum Genet 44:397–401
Liu K, Muse SV (2005) Power marker: an integrated analysis environment for genetic marker
analysis. Bioinformatics 21:2128–2129
Luo C, He X, Chen H, Ou S, Gao M, Brown JS, Tondo CT, Schnell RJ (2011) Genetic diversity of
mango cultivars estimated using SCoT and ISSR markers. Biochem Syst Ecol 39:676–684
Madhou M, Normand F, Bahorun T, Hormaza JI (2013) Fingerprinting and analysis of genetic
diversity of litchi (Litchi chinensis Sonn.) accessions from different germplasm collections
using microsatellite markers. Tree Genet Genomes 9:387–396
Magi A, Benelli M, Gozzini A, Girolami F, Torricelli F, Brandi ML (2010) Bioinformatics for
next generation sequencing data. Genes 1:294–307
Malik SK, Uchoi A, Kumar S, Choudhary R, Pal D, Kole PR, Chaudhury R, Bhat KV (2013)
Molecular characterization of Citrus macropteraMontr. (satkara): an endangered wild species
from northeast India. Plant Biosyst 147:857–863
Manel S, Holderegger R (2013) Ten years of landscape genetics. Trends Ecol Evol 28:614–621
Manel S, Schwartz MK, Luikart G, Taberlet P (2003) Landscape genetics: combining landscape
ecology and population genetics. Trends Ecol Evol 18:189–197
Mansour E, Ben Khaled A, Triki T, Abid M, Bachar K, Ferchichi A (2015) Evaluation of genetic
diversity among South Tunisian pomegranate (Punica granatum L.) accessions using fruit
traits and RAPD markers. J Agric Sci Biotechnol 17:109–119
Mardis ER (2008) Next-generation DNA sequencing methods. Annu Rev Genomics Hum Genet
9:387–402
Martin C, Herrero M, Hormaza JI (2011) Molecular characterization of apricot germplasm from an
old stone collection. PLoS One 6(8):e23979
Martin M, Mattioni C, Molina JR, Alvarez JB, Cherubini M, Herrera MA, Villani F, Martin LM
(2012) Landscape genetic structure of chestnut (Castanea sativa Mill.) in Spain. Tree Genet
Genomes 8:127–136
Maxam AM, Gilbert W (1977) A new method for sequencing DNA. Proc Natl Acad Sci USA 74:
560–564
Mba C, Tohme J (2005) Use of AFLP markers in surveys of plant diversity. Methods Enzymol
395:177–201
Mba C, Guimaraes E, Ghosh K (2012) Re-orienting crop improvement for the changing climatic
conditions of the 21st century. Agric Food Secur 1:1–17
McClure KA, Sawler J, Gardner KM, Money D, Myles S (2014) Genomics: a potential panacea for
the perennial problem. Am J Bot 101:1780–1790
260 N. Larra~naga and J.I. Hormaza

Ming R, Hou S, Feng Y, Yu Q, Dionne-Laporte A, Saw JH, Senin P, Wang W, Ly BV, Lewis KL,
Salzberg SL, Feng L, Jones MR, Skelton RL, Murray JE, Chen C, Qian W, Shen J, Du P,
Eustice M, Tong E, Tang H, Lyons E, Paull RE, Michael TP, Wall K, Rice DW, Albert H,
Wang ML, Zhu YJ, Schatz M, Nagarajan N, Acob RA, Guan P, Blas A, Wai CM, Ackerman
CM, Ren Y, Liu C, Wang J, Wang J, Na JK, Shakirov EV, Haas B, Thimmapuram J, Nelson D,
Wang X, Bowers JE, Gschwend AR, Delcher AL, Singh R, Suzuki JY, Tripathi S, Neupane K,
Wei H, Irikura B, Paidi M, Jiang N, Zhang W, Presting G, Windsor A, Navajas-Perez R, Torres
MJ, Feltus FA, Porter B, Li Y, Burroughs AM, Luo MC, Liu L, Christopher DA, Mount SM,
Moore PH, Sugimura T, Jiang J, Schuler MA, Friedman V, Mitchell-Olds T, Shippen DE,
dePamphilis CW, Palmer JD, Freeling M, Paterson AH, Gonsalves D, Wang L, AlamM (2008)
The draft genome of the transgenic tropical fruit tree papaya (Carica papaya Linnaeus).
Nature 452:991–996
Mondini L, Noorani A, Pagnotta MA (2009) Assessing plant genetic diversity by molecular tools.
Diversity 1:19–35
Montanari S, Saeed M, Knaebel M, Kim Y, Troggio M, Malnoy M, Velasco R, Fontana P, Won K,
Durel CE, Perchepied L, Schaffer R, Wiedow C, Bus V, Brewer L, Gardiner SE, Crowhurst
RN, Chagne D (2013) Identification of Pyrus single nucleotide polymorphisms (SNPs) and
evaluation for genetic mapping in European pear and interspecific Pyrus hybrids. PLoS One
8(10):e77022
Motamayor JC, Mockaitis K, Schmutz J, Haiminen N, Livingstone D III, Cornejo O, Findley SD,
Zheng P, Utro F, Royaert S, Saski C, Jenkins J, Podicheti R, Zhao M, Scheffler BE, Stack JC,
Feltus FA, Mustiga GM, Amores F, Phillips W, Marelli JP, May GD, Shapiro H, Ma J,
Bustamante CD, Schnell RJ, Main D, Gilbert D, Parida L, Kuhn DN (2013) The genome
sequence of the most widely cultivated cacao type and its use to identify candidate genes
regulating pod color. Genome Biol 14:r53
Mullis K, Faloona F, Scharf S, Saiki R, Horn G, Erlich H (1986) Specific enzymatic amplification
of DNA in vitro: the polymerase chain reaction. Cold Spring Harb Symp Quant Biol 51:
263–273
Munthali CRY, Chirwa PW, Changadeya WJ, Akinnifesi FK (2013) Genetic differentiation and
diversity of Adansonia digitata L. (baobab) in Malawi using microsatellite markers.
Agrofor Syst 87:117–130
Nair AS, Teo CH, Schwarzacher T, Harrison PH (2005) Genome classification of banana cultivars
from South India using IRAP markers. Euphytica 144:285–290
Passos MAN, de Oliveira CV, Emediato FL, de Camargo TC, Souza MT, Matsumoto T, Renno
Azevedo VC, Ferreira CF, Amorim EP, de Alencar Figueiredo LF, Martins NF, de Jesus
Barbosa Cavalcante M, Baurens FC, da Silva OB, GJ P Jr, Pignolet L, Abadie C, Ciampi AY,
Piffanelli P, Miller RN (2012) Development of expressed sequence tag and expressed sequence
tag-simple sequence repeat marker resources for Musa acuminata. AoB Plants 2012:pls030.
doi:10.1093/aobpla/pls030
Peakall R, Smouse P (2012) GenAlEx 6.5: genetic analysis in Excel. Population genetic software
for teaching and research—an update. Bioinformatics 28:2537–2539
Peterson GW, Dong Y, Horbach C, Fu Y (2014) Genotyping-by-sequencing for plant genetic
diversity analysis: a lab guide for SNP genotyping. Diversity 6:665–680
Pollegioni P, Woeste KE, Chiocchini F, Olimpieri I, Tortolano V, Clark J, Hemery GE, Mapelli S,
Malvolti ME (2014) Landscape genetics of Persian walnut (Juglans regia L.) across its
Asian range. Tree Genet Genomes 10:1027–1043
Porth I, El-Kassaby YA (2014) Assessment of the genetic diversity in forest tree populations using
molecular markers. Diversity 6:283–295
Pritchard JK, Stephens M, Donnelly P (2000) Inference of population structure using multilocus
genotype data. Genetics 155:945–959
Raji R, Jannatizadeh A, Fattahi R, Esfahlani MA (2014) Investigation of variability of apricot
(Prunus armeniaca L.) using morphological traits and microsatellite markers. Sci Hortic 176:
225–231
Advances in Genetic Diversity Analysis in Fruit Tree Crops 261

Raymond M, Rousset F (1995) GENEPOP (version 1.2): population genetics software for exact
tests and ecumenicism. J Hered 86:248–249
Rohlf FJ (2008) NTSYSpc: numerical taxonomy system, ver. 2.20. Exeter Publishing, Setauket,
NY
Russell JR, Hedley PE, Cardle L, Dancey S, Morris J, Booth A, Odee D, Mwaura L, Omondi W,
Angaine P, Machua J, Muchugi A, Milne I, Kindt R, Jamnadass R, Dawson IK (2014)
TropiTree: an NGS-based EST-SSR resource for 24 tropical tree species. PLoS One 9:e102502
Sabir JSM, Abo-Aba S, Bafeel S, Zari TA, Edris S, Shokry AM, Atef A, Gadalla NO, Ramadan
AM, Al-Kordy MA, El-Domyati FM, Jansen RK, Bahieldin A (2014) Characterization of ten
date palm (Phoenix dactylifera L.) cultivars from Saudi Arabia using AFLP and ISSR markers.
C R Biol 337:6–18
Samal KC, Jena RC, Swain SS, Das BK, Chand PK (2012) Evaluation of genetic diversity among
commercial cultivars, hybrids and local mango (Mangifera indica L.) genotypes of India usingcumulative RAPD and ISSR markers. Euphytica 185:195–213
Sanger F, Nicklen S, Coulson AR (1977) DNA sequencing with chain-terminating inhibitors.
Proc Natl Acad Sci USA 74:5463–5467
Sehic J, Garkava-Gustavsson L, Fernandez-Fernandez F, Nybom H (2012) Genetic diversity in
a collection of European pear (Pyrus communis) cultivars determined with SSR markers
chosen by ECPGR. Sci Hortic 145:39–45
Shanjani PS, Mardi M, Pazouki L, Hagidimitriou M, Avanzato D, Pirseyedi SM, Ghaffari MR,
Nekoui SMK (2009) Analysis of the molecular variation between and within cultivated and
wild Pistacia species using AFLPs. Tree Genet Genomes 5:447–458
Shen Y, Ding X, Wang F, Cai B, Gao Z, Zhang Z (2011) Analysis of genetic diversity in Japanese
apricot (Prunus mume Sieb. et Zucc.) based on REMAP and IRAP molecular markers.
Sci Hortic 132:50–58
Shendure J, Ji H (2008) Next-generation DNA sequencing. Nat Biotechnol 26:1135–1145
Spindel J, Wright M, Chen C, Cobb J, Gage J, Harrington S, Lorieux M, Ahmadi N, McCouch S
(2013) Bridging the genotyping gap: using genotyping by sequencing (GBS) to add high-
density SNP markers and new value to traditional bi-parental mapping and breeding
populations. Theor Appl Genet 126:2699–2716
Storfer A, Murphy MA, Evans JS, Goldberg CS, Robinson S, Spear SF, Dezzani R, Delmelle E,
Vierling L, Waits LP (2007) Putting the ‘landscape’ in landscape genetics. Heredity 98:
128–142
Storfer A, Murphy MA, Spear SF, Holderegger R, Waits LP (2010) Landscape genetics: where are
we now? Mol Ecol 19:3496–3514
Sun LD, Zhang QX, Xu ZD, YangWR, Guo Y, Lu JX, Pan HT, Cheng TR, Cai M (2013) Genome-
wide DNA polymorphisms in two cultivars of mei (Prunus mume Sieb. et Zucc.). BMC Genet
14:98
Syed NH, Sureshsundar S, Wilkinson MJ, Bhau BS, Cavalcanti JJV, Flavell AJ (2005) Ty1-copia
retrotransposon-based SSAP marker development in cashew (Anacardium occidentale L.).
Theor Appl Genet 110:1195–1202
Takrouni MM, Ali IB, Messaoued C, Boussaid M (2012) Genetic variability of Tunisian wild
strawberry tree (Arbutus unedo L.) populations interfered from isozyme markers. Sci Hortic
146:92–98
Tamura K, Stecher G, Peterson D, Filipski A, Kumar S (2013) MEGA6: molecular evolutionary
genetics analysis version 6.0. Mol Biol Evol 30:2725–2729
Thomas E, van Zonneveld M, Loo J, Hodgkin T, Galluzzi G, van Etten J (2012) Present spatial
diversity patterns of Theobroma cacao L. in the neotropics reflect genetic differentiation in
Pleistocene refugia followed by human-influenced dispersal. PLoS One 7:e47676
van Droogenbroeck B, Kyndt T, Maertens I, Romeijn-Peeters E, Scheldeman X, Romero-Motochi
JP, Van Damme P, Goetghebeur P, Gheysen G (2004) Phylogenetic analysis of the highland
papayas (Vasconcellea) and allied genera (Caricaceae) using PCR-RFLP. Theor Appl Genet
108:1473–1486
262 N. Larra~naga and J.I. Hormaza

van Droogenbroeck B, Kyndt T, Romeijn-Peeters E, van Thuyne W, Goetghebeur P, Romero-
Motochi JP, Gheysen G (2006) Evidence of natural hybridization and introgression between
Vasconcellea species (Caricaceae) from southern Ecuador revealed by chloroplast, mito-
chondrial and nuclear DNA markers. Ann Bot 97:793–805
van Hintum T, Brown AHD, Spillane C, Hodgkin T (2000) Core collections of plant genetic
resources. IPGRI Technical Bulletin No. 3. International Plant Genetic Resources Institute,
Rome
van Zonneveld M, Scheldeman X, Escribano P, Viruel MA, Van Damme P, Garcia W, Tapia C,
Romero J, Siguenas M, Hormaza JI (2012) Mapping genetic diversity of cherimoya
(Annona cherimola Mill.): application of spatial analysis for conservation and use of plant
genetic resources. PLoS One 7:e29845
Vandergast AG, Perry WM, Lugo RV, Hathaway SA (2011) Genetic landscapes GIS Toolbox:
tools to map patterns of genetic divergence and diversity. Mol Ecol Resour 11:158–161
Velasco R, Zharkikh A, Affourtit J, Dhingra A, Cestaro A, Kalyanaraman A, Fontana P, Bhatnagar
SK, Troggio M, Pruss D, Salvi S, Pindo M, Baldi P, Castelletti S, Cavaiuolo M, Coppola G,
Costa F, Cova V, Dal Ri A, Goremykin V, Komjanc M, Longhi S, Magnago P, Malacarne G,
Malnoy M, Micheletti D, Moretto M, Perazzolli M, Si-Ammour A, Vezzulli S (2010) The
genome of the domesticated apple (Malus x domestica Borkh.). Nat Genet 42:833–839
Verde I, Abbott AG, Scalabrin S, Jung S, Shu S, Marroni F, Zhebentyayeva T, Dettori MT,
Grimwood J, Cattonaro F, Zuccolo A, Rossini L, Jenkins J, Vendramin E, Meisel LA,
Decroocq V, Sosinski B, Prochnik S, Mitros T, Policriti A, Cipriani G, Dondini L, Ficklin S,
Goodstein DM, Xuan P, Del Fabbro C, Aramini V, Copetti D, Gonzalez S, Horner DS,
Falchi R, Lucas S, Mica E, Maldonado J, Lazzari B, Bielenberg D, Pirona R, Miculan M,
Barakat A, Testolin R, Stella A, Tartarini S, Tonutti P, Arus P, Orellana A, Wells C, Main D,
Vizzotto G, Silva H, Salamini F, Schmutz J, Morgante M, Rokhsar DS (2013) The high-quality
draft genome of peach (Prunus persica) identifies unique patterns of genetic diversity, domes-
tication and genome evolution. Nat Genet 45:487–494
Vinceti B, Loo J, Gaisberger H, van Zonneveld M, Schueler S, Konrad H, Kadu CAC, Geburek T
(2013) Conservation priorities for Prunus africana defined with the aid of spatial analysis of
genetic data and climatic variables. PLoS One 8:e59987
Vos P, Hogers R, Bleeker M, Reijans M, van de Lee T, Hornes M, Fritjters A, Pot J, Peleman J,
Kuiper M, Zabeau M (1995) AFLP: a new technique for DNA fingerprinting. Nucleic Acids
Res 23:4407–4414
Wagner I, Maurer WD, Lemmen P, Schmitt HP, Wagner M, Binder M, Patzak P (2014) Hybrid-
ization and genetic diversity in wild apple (Malus sylvestris (L.) Mill) from various regions in
Germany and from Luxembourg. Silvae Genet 63:81–94
Warschefsky E, Penmetsa RY, Cook DR, von Wettberg EJB (2014) Back to the wilds: tapping
evolutionary adaptations for resilient crops through systematic hybridization with crop wild
relatives. Am J Bot 101:1791–1800
Wijeratnam RSW (2000) Identification of problems in processing of underutilized fruits of the
tropics and their solutions. Acta Hortic 518:237–240
Williams JGK, Kuberik AR, Livak KJ, Rafalski JA, Tingey SV (1990) DNA polymorphisms
amplified by arbitrary primers are useful as genetic markers. Nucleic Acids Res 18:6531–6535
Wu J, Wang Z, Shi Z, Zhang S, Ming R, Zhu S, Khan MA, Tao S, Korban SS, Wang H, Chen NJ,
Nishio T, Xu X, Cong L, Qi K, Huang X, Wang Y, Zhao X, Wu J, Deng C, Gou C, Zhou W,
Yin H, Qin G, Sha Y, Tao Y, Chen H, Yang Y, Song Y, Zhan D, Wang J, Li L, Dai M, Gu C,
Wang Y, Shi D, Wang X, Zhang H, Zeng L, Zheng D, Wang C, Chen M, Wang G, Xie L,
Sovero V, Sha S, HuangW, Zhang S, Zhang M, Sun J, Xu L, Li Y, Liu X, Li Q, Shen J, Wang J,
Paull RE, Bennetzen JL, Wang J, Zhang S (2013) The genome of the pear (Pyrus bret-schneideri Rehd.). Genome Res 23:396–408
Wunsch A, Hormaza JI (2002) Cultivar identification and genetic fingerprinting of temperate fruit
tree species using DNA markers. Euphytica 125:59–67
Advances in Genetic Diversity Analysis in Fruit Tree Crops 263

Xu Q, Chen LL, Ruan X, Chen D, Zhu A, Chen C, Bertrand D, Jiao WB, Hao BH, Lyon MP,
Chen J, Gao S, Xing F, Lan H, Chang JW, Ge X, Lei Y, Hu Q, Miao Y, Wang L, Xiao S,
Biswas MK, Zeng W, Guo F, Cao H, Yang X, Xu XW, Cheng YJ, Xu J, Liu JH, Luo OJ,
Tang Z, Guo WW, Kuang H, Zhang HY, Roose ML, Nagarajan N, Deng XX, Ruan Y (2013)
The draft genome of sweet orange (Citrus sinensis). Nat Genet 45:59–66Yeh FC, Yang RC, Boyle TBJ, Ye ZH, Mao JX (1997) POPGENE, the user-friendly shareware for
population genetic analysis. Molecular Biology and Biotechnology Centre, University of
Alberta, Edmonton
Yilmaz KU, Paydas-Kargi S, Dogan Y, Kafkas S (2012) Genetic diversity analysis based on ISSR,
RAPD and SSR among Turkish apricot germplasms in Iran Caucasian eco-geographical group.
Sci Hortic 138:138–143
Zhang Q, Chen W, Sun L, Zhao F, Huang B, Yang W, Tao Y, Wang J, Yuan Z, Fan G, Xing Z,
Han C, Pan H, Zhong X, Shi W, Liang X, Du D, Sun F, Xu Z, Hao R, Lv T, Lv Y, Zheng Z,
Sun M, Luo L, Cai M, Gao Y, Wang J, Yin Y, Xu X, Cheng T, Wang J (2012) The genome of
Prunus mume. Nat Commun 3:1318
264 N. Larra~naga and J.I. Hormaza