Embed Size (px)
Citation preview

Culture and Revitalization: The Economic Effects of MASS MoCA on its Community
Stephen C. Sheppard Kay Oehler
Blair Benjamin Ari Kessler
C3D Report NA2.2005

Culture and Revitalization: The Economic Effects of MASS MoCA on its Community
The economic effect of culture is currently generating a lot of interest. There is an increasing interest in providing quantitative measures of the economic impact of arts and cultural activities. Economic impact studies are routinely demanded by policy makers and Foundations, and just as routinely dismissed by them. In part, this is because traditional impact studies take such an aggregated, macro or sector approach that they cannot reveal changes at the neighborhood level. Ethnographic and anecdotal evidence suggests, however, that the most important signs of community development impact are at the neighborhood level. It is the neighborhood level which is the focus of our research on the effects of the opening of MASS MoCA on North Adams, Massachusetts. This report is the first step in our developing a template by which we can study and compare neighborhood regeneration via the introduction of a new cultural arts organization. In a series of reports we present a variety of perspectives – historical, anthropological, economic, and sociological – to analyze and discuss the results of North Adams’ attempt to regenerate itself by collaborating with the development of a major new cultural arts organization, MASS MoCA. This paper focuses on the economic effects of culture on community. The tools we develop in this study are replicable yet flexible enough to allow for comparable studies in a variety of neighborhoods and communities.
Americans for the Arts examined spending by arts organizations
Americans for the Arts
How does our analysis relate to other work in the area of arts and community regeneration? In this section we compare our perspective, tools, and goals with several significant studies that have been completed examining the relationship between the cultural arts and community economic development. Then we will discuss briefly the published literature upon which we draw in developing our analytic tools and choosing our research questions. In 2002 Americans for the Arts released an influential study, “Arts & Economic Prosperity: The Economic Impact of Nonprofit Arts Organizations and Their Audiences.” The report was based on extensive surveys of patrons of nonprofit arts and cultural institutions in 91 cities around the country. The
1

basic methodology seeks to calculate the aggregate impact on urban and regional economies (and by extension the national economy) of the nonprofit creative arts sector. The study has been widely cited, and Americans for the Arts provide extensive information via its web-site1 including an application for calculating the potential impact on employment, total income and tax revenues of any anticipated arts organization. While the Americans for the Arts are interested in moving toward a more local focus, their current analysis does not permit identification of individual neighborhood impacts. We hope to provide a more nuanced understanding of the effects of arts organizations on their individual neighborhoods or communities. The Creative Economy Council is one of the most active regional programs to promote the achievement of economic development through cultural and artistic activities. It provides a detailed look at how the “creative sector” (including but not limited to arts and culture), can help to promote economic development. Its research reports are focused exclusively on the New England region. The research, however, is not focused on local neighborhood impacts, but rather on broader urban and regional development goals. Our approach is closer in philosophy to the effort organized within the Urban Institute as the National Neighborhood Indicators Partnership. This effort draws together the work of 7 local affiliates collecting information on local community-development impacts of the arts and cultural activities. The work and research reports are well-distributed by the Urban Institute, and there has been a sequence of meetings
SIAP has engaged in careful study of Philadelphia
that brought together scholars and practitioners. While the data collected have all been local and neighborhood-oriented, there is not a collection of data designed to be comparable across all cities in the partnership. The Social Impact of the Arts Project (SIAP) is one of the 7 affiliates in the National Neighborhood Indicators Project discussed above. Affiliated with the University of Pennsylvania’s School of Social Work, the Project is one of the few research groups to have utilized careful spatial analysis of data in some of their analyses. They have combined their own survey data, census data and data from sources such as the Survey of Public Participation in the Arts2 to examine a variety of impacts within the Philadelphia metropolitan area. This project is limited to Philadelphia, however, and the data are not collected with the goal of comparison with other communities. Our research has several important characteristics that distinguish it from the work discussed above:
• It develops and utilizes the analytic tools of multiple social sciences; • It seeks to develop these tools into a template of analysis that is replicable yet flexible;
1 See http://www.artsusa.org/EconomicImpact/.
22 This survey is conducted every five years by the National Endowment for the Arts.

• It focuses primarily on neighborhood and community impacts, with some discussion of regional impacts;
• It seeks to collect and organize data so that they are comparable across the selection of towns and neighborhoods we will be studying in the future, and can be used by other researchers.
Culture is more than just another industry. In traditional regional economics, an arts organization such as a Museum is treated as a basic industry3, the same as any other industry in a region. The argument is that there is no reason to treat culture production differently from other forms of production. The culture industry is not given preferential treatment over the electronics industry, for example. Today’s research areas of economics of tourism and cultural tourism follow this research tradition. If the cultural industry is viewed as conceptually the same as any other basic industry, then traditional regional economic analyses can be applied to it. A common analysis is the input-output model, where researchers examine what expenses are involved in producing a product that will bring $100 of revenue into the area from outside of the region.4 For the electronics industry, this would mean producing $100 of capacitors for sale outside of the local area; for the cultural arts industry, it would mean attracting $100 of tourist revenue from outside of the local area. We could then estimate the final effect of that money as it recycles through the local and regional economy.
There is a difference between culture and electronics
Stephen Sheppard, MASS MoCA 2004
Let’s take the example of a museum. The museum hires workers who spend their salaries at local restaurants and clothing stores. The local restaurants and clothing stores hire more employees to handle the increased business, and these employees likewise spend their paychecks locally. Local service providers, like plumbers, electricians, and carpenters, similarly have additional work when the museum hires them for repairs and renovation. They hire more assistants and they all spend their increased income (for the most part) locally. The input-output model estimates the total effect on the regional economy of each dollar spent by the basic industry. In the economic analyses section that comes later in this report, we provide a traditional input/output model using the popular software program IMPLAN. We will present the estimated economic growth for
3 A basic industry is one which sells its products outside of the local area or attracts customers from other areas.
34 We could, of course, choose $1,000 of product or $10,000 of product as the baseline.
Berkshire County as a result of MASS MoCA’s expenditures, including the increase in employment and the tax impact of MASS MoCA. The advantages of an input/output analysis are:
• Policy makers, political leaders, and arts administrators are all familiar with the basic notion of an input/output model;
• It has become a common part of economic impact studies, and thus is often requested; • It provides figures within categories (such as the number of new jobs in the region) that are
intuitively understandable, and can be loosely compared from city to city. The disadvantages of input/output analysis, however, limit its usefulness for policy makers, legislators, and researchers:
• It places too much emphasis on the comparison of one industrial sector with another. This encourages legislators and others to view their allocation decisions too much as an either/or decision – we either encourage the electronics industry or we encourage the cultural industry. When it comes to supporting the cultural arts industry, in particular, the decision is not the dichotomy that input/output analysis might subtly suggest to policy makers who compare the results of one industrial sector model with another.
Culture can regenerate its local community
Bob Pause, North Adams, undated
• Because of high rates of self-employment amongst artists and within culture production sector
more generally, conventional data sources used as the foundation of input/output analysis have tended to underestimate the importance of the sector.
• The analysis places too much emphasis on regional effects for our purpose. As explained earlier, our goal is to provide a nuanced, locally-based understanding of the effects of MASS MoCA on the regeneration of North Adams. Knowing the effect of MASS MoCA on the regional economy can only take us so far along that path.
The creation of ideas and culture is an important part of today’s economy. The creative economy approach calls to mind a historical timeline that moves from agricultural society to industrial society to a culture- or knowledge-based society. This contrasts with the cultural tourism approach discussed above that stated, basically, that culture is just like any other industry. The image there was one of the electronics factory and the museum standing side by side, being, in effect, interchangeable.
4

The idea that the American economy is moving from a goods-based economy to a knowledge-based economy has been around since at least the 1970s.5 It is similarly not new to point to a new class of consumers of the cultural arts,6 and from there it is easy to conceptualize the rise of a creative class consisting of culture producers. The publication in 2002 of Richard Florida’s book, The Rise of the Creative Class, has renewed interest in the role of creativity in the economy. As urban economist Edward Glaeser states: “Florida’s book …. is fundamentally right. Creativity is becoming a more important part of the economy. The market value of creative people has risen and large industries have tried to adapt to the rising importance of idea-creation.”7 The creative economy approach has the following advantages:
• It focuses attention on the increasing role of knowledge, creativity, and the cultural arts in contemporary society;
• It encourages the study of the number of individuals in a region or the U.S. involved in the creative economy, and the number of dollars generated by this sector of the economy;
• It has identified three values of the creative class: Individuality; Meritocracy; and Diversity and Openness (to differences).8
The creative economy approach has the following disadvantages, however:
• It clearly privileges large, central-city urban areas. It argues that cities in the future will do well economically if they can create an environment that attracts “bohemian types who like funky, socially free areas with cool downtowns and lots of density.”9 Even if one accepts this policy directive at face value, it is of little relevance when addressing the regeneration of rural areas, small towns, or local neighborhoods within urban areas.
•
The creative economy model applies more to urban areas
NYC Chinatown ca.2003
• It does not capture the dual process that we see at work in the case of North Adams and MASS
MoCA. The cultural arts organization must provide an environment which attracts an open and diverse set of creative consumers on a day to day level. At the same time, the town must try to create an environment that will attract creative producers for a long-term commitment in terms of choosing to live and invest in the community.
5 Alvin W. Gouldner. 1979. The Future of Intellectuals and the Rise of the New Class. New York: Seabury Press. 6 MacCannell, Dean. 1976. The Tourist: A New Theory of the Leisure Class. New York: Schocken Books. 7 Edward L. Glaeser. “Review of Richard Florida’s The Rise of the Creative Class.” 8 Richard Florida. 2002...The Rise of the Creative Class. New York: Basic Books, pp. 77-80.
59 This is Edward Glaeser’s representation of Florida’s argument. Glaeser, op. cit.

• The identified values of the creative class – Individuality, Meritocracy, and Diversity and Openness – are applied by Florida to only those individuals identified as members of the creative class. We argue that policies that result in the development of these values as shared community values will provide its residents with an increased ability to successfully participate and interact in contemporary economic life, no matter what occupation they choose.
Social capital is specific to a particular location. Social capital is a form of capital that derives from individuals’ relationship to the social structure. It acknowledges the fact that there are resources embedded in social structures. These are resources individuals can draw upon beyond their human capital resources, which are more individually based. To acquire social capital is to possess a resource for action. As a result of the more structural nature of social capital, “it is most advisable that social capital studies always concern themselves with larger social contexts.”10 It is this emphasis on social context and the possibility that a new cultural arts organization in a community can increase residents’ well-being that makes the social capital approach the most promising for us. Beyond adding to the economy of North Adams, how can the existence of a new museum increase the well-being of the citizens of North Adams? One mechanism is if the museum changes the structure of the town in such a way as to add to the social capital of its residents. It would do this if it linked residents together in ways in which they were not linked before, providing individuals with new social resources they could call upon to meet their social and economic needs.
Religious participation has been one way to build social capital
Bob Pause, North Adams, date unknown
We will argue that there are two ways in which the creation of MASS MoCA has increased the social capital of the citizens of North Adams. One way is via participation with the diverse group of people brought together within the MASS MoCA physical space day after day. The second way is by providing an increasing number of shared community experiences centered on art. MASS MoCA and other cultural arts organizations facilitate interaction. They bring people together and aid in the building of social capital. From a policy perspective, one might be generally interested in
6
10 Nan Lin, Karen Cook, and Ronald S. Burt (eds). 2001. Social Capital: Theory and Research. New York: Aldine de Gruyter, p. x.
building social capital. Is there a reason to prefer the cultural arts organization over the bowling alley or the swap meet? There have certainly been studies in the literature of the ways in which individuals interact with one another in a community care center11 and in urban community gardens.12
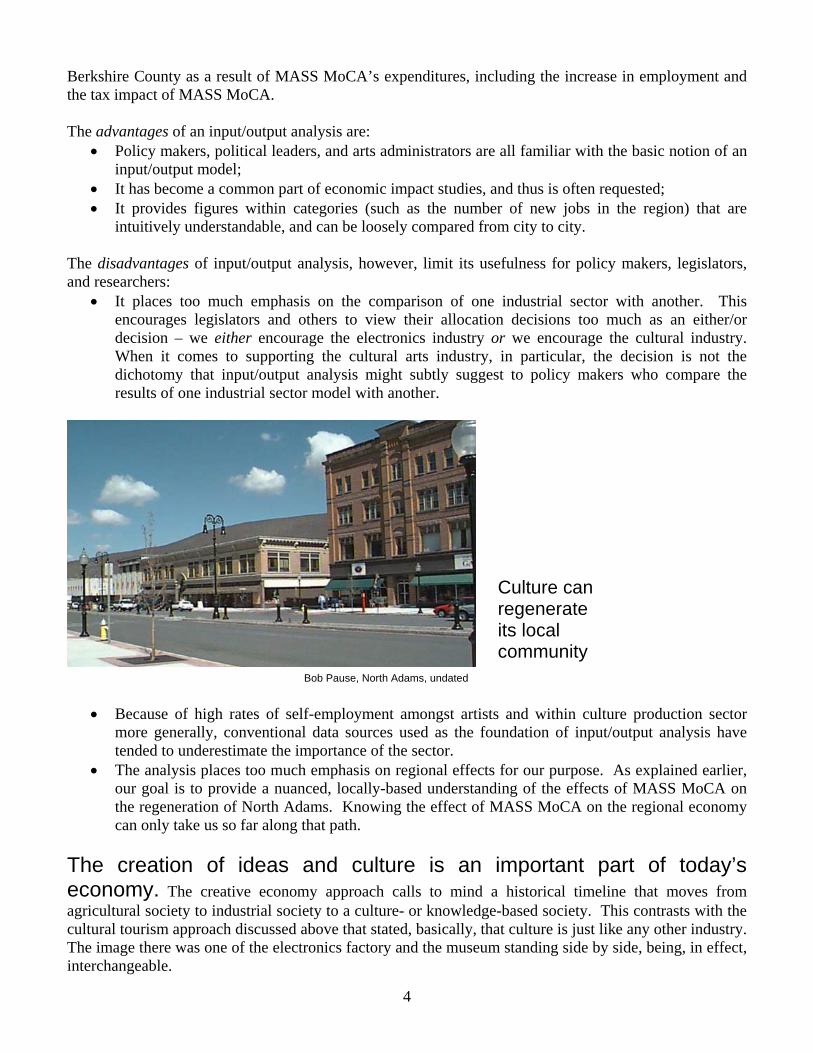
All public spaces are places where social capital can be created. Museum spaces are unusual production venues for the production of social capital in that they create a different kind of social capital than might be created in other public spaces. This may be due to the ways in which the symbols present in the cultural arts organizations become incorporated into communication within society. As the U.S. continues to move toward a knowledge-based / creative economy, individuals comfortable with the values of individuality, meritocracy, and diversity and openness will have higher levels of social capital than those who are not. These values are symbolically displayed in the creative arts organization in general, and in the Contemporary Art Museum in particular. It might also be the case that the cultural arts organization brings together a more diverse group of people. One thing we have learned about MASS MoCA is that it is more than a structure, more than a site, and more than a Contemporary Art Museum. It brings people together to a specific location day after day. Social capital is easy to form in the rich soup of a creative and tolerant community. Social capital is related to higher levels of productivity, that is, it “makes possible the achievement of certain ends that in its absence would not be possible.”13 We will argue that as long as the walls that separate a cultural arts organization and its community are porous, the community will benefit from the diversity and interaction of the organization.
The cultural arts can be a new source of social capital
Stephen Sheppard, MASS MoCA 2004
11 S. Kristiansen. 2000. “Interaction patterns among users of a Danish community care center.” International Social Work 43(3):325+. 12K.J. Shinew, T.D. Glover, and D.C. Parry. 2004. “Leisure spaces as potential sites for interracial interaction: Community gardens in urban areas.” Journal of Leisure Research 36(3): 336-55.
7
13 James S. Coleman. 2000 [1988]. “Social capital in the creation of human capital,” pp. 13-39 in Social Capital: A Multifaceted Perspective, edited by Partha Dasgupta and Ismail Serageldin. Washington, D.C.: The World Bank, quote at p. 16.

Policy makers need the tools to evaluate economic impact. Economic analyses have the advantage of being reproducible from one case to another. They also have the benefit of providing a concrete assessment of MASS MoCA’s impact on the town. John A. Barrett III, longtime mayor of North Adams, told a Boston Globe reporter in 2002 that “the museum has dramatically affected the region’s economy,”14 but he could not state more specifically how much revenue MASS MoCA had brought into the town’s coffers. Thus, even in cases where the community and the cultural arts organization work in collaboration, and where the project is a success, there has been an absence of tools for collecting and analyzing data and articulating its meaning. First, we present a traditional impact analysis of MASS MoCA on the North Adams and regional economy. We identify the sectors where MASS MoCA has had the greatest effect, and calculate the effect on employment and tax revenues. Second, we examine the ways in which MASS MoCA has increased the community assets of the town of North Adams and its residents. The presence of MASS MoCA has changed the desirability of the community as a place to live, increasing the willingness of residents to pay for housing in the city. We might expect this to have an effect on the value of housing within North Adams, and careful evaluation affirms this expectation. After a period of sustained decline (adjusting for region-wide trends and inflation), North Adams’ reputation, as reflected in real estate valuations, has fundamentally changed.
Mayor John Barrett III knows MASS MoCA has made a difference
Tom Herde, Boston Globe, 2004
Our model of residential property values allows us to identify the impact on property values attributable to the introduction of a new arts organization in a neighborhood or community. We can accomplish this because our analysis pays careful attention to the location of neighborhoods in relation to the location of the cultural organization. We examine the locations of neighborhoods relative to MASS MoCA and the North Adams city center, and the locations of neighborhoods from which visitors to MASS MoCA’s galleries and performance events come. The ideal way to undertake and present analyses involving location is by making use of concepts of Economic Geography and the tools of Geographic Information Science (GIS).
8
14 “Museum transforms North Adams’s Image,” by Thomas Grillo, Globe Correspondent, 10/12/2002; article found at www.boston.com.

Third, we turn attention to the rate of new business formation. Here we see a clear pattern of new businesses being established, the growth of employment, and the growth of annual payroll in North Adams. When museums spend money it is recirculated throughout the economy. How has MASS MoCA affected income and employment in the region? We explore the growth of North Adams by examining MASS MoCA as a business entity moving into an old Brownfield site. We were able to estimate the impact of MASS MoCA’s operations by using the Minnesota IMPLAN Group’s software, IMPLAN. Using the regional averages as a base, IMPLAN combines data on how various industrial sectors and households allocate expenditures. IMPLAN then uses spending ratios to measure how much of the money spent by a company is recycled through the economy and which industries benefit most. In the case relevant to our work, IMPLAN provides an estimate of inputs purchased by the average museum in Berkshire County. The data contain small dollar amounts over hundreds of fields. Some highlights of the data are below in Table 1. For example, for every $1000 spent by museums, educational services get $180. The IMPLAN analysis begins with the input of the number of employees at the organization, which is taken from the 990 Form filed with the IRS. IMPLAN uses information on local organizations in the same sector to estimate the total spending of the organization. This spending is in turn used to estimate three types of effects on the economy.
Table 1
Museum Spending Breakdown (per $1000 spent)
Domestic Trade $298Educational Services $180Real Estate $26Computer Consulting $10Business Support Services $7Commercial Printing $5
Education receives $180 of every $1000 spent by museums
9
The direct effects estimate the amount of money actually spent by the company in a given year. This value is output added on to the local economy. The indirect effects measure how the money spent by a company (excluding wages) is put into other local business. IMPLAN estimates what proportion of a company’s budget is spent on other local business and proceeds to examine how these businesses will use the money. Indirect effects include the $180 (per $1000) spent on educational services and then look at how this $180 is spent and look at the continuing benefits of the first business’ spending. The induced effects look at the spending of the new employees and the increased household income due to the direct and indirect spending of the company. This factor estimates how average households of different income levels spend their wages as another positive component of company spending. The main caveat of the induced effects is that it assumes that all of the new employees spend their incomes locally (in the county). In actuality there is some money that leaks into other areas because of employees who live out of the county. The IMPLAN results for MASS MoCA are summarized in Table 2.
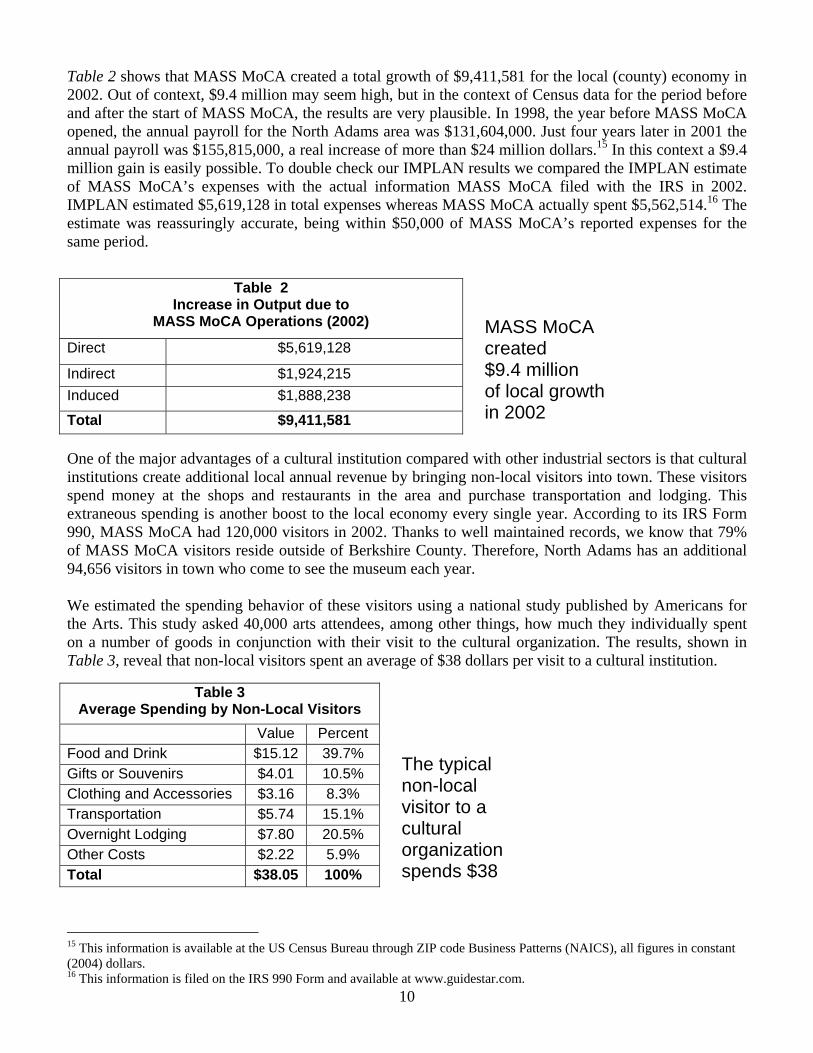
Table 2 shows that MASS MoCA created a total growth of $9,411,581 for the local (county) economy in 2002. Out of context, $9.4 million may seem high, but in the context of Census data for the period before and after the start of MASS MoCA, the results are very plausible. In 1998, the year before MASS MoCA opened, the annual payroll for the North Adams area was $131,604,000. Just four years later in 2001 the annual payroll was $155,815,000, a real increase of more than $24 million dollars.15 In this context a $9.4 million gain is easily possible. To double check our IMPLAN results we compared the IMPLAN estimate of MASS MoCA’s expenses with the actual information MASS MoCA filed with the IRS in 2002. IMPLAN estimated $5,619,128 in total expenses whereas MASS MoCA actually spent $5,562,514.16 The estimate was reassuringly accurate, being within $50,000 of MASS MoCA’s reported expenses for the same period.
10
Table 2 Increase in Output due to
MASS MoCA Operations (2002)
Direct $5,619,128
Indirect $1,924,215 Induced $1,888,238
Total $9,411,581
MASS MoCA created $9.4 million of local growth in 2002
One of the major advantages of a cultural institution compared with other industrial sectors is that cultural institutions create additional local annual revenue by bringing non-local visitors into town. These visitors spend money at the shops and restaurants in the area and purchase transportation and lodging. This extraneous spending is another boost to the local economy every single year. According to its IRS Form 990, MASS MoCA had 120,000 visitors in 2002. Thanks to well maintained records, we know that 79% of MASS MoCA visitors reside outside of Berkshire County. Therefore, North Adams has an additional 94,656 visitors in town who come to see the museum each year. We estimated the spending behavior of these visitors using a national study published by Americans for the Arts. This study asked 40,000 arts attendees, among other things, how much they individually spent on a number of goods in conjunction with their visit to the cultural organization. The results, shown in Table 3, reveal that non-local visitors spent an average of $38 dollars per visit to a cultural institution.
Table 3 Average Spending by Non-Local Visitors
Value Percent Food and Drink $15.12 39.7% Gifts or Souvenirs $4.01 10.5% Clothing and Accessories $3.16 8.3% Transportation $5.74 15.1% Overnight Lodging $7.80 20.5% Other Costs $2.22 5.9% Total $38.05 100%
The typical non-local visitor to a cultural organization spends $38
15 This information is available at the US Census Bureau through ZIP code Business Patterns (NAICS), all figures in constant (2004) dollars. 16 This information is filed on the IRS 990 Form and available at www.guidestar.com.

Using IMPLAN we were able to estimate the economic impact of tourists, and the result of this analysis is shown below in Table 4. With the visitors the new overall impact of MASS MoCA was $14,172,950. In the context of the $24 million real payroll increase17 from 1998 to 2001, this is still highly plausible.
Table 4
Increase in Output due to MASS MoCA
Direct Indirect Induced Total18
MASS MoCA Operations
$5,619,128 $1,924,215 $1,888,238 $9,411,581
Non-local Visitors $3,082,043 $703,577 $975,750 $4,761,370
Total Impact $8,701,170 $2,627,792 $2,843,220 $14,172,950
Counting tourists, MASS MoCA’s impact in 2002 was $14 million
Along with output, IMPLAN can also be used to measure expected employment effects of a new business. As seen in Table 5, MASS MoCA has led to a total increase of 230 jobs throughout the local (county) economy. This includes the 77 people employed by MASS MoCA as well as over 150 more who are employed in various sectors across the spectrum of the local economy. This estimated increase is supported by local employment data. In the year prior to MASS MoCA’s opening 5,101 people were employed in the North Adams region. Just three years later that number had risen to 5,611.19
Table 5 Increase in Employment due to MASS MoCA
Direct Indirect Induced Total
MASS MoCA 75.4 33.9 22.4 131.7
Non-local Visitors 78.1 8.7 11.7 98.5
Total 153.5 42.6 34.1 230.2 MASS MoCA has led to 230 new jobs
Summary numbers can obscure the impact on individual sectors of the economy. To delve a little deeper into the data we examined in what sectors this growth actually occurred. Table 6 shows the industrial sectors that MASS MoCA affected most. Logically, the greatest direct effects occurred in the museum industry and the industries that tend to induce direct spending from the visitors. The museum itself represents a $5.6 million dollar growth in the museum industry. Tourist industries such as restaurants, hotels, and retail also had major increases. The data on the sectors affected by the indirect and induced effects proved to be more interesting. The largest beneficiary of MASS MoCA’s spending was educational services. Among the other growth sectors were a number of small business services such
11
17 In 2004 dollars. 18 Removing the induced effects, the overall impact is still $11,329,730. 19 This information is also available at the US Census Bureau through ZIP code Business Patterns (NAICS)

as computer services and commercial printing. The induced effects showed up in a number of the basic infrastructure fields including medical services and housing. Real estate, restaurants and bars improved across a number of measures. Overall, MASS MoCA seemed to create improvements in fields that were obviously beneficial both to everyday life, and to attracting business to North Adams.
Table 6 Top Five Sectors Affected by MASS MoCA (Output and Employment)
1st 2nd 3rd 4th 5th
Direct Output
Employment
Museums
($5,619,128) (75.4)
Restaurants and Bars
($1,431,199) (40.3)
Hotels and Motels
($738,317) (12.4)
Transit
($543,325) (17.4)
Misc. Retail
($241,432) (5.0)
Indirect Output
Employment
Educational Services
($1,069,916) (23.6)
Real Estate
($259,733) (1.7)
Computer Services ($67,537)
(0.6)
Commercial Printing
($63,137) (0.6)
Wholesale Trade
($58,231) (0.6)
Induced
Output Employment
Housing
($350,579) (NA)
Hospitals
($249,844) (2.3)
Restaurants and Bars
($175,740) (5.0)
Doctors and Dentists
($169,592) (1.4)
Real Estate
($147,400) (0.9)
Even the medical profession has benefited from MASS MoCA’s presence
In doing this analysis, it is of interest to note that while privately funded today, MASS MoCA was founded in large part through government grants. In total, State government invested $35 million into the project. The goals of the State in providing this money included the desire to improve the Berkshire County economy, especially with the exit of industry from the area. While we have already seen that this goal has been met, we decided to examine possible indirect tax repercussions that would provide the government with some return on its investment. We used the IMPLAN model to estimate the tax impacts of MASS MoCA, and the results are presented in Table 7. While MASS MoCA is tax exempt, it indirectly provides $2.2 million in additional government revenues each year. In the section on community assets which follows, we find that MASS MoCA has increased North Adams residential land value by $13,963,633. Considering that North Adams has a real estate tax of 1.4% 20 the town can potentially collect an additional $195,491 each year in residential property tax. Hence, the true tax benefits due to MASS MoCA are $2.4 million in tax revenue each year. (It is also noteworthy that this analysis ignores commercial property value improvements, which, reported by the local news, have been over $11 million and which the town taxes at a 2.8% rate.) As a result, in fifteen years taxpayers will have recovered the initial investment and will continue to earn “profits” on the project. Put another way, the thirty-five million dollar State investment in MASS MoCA did not come directly from State coffers, but came from issuing bonds whose interest and principal payments are not more than two million dollars per year over a thirty year period. The estimated increase in tax revenues to the public sector21 as a result of the existence of MASS MoCA comfortably covers the cost of the payments.
12
20 This information was found on the Berkshire Chamber of Commerce website. 21 Public sector here does include the federal level.

13
Table 7 Tax Impact of MASS MoCA
Federal Tax Corporate Profits Tax $52,269 Indirect Bus Tax: Custom Duty $17,585 Indirect Bus Tax: Excise Taxes $56,596 Indirect Bus Tax: Fed NonTaxes $19,975 Personal Tax: Income Tax $722,990 Social Ins Tax- Employee Contribution $305,651 Social Ins Tax- Employer Contribution $296,793 Other Federal Taxes $4,645 Total Federal Taxes $1,476,503
State Tax Corporate Profits Tax $11,909 Indirect Bus Tax: Other Taxes $19,190 Indirect Bus Tax: Property Tax $175,193 Indirect Bus Tax: S/L NonTaxes $12,459 Indirect Bus Tax: Sales Tax $236,611 Personal Tax: Income Tax $186,552 Personal Tax: Fines- Fees $13,859 Other State and Local Taxes $20,841 Total State and Local Taxes $676,616
Total $2,153,119
MASS MoCA indirectly provides $2.2 million in additional government revenues each year
In 1986 when Sprague Electric Company left North Adams, the city spiraled into an economic depression marked by high unemployment, poverty, and population loss. Since MASS MoCA moved into the old Sprague factory there has been an enormous improvement. MASS MoCA has been a financial success for the town of North Adams, while providing public access to first rate contemporary art and performance. MASS MoCA has increased the community assets of North Adams. Cultural institutions can be agents of community change because they can make a neighborhood a more desirable place to live. Evaluating the extent to which a particular institution serves this function is complex, however, because of the intrinsic difficulty in defining what being “more desirable” means. One approach pioneered by Ridker and Henning22 and further developed by Rosen23 and many others is to conceptually “empower” current and potential residents of the community to define attractiveness based on their own willingness to seek out and pay for accommodation in the community. This view leads naturally to an economic evaluation, in which we measure the increased desirability of the local neighborhood and community. We do this by calculating the appreciation in property values, and identifying that portion of the change that is attributable to the arrival of the cultural institution or other source of amenity.
22 Ronald Ridker and John Henning, “The Determinants of Residential Property Values With Special Reference to Air Pollution”, Review of Economics and Statistics, 1967, pp. 246-257. 23 Sherwin Rosen, “Hedonic Prices and Implicit Markets: Product Differentiation in Pure Competition”, Journal of Political Economy, 82, 1974, p. 34-55.

The approach has important strengths and weaknesses. On one hand, it can be undertaken in a consistent fashion over a wide variety of communities and for a wide variety of cultural organizations, environmental amenities, and other factors. This permits comparison and evaluation of the features of communities and institutions that combine to influence the community development impact. A further advantage is that it produces numerical estimates of changes in community wealth and property values that are often of interest to local policy makers and funding sources quite apart from the artistic merit of the programming. On the other hand, by privileging individual residential location decisions, it ignores any artistic or social considerations that individuals themselves ignore. The approach used in isolation does not account for distributional issues or patterns of gentrification. Interpreted with care, however, the approach does serve to help us identify the threshold situations in which displacement of existing residents might arise. It can be a central input in the design of policies and programs that can mitigate any tendency towards such displacement. North Adams became a more desirable place to live after MASS MoCA opened. We undertook an evaluation of residential properties in the city of North Adams, examining all property sales that took place from the beginning of computerized records in the city’s tax assessment (mid-1980s) through the early summer of 2003. This covers a time period that spans from before discussion of the MASS MoCA project through the first four years of operation. We use the change in house prices from before the opening of MASS MoCA (May 1999) compared with post-opening figures to identify the impact on property values attributable to the presence of the museum. This is done using a statistical analysis procedure and model that is discussed in greater detail in the Appendix.
We examined house sales before and after the opening of MASS MoCA
www.realtor.com
14
April 2005
The central idea is to determine, after adjusting for other factors that influence house prices, the impact on house values of being located near to the site where MASS MoCA is now located. Prior to 1999, this was a Brownfield site, and the lack of amenities in the area made this neighborhood relatively unattractive. House values would tend to be greater in neighborhoods farther away from the site. The situation is illustrated in Figure 3. After MASS MoCA opened in 1999, the neighborhood began to recover and improve. MoCA itself became a community focal point, and economic activity in the neighborhood began to revive. The increased attractiveness of the neighborhood is naturally reflected in improved property values, so that

after 1999 structurally similar houses sold for about the same price whether they were near the MoCA site or farther away. This is illustrated by the top line in Figure 1. For any given house, the improvement that is attributable to MASS MoCA is the vertical distance between the lines at the location of the property. Our model provides a conservative estimate of the economic impact on North Adams as a whole. It focuses on the value of properties relative to their distance from MASS MoCA. Properties whose values were suppressed by their proximity to a Brownfield site increased in value after the arrival of MASS MoCA. This estimate does not include changes in value that apply uniformly to the entire community of North Adams. Some impacts of this sort might be attributed in part to MASS MoCA. Stemming the loss of population from the city, or a change in the wider perception of North Adams’ as a place to live, could increase property values throughout the city and may be in part due to the new cultural amenity. We do not include such changes in the estimate because it is difficult to separate them from changes in local tax rates, mortgage finance availability, and similar factors that will also have community-wide impacts. The changes in the asset values we measure are clearly and unambiguously attributable to MASS MoCA.
15
Base House Value in Dollars
After 1999 house values are nearly constant with distance to site
$55,000 Increase in neighborhood value due to MASS MoCA is greatest for areas closest to the MASS
Prior to 1999 house values improve as we move away from the site
MoCA site.
$44,000 Properties nearest MASS MoCA increased in value over $11,000
0 km 2 km 1 km
Distance in Kilometers from MASS MoCA
Figure 1 For properties nearest the MASS MoCA site, the increase in value is about $11,728 (in 2004 constant dollars). A positive impact is clear out to about 1.7 kilometers, which covers most of the residential properties in North Adams. Figure 2 shows these impacts, with each dot representing a residential property in our analysis shaded from dark green (for an increase of up to $2000) to red (for an increase in excess of $8000). Compared with the situation that prevailed before May 1999, this underscores the rather

remarkable success of this Brownfield redevelopment. MASS MoCA has clearly had a significant impact on the quality and desirability of the neighborhood in which it is located. We can aggregate these property value increases to obtain an estimate of the total increase in community wealth resulting from the opening of MASS MoCA in North Adams. Summing over all residential properties yields a total impact of $13,963,633 at 2004 price levels. With a local residential property tax rate of 1.4 percent, the town benefits from an additional $195,491 in potential property tax revenues per annum. Since this is for residential property alone, it does not account for such extraordinary investments as the Holiday Inn, or The Porches Inn, which together, as reported in the local press, have added some $11 million in construction improvements.
MASS MoCA has increased community assets by almost $14 million
Figure 2
Thus MASS MoCA helps support community development through improving the economic position of homeowners, improving tax revenues for the community, as well as providing a cultural amenity that helps to attract and retain young and creative people into the city, who continue to value residential property in the city. MASS MoCA has made North Adams a better place to live without causing gentrification. A clear concern when property values increase is the prospect that gentrification will displace existing residents. While some studies of gentrification24 suggest that actual displacement of poor households is limited, experience in many locations suggests that this can be a serious community problem. Property value increases of the sort identified here, while significant in
1624 Jacob Vigdor, “Does Gentrification Harm the Poor?” Brookings-Wharton Papers on Urban Affairs, 2002, p. 133-182.

aggregate, are modest in percentage terms. They average less than 5% of total property values, with a similar expected impact on rents. In this case it might be hoped that there is limited displacement. In a community with the high levels of poverty observed in North Adams, however, even a 5% increase in rent can be devastating. We can make use of the GIS system used for our analysis to compare the rate of neighborhood stability and turnover with those areas that have experienced increases in property values.
Figure 3
Figure 3 presents a comparison of neighborhood stability in 1990 with that observed in 2000. We rely on Census data containing information about the share of local households who have moved within the past 5 years. This is not a perfect test of displacement, since those responding to the question in April 2000 had been subject to only a year of the impact from the presence of the museum. Nevertheless, if there had been a substantial increase in displacement we would expect the rate of turnover to increase in neighborhoods near the MASS MoCA site. Figure 3 shows that there has not been such an increase in turnover near MASS MoCA. Central North Adams has experienced very high rates of neighborhood turnover, even in 1990. In both 1990 and 2000 there are some neighborhoods in the city where more than 60% of the households had moved within the
17

past 5 years. Although any conclusions are preliminary, MASS MoCA seems to have helped the situation rather than made it worse. Each of the Census block groups adjacent to the MASS MoCA site either reduced or held constant their rate of neighborhood turnover. Even in some areas where the increase in property values was greatest, rates of turnover were stable. One circumstance in North Adams that may have limited any displacement effect is the relative abundance of affordable housing stock due to the history of population loss. While not always in good condition, there are many residential structures in North Adams that provide an important “safety valve” on rapid increases in property values and may help to limit displacement. The “house-by-house” micro-analytic methods we employ here could be usefully applied in less forgiving circumstances to help identify neighborhoods whose stability might be adversely impacted because of increased property values. Areas of rapid change would show up as ‘red’ neighborhoods in the figures, signaling an area of potential concern. North Adams has more businesses with more employees. The analysis presented above suggests that income, employment and wealth have all increased in North Adams as a result of the opening of MASS MoCA. These changes should be evident in observed changes in local commercial activity. Do the observed data support the analysis? First, consider the establishment of new businesses in North Adams as an indicator of economic vitality and component of community development. We can obtain comprehensive information about the number of business establishments, number of employees, and total payroll from the U.S. Census Bureau,25 although it comes to us without exact locations of the businesses. The data for the North Adams zip code are summarized in Table 8. Here we see a clear and unambiguous impact comparing the years prior to the arrival of MASS MoCA with the situation since. Comparing the average of the four years before the opening of MASS MoCA with the three years since its opening, there has been an increase of 44 new business establishments within the city, adding 255 new jobs to the city. Annual payroll in the city increased $17,898,000. We can see that of the 44 new business establishments, 31 were small businesses with fewer than ten employees, and 13 were medium sized businesses with more than ten employees but fewer than 100 employees. The North Adams business community became broader and more diverse in the years following the opening of MASS MoCA. If we return to Table 5 for a moment, we can see that IMPLAN estimated that the existence of MASS MoCA is responsible for an increase of around 230 jobs in the county. Thus, while not responsible for every new job in town, we can see what an important role the opening of MASS MoCA played in the creation of the 255 new jobs in the city. Table 8 also provides insight into the nature of employment attracted to North Adams. The fourth column in the table shows that the average salary per employee improved during the time period. After removing the effects of inflation, we see that salaries averaged less than $25,000 per year during the time before MASS MoCA opened. In the period since the museum opened, salary per employee has averaged over $27,000. This 8.5% growth in real earnings suggests that the new jobs created have not been dominated by low-wage, low skill occupations. The new employment that has come to North Adams has tended to raise average salaries.
18
25 Zip Code Business Patterns, U.S. Bureau of the Census, http://censtats.census.gov

Table 8
Employment Data for North Adams Zip Code
Year Number of
Business Establish-ments
Number of Employees
Annual Payroll Data
(2004 $)
Salary per Employee (2004 $)
Small Businesses
(X<10)
Medium Businesses
(10<X<100)
Large Businesses (100<X)
1995 404 5,368 $128,696,000 $23,975 297 96 11
1996 398 5,014 $127,058,000 $25,341 299 93 6
1997 403 5,209 $129,757,000 $24,910 305 91 7
1998 399 5,101 $131,604,000 $25,800 297 95 7
Pre MoCA Avg.
401 5173 $129,279,000 $24,991 300 94 8
1999 456 5,130 $135,543,000 $26,422 342 107 7
2000 439 5,542 $150,173,000 $27,097 327 104 8
2001 441 5,611 $155,815,000 $27,770 324 111 6
Post MoCA Avg.
445 5,428 $147,177,000 $27,114 331 107 7
Further data support the analysis of the economic impact arising from non-local visitors to the museum. The estimates presented above suggest that about one third of the local income impacts derive from these visitors. If this impact has occurred we would expect to see a large increase in visitors to North Adams, and particularly of visitors who purchase local goods and services during their visits. Data on hotel room tax collections in North Adams supports this. Figure 4 presents data on hotel tax collections for select cities and towns in Berkshire County, along with an average for all of Northern Berkshire County. All figures have been normalized to a 1994 base level of 100. We see that hotel tax collections rose an average of 75% for the northern half of the county from 1994 through 2003. Williamstown experienced only a 17% increase over the period. North Adams, by contrast, experienced spectacular growth of well over 300% during the period.26 Part of this was due to construction of new hotels, part was due to greater occupancy rates. Whatever the source, it is consistent with the economic impact predicted by the analysis presented above.
19
26 Hotel tax collections in North Adams increased from $6,757 in 1994 to $22,554 in 2003.

Hotel Tax Collections1994=100
0
50
100
150
200
250
300
350
400
450
500
1994 1995 1996 1997 1998 1999 2000 2001 2002 2003
Year
North Adams
Lenox
Lee
Pittsfield
WilliamstownN. Berkshire Average
More people are spend-ing the night in North Adams
All of the economic impacts oeconomic analyses of North Adams clearly regional economy:
• In 2002 MASS MoCA drew more
County; • Including the impact of these non-
total growth of $14.2 million for the • In 1998, the year before MASS M
Adams was $131 million. Just million, a real increase of more tha
• MASS MoCA, while being tax-ex
state and federal tax revenues eac
• Properties nearest the MASS Modollars).
• A positive impact is clear out to ab
Figure 4
f MASS MoCA are positive. The results of the reveal the positive impact of MASS MoCA on the local and
than 94,000 visitors to town from outside of Berkshire
local visitors, the existence of MASS MoCA resulted in local and regional economy in 2002.
oCA opened, the annual payroll for the town of North four years later in 2001 the annual payroll was $155 n $24 million (in 2004 constant dollars).
empt itself, provides a $2.2 million increase in local, h year.
CA site increased in value about $11,700 (in $2004
out 1.7 kilometers.
20

21
• Total impact on residential properties is almost $14 million dollars (at 2004 price levels).
• The town benefits from almost $200,000 of additional potential property tax revenues per
annum.
• $11 million dollars in extraordinary investments were made in North Adams in the Holiday Inn and The Porches Inn.
• The area around MASS MoCA has benefited from an increase in property values, but
does not seem to have suffered the population displacement often associated with gentrification. North Adams is a city with high rates of neighborhood turnover in general. Comparing 1990 and 2000 Census data of households that had moved in the past 5 years, we saw that Census block groups adjacent to the MASS MoCA site either reduced or held constant their rate of neighborhood turnover.
• Employment data from the Census Bureau show a net increase of 44 new businesses in
North Adams in the three years following the opening of MASS MoCA compared to the four years preceding its opening, adding 255 new jobs to the city. The IMPLAN analysis estimated that MASS MoCA is responsible for the addition of around 200 new jobs to the county.
• The new jobs created as a result of MASS MoCA’s existence span a variety of sectors,
including restaurants, small business, education, and medical services.
• The new jobs created have not been associated with lower than average salaries. Real salaries paid to workers in North Adams have increased.
We have used standard economic measures rarely applied to museums and cultural organizations. Determination of the appropriate level of public support for cultural organizations requires careful analysis of the impacts of these institutions on their neighborhoods and communities. In this report we have examined the case of one cultural organization, MASS MoCA. We have measured and analyzed the socio-economic impacts of MASS MoCA as experienced by its local community of North Adams, Massachusetts. We have provided documentation and analysis of how MASS MoCA has changed the desirability of its community as a place to live – using quantitative measures (hedonic methods and the tools of Geographic Information Science) that are rarely applied to museums. Our approach has analyzed the value of housing in North Adams and related changes in this value to the proximity to MASS MoCA. The approach is significant because it can be undertaken in a consistent fashion over a wide variety of communities and for a wide variety of organizations. This permits comparison and evaluation of the features of communities and museums that combine to influence the community development impact. A further advantage is that it produces numerical estimates of changes in community wealth and property values that are often of interest to local policy makers and funding sources. In an era when the responsibility for museum support has shifted to state and local levels, the development of research tools evaluating the socio-economic effects of cultural organizations on their local neighborhoods and communities is vital. This research takes a clear step in that direction.

Appendix
Modeling Neighborhood Improvement through Property Appreciation
One component of the analysis presented above relied on measurement of house price appreciation as an indicator of increased desirability of the neighborhood and improvement in community resources and wealth. This appendix provides details on the modeling that has been undertaken for this analysis. The essential idea is to employ hedonic analysis27, which determines the contribution of the variety of factors that influence the price of a house. These include the structural characteristics (such as age, lot size, internal space, etc.) and neighborhood characteristics (such as proximity to cultural amenities). The factors that have influenced the values of residential property over the period being studied must be accounted for. There are trends in regional prices due to population levels, interest rates, and the regional economy that must be considered. In our analysis we adjust all house prices to account for these regional trends and inflation using the shelter component of the regional consumer price index. We express all values in terms of 2004 constant dollars. The housing stock has aged over this time, so we account for the age of individual units based on the year of construction and the date of sale. Other observed difference in values might also be due to a tendency to sell or hold particular types of properties; for example, those with large plots of land, large or small amounts of internal space, or of particular styles of design. There are other factors (such as environmental quality) that are important to the determination of property values but that have been generally constant over the time period. These factors are accounted for in the analysis by inclusion of a constant term.
Table A1 Preliminary MASS MoCA Impact Model
Variable Coefficient t-StatConstant 44139.32 6.00Property Age (years) -1055.76 18.11Total Acres 4469.42 22.91Total Internal Space (ft2) 26.64 70.22Old Style 41340.11 7.44Ranch Style -965.57 0.12Cape Style 2387.61 0.26Colonial 12816.43 1.24Bungalow 4142.61 0.25Tudor Style 41135.79 1.66Base Value Increase 11726.89 1.53Distance effect post-MoCA 2.38 0.84Distance effect pre-MoCA 9.02 3.44
2R 0.7984 N 1461.00
Hedonic analysis examines structural and neighborhood characteristics
22
27 For further details see “Hedonic Analysis of Housing Markets” by Stephen Sheppard in Handbook of Regional and Urban Economics, Volume 3, edited by Edwin Mills and Paul Cheshire, Elsevier: Amsterdam (1999).

23
Table A1 shows the results of our analysis. The estimates have been obtained in a way that makes interpretation straightforward. For example a one-year increase in the age of the property decreases the value by $1056, increasing the lot size by 1 acre increases the value by $4469, and so on. Most important is the impact of proximity to MASS MoCA itself. Since the museum site is located near the very center of the city and was previously in industrial use, it is to be expected that, holding other factors constant, moving away from the site would increase property values during the time period before the museum opening. Table A1 confirms this expectation. Before the opening of MASS MoCA, moving 1 meter further from the Brownfield site that became the museum increased the value of a house by $9.02. Moving a house from the edge of the factory to the edge of the city could (conceptually) increase the value of the house by over $9500. As we consider locations more removed from the museum, property values still rise, but they do so much more slowly. In fact, the ‘t-statistic’ shown in the final column of Table A1 reveals that for the time period after the museum opened, this impact was not statistically significant so that we cannot reject the hypothesis that property values are now constant with respect to distance from the museum site and city center