Embed Size (px)
Citation preview

1
Cultural Diversity in
the Catholic Church
in the United States
By Mark Gray
Center for Applied Research
in the Apostolate
October 2016
Special Report

2
CARA is a national, non-profit, Georgetown University affiliated research center that conducts social scientific studies about the Catholic Church. Founded in 1964, CARA has three major dimensions to its mission: to increase the Church's self-understanding, to serve the applied research needs of Church decision-makers, to advance scholarly research on religion, particularly Catholicism. CARA’s longstanding policy is to let research findings stand on their own and never take an advocacy position or go into areas outside its social science competence.
CARA Research Staff Thomas P. Gaunt, SJ, Ph.D., CARA Executive Director Mary L. Gautier, Ph.D., Editor, The CARA Report, Senior Research Associate Mark M. Gray, Ph.D., Director, CARA Catholic Polls (CCP), Senior Research Associate Jonathon C. Holland, M.A., Research Associate Jonathon L. Wiggins, Ph.D., Director, CARA Parish Surveys, Research Associate Michal Kramarek, Ph.D., Post-doctoral Research Associate Other CARA Researchers Sr. Mary E. Bendyna, OP, Ph.D. Rev. Stephen Joseph Fichter, Ph.D. Paul M. Perl, Ph.D. Mary Ellen Fise Sr. Patricia Wittberg, SC, Ph.D. C. Joseph O’Hara, Ph.D.

3
The Catholic Church is a global faith with nearly 1.3 billion members. Less than 6 percent of the
world’s Catholics lives in the United States. There were few Catholics in the United States at its
founding. Most Catholics in the United States can trace their ancestry to historical waves of
immigration. In the 19th and much of the 20th century these immigrants most often came from
European countries. In the last 50 years, immigration from all over the world has brought
growing racial, ethnic, cultural, and linguistic diversity to parish life around the country. Nearly
half of immigrants today are Catholic. Together, these diverse communities are worshiping in
U.S. parishes in the 21st century. Today, Catholics are arguably one of the most cultural diverse
populations in the United States. In February 2013 The Secretariat for Cultural Diversity in the
Church of the United States Conference of Catholic Bishops (USCCB) commissioned the Center
for Applied Research in the Apostolate (CARA) to estimate the size and distribution of Black or
African American, Asian American or Pacific Islander, Hispanic or Latino, and American Indian
or Alaskan Native Catholic populations in the United States, as well as the locations of Catholic
parishes known to serve these communities.
Identifying Populations and Parishes
CARA utilized county-level U.S. Census data for 2010 to estimate total population sizes for
these racial and ethnic groups of any religious affiliation.1 These data were then aggregated
within the boundaries of U.S. Catholic dioceses. Survey-based estimates for the Catholic
affiliation percentage for each racial and ethnic group were then collected from recent and
publicly available surveys.2 Where possible, depending on sample sizes, CARA also estimated
these percentages for each group within USCCB regions and U.S. Census regions. These
estimates were averaged to create a national as well as specific regional Catholic percentage
estimators for each group studied. These estimators were then applied to the population totals
within each county, diocese, and region to produce a comprehensive set of Catholic population
estimates by race and ethnicity.3
CARA identified parishes that self-identify as serving or are known to serve racial, ethnic,
cultural, and/or linguistic groups in the United States. CARA combined a dozen databases of
parish addresses and information, including some provided by the Secretariat. CARA then
cleaned the database of duplicates and updated any missing or incorrect information.4 This
database of parishes is described and used here to identify how well the Church is serving
1 The U.S. Census does not ask questions about religious affiliation. 2 Including surveys from the General Social Survey (GSS), Gallup, the Pew Research Center, and the World Values Study. USCCB regional estimates are drawn from Pew’s 2007 Religious Landscape Survey. Pew’s 2012 Asian-American Survey was used to estimate Catholic religious affiliation percentages for sub-groups of Asian or Pacific Islanders. Aggregated GSS surveys from 2000 to 2012 were also utilized for estimating religious affiliation for American Indians and Alaskan Natives. All groups had a minimum of two survey estimates of Catholic affiliation—most of which were very consistent across surveys. Pew’s study of Global Christianity, the World Values Survey, the Annuarium Statisticum Ecclesiae, and the CIA World Factbook were also consulted for estimates of Catholic affiliation in country of origin populations for comparison. 3 Researchers for the Pew Forum on Religion & Public Life generously provided the county FIPs codes for respondents in the Religious Landscape Survey, which made it possible for CARA to group respondents within dioceses and USCCB regions. 4 These included lists of parishes cited in The Official Catholic Directory (OCD) as serving a particular ethnic community as well as parishes known to provide foreign language Masses from other CARA parish databases.

4
communities in counties with significant numbers of Catholics who are of different racial, ethnic,
cultural, and linguistic communities and traditions.
Population Estimates
The table below shows U.S. Census population data for race, ethnicity, and country of origin
from Census 2010 for 16 different sub-groups. The table also shows the estimated Catholic
affiliation percentage and estimated Catholic population totals for each of these groups.
U.S. Catholic Population:
Race, Ethnicity, & Birthplace Group Estimates, 2010
Population
Catholic
Population
Catholic
Affiliation %
White (non-Hispanic) 196,817,552 42,512,591 21.6%
Black, African American, African, Afro-Caribbean 38,929,319 2,919,699 7.5%
Black, African American, African,
Afro-Caribbean (non-Hispanic)
37,685,848
2,091,565
5.6%
Born in Africa 1,249,811 329,950 26.4%
Asian, Native Hawaiian, Pacific Islander5 15,214,265 2,905,925 19.1%
Filipino 3,416,840 2,214,112 64.8%
Vietnamese 1,737,433 483,006 27.8%
Chinese 4,010,114 340,860 8.5%
Korean 1,706,822 199,698 11.7%
Native Hawaiian/Other Pacific Islander 540,013 147,424 27.3%
Indian 3,183,063 146,421 4.6%
Japanese 1,304,286 56,084 4.3%
Hispanic, Latino 50,477,594 29,731,302 58.9%
Native-born 29,912,486 16,033,093 53.6%
Foreign-born 20,565,108 13,696,362 66.6%
American Indian, Alaskan Native 2,932,248 536,601 18.3%
Approximately 42.5 million U.S. residents who self-identified as non-Hispanic white were
estimated to be Catholic, representing about 21.6 percent of the 196.8 million people of this race
and ethnicity in the country in 2010. This represented the single largest racial or ethnic group
among Catholics in the United States.
Some 29.7 million U.S. residents who self-identified as Hispanic or Latino were estimated to be
Catholic, representing about 58.9 percent of the 50.5 million people of this race and ethnicity in
the country in 2010. About 16.0 million of the nation’s Hispanic or Latino Catholics were to be
born in the United States. Some 13.7 million were foreign-born.
5 Due to significant numbers of Asian American, Native Hawaiian, and Pacific Islander Americans having multiple racial, ethnic, and ancestral identities, totals for sub-groups do not add to the total Asian American, Native Hawaiian, and Pacific Islander group population number. For example, the Census estimated the population of those self-identifying as Filipino alone in 2010 was 2.6 million. However, once one also includes those self-identifying as Filipino in combination with some other identity this population totals 3.4 million.

5
About 2.9 million U.S. residents who self-identified as Asian, Native Hawaiian, or Pacific
Islander were estimated to be Catholic, representing about 19.1 percent of the 15.2 million
people of this race and ethnicity in the country in 2010. This included an estimated 2.2 million
Filipino Catholics, 483,600 Vietnamese Catholics, 340,900 Chinese Catholics, 199,700 Korean
Catholics, 147,400 Native Hawaiian or Other Pacific Islander Catholics, 146,400 Indian
Catholics, and 56,000 Japanese Catholics.6 Some 76 percent of Asian, Native Hawaiian, or
Pacific Islander Catholics were estimated to self-identify as Filipino (alone and in combination
with other identities).
Approximately 2.9 million U.S. residents who self-identified as black, African American,
African, or Afro-Caribbean were estimated to be Catholic, representing about 7.5 percent of the
38.9 million people of this race and ethnicity in the country in 2010. However, about 28 percent
of this Catholic population group also self-identified as Hispanic or Latino (e.g., most often
among Afro-Caribbean Catholic populations). The non-Hispanic African American, African, or
Afro-Caribbean Catholic population was estimated to include 2.1 million people, representing
about 5.6 percent of the 37.7 million people of this race and ethnicity. There were an estimated
330,000 Catholics who indicated they were born in a Sub-Saharan African country, representing
about 26.4 percent of the 1.2 million U.S. residents reporting a place of birth in this region.
Some 536,600 U.S. residents who self-identify as American Indian or Alaskan Native are
estimated to be Catholic, representing about 18.3 percent of the 2.9 million people of this race
and ethnicity in the country.7
The Census Bureau’s estimate for the total U.S. population on April 1, 2010, was 308,745,538.
The Census mid-year 2013 estimate of the population was 316,252,750. Thus, the U.S.
population is estimated to have grown by 2.4 percent or 7,507,212 from April 1, 2010 to July 15,
2013. There are no available estimates at this time that would allow one to gauge how much of
this growth occurred among any racial, ethnic, or national sub-group.8
The table on the following pages shows population estimates updated to 2013, which were used
for mapping populations and parishes.
6 Some of these individuals identified with more than one Asian, Native Hawaiian, or Pacific Islander group. Adding these totals would double count some individuals. Thus, the total population of Asian, Native Hawaiian, or Pacific Islander is smaller than the sum of these sub-groups. 7 Using seven waves of the General Social Survey (GSS) conducted from 2000 to 2012, CARA estimates that 18.3 percent of Native Americans self-identify as Catholic. This is based on the religious affiliation of respondents indicating that they are “American Indian or Alaskan Native” on the first of three race and ethnicity inquiries made in a survey interview. If one were to use all three references, Catholic affiliation falls to 11.9 percent. However, this broader group likely includes many who would not self-identify as American Indian or Alaskan Native on their Census form. If the 11.9 percent affiliation is used as an estimator, the number of American Indian or Alaskan Native Catholics is 348,938. 8 The estimated 2013 figures in the table below are calculated by inflating the 2010 counts by the overall population growth percentage.

6
U.S. Catholic Population:
Race, Ethnicity, & Birthplace Group Estimates, 2013 Estimates
Population
Catholic
Population
White (non-Hispanic) 201,603,212 43,546,293
Black, African American, African, Afro-Caribbean 39,875,893 2,990,692
Black, African American, African,
Afro-Caribbean (non-Hispanic) 38,602,187 2,142,422
Born in Africa 1,280,200 337,973
Asian, Native Hawaiian, Pacific Islander9 15,584,203 2,976,583
Filipino 3,499,921 2,267,949
Vietnamese 1,779,679 494,750
Chinese 4,107,621 349,148
Korean 1,748,324 204,554
Native Hawaiian/Pacific Islander 553,144 151,009
Indian 3,260,460 149,981
Japanese 1,336,000 57,448
Hispanic, Latino 51,704,967 30,454,225
Native-born 30,639,814 16,422,941
Foreign-born 21,065,153 14,029,392
American Indian, Alaskan Native 3,003,546 549,649
Culturally Diverse Parishes
CARA identified a total of 6,332 parishes that are known to serve a particular racial, ethnic,
cultural, and/or linguistic community (35.9 percent of all U.S. parishes).10 Some of these parishes
serve two or three of these communities.11 Accounting for this, a total of 6,570 communities
were identified (as shown in the figure below).
9 Due to significant numbers of Asian American, Native Hawaiian, and Pacific Islander Americans having multiple racial, ethnic, and ancestral identities, totals for sub-groups do not add to the total Asian American, Native Hawaiian, and Pacific Islander group population number. 10 As noted previously, CARA and the Emerging Models of Pastoral Leadership Project estimated that there are approximately 6,700 multicultural parishes in the United States. It is important to note again that some of these sites are not canonical parishes and instead are missions or Catholic faith communities meeting in places other than a Catholic parish. 11 A total of 230 parishes serve two and eight parishes serve three.

7
The largest number of these parishes, a total of 4,544, serve Hispanic or Latino Catholic
communities. A total of 946 serve a European Catholic community (e.g., Italian, Polish, or
Ukrainian) or another Catholic group not included in the other categories of the figure above. A
total of 516 parishes were identified as serving black, African American, African, or Afro-
Caribbean Catholics. Some 463 serve Asian, Native Hawaiian, or Pacific Islander Catholics. A
total of 101 parishes were identified as serving American Indian or Alaskan Native Catholics.
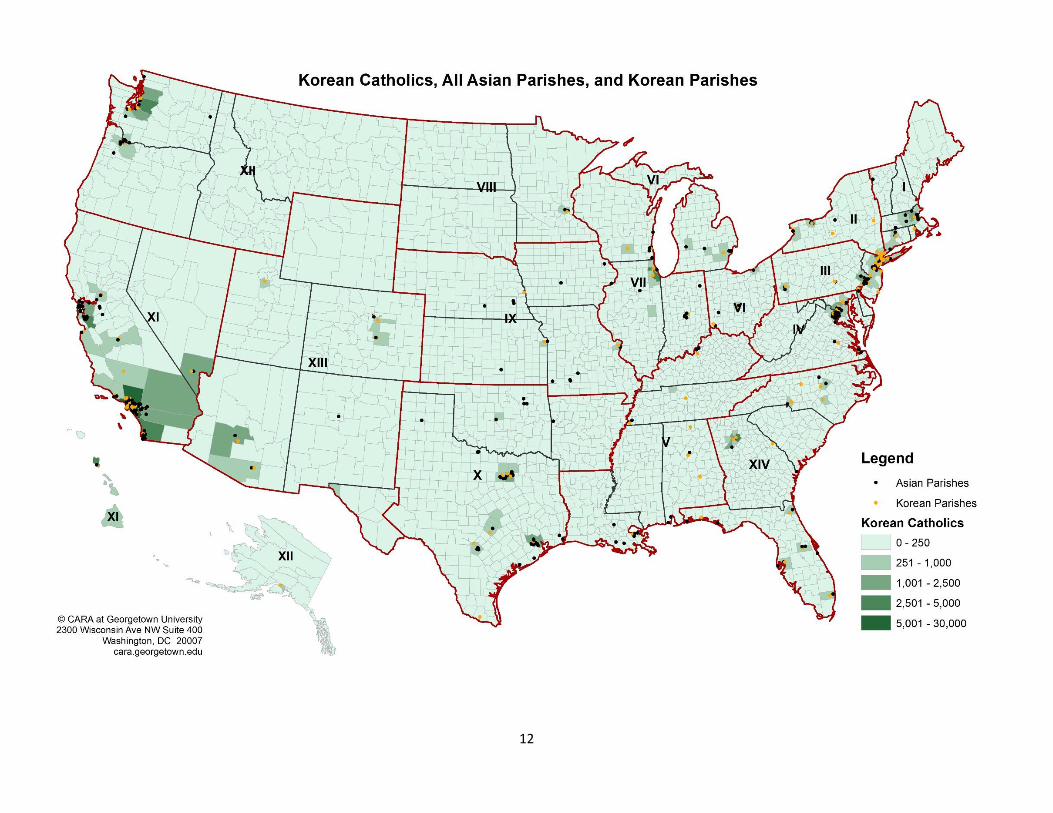
Maps on the following pages geocode the location of parishes and populations.16

8
12
12 Green shading indicates the size range of the Catholic sub-group population within each county. Black dots indicate the location of a parish serving that community. Red lines indicate USCCB region boundaries.

9

10
Note: Maps for Asian, Native Hawaiian and Other Pacific Islander sub-groups include black markers for all parishes identified as ministering to this population generally.
Additionally, those parishes indicating ministry to the specific sub-group of the population mapped are identified as gold markers. This is done as many of the parishes serving
Asian, Native Hawaiian and Other Pacific Islander are not identified by the specific communities they may serve.

11
12

13

14

15
In-Pew Surveys of Parishioners in Culturally Diverse Parishes
In August 2014, CARA began conducting in-pew surveys with parishioners at parishes identified
by CARA in the first phase of the project.13 A total of 118 parishes were invited to participate in
the project with a goal of completing surveys in approximately 30 parishes. Thirty-five parishes
declined to participate. Surveys were completed in 29 parishes as of May 2016. An additional 54
parishes had not declined, but had yet to complete the steps needed for participation before the
study was completed.
The results shown here are for the 11,142 respondents, adults and teens, in the 29 participating
parish communities. The sample includes four parishes serving primarily Hispanic or Latino
communities; four serving primarily black, African American, African, or Afro-Caribbean
communities; seven serving primarily Asian, Native Hawaiian, or other Pacific Islander
communities; seven serving American Indian or Native Alaskan communities; and seven
multicultural parishes serving multiple racial, ethnic, cultural, or linguistic communities.14
Detailed Race, Ethnicity, Nationality, & Birthplace of Respondents
Number of
Respondents
Hispanic or Latino 2,573
U.S. born, Hispanic or Latino 713
Foreign-born, Hispanic or Latino 1,763
Unknown birth location, Hispanic or Latino 96
Asian, Native Hawaiian, or other Pacific Islander 3,658
Filipino 2,030
Vietnamese 336
Korean 211
Other Asian, Native Hawaiian, or Pacific Islander 1,081
Black, African American, African, or Afro-Caribbean 1,184
U.S. born, black or African American 568
Foreign-born, black, African, Afro-Caribbean 595
Unknown birth location, black, African, African-American, Afro-Caribbean 21
American Indian or Native Alaskan 365
Non-Hispanic white 2,165
U.S. born, non-Hispanic white 1,891
Foreign-born, non-Hispanic white 276
Multi-racial 241
Other race, ethnicity, nationality 32
Unknown 924
13 Stratification is used in the random sampling to ensure geographic representation as well as reaching the broadest number of racial, ethnic, cultural, and linguistic groups. 14 In some cases, a parish had been identified as a Hispanic parish or Asian parish in phase one of the project. However, upon completing the survey we discovered the parish is actually multicultural.

16
The table on the preceding page provides a detailed profile of the race, ethnicity, nationality and
birth place of parishioner respondents.15 For reliable reporting a sub-group must have at least 100
respondents. Not all respondents reported a place of birth.
There are substantial differences in the sizes of parishes by the types of communities they serve.
The average parish primarily serving Hispanic or Latino Catholics had 805 respondents. By
comparison, the average parish primarily serving American Indian or Native Alaskan Catholics
had 74 respondents and Asian parishes had, on average, 260 respondents.
Overall 56 percent of respondents indicated having been born outside the United States. All
respondents, regardless of place of birth, were asked, “What is the primary language used in your
home?” Seven options were provided along with an “other” option where the respondent could
specify a language that was not listed. A majority of respondents did not indicate use of English
as the primary language at home (54 percent).
CARA translated the survey into 20 different languages other than English at the request of the
pastors. Additionally, there were 19 languages that at least ten respondents indicated as the
primary language in their home. The most common, other than English, were Spanish, Tagalog,
Vietnamese, Ilocano, Korean, and Igbo.
Background and Demographics
The median age for all respondents is 52. The median age for non-Hispanic white Catholics in
the pews in culturally diverse parishes is 62. By comparison the median age for Hispanic
Catholics is 42. Median ages for other groups are in the middle to early 50s. The largest segment
of parishioners in multicultural parishes (37 percent) are of the Post-Vatican II Generation (born
1961 to 1981) and are between the ages of 34 and 54. Eighteen percent are Millennials (born
1982 or later), 33 percent are of the Vatican II Generation (born 1943 to 1960), and 12 percent
are of the Pre-Vatican II Generation (born before 1943).
15 Respondents provided their race or ethnicity, place of birth, and language used at home. Using all of these pieces of information sub-groups of respondents are identified. Multi-racial respondents selected more than one race group (excluding Hispanic or Latino, an ethnicity).

17
Parishioners are 61 percent female and 39 percent male. This is not unusual for in-pew surveys
of Catholic parishes. The largest gender gap is among black or African American respondents
who were born in the U.S. This sub-group is 72 percent female an 28 percent male. Vietnamese
respondents are majority male (54 percent).
Gender of Respondents
Male Female
All Respondents: 39% 61% Hispanic or Latino 39 61 U.S. born, Hispanic or Latino 37 63 Foreign-born, Hispanic or Latino 39 61 Asian, Native Hawaiian, or other Pacific Islander 39 61 Filipino 35 65 Vietnamese 54 46 Korean 34 66 Other Asian, Native Hawaiian, Pacific Islander 43 57 Black, African American, African, Afro-Caribbean 34 66 U.S. born, black or African American 28 72 Foreign-born, black, African, Afro-Caribbean 40 60 American Indian, Native Alaskan 38 62 Non-Hispanic white 41 59

18
They typical respondent is married (70 percent) and has one child living in their home. Those
with school age children are much more likely to enroll children in a Catholic school than the
Catholic population. This is to be expected as all respondents are Mass attenders. Enrollment of
children among parents with school-age children is very common among multi-racial and
Vietnamese respondents (42 percent and 39 percent, respectively). This is least common among
foreign-born Hispanic or Latino parents (22 percent).
Religious Practice
Respondents who have ever married are especially likely to have married in the Church.
Majorities of all sub-groups indicate this. Again, this is expected as all respondents are Mass
attenders. Vietnamese Catholics are most likely to have married in the Church (93 percent) and
Korean respondents are least likely to have done so (55 percent). The later are among the most
likely to have converted to Catholicism and may have married before this change.

19
Eighty-three percent of respondents have received their First Communion and 77 percent have
been confirmed. Fifteen percent have received the Anointing of the Sick at some point in life.
There are some variations between sub-groups. Korean respondents are the least likely to have
received their First Communion (70 percent).16 Hispanic and non-Hispanic white respondents are
the most likely to have received this (91 percent and 94 percent, respectively).
16 More Korean respondents indicate being confirmed than receiving their First Communion. Many Korean respondents are converts to Catholicism and may have experienced sacraments simultaneously upon entering the Church.

20
Have you received… Percentage responding they have:
First
Communion
Confirmation Anointing
of Sick
All Respondents: 83% 77% 15% Hispanic or Latino 91 84 17 U.S. born, Hispanic or Latino 91 80 11 Foreign-born, Hispanic or Latino 92 87 20 Asian, Native Hawaiian, or other Pacific Islander 86 77 11 Filipino 88 77 11 Vietnamese 80 76 15 Korean 70 76 4 Other Asian, Native Hawaiian, Pacific Islander 87 77 10 Black, African American, African, Afro-Caribbean 88 82 16 U.S. born, black or African American 89 84 22 Foreign-born, black, African, Afro-Caribbean 88 81 11 American Indian, Native Alaskan 85 75 26 Non-Hispanic white 94 92 20
CARA asked respondents. What best describes you? Active Catholic, returned Catholic, convert,
inactive Catholic, or non-Catholic. Respondents could select one of these. Three in four (76
percent) say they are “active Catholics.” Nine percent are “returned Catholics” who may had left
the faith for a period of time and have now returned. Eight percent indicate they are “converts” to
Catholicism. Two percent are “non-Catholics,” most often attending Mass with a Catholic
relative. Five percent are “inactive Catholics.” These respondents, although in the pews, may
consider themselves to be inactive because they are infrequent attenders, not receiving
Communion, or because they are attending Mass with an active Catholic and do not regularly
practice their Catholic faith otherwise.
Asian, Native Hawaiian and other Pacific Islander respondents are most likely to consider
themselves to be “active Catholics” (82 percent). American Indian and Native Alaskan
respondents are most likely to identify as a returned Catholic (22 percent). Black, African
American, African, or Afro-Caribbean respondents are most likely to identify as converts (13
percent).

21
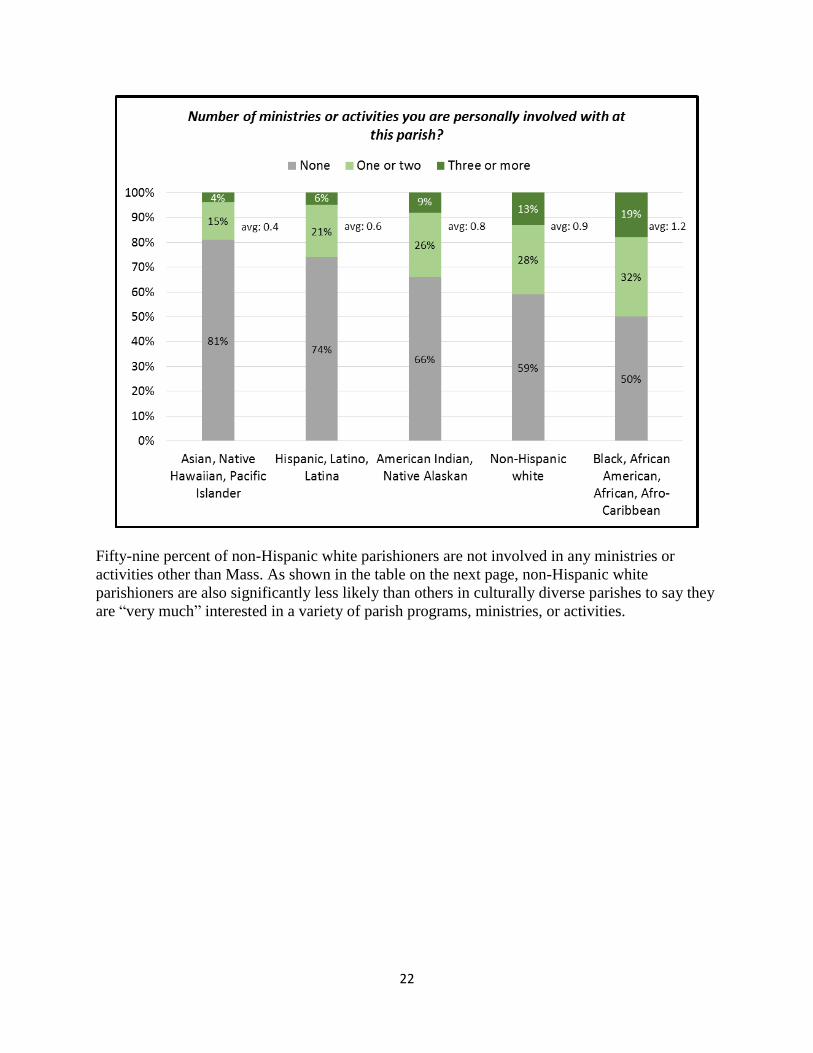
Although Asian, Native Hawaiian and other Pacific Islander respondents were the most likely to
identify themselves as active Catholics, these parishioners also report the least personal
involvement in ministries or activities (81 percent are not involved in any). Black, African
American, African, and Afro-Caribbean parishioners are the most likely to report personal
involvement in ministries and activities (half are active in at least one).
59%
68%
73%
79%
82%
22%
8%
13%
10%
5%
11%
19%
10%
2%
6%
4%
2%
2%
8%
5%
4%
2%
2%
1%
1%
0% 10% 20% 30% 40% 50% 60% 70% 80% 90%100%
American Indian, Native Alaskan
Black, African American, African, Afro-Caribbean
Non-Hispanic white
Hispanic, Latino, Latina
Asian, Native Hawaiian, Pacific Islander
What best describes you?
Active Catholic Returned Catholic Convert Inactive Catholic Non-Catholic
22
Fifty-nine percent of non-Hispanic white parishioners are not involved in any ministries or
activities other than Mass. As shown in the table on the next page, non-Hispanic white
parishioners are also significantly less likely than others in culturally diverse parishes to say they
are “very much” interested in a variety of parish programs, ministries, or activities.

23
Overall, 67 percent of respondents are registered with their parish and 83 percent say this is their
primary place of worship. A majority, 52 percent, live closer to another Catholic parish. This
likely means many are “driving by” their territorial parish to attend the parish they were
surveyed in. This may be because this parish best serves their needs.
Black, African American, African, and Afro-Caribbean parishioners and multi-racial
parishioners are the most likely to be registered with their parish (81 percent each) and Asian,
Native Hawaiian, and other Pacific Islanders are the least likely to have done so (59 percent).
American Indian and Native Alaskan parishioners (40 percent), Non-Hispanic white parishioners
(44 percent), and Hispanic or Latino parishioners are the least likely to drive by their territorial
parish to attend Mass elsewhere. Majorities attend at their territorial parish. Black, African
American, African, Afro-Caribbean parishioners (62 percent), Asian, Native Hawaiian, and other
Pacific Islander parishioners (58 percent), and multi-racial parishioners (56 percent) are most
likely to attend a parish that is not closest to their home. Majorities of each group attend parishes
that are more distant than their local parish community.

24
Cultural Diversity
Two key questions on the survey capture opinions about growing diversity and the parish’s
recognition of this. Respondents were asked if their parish should be more involved in
celebrating cultural diversity and if they would like to see more diversity in their parish. The
figure on the following page shows how many respondents “strongly agreed” with both
statements. Majorities of only four groups “strongly agreed” that they would like to see more
diversity in their parish: foreign-born black, African, Afro-Caribbean Catholics (66 percent),
foreign-born Hispanic, Latino, or Latina Catholics (54 percent), Vietnamese Catholics (60
percent), and Filipino Catholics (59 percent). Only 20 percent of non-Hispanic white Catholics
“strongly agree” with this statement. Responses to the two statements are correlated. Those who
want to see their parish more involved in celebrating cultural diversity also would like to see
more diversity in their parish.

25
Eighty-three percent of respondents agree “somewhat” or “strongly” that parishioners at their
parish are eager to understand different cultures in their parish community. Korean, U.S. born
Hispanic or Latino, and U.S. born Non-Hispanic white respondents are least likely to “strongly”
agree with this statement (31 percent, 25 percent, and 25 percent, respectively). Majorities of the
following sub-groups agree “strongly”: Filipino respondents (55 percent), foreign-born black,
African, or Afro-Caribbean respondents (53 percent), and Vietnamese respondents (51 percent).
More than nine in ten respondents (94 percent) agree at least “somewhat” that having people of
different cultural backgrounds enriches their parish. Korean respondents are the least likely to
“strongly” agree with the statement (32 percent). U.S. born black or African American
respondents are most likely to strongly agree (78 percent).
One in four parishioners (24 percent) agrees at least “somewhat” that they feel like an outsider in
their parish because of their nationality, race, ethnicity, language, or culture. This is most

26
common among foreign-born Hispanic or Latino respondents (36 percent) and multi-racial
respondents (32 percent). U.S. born black or African American respondents are most likely to
“strongly” disagree (76 percent).
Ninety-two percent of respondents agree “somewhat” or “strongly” that their parish is
welcoming to members of different nationalities, cultures, races, and ethnicities. Those in
parishes primarily serving black Catholics are most likely to “strongly” agree that their parish is
welcoming to members of different nationalities, cultures, races, and ethnicities (82 percent).
Respondents were asked if their parish should be more involved in welcoming a variety of
groups. The table below shows results for four racial and ethnic groups and how people of seven
different races and ethnicities responded. Generally, Hispanic or Latino parishioners are more
likely than those of any other sub-group to believe their parish should be more welcoming to
other groups—even parishioners who are members of these groups. For example, 72 percent of
Hispanic parishioners “strongly agree” that their parish should be more welcoming to African
American and African Catholics. No other sub-group of parishioners is more likely to “strongly
agree.”
Seventy-two percent of respondents agree at least “somewhat” that parishioners talk openly
about cultural diversity in the parish. Foreign-born Hispanic or Latino respondents are most
likely to agree “strongly” that parishioners do this (47 percent).
Eighty-four percent of parishioners agree “somewhat” or “strongly” that parishioners of different
cultures participate in parish life together. Those worshiping in a parish serving black Catholics
are especially likely to strongly agree with this statement (55 percent). Vietnamese respondents
are also especially likely to “strongly” agree (57 percent). U.S. born Non-Hispanic white,
Korean, and American Indian or Native Alaskan parishioners are among the least likely to
“strongly” agree (36 percent, 17 percent, and 36 percent, respectively).

27
Overall, three in ten parishioners (31 percent) agree at least “somewhat” that there is some
tension between different cultural groups in the parish. Hispanic or Latino parishioners are most
likely to “somewhat” agree with this statement (38 percent) and non-Hispanic white respondents
are the least likely to do so (29 percent).
Forty-six percent of respondents agree “somewhat” or “strongly” that their parish celebrates
differently than many other Catholic parishes in the United States. Nearly seven in ten
parishioners (69 percent) in parishes serving black Catholics responded as such.
Eighty-six percent of parishioners agree “somewhat” or “strongly” that they would like more
parish events that that bring together parishioners of different nationalities, ethnicities,
languages, cultures, and races. Foreign-born Hispanic or Latino parishioners are most likely to
“strongly” agree with this statement (66 percent). Non-Hispanic white parishioners are least
likely to “strongly” agree with this statement (30 percent).
Eighty-two percent of parishioners agree at least “somewhat” that their parish should be more
involved in understanding the different cultures that exist within the parish community. U.S.
born Non-Hispanic white parishioners are the least likely to agree “strongly” with this (21
percent). Hispanic or Latino respondents are the most likely to respond as such (54 percent).

28
Eighty-eight percent of respondents agree “somewhat” or “strongly” that parishioners worship
and share together as one community. Parishioners in parishes serving black Catholics are
especially likely to “strongly” agree with this statement (69 percent).
Eighty-eight percent of respondents agree “somewhat” or “strongly” that their parish encourages
a dialogue and collaboration among various cultures. Foreign-born Hispanic or Latino
parishioners are especially likely to “strongly” agree with this statement (68 percent). Korean
respondents are least likely to respond as such (21 percent).
Conclusions and Implications
The Catholic Church in the United States is one of the most culturally diverse institutions in the
country and it will become even more diverse in the future. Parishes, schools and colleges,
hospitals, charities, and other ministries need to adapt and prepare for this growing diversity.
In the pews, many of those who are most comfortable with growing diversity are those who
immigrated to the United States or are the children of foreign-born parents. Those who are
descendants of older waves of immigration from Europe appear to be the less comfortable and
less willing to engage in parish life beyond attending Mass.
Some of these trends reported here represent challenges to building a sense of community in
parishes. At the same time the results of this study reveal extraordinary opportunities for the
Church. The global community of Catholics can be wittnesed in the pews of many parishes in
this country. Few other institutions in the United States are as culturally diverse as the Catholic
Church.

29
Appendix: Frequencies of Parishioner Responses to the Cultural Diversity Questions17
Parishioners are eager to understand the different cultures in this parish community. Percentage responding as such:
Strongly
agree Somewhat
agree Somewhat
disagree Strongly disagree
All Respondents: Weighted (equal parish size) 41% 44% 11% 4% Un-weighted 41 42 11 6 Parish Serves Community: Hispanic or Latino 38 42 14 7 Black, African American, African, Afro-Caribbean 52 38 7 3 Asian, Native Hawaiian, or other Pacific Islander 46 44 7 3 American Indian or Native Alaskan 34 46 13 7 Multicultural 39 44 11 6 Parishioner Race or Ethnicity: Hispanic or Latino 40 37 13 10 U.S. born, Hispanic or Latino 31 46 15 9 Foreign-born, Hispanic or Latino 44 33 13 11 Asian, Native Hawaiian, or other Pacific Islander
49
41
7
3
Filipino 55 38 5 3 Vietnamese 51 38 8 2 Korean 25 51 15 10 Other Asian, Native Hawaiian, Pacific Islander 41 48 9 3 Black, African American, African, Afro-Caribbean
47
41
8
4
U.S. born, black or African American 41 45 10 4 Foreign-born, black, African, Afro-Caribbean 53 37 6 4 American Indian, Native Alaskan 38 44 14 5 Non-Hispanic white 27 53 15 5 U.S. born, non-Hispanic white 25 54 15 5 Foreign-born, non-Hispanic white 36 45 15 4 Multi-racial 43 40 12 5
Other or unknown 39 41 13 7
17 Percentages in tables can add to 99 to 101 due to rounding error.

30
Having people of different cultural backgrounds enriches this parish. Percentage responding as such:
Strongly
agree Somewhat
agree Somewhat
disagree Strongly disagree
All Respondents: Weighted (equal parish size) 67% 23% 6% 4% Un-weighted 71 22 4 3 Parish Serves Community: Hispanic or Latino 69 23 5 3 Black, African American, African, Afro-Caribbean 79 16 3 2 Asian, Native Hawaiian, or other Pacific Islander 68 25 5 2 American Indian or Native Alaskan 52 27 11 10 Multicultural 73 21 4 3 Parishioner Race or Ethnicity: Hispanic or Latino 77 16 3 4 U.S. born, Hispanic or Latino 75 20 3 2 Foreign-born, Hispanic or Latino 77 15 3 5 Asian, Native Hawaiian, or other Pacific Islander
71
22
4
3
Filipino 74 21 3 2 Vietnamese 60 31 5 4 Korean 32 34 17 17 Other Asian, Native Hawaiian, Pacific Islander 76 19 3 2 Black, African American, African, Afro-Caribbean
77
18
3
2
U.S. born, black or African American 78 18 2 2 Foreign-born, black, African, Afro-Caribbean 76 18 3 3 American Indian, Native Alaskan 58 27 10 5 Non-Hispanic white 64 28 5 2 U.S. born, non-Hispanic white 64 29 5 2 Foreign-born, non-Hispanic white 69 20 7 5 Multi-racial 73 20 4 4
Other or unknown 63 26 7 4

31
I feel that parish leadership and staff understand my culture. Percentage responding as such:
Strongly
agree Somewhat
agree Somewhat
disagree Strongly disagree
All Respondents: Weighted (equal parish size) 57% 32% 7% 4% Un-weighted 57 31 8 4 Parish Serves Community: Hispanic or Latino 59 30 8 3 Black, African American, African, Afro-Caribbean 63 28 4 5 Asian, Native Hawaiian, or other Pacific Islander 61 31 5 3 American Indian or Native Alaskan 54 29 11 6 Multicultural 54 33 9 4 Parishioner Race or Ethnicity: Hispanic or Latino 59 29 8 4 U.S. born, Hispanic or Latino 50 39 8 4 Foreign-born, Hispanic or Latino 62 25 9 4 Asian, Native Hawaiian, or other Pacific Islander
58
33
6
3
Filipino 64 30 4 2 Vietnamese 54 32 10 4 Korean 28 43 19 10 Other Asian, Native Hawaiian, Pacific Islander 52 38 8 2 Black, African American, African, Afro-Caribbean
54
33
8
4
U.S. born, black or African American 56 33 7 4 Foreign-born, black, African, Afro-Caribbean 53 34 9 5 American Indian, Native Alaskan 60 28 8 4 Non-Hispanic white 61 29 7 3 U.S. born, non-Hispanic white 62 29 7 3 Foreign-born, non-Hispanic white 54 31 11 5 Multi-racial 51 34 9 6
Other or unknown 50 35 10 5

32
I would like to see more priests of different cultural backgrounds in the parish. Percentage responding as such:
Strongly
agree Somewhat
agree Somewhat
disagree Strongly disagree
All Respondents: Weighted (equal parish size) 40% 36% 15% 9% Un-weighted 47 33 12 7 Parish Serves Community: Hispanic or Latino 48 32 14 7 Black, African American, African, Afro-Caribbean 50 34 10 6 Asian, Native Hawaiian, or other Pacific Islander 46 38 11 5 American Indian or Native Alaskan 37 31 17 15 Multicultural 49 32 11 8 Parishioner Race or Ethnicity: Hispanic or Latino 54 28 10 8 U.S. born, Hispanic or Latino 44 36 14 6 Foreign-born, Hispanic or Latino 58 25 9 9 Asian, Native Hawaiian, or other Pacific Islander
55
33
7
5
Filipino 61 31 5 3 Vietnamese 51 36 7 6 Korean 23 27 19 31 Other Asian, Native Hawaiian, Pacific Islander 51 35 9 5 Black, African American, African, Afro-Caribbean
56
32
8
4
U.S. born, black or African American 45 41 10 4 Foreign-born, black, African, Afro-Caribbean 67 24 5 4 American Indian, Native Alaskan 44 35 15 6 Non-Hispanic white 22 41 25 12 U.S. born, non-Hispanic white 20 42 27 11 Foreign-born, non-Hispanic white 34 34 18 14 Multi-racial 49 34 9 8
Other or unknown 48 32 13 7

33
I would like to see more diversity in the parish. Percentage responding as such:
Strongly
agree Somewhat
agree Somewhat
disagree Strongly disagree
All Respondents: Weighted (equal parish size) 41% 39% 15% 5% Un-weighted 45 37 13 5 Parish Serves Community: Hispanic or Latino 43 36 15 6 Black, African American, African, Afro-Caribbean 50 34 11 5 Asian, Native Hawaiian, or other Pacific Islander 48 37 11 4 American Indian or Native Alaskan 34 45 15 6 Multicultural 47 36 12 5 Parishioner Race or Ethnicity: Hispanic or Latino 50 34 11 5 U.S. born, Hispanic or Latino 42 40 13 5 Foreign-born, Hispanic or Latino 54 31 10 6 Asian, Native Hawaiian, or other Pacific Islander
55
35
8
2
Filipino 59 33 6 2 Vietnamese 60 31 7 2 Korean 36 39 20 5 Other Asian, Native Hawaiian, Pacific Islander 50 38 10 2 Black, African American, African, Afro-Caribbean
55
33
8
4
U.S. born, black or African American 45 40 12 3 Foreign-born, black, African, Afro-Caribbean 66 27 4 3 American Indian, Native Alaskan 37 46 12 5 Non-Hispanic white 20 45 26 9 U.S. born, non-Hispanic white 20 45 26 10 Foreign-born, non-Hispanic white 24 47 21 9 Multi-racial 50 34 9 7
Other or unknown 44 35 14 7

34
I often feel like an outsider at this parish because of my nationality, race, ethnicity, language, or culture.
Percentage responding as such:
Strongly agree
Somewhat agree
Somewhat disagree
Strongly disagree
All Respondents: Weighted (equal parish size) 10% 12% 14% 64% Un-weighted 12 12 15 61 Parish Serves Community: Hispanic or Latino 17 14 14 55 Black, African American, African, Afro-Caribbean 7 8 9 76 Asian, Native Hawaiian, or other Pacific Islander 12 14 16 58 American Indian or Native Alaskan 9 10 15 66 Multicultural 11 11 16 62 Parishioner Race or Ethnicity: Hispanic or Latino 18 13 13 56 U.S. born, Hispanic or Latino 9 11 14 66 Foreign-born, Hispanic or Latino 22 14 13 51 Asian, Native Hawaiian, or other Pacific Islander
10
12
18
60
Filipino 11 10 16 63 Vietnamese 13 18 21 48 Korean 9 19 20 52 Other Asian, Native Hawaiian, Pacific Islander 9 12 18 61 Black, African American, African, Afro-Caribbean
9
13
10
68
U.S. born, black or African American 5 9 9 76 Foreign-born, black, African, Afro-Caribbean 13 15 11 61 American Indian, Native Alaskan 13 10 18 59 Non-Hispanic white 8 11 13 68 U.S. born, non-Hispanic white 8 11 13 68 Foreign-born, non-Hispanic white 10 12 12 67 Multi-racial 17 14 16 53
Other or unknown 17 15 16 52

35
The parish is welcoming to members of different nationalities, cultures, races, and ethnicities.
Percentage responding as such:
Strongly agree
Somewhat agree
Somewhat disagree
Strongly disagree
All Respondents: Weighted (equal parish size) 72% 20% 5% 3% Un-weighted 70 22 4 4 Parish Serves Community: Hispanic or Latino 70 21 5 4 Black, African American, African, Afro-Caribbean 82 14 2 2 Asian, Native Hawaiian, or other Pacific Islander 75 18 4 3 American Indian or Native Alaskan 61 23 9 7 Multicultural 70 22 4 4 Parishioner Race or Ethnicity: Hispanic or Latino 65 22 7 6 U.S. born, Hispanic or Latino 63 24 7 6 Foreign-born, Hispanic or Latino 66 22 7 5 Asian, Native Hawaiian, or other Pacific Islander
75
19
4
3
Filipino 80 15 2 3 Vietnamese 75 20 3 2 Korean 38 35 19 9 Other Asian, Native Hawaiian, Pacific Islander 71 23 4 2 Black, African American, African, Afro-Caribbean
78
17
3
2
U.S. born, black or African American 78 16 3 3 Foreign-born, black, African, Afro-Caribbean 78 17 3 2 American Indian, Native Alaskan 72 17 5 6 Non-Hispanic white 72 22 3 3 U.S. born, non-Hispanic white 72 22 3 2 Foreign-born, non-Hispanic white 68 23 5 4 Multi-racial 67 19 7 7
Other or unknown 66 24 5 5

36
I am best able to read the bulletin and parish website in a language other than English.
Percentage responding as such:
Strongly agree
Somewhat agree
Somewhat disagree
Strongly disagree
All Respondents: Weighted (equal parish size) 26% 17% 12% 45% Un-weighted 30 18 13 39 Parish Serves Community: Hispanic or Latino 35 17 11 37 Black, African American, African, Afro-Caribbean 20 11 13 56 Asian, Native Hawaiian, or other Pacific Islander 34 24 15 28 American Indian or Native Alaskan 23 18 14 45 Multicultural 27 19 14 40 Parishioner Race or Ethnicity: Hispanic or Latino 44 19 12 25 U.S. born, Hispanic or Latino 24 23 14 38 Foreign-born, Hispanic or Latino 52 17 11 19 Asian, Native Hawaiian, or other Pacific Islander
32
24
16
28
Filipino 32 26 17 25 Vietnamese 47 24 15 14 Korean 33 23 10 35 Other Asian, Native Hawaiian, Pacific Islander 26 21 16 37 Black, African American, African, Afro-Caribbean
24
16
13
47
U.S. born, black or African American 16 12 12 60 Foreign-born, black, African, Afro-Caribbean 32 19 15 34 American Indian, Native Alaskan 23 21 16 40 Non-Hispanic white 13 8 7 71 U.S. born, non-Hispanic white 12 8 7 73 Foreign-born, non-Hispanic white 25 11 8 56 Multi-racial 34 13 15 39
Other or unknown 31 19 15 36

37
Parishioners talk openly about cultural diversity in the parish. Percentage responding as such:
Strongly
agree Somewhat
agree Somewhat
disagree Strongly disagree
All Respondents: Weighted (equal parish size) 31% 39% 21% 9% Un-weighted 32 40 20 9 Parish Serves Community: Hispanic or Latino 35 37 20 9 Black, African American, African, Afro-Caribbean 36 38 18 7 Asian, Native Hawaiian, or other Pacific Islander 37 40 18 5 American Indian or Native Alaskan 23 38 24 15 Multicultural 29 42 20 9 Parishioner Race or Ethnicity: Hispanic or Latino 41 33 17 9 U.S. born, Hispanic or Latino 25 41 25 9 Foreign-born, Hispanic or Latino 47 30 14 9 Asian, Native Hawaiian, or other Pacific Islander
33
43
18
6
Filipino 34 45 15 6 Vietnamese 53 35 10 2 Korean 12 36 30 23 Other Asian, Native Hawaiian, Pacific Islander 30 41 23 6 Black, African American, African, Afro-Caribbean
35
37
19
9
U.S. born, black or African American 29 41 21 9 Foreign-born, black, African, Afro-Caribbean 40 33 19 8 American Indian, Native Alaskan 25 43 21 11 Non-Hispanic white 21 44 25 10 U.S. born, non-Hispanic white 19 45 25 11 Foreign-born, non-Hispanic white 28 39 24 9 Multi-racial 29 35 25 11
Other or unknown 30 37 22 11

38
Parishioners of different cultures participate in parish life together. Percentage responding as such:
Strongly
agree Somewhat
agree Somewhat
disagree Strongly disagree
All Respondents: Weighted (equal parish size) 46% 36% 11% 6% Un-weighted 46 38 11 5 Parish Serves Community: Hispanic or Latino 44 36 12 8 Black, African American, African, Afro-Caribbean 55 34 9 3 Asian, Native Hawaiian, or other Pacific Islander 50 37 8 5 American Indian or Native Alaskan 36 38 14 12 Multicultural 45 39 11 5 Parishioner Race or Ethnicity: Hispanic or Latino 48 32 11 9 U.S. born, Hispanic or Latino 38 39 14 8 Foreign-born, Hispanic or Latino 52 29 10 9 Asian, Native Hawaiian, or other Pacific Islander
50
38
8
4
Filipino 54 37 6 3 Vietnamese 57 32 7 4 Korean 17 41 22 20 Other Asian, Native Hawaiian, Pacific Islander 46 41 10 3 Black, African American, African, Afro-Caribbean
51
35
10
4
U.S. born, black or African American 44 42 10 4 Foreign-born, black, African, Afro-Caribbean 58 28 10 4 American Indian, Native Alaskan 36 38 15 10 Non-Hispanic white 37 42 14 7 U.S. born, non-Hispanic white 36 43 14 7 Foreign-born, non-Hispanic white 45 38 12 4 Multi-racial 46 40 6 9
Other or unknown 44 38 13 6

39
There is some tension between different cultural groups in the parish. Percentage responding as such:
Strongly
agree Somewhat
agree Somewhat
disagree Strongly disagree
All Respondents: Weighted (equal parish size) 10% 20% 22% 48% Un-weighted 12 19 23 46 Parish Serves Community: Hispanic or Latino 17 22 21 41 Black, African American, African, Afro-Caribbean 9 17 19 55 Asian, Native Hawaiian, or other Pacific Islander 12 20 25 43 American Indian or Native Alaskan 12 21 22 44 Multicultural 10 18 24 49 Parishioner Race or Ethnicity: Hispanic or Latino 17 21 20 41 U.S. born, Hispanic or Latino 11 17 23 49 Foreign-born, Hispanic or Latino 20 23 19 38 Asian, Native Hawaiian, or other Pacific Islander
10
18
24
48
Filipino 10 17 23 49 Vietnamese 13 21 24 43 Korean 14 23 27 37 Other Asian, Native Hawaiian, Pacific Islander 10 18 24 48 Black, African American, African, Afro-Caribbean
10
17
19
55
U.S. born, black or African American 7 16 20 58 Foreign-born, black, African, Afro-Caribbean 12 17 19 52 American Indian, Native Alaskan 13 20 24 43 Non-Hispanic white 9 20 25 46 U.S. born, non-Hispanic white 8 21 25 45 Foreign-born, non-Hispanic white 9 15 21 55 Multi-racial 20 18 24 39
Other or unknown 15 21 21 43

40
I feel like this parish celebrates differently than many other Catholic parishes in the U.S.
Percentage responding as such:
Strongly agree
Somewhat agree
Somewhat disagree
Strongly disagree
All Respondents: Weighted (equal parish size) 24% 26% 22% 28% Un-weighted 22 24 22 33 Parish Serves Community: Hispanic or Latino 25 25 20 30 Black, African American, African, Afro-Caribbean 40 29 12 19 Asian, Native Hawaiian, or other Pacific Islander 20 24 23 33 American Indian or Native Alaskan 20 28 26 27 Multicultural 38 24 22 17 Parishioner Race or Ethnicity: Hispanic or Latino 29 23 16 33 U.S. born, Hispanic or Latino 17 24 25 34 Foreign-born, Hispanic or Latino 33 23 12 32 Asian, Native Hawaiian, or other Pacific Islander
16
23
25
36
Filipino 16 22 22 40 Vietnamese 19 22 23 36 Korean 21 34 28 17 Other Asian, Native Hawaiian, Pacific Islander 15 23 31 31 Black, African American, African, Afro-Caribbean
29
27
16
28
U.S. born, black or African American 30 29 16 25 Foreign-born, black, African, Afro-Caribbean 27 26 16 31 American Indian, Native Alaskan 20 27 27 26 Non-Hispanic white 18 25 25 32 U.S. born, non-Hispanic white 18 25 25 32 Foreign-born, non-Hispanic white 26 26 17 31 Multi-racial 31 28 19 22
Other or unknown 21 22 22 35

41
I would like more parish opportunities to provide help in other countries. Percentage responding as such:
Strongly
agree Somewhat
agree Somewhat
disagree Strongly disagree
All Respondents: Weighted (equal parish size) 29% 41% 21% 9% Un-weighted 38 38 16 8 Parish Serves Community: Hispanic or Latino 40 33 17 10 Black, African American, African, Afro-Caribbean 35 41 17 7 Asian, Native Hawaiian, or other Pacific Islander 38 41 14 7 American Indian or Native Alaskan 27 43 20 11 Multicultural 39 39 15 7 Parishioner Race or Ethnicity: Hispanic or Latino 50 31 11 7 U.S. born, Hispanic or Latino 33 41 15 10 Foreign-born, Hispanic or Latino 57 27 10 6 Asian, Native Hawaiian, or other Pacific Islander
44
41
10
5
Filipino 51 39 7 3 Vietnamese 43 32 16 10 Korean 29 52 12 7 Other Asian, Native Hawaiian, Pacific Islander 34 46 15 5 Black, African American, African, Afro-Caribbean
41
41
12
6
U.S. born, black or African American 33 41 15 10 Foreign-born, black, African, Afro-Caribbean 57 27 10 6 American Indian, Native Alaskan 28 43 19 10 Non-Hispanic white 13 38 34 16 U.S. born, non-Hispanic white 12 37 35 16 Foreign-born, non-Hispanic white 18 42 27 14 Multi-racial 42 36 17 5
Other or unknown 39 37 14 9

42
I would like more parish events that bring together parishioners of different nationalities, ethnicities, languages, cultures, and races.
Percentage responding as such:
Strongly agree
Somewhat agree
Somewhat disagree
Strongly disagree
All Respondents: Weighted (equal parish size) 45% 39% 11% 5% Un-weighted 53 33 9 5 Parish Serves Community: Hispanic or Latino 54 31 10 5 Black, African American, African, Afro-Caribbean 54 34 8 4 Asian, Native Hawaiian, or other Pacific Islander 52 36 8 4 American Indian or Native Alaskan 40 38 13 9 Multicultural 53 33 9 5 Parishioner Race or Ethnicity: Hispanic or Latino 61 26 7 6 U.S. born, Hispanic or Latino 49 36 9 6 Foreign-born, Hispanic or Latino 66 22 6 6 Asian, Native Hawaiian, or other Pacific Islander
57
33
7
3
Filipino 64 29 4 2 Vietnamese 55 32 10 3 Korean 28 47 15 10 Other Asian, Native Hawaiian, Pacific Islander 51 37 8 3 Black, African American, African, Afro-Caribbean
61
30
6
3
U.S. born, black or African American 49 39 9 3 Foreign-born, black, African, Afro-Caribbean 72 21 3 3 American Indian, Native Alaskan 45 37 11 6 Non-Hispanic white 30 45 18 7 U.S. born, non-Hispanic white 30 46 18 6 Foreign-born, non-Hispanic white 35 42 15 9 Multi-racial 54 32 9 5
Other or unknown 54 31 9 6

43
The parish staff reflects the cultural diversity of the parish. Percentage responding as such:
Strongly
agree Somewhat
agree Somewhat
disagree Strongly disagree
All Respondents: Weighted (equal parish size) 41% 38% 14% 7% Un-weighted 41 39 13 7 Parish Serves Community: Hispanic or Latino 40 38 13 8 Black, African American, African, Afro-Caribbean 50 33 12 4 Asian, Native Hawaiian, or other Pacific Islander 44 39 11 6 American Indian or Native Alaskan 32 39 16 14 Multicultural 39 41 14 6 Parishioner Race or Ethnicity: Hispanic or Latino 42 33 15 11 U.S. born, Hispanic or Latino 35 40 18 7 Foreign-born, Hispanic or Latino 45 29 14 12 Asian, Native Hawaiian, or other Pacific Islander
42
42
11
5
Filipino 45 42 8 5 Vietnamese 46 38 11 5 Korean 15 39 24 23 Other Asian, Native Hawaiian, Pacific Islander 40 43 13 4 Black, African American, African, Afro-Caribbean
46
36
12
6
U.S. born, black or African American 45 36 13 6 Foreign-born, black, African, Afro-Caribbean 47 36 11 6 American Indian, Native Alaskan 35 44 15 6 Non-Hispanic white 39 42 14 5 U.S. born, non-Hispanic white 38 42 15 5 Foreign-born, non-Hispanic white 43 44 9 4 Multi-racial 39 36 15 10
Other or unknown 37 42 14 8

44
I would feel comfortable talking with the pastor. Percentage responding as such:
Strongly
agree Somewhat
agree Somewhat
disagree Strongly disagree
All Respondents: Weighted (equal parish size) 66% 23% 7% 4% Un-weighted 61 27 8 5 Parish Serves Community: Hispanic or Latino 63 25 7 5 Black, African American, African, Afro-Caribbean 69 21 7 3 Asian, Native Hawaiian, or other Pacific Islander 64 26 6 4 American Indian or Native Alaskan 60 24 9 7 Multicultural 57 29 9 6 Parishioner Race or Ethnicity: Hispanic or Latino 67 21 7 6 U.S. born, Hispanic or Latino 58 28 8 6 Foreign-born, Hispanic or Latino 70 18 6 6 Asian, Native Hawaiian, or other Pacific Islander
54
32
9
5
Filipino 53 34 8 5 Vietnamese 71 22 6 2 Korean 38 33 19 10 Other Asian, Native Hawaiian, Pacific Islander 53 33 9 5 Black, African American, African, Afro-Caribbean
68
23
6
4
U.S. born, black or African American 66 23 7 5 Foreign-born, black, African, Afro-Caribbean 69 24 5 2 American Indian, Native Alaskan 64 24 8 4 Non-Hispanic white 63 25 7 5 U.S. born, non-Hispanic white 64 24 7 5 Foreign-born, non-Hispanic white 55 28 10 8 Multi-racial 62 23 6 9
Other or unknown 56 31 7 7

45
The parish celebrates feast days that are important to me. Percentage responding as such:
Strongly
agree Somewhat
agree Somewhat
disagree Strongly disagree
All Respondents: Weighted (equal parish size) 67% 24% 6% 4% Un-weighted 68 24 4 3 Parish Serves Community: Hispanic or Latino 72 21 3 3 Black, African American, African, Afro-Caribbean 68 26 3 3 Asian, Native Hawaiian, or other Pacific Islander 67 25 5 3 American Indian or Native Alaskan 62 23 8 7 Multicultural 67 26 4 3 Parishioner Race or Ethnicity: Hispanic or Latino 78 16 4 2 U.S. born, Hispanic or Latino 67 27 5 2 Foreign-born, Hispanic or Latino 83 11 4 3 Asian, Native Hawaiian, or other Pacific Islander
64
28
5
3
Filipino 66 28 3 3 Vietnamese 70 24 4 2 Korean 31 34 18 17 Other Asian, Native Hawaiian, Pacific Islander 63 29 4 3 Black, African American, African, Afro-Caribbean
68
26
4
3
U.S. born, black or African American 71 24 2 3 Foreign-born, black, African, Afro-Caribbean 65 27 5 3 American Indian, Native Alaskan 66 25 8 2 Non-Hispanic white 69 26 3 2 U.S. born, non-Hispanic white 70 25 3 2 Foreign-born, non-Hispanic white 68 25 3 3 Multi-racial 63 27 6 5
Other or unknown 63 27 6 4

46
I feel encouraged to participate in parish ministry. Percentage responding as such:
Strongly
agree Somewhat
agree Somewhat
disagree Strongly disagree
All Respondents: Weighted (equal parish size) 51% 34% 11% 5% Un-weighted 48 36 12 4 Parish Serves Community: Hispanic or Latino 52 34 10 4 Black, African American, African, Afro-Caribbean 68 25 6 2 Asian, Native Hawaiian, or other Pacific Islander 50 37 10 3 American Indian or Native Alaskan 40 36 16 9 Multicultural 43 39 14 5 Parishioner Race or Ethnicity: Hispanic or Latino 54 30 11 5 U.S. born, Hispanic or Latino 41 36 17 6 Foreign-born, Hispanic or Latino 60 28 8 4 Asian, Native Hawaiian, or other Pacific Islander
42
42
12
4
Filipino 43 45 9 3 Vietnamese 56 32 9 3 Korean 15 43 26 15 Other Asian, Native Hawaiian, Pacific Islander 40 41 15 4 Black, African American, African, Afro-Caribbean
63
27
7
3
U.S. born, black or African American 63 28 6 4 Foreign-born, black, African, Afro-Caribbean 64 25 8 3 American Indian, Native Alaskan 44 38 14 4 Non-Hispanic white 46 37 12 4 U.S. born, non-Hispanic white 47 38 12 4 Foreign-born, non-Hispanic white 43 34 18 6 Multi-racial 44 33 16 6
Other or unknown 42 38 13 6

47
I have a role in the decision making of this parish. Percentage responding as such:
Strongly
agree Somewhat
agree Somewhat
disagree Strongly disagree
All Respondents: Weighted (equal parish size) 23% 34% 21% 22% Un-weighted 22 34 23 21 Parish Serves Community: Hispanic or Latino 21 31 23 25 Black, African American, African, Afro-Caribbean 28 36 20 17 Asian, Native Hawaiian, or other Pacific Islander 25 37 22 16 American Indian or Native Alaskan 25 30 20 24 Multicultural 20 33 25 22 Parishioner Race or Ethnicity: Hispanic or Latino 22 27 22 28 U.S. born, Hispanic or Latino 18 26 27 30 Foreign-born, Hispanic or Latino 24 28 20 28 Asian, Native Hawaiian, or other Pacific Islander
24
37
23
16
Filipino 26 41 21 12 Vietnamese 26 35 21 18 Korean 9 14 26 51 Other Asian, Native Hawaiian, Pacific Islander 22 35 27 17 Black, African American, African, Afro-Caribbean
24
36
19
21
U.S. born, black or African American 25 38 19 18 Foreign-born, black, African, Afro-Caribbean 24 35 19 23 American Indian, Native Alaskan 30 35 20 16 Non-Hispanic white 17 34 26 24 U.S. born, non-Hispanic white 17 34 26 23 Foreign-born, non-Hispanic white 17 29 29 25 Multi-racial 26 27 27 20
Other or unknown 23 34 24 19

48
My parish should be more involved in… Understanding the different cultures that exist within the parish community.
Percentage responding as such:
Strongly agree
Somewhat agree
Somewhat disagree
Strongly disagree
All Respondents: Weighted (equal parish size) 38% 41% 14% 7% Un-weighted 45 37 12 6 Parish Serves Community: Hispanic or Latino 44 37 13 6 Black, African American, African, Afro-Caribbean 43 38 14 6 Asian, Native Hawaiian, or other Pacific Islander 47 37 10 6 American Indian or Native Alaskan 38 39 14 9 Multicultural 47 37 11 5 Parishioner Race or Ethnicity: Hispanic or Latino 54 32 9 5 U.S. born, Hispanic or Latino 40 42 13 5 Foreign-born, Hispanic or Latino 60 28 8 4 Asian, Native Hawaiian, or other Pacific Islander
53
36
7
4
Filipino 59 33 6 3 Vietnamese 53 34 10 3 Korean 33 44 15 8 Other Asian, Native Hawaiian, Pacific Islander 45 41 9 5 Black, African American, African, Afro-Caribbean
49
35
11
4
U.S. born, black or African American 38 41 16 5 Foreign-born, black, African, Afro-Caribbean 58 31 8 4 American Indian, Native Alaskan 39 40 14 7 Non-Hispanic white 21 47 22 10 U.S. born, non-Hispanic white 21 48 22 9 Foreign-born, non-Hispanic white 25 40 24 11 Multi-racial 43 38 12 7
Other or unknown 46 35 13 7

49
My parish should be more involved in… Celebrating cultural diversity. Percentage responding as such:
Strongly
agree Somewhat
agree Somewhat
disagree Strongly disagree
All Respondents: Weighted (equal parish size) 40% 40% 14% 6% Un-weighted 46 38 11 5 Parish Serves Community: Hispanic or Latino 46 36 13 6 Black, African American, African, Afro-Caribbean 48 34 13 5 Asian, Native Hawaiian, or other Pacific Islander 46 40 9 5 American Indian or Native Alaskan 36 41 15 8 Multicultural 46 39 10 5 Parishioner Race or Ethnicity: Hispanic or Latino 55 32 9 4 U.S. born, Hispanic or Latino 43 42 12 4 Foreign-born, Hispanic or Latino 60 29 7 4 Asian, Native Hawaiian, or other Pacific Islander
52
38
7
3
Filipino 56 37 5 2 Vietnamese 58 30 10 2 Korean 31 46 17 6 Other Asian, Native Hawaiian, Pacific Islander 46 42 8 4 Black, African American, African, Afro-Caribbean
54
33
9
4
U.S. born, black or African American 45 37 13 5 Foreign-born, black, African, Afro-Caribbean 62 29 6 3 American Indian, Native Alaskan 39 41 13 7 Non-Hispanic white 21 47 22 10 U.S. born, non-Hispanic white 21 48 22 10 Foreign-born, non-Hispanic white 23 43 23 11 Multi-racial 47 34 13 6
Other or unknown 42 39 12 6

50
My parish should be more involved in… Providing assistance to immigrants. Percentage responding as such:
Strongly
agree Somewhat
agree Somewhat
disagree Strongly disagree
All Respondents: Weighted (equal parish size) 42% 37% 15% 7% Un-weighted 49 33 12 6 Parish Serves Community: Hispanic or Latino 53 30 12 5 Black, African American, African, Afro-Caribbean 50 36 10 4 Asian, Native Hawaiian, or other Pacific Islander 50 35 10 5 American Indian or Native Alaskan 33 36 21 10 Multicultural 47 34 13 6 Parishioner Race or Ethnicity: Hispanic or Latino 68 22 6 4 U.S. born, Hispanic or Latino 50 36 9 6 Foreign-born, Hispanic or Latino 76 17 4 3 Asian, Native Hawaiian, or other Pacific Islander
52
35
9
4
Filipino 56 33 8 4 Vietnamese 64 27 8 2 Korean 48 40 7 4 Other Asian, Native Hawaiian, Pacific Islander 42 41 13 5 Black, African American, African, Afro-Caribbean
54
33
9
4
U.S. born, black or African American 37 47 11 6 Foreign-born, black, African, Afro-Caribbean 70 21 7 3 American Indian, Native Alaskan 25 41 21 13 Non-Hispanic white 21 43 24 11 U.S. born, non-Hispanic white 21 44 25 11 Foreign-born, non-Hispanic white 26 41 23 10 Multi-racial 49 32 12 7
Other or unknown 47 34 13 6
51
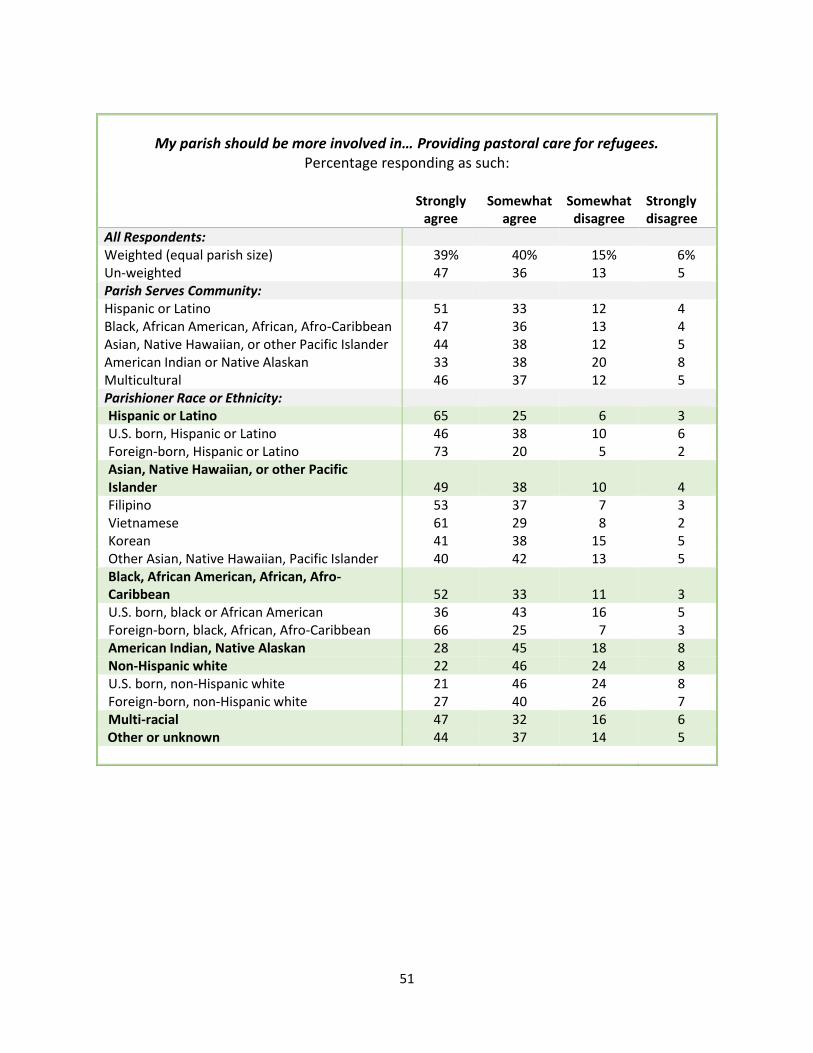
My parish should be more involved in… Providing pastoral care for refugees. Percentage responding as such:
Strongly
agree Somewhat
agree Somewhat
disagree Strongly disagree
All Respondents: Weighted (equal parish size) 39% 40% 15% 6% Un-weighted 47 36 13 5 Parish Serves Community: Hispanic or Latino 51 33 12 4 Black, African American, African, Afro-Caribbean 47 36 13 4 Asian, Native Hawaiian, or other Pacific Islander 44 38 12 5 American Indian or Native Alaskan 33 38 20 8 Multicultural 46 37 12 5 Parishioner Race or Ethnicity: Hispanic or Latino 65 25 6 3 U.S. born, Hispanic or Latino 46 38 10 6 Foreign-born, Hispanic or Latino 73 20 5 2 Asian, Native Hawaiian, or other Pacific Islander
49
38
10
4
Filipino 53 37 7 3 Vietnamese 61 29 8 2 Korean 41 38 15 5 Other Asian, Native Hawaiian, Pacific Islander 40 42 13 5 Black, African American, African, Afro-Caribbean
52
33
11
3
U.S. born, black or African American 36 43 16 5 Foreign-born, black, African, Afro-Caribbean 66 25 7 3 American Indian, Native Alaskan 28 45 18 8 Non-Hispanic white 22 46 24 8 U.S. born, non-Hispanic white 21 46 24 8 Foreign-born, non-Hispanic white 27 40 26 7 Multi-racial 47 32 16 6
Other or unknown 44 37 14 5
52
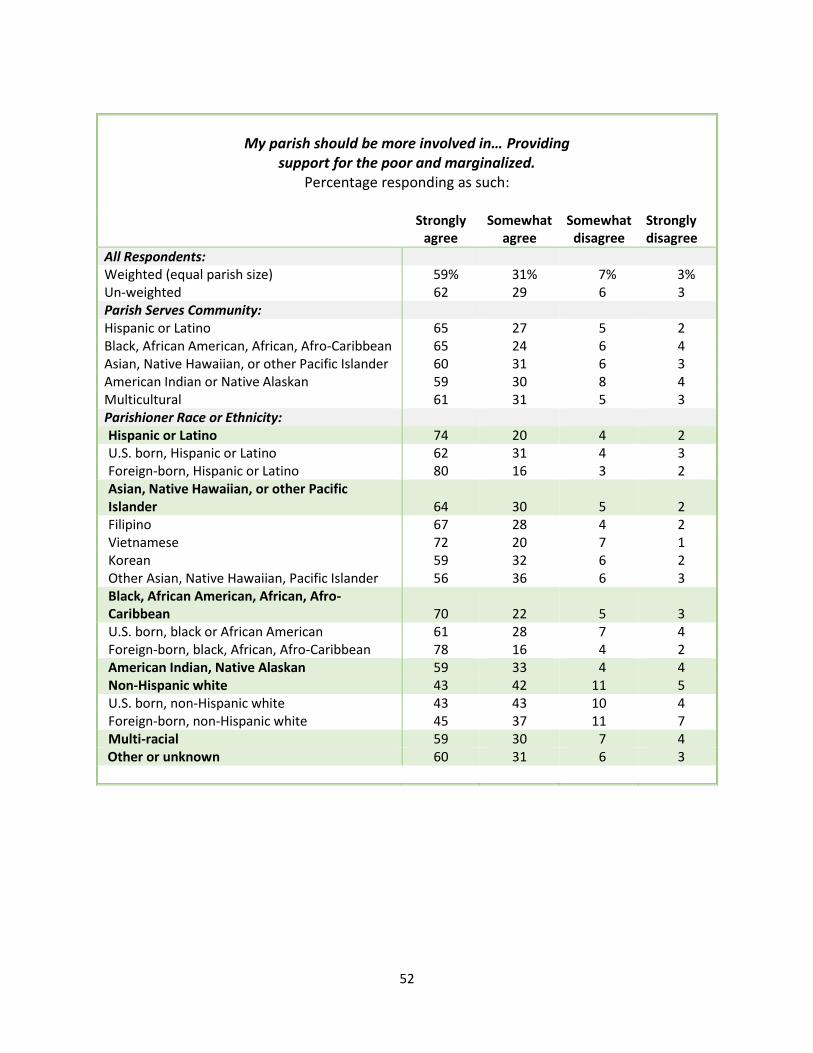
My parish should be more involved in… Providing support for the poor and marginalized.
Percentage responding as such:
Strongly agree
Somewhat agree
Somewhat disagree
Strongly disagree
All Respondents: Weighted (equal parish size) 59% 31% 7% 3% Un-weighted 62 29 6 3 Parish Serves Community: Hispanic or Latino 65 27 5 2 Black, African American, African, Afro-Caribbean 65 24 6 4 Asian, Native Hawaiian, or other Pacific Islander 60 31 6 3 American Indian or Native Alaskan 59 30 8 4 Multicultural 61 31 5 3 Parishioner Race or Ethnicity: Hispanic or Latino 74 20 4 2 U.S. born, Hispanic or Latino 62 31 4 3 Foreign-born, Hispanic or Latino 80 16 3 2 Asian, Native Hawaiian, or other Pacific Islander
64
30
5
2
Filipino 67 28 4 2 Vietnamese 72 20 7 1 Korean 59 32 6 2 Other Asian, Native Hawaiian, Pacific Islander 56 36 6 3 Black, African American, African, Afro-Caribbean
70
22
5
3
U.S. born, black or African American 61 28 7 4 Foreign-born, black, African, Afro-Caribbean 78 16 4 2 American Indian, Native Alaskan 59 33 4 4 Non-Hispanic white 43 42 11 5 U.S. born, non-Hispanic white 43 43 10 4 Foreign-born, non-Hispanic white 45 37 11 7 Multi-racial 59 30 7 4
Other or unknown 60 31 6 3

53
My parish should be more involved in… Using materials inclusive to all of the languages spoken by parishioners.
Percentage responding as such:
Strongly agree
Somewhat agree
Somewhat disagree
Strongly disagree
All Respondents: Weighted (equal parish size) 43% 35% 15% 8% Un-weighted 47 34 13 7 Parish Serves Community: Hispanic or Latino 50 31 13 7 Black, African American, African, Afro-Caribbean 42 34 17 7 Asian, Native Hawaiian, or other Pacific Islander 49 36 10 5 American Indian or Native Alaskan 43 35 14 9 Multicultural 45 34 13 8 Parishioner Race or Ethnicity: Hispanic or Latino 64 24 7 5 U.S. born, Hispanic or Latino 48 35 10 7 Foreign-born, Hispanic or Latino 70 19 6 4 Asian, Native Hawaiian, or other Pacific Islander
50
36
10
4
Filipino 52 35 9 4 Vietnamese 57 27 11 4 Korean 56 28 10 6 Other Asian, Native Hawaiian, Pacific Islander 40 41 13 5 Black, African American, African, Afro-Caribbean
47
32
14
6
U.S. born, black or African American 36 37 18 8 Foreign-born, black, African, Afro-Caribbean 57 28 11 4 American Indian, Native Alaskan 39 39 13 9 Non-Hispanic white 25 39 23 13 U.S. born, non-Hispanic white 24 40 22 13 Foreign-born, non-Hispanic white 30 33 23 14 Multi-racial 47 35 11 7
Other or unknown 44 36 13 8

54
My parish should be more involved in… Improving the sense of community among parishioners.
Percentage responding as such:
Strongly agree
Somewhat agree
Somewhat disagree
Strongly disagree
All Respondents: Weighted (equal parish size) 56% 33% 7% 4% Un-weighted 58 32 6 4 Parish Serves Community: Hispanic or Latino 58 32 7 4 Black, African American, African, Afro-Caribbean 56 30 9 5 Asian, Native Hawaiian, or other Pacific Islander 61 30 5 4 American Indian or Native Alaskan 57 33 6 4 Multicultural 59 33 6 3 Parishioner Race or Ethnicity: Hispanic or Latino 65 26 5 4 U.S. born, Hispanic or Latino 52 38 7 4 Foreign-born, Hispanic or Latino 70 21 4 5 Asian, Native Hawaiian, or other Pacific Islander
64
30
4
3
Filipino 67 28 3 2 Vietnamese 69 25 5 2 Korean 66 27 3 4 Other Asian, Native Hawaiian, Pacific Islander 57 35 5 3 Black, African American, African, Afro-Caribbean
60
30
7
4
U.S. born, black or African American 53 32 11 5 Foreign-born, black, African, Afro-Caribbean 68 27 3 2 American Indian, Native Alaskan 52 40 5 4 Non-Hispanic white 43 43 10 5 U.S. born, non-Hispanic white 42 44 10 4 Foreign-born, non-Hispanic white 47 36 11 7 Multi-racial 56 30 10 3
Other or unknown 55 34 7 4
Majorities of all respondent sub-groups “strongly” agree with the statement except non-
Hispanic white respondents (43 percent).

55
My parish should be more involved in welcoming… New parishioners. Percentage responding as such:
Strongly
agree Somewhat
agree Somewhat
disagree Strongly disagree
All Respondents: Weighted (equal parish size) 66% 24% 6% 4% Un-weighted 67 24 5 4 Parish Serves Community: Hispanic or Latino 66 25 6 3 Black, African American, African, Afro-Caribbean 59 26 7 8 Asian, Native Hawaiian, or other Pacific Islander 68 23 5 4 American Indian or Native Alaskan 72 21 5 3 Multicultural 67 25 5 3 Parishioner Race or Ethnicity: Hispanic or Latino 72 21 5 3 U.S. born, Hispanic or Latino 62 29 6 3 Foreign-born, Hispanic or Latino 76 18 4 2 Asian, Native Hawaiian, or other Pacific Islander
73
21
4
3
Filipino 77 19 2 3 Vietnamese 74 19 4 3 Korean 82 13 4 1 Other Asian, Native Hawaiian, Pacific Islander 64 27 6 3 Black, African American, African, Afro-Caribbean
66
23
5
5
U.S. born, black or African American 57 28 8 7 Foreign-born, black, African, Afro-Caribbean 76 18 2 4 American Indian, Native Alaskan 68 25 4 3 Non-Hispanic white 50 36 9 5 U.S. born, non-Hispanic white 50 36 9 5 Foreign-born, non-Hispanic white 51 35 10 4 Multi-racial 64 22 9 5
Other or unknown 63 26 6 5

56
My parish should be more involved in welcoming… Inactive Catholics. Percentage responding as such:
Strongly
agree Somewhat
agree Somewhat
disagree Strongly disagree
All Respondents: Weighted (equal parish size) 64% 25% 7% 4% Un-weighted 66 25 5 4 Parish Serves Community: Hispanic or Latino 68 24 5 3 Black, African American, African, Afro-Caribbean 58 27 9 7 Asian, Native Hawaiian, or other Pacific Islander 64 26 6 4 American Indian or Native Alaskan 72 20 6 2 Multicultural 67 25 5 3 Parishioner Race or Ethnicity: Hispanic or Latino 76 19 3 3 U.S. born, Hispanic or Latino 64 28 5 3 Foreign-born, Hispanic or Latino 81 15 3 2 Asian, Native Hawaiian, or other Pacific Islander
70
23
5
3
Filipino 75 20 3 2 Vietnamese 62 25 8 5 Korean 77 15 6 2 Other Asian, Native Hawaiian, Pacific Islander 62 29 6 4 Black, African American, African, Afro-Caribbean
63
26
6
5
U.S. born, black or African American 58 29 8 5 Foreign-born, black, African, Afro-Caribbean 68 22 5 5 American Indian, Native Alaskan 70 23 5 2 Non-Hispanic white 53 34 8 5 U.S. born, non-Hispanic white 54 35 7 5 Foreign-born, non-Hispanic white 52 32 11 5 Multi-racial 62 25 8 6
Other or unknown 61 28 7 4

57
My parish should be more involved in welcoming… Low-income families. Percentage responding as such:
Strongly
agree Somewhat
agree Somewhat
disagree Strongly disagree
All Respondents: Weighted (equal parish size) 62% 27% 7% 5% Un-weighted 65 25 6 4 Parish Serves Community: Hispanic or Latino 66 24 6 3 Black, African American, African, Afro-Caribbean 63 25 6 7 Asian, Native Hawaiian, or other Pacific Islander 62 28 6 4 American Indian or Native Alaskan 70 22 5 3 Multicultural 65 26 6 3 Parishioner Race or Ethnicity: Hispanic or Latino 75 18 4 3 U.S. born, Hispanic or Latino 64 27 5 4 Foreign-born, Hispanic or Latino 80 15 3 2 Asian, Native Hawaiian, or other Pacific Islander
69
24
5
3
Filipino 73 21 4 2 Vietnamese 68 23 6 3 Korean 75 20 5 1 Other Asian, Native Hawaiian, Pacific Islander 60 30 6 4 Black, African American, African, Afro-Caribbean
67
25
4
4
U.S. born, black or African American 58 29 7 6 Foreign-born, black, African, Afro-Caribbean 75 20 2 3 American Indian, Native Alaskan 68 24 5 3 Non-Hispanic white 46 36 12 6 U.S. born, non-Hispanic white 45 37 12 6 Foreign-born, non-Hispanic white 49 29 16 6 Multi-racial 63 25 7 6
Other or unknown 59 29 7 5

58
My parish should be more involved in welcoming… Hispanics, Latinos. Percentage responding as such:
Strongly
agree Somewhat
agree Somewhat
disagree Strongly disagree
All Respondents: Weighted (equal parish size) 52% 31% 10% 6% Un-weighted 59 28 8 5 Parish Serves Community: Hispanic or Latino 62 25 8 4 Black, African American, African, Afro-Caribbean 55 29 9 7 Asian, Native Hawaiian, or other Pacific Islander 53 32 9 6 American Indian or Native Alaskan 53 29 13 6 Multicultural 59 29 8 5 Parishioner Race or Ethnicity: Hispanic or Latino 76 18 3 3 U.S. born, Hispanic or Latino 64 25 6 4 Foreign-born, Hispanic or Latino 82 14 2 2 Asian, Native Hawaiian, or other Pacific Islander
59
30
7
5
Filipino 65 26 6 3 Vietnamese 55 30 9 6 Korean 46 31 18 5 Other Asian, Native Hawaiian, Pacific Islander 51 36 7 6 Black, African American, African, Afro-Caribbean
59
29
8
5
U.S. born, black or African American 52 33 9 6 Foreign-born, black, African, Afro-Caribbean 65 25 7 3 American Indian, Native Alaskan 54 29 12 5 Non-Hispanic white 38 38 16 9 U.S. born, non-Hispanic white 37 39 16 9 Foreign-born, non-Hispanic white 41 32 18 8 Multi-racial 54 30 8 8
Other or unknown 56 28 11 5

59
My parish should be more involved in welcoming… African Americans, Africans. Percentage responding as such:
Strongly
agree Somewhat
agree Somewhat
disagree Strongly disagree
All Respondents: Weighted (equal parish size) 54% 30% 10% 6% Un-weighted 59 28 8 5 Parish Serves Community: Hispanic or Latino 62 27 8 4 Black, African American, African, Afro-Caribbean 61 22 8 9 Asian, Native Hawaiian, or other Pacific Islander 54 32 8 6 American Indian or Native Alaskan 54 30 11 6 Multicultural 60 29 7 4 Parishioner Race or Ethnicity: Hispanic or Latino 72 20 5 3 U.S. born, Hispanic or Latino 63 26 6 5 Foreign-born, Hispanic or Latino 76 17 4 3 Asian, Native Hawaiian, or other Pacific Islander
61
29
7
4
Filipino 67 25 5 3 Vietnamese 56 29 10 5 Korean 45 32 17 7 Other Asian, Native Hawaiian, Pacific Islander 52 35 7 5 Black, African American, African, Afro-Caribbean
66
23
5
6
U.S. born, black or African American 56 28 8 8 Foreign-born, black, African, Afro-Caribbean 74 20 3 3 American Indian, Native Alaskan 57 30 8 5 Non-Hispanic white 39 38 14 8 U.S. born, non-Hispanic white 39 39 14 8 Foreign-born, non-Hispanic white 41 31 19 10 Multi-racial 57 25 10 8
Other or unknown 56 29 11 4

60
My parish should be more involved in welcoming… Asians, Pacific Islanders, Native Hawaiians.
Percentage responding as such:
Strongly agree
Somewhat agree
Somewhat disagree
Strongly disagree
All Respondents: Weighted (equal parish size) 54% 32% 8% 5% Un-weighted 60 28 8 5 Parish Serves Community: Hispanic or Latino 61 28 8 4 Black, African American, African, Afro-Caribbean 55 28 10 8 Asian, Native Hawaiian, or other Pacific Islander 61 28 6 4 American Indian or Native Alaskan 56 30 10 5 Multicultural 60 28 7 5 Parishioner Race or Ethnicity: Hispanic or Latino 71 22 4 3 U.S. born, Hispanic or Latino 61 30 4 5 Foreign-born, Hispanic or Latino 75 18 5 3 Asian, Native Hawaiian, or other Pacific Islander
66
26
5
3
Filipino 72 22 4 3 Vietnamese 63 27 6 4 Korean 52 31 13 5 Other Asian, Native Hawaiian, Pacific Islander 57 32 6 5 Black, African American, African, Afro-Caribbean
60
28
8
5
U.S. born, black or African American 51 33 9 6 Foreign-born, black, African, Afro-Caribbean 68 23 6 4 American Indian, Native Alaskan 57 31 9 3 Non-Hispanic white 38 40 14 8 U.S. born, non-Hispanic white 38 40 14 8 Foreign-born, non-Hispanic white 40 34 17 9 Multi-racial 61 25 8 7
Other or unknown 58 28 9 5

61
My parish should be more involved in welcoming… American Indians, Native Alaskans.
Percentage responding as such:
Strongly agree
Somewhat agree
Somewhat disagree
Strongly disagree
All Respondents: Weighted (equal parish size) 58% 28% 8% 6% Un-weighted 59 29 7 5 Parish Serves Community: Hispanic or Latino 61 28 7 4 Black, African American, African, Afro-Caribbean 56 27 8 9 Asian, Native Hawaiian, or other Pacific Islander 55 31 8 6 American Indian or Native Alaskan 68 21 6 5 Multicultural 59 29 7 5 Parishioner Race or Ethnicity: Hispanic or Latino 71 21 4 4 U.S. born, Hispanic or Latino 62 29 4 5 Foreign-born, Hispanic or Latino 75 18 4 3 Asian, Native Hawaiian, or other Pacific Islander
62
27
6
5
Filipino 68 25 4 3 Vietnamese 57 31 7 4 Korean 48 31 15 6 Other Asian, Native Hawaiian, Pacific Islander 54 34 8 5 Black, African American, African, Afro-Caribbean
61
27
6
5
U.S. born, black or African American 53 32 8 7 Foreign-born, black, African, Afro-Caribbean 69 22 5 4 American Indian, Native Alaskan 71 21 4 4 Non-Hispanic white 39 39 14 8 U.S. born, non-Hispanic white 39 39 14 8 Foreign-born, non-Hispanic white 38 37 17 8 Multi-racial 55 29 8 8
Other or unknown 57 28 10 5

62
My parish should be more involved in welcoming… Immigrants. Percentage responding as such:
Strongly
agree Somewhat
agree Somewhat
disagree Strongly disagree
All Respondents: Weighted (equal parish size) 59% 29% 7% 5% Un-weighted 63 26 7 5 Parish Serves Community: Hispanic or Latino 65 25 7 4 Black, African American, African, Afro-Caribbean 60 25 7 8 Asian, Native Hawaiian, or other Pacific Islander 63 27 5 5 American Indian or Native Alaskan 59 27 10 5 Multicultural 64 26 6 4 Parishioner Race or Ethnicity: Hispanic or Latino 78 16 3 3 U.S. born, Hispanic or Latino 66 24 5 5 Foreign-born, Hispanic or Latino 84 12 2 2 Asian, Native Hawaiian, or other Pacific Islander
68
25
4
3
Filipino 73 21 3 3 Vietnamese 66 26 5 3 Korean 71 21 7 1 Other Asian, Native Hawaiian, Pacific Islander 58 32 6 4 Black, African American, African, Afro-Caribbean
66
24
6
5
U.S. born, black or African American 53 32 7 7 Foreign-born, black, African, Afro-Caribbean 77 17 4 3 American Indian, Native Alaskan 52 31 11 6 Non-Hispanic white 39 39 14 9 U.S. born, non-Hispanic white 38 39 14 9 Foreign-born, non-Hispanic white 45 32 15 8 Multi-racial 61 25 7 7
Other or unknown 61 26 9 4
Majorities of all respondent sub-groups “strongly” agree with the statement except non-
Hispanic white respondents (39 percent).

63
My parish should be more involved in welcoming… Non-English speakers. Percentage responding as such:
Strongly
agree Somewhat
agree Somewhat
disagree Strongly disagree
All Respondents: Weighted (equal parish size) 57% 29% 8% 6% Un-weighted 61 27 8 5 Parish Serves Community: Hispanic or Latino 63 24 8 5 Black, African American, African, Afro-Caribbean 55 29 9 8 Asian, Native Hawaiian, or other Pacific Islander 61 28 6 5 American Indian or Native Alaskan 59 27 7 7 Multicultural 61 27 8 4 Parishioner Race or Ethnicity: Hispanic or Latino 77 17 3 3 U.S. born, Hispanic or Latino 63 27 4 5 Foreign-born, Hispanic or Latino 83 13 2 2 Asian, Native Hawaiian, or other Pacific Islander
65
26
5
3
Filipino 70 23 4 3 Vietnamese 66 26 5 3 Korean 65 23 8 4 Other Asian, Native Hawaiian, Pacific Islander 57 32 7 4 Black, African American, African, Afro-Caribbean
62
27
7
5
U.S. born, black or African American 49 35 9 6 Foreign-born, black, African, Afro-Caribbean 73 19 5 3 American Indian, Native Alaskan 55 28 10 7 Non-Hispanic white 35 39 16 10 U.S. born, non-Hispanic white 34 40 16 10 Foreign-born, non-Hispanic white 41 35 16 8 Multi-racial 59 23 10 7
Other or unknown 57 27 10 6

64
My parish should be more involved in welcoming… Young adult parishioners. Percentage responding as such:
Strongly
agree Somewhat
agree Somewhat
disagree Strongly disagree
All Respondents: Weighted (equal parish size) 70% 22% 4% 4% Un-weighted 71 22 4 3 Parish Serves Community: Hispanic or Latino 73 21 3 3 Black, African American, African, Afro-Caribbean 68 19 5 7 Asian, Native Hawaiian, or other Pacific Islander 70 23 3 4 American Indian or Native Alaskan 74 20 3 3 Multicultural 70 23 4 3 Parishioner Race or Ethnicity: Hispanic or Latino 80 16 3 2 U.S. born, Hispanic or Latino 71 23 3 3 Foreign-born, Hispanic or Latino 84 12 2 1 Asian, Native Hawaiian, or other Pacific Islander
72
22
3
3
Filipino 75 20 2 2 Vietnamese 71 24 3 2 Korean 78 18 3 2 Other Asian, Native Hawaiian, Pacific Islander 66 27 4 3 Black, African American, African, Afro-Caribbean
73
19
3
5
U.S. born, black or African American 67 23 4 6 Foreign-born, black, African, Afro-Caribbean 78 16 3 3 American Indian, Native Alaskan 72 21 3 4 Non-Hispanic white 60 29 6 5 U.S. born, non-Hispanic white 59 30 6 5 Foreign-born, non-Hispanic white 60 27 9 4 Multi-racial 66 24 6 5
Other or unknown 68 25 4 3

65
My parish should be more involved in welcoming… Divorced parishioners. Percentage responding as such:
Strongly
agree Somewhat
agree Somewhat
disagree Strongly disagree
All Respondents: Weighted (equal parish size) 63% 26% 6% 5% Un-weighted 65 25 6 4 Parish Serves Community: Hispanic or Latino 69 23 5 3 Black, African American, African, Afro-Caribbean 62 23 7 8 Asian, Native Hawaiian, or other Pacific Islander 61 28 6 5 American Indian or Native Alaskan 66 23 6 5 Multicultural 64 27 6 3 Parishioner Race or Ethnicity: Hispanic or Latino 76 18 4 2 U.S. born, Hispanic or Latino 64 27 6 4 Foreign-born, Hispanic or Latino 81 14 3 2 Asian, Native Hawaiian, or other Pacific Islander
65
26
5
4
Filipino 69 23 4 3 Vietnamese 63 27 6 4 Korean 68 27 4 2 Other Asian, Native Hawaiian, Pacific Islander 58 31 6 5 Black, African American, African, Afro-Caribbean
65
25
5
5
U.S. born, black or African American 61 27 6 5 Foreign-born, black, African, Afro-Caribbean 68 23 5 4 American Indian, Native Alaskan 66 24 5 5 Non-Hispanic white 54 33 8 5 U.S. born, non-Hispanic white 53 34 8 5 Foreign-born, non-Hispanic white 55 30 9 6 Multi-racial 61 24 8 7
Other or unknown 65 25 6 4

66
My parish should be more involved in welcoming… Non-Catholic spouses. Percentage responding as such:
Strongly
agree Somewhat
agree Somewhat
disagree Strongly disagree
All Respondents: Weighted (equal parish size) 64% 25% 7% 4% Un-weighted 66 25 6 4 Parish Serves Community: Hispanic or Latino 69 23 5 3 Black, African American, African, Afro-Caribbean 63 22 7 8 Asian, Native Hawaiian, or other Pacific Islander 64 27 5 4 American Indian or Native Alaskan 67 21 8 5 Multicultural 64 26 6 4 Parishioner Race or Ethnicity: Hispanic or Latino 74 18 5 3 U.S. born, Hispanic or Latino 62 26 7 5 Foreign-born, Hispanic or Latino 79 15 4 3 Asian, Native Hawaiian, or other Pacific Islander
67
26
4
3
Filipino 69 24 4 3 Vietnamese 69 24 4 3 Korean 72 20 6 2 Other Asian, Native Hawaiian, Pacific Islander 61 30 5 4 Black, African American, African, Afro-Caribbean
65
24
6
5
U.S. born, black or African American 64 25 6 5 Foreign-born, black, African, Afro-Caribbean 67 24 5 5 American Indian, Native Alaskan 65 24 6 5 Non-Hispanic white 55 30 8 6 U.S. born, non-Hispanic white 55 32 8 5 Foreign-born, non-Hispanic white 55 29 12 5 Multi-racial 60 26 8 6
Other or unknown 62 25 8 5

67
My parish should be more involved in welcoming… People with disabilities. Percentage responding as such:
Strongly
agree Somewhat
agree Somewhat
disagree Strongly disagree
All Respondents: Weighted (equal parish size) 69% 21% 5% 5% Un-weighted 71 21 5 4 Parish Serves Community: Hispanic or Latino 74 19 4 3 Black, African American, African, Afro-Caribbean 66 21 6 7 Asian, Native Hawaiian, or other Pacific Islander 70 22 4 4 American Indian or Native Alaskan 77 16 4 4 Multicultural 70 22 5 3 Parishioner Race or Ethnicity: Hispanic or Latino 81 14 3 3 U.S. born, Hispanic or Latino 71 21 4 4 Foreign-born, Hispanic or Latino 86 10 2 2 Asian, Native Hawaiian, or other Pacific Islander
70
21
4
4
Filipino 77 18 3 2 Vietnamese 75 18 5 2 Korean 79 14 5 2 Other Asian, Native Hawaiian, Pacific Islander 64 28 5 4 Black, African American, African, Afro-Caribbean
71
21
4
4
U.S. born, black or African American 64 26 5 6 Foreign-born, black, African, Afro-Caribbean 77 16 4 3 American Indian, Native Alaskan 77 17 2 4 Non-Hispanic white 57 29 8 6 U.S. born, non-Hispanic white 56 30 8 6 Foreign-born, non-Hispanic white 59 24 9 8 Multi-racial 66 21 8 5
Other or unknown 68 22 5 5
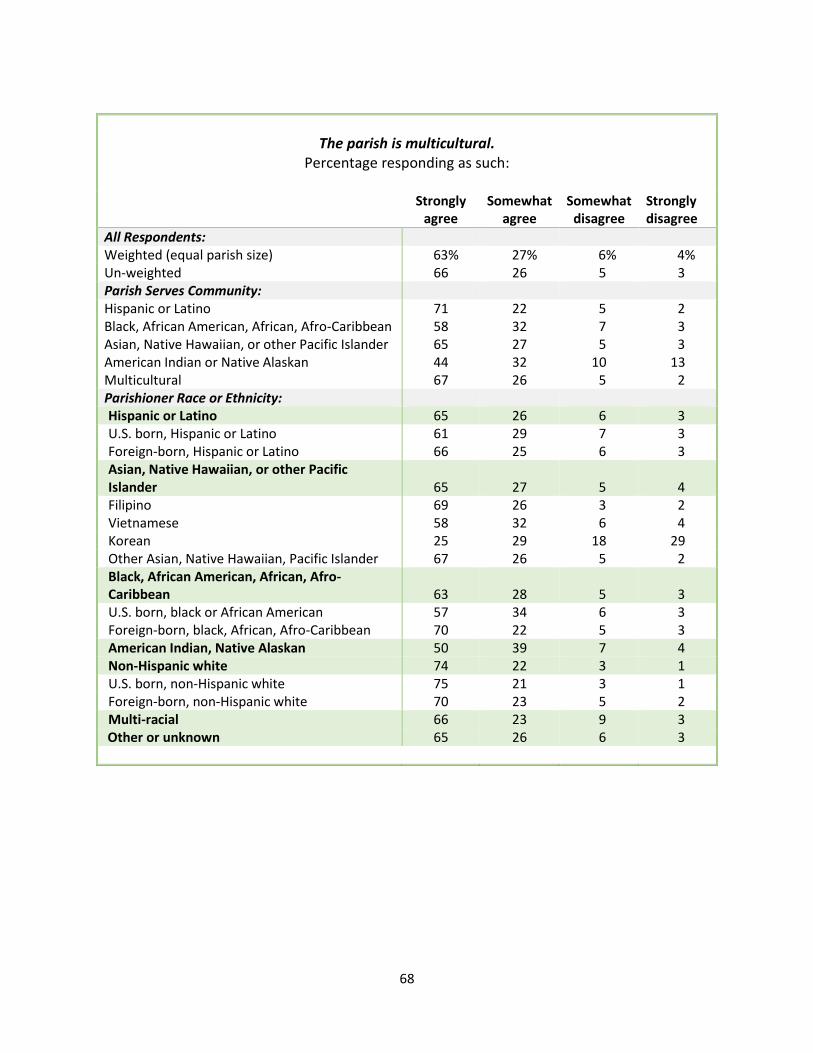
68
The parish is multicultural. Percentage responding as such:
Strongly
agree Somewhat
agree Somewhat
disagree Strongly disagree
All Respondents: Weighted (equal parish size) 63% 27% 6% 4% Un-weighted 66 26 5 3 Parish Serves Community: Hispanic or Latino 71 22 5 2 Black, African American, African, Afro-Caribbean 58 32 7 3 Asian, Native Hawaiian, or other Pacific Islander 65 27 5 3 American Indian or Native Alaskan 44 32 10 13 Multicultural 67 26 5 2 Parishioner Race or Ethnicity: Hispanic or Latino 65 26 6 3 U.S. born, Hispanic or Latino 61 29 7 3 Foreign-born, Hispanic or Latino 66 25 6 3 Asian, Native Hawaiian, or other Pacific Islander
65
27
5
4
Filipino 69 26 3 2 Vietnamese 58 32 6 4 Korean 25 29 18 29 Other Asian, Native Hawaiian, Pacific Islander 67 26 5 2 Black, African American, African, Afro-Caribbean
63
28
5
3
U.S. born, black or African American 57 34 6 3 Foreign-born, black, African, Afro-Caribbean 70 22 5 3 American Indian, Native Alaskan 50 39 7 4 Non-Hispanic white 74 22 3 1 U.S. born, non-Hispanic white 75 21 3 1 Foreign-born, non-Hispanic white 70 23 5 2 Multi-racial 66 23 9 3
Other or unknown 65 26 6 3

69
The music at Mass reflects the style(s) I desire. Percentage responding as such:
Strongly
agree Somewhat
agree Somewhat
disagree Strongly disagree
All Respondents: Weighted (equal parish size) 58% 28% 8% 5% Un-weighted 57 29 9 5 Parish Serves Community: Hispanic or Latino 58 27 9 7 Black, African American, African, Afro-Caribbean 72 20 3 4 Asian, Native Hawaiian, or other Pacific Islander 56 32 9 4 American Indian or Native Alaskan 51 31 11 8 Multicultural 55 30 10 5 Parishioner Race or Ethnicity: Hispanic or Latino 67 20 8 5 U.S. born, Hispanic or Latino 53 27 14 6 Foreign-born, Hispanic or Latino 72 17 6 4 Asian, Native Hawaiian, or other Pacific Islander
54
33
9
4
Filipino 57 33 7 4 Vietnamese 57 33 7 4 Korean 47 33 14 6 Other Asian, Native Hawaiian, Pacific Islander 49 35 11 5 Black, African American, African, Afro-Caribbean
63
24
6
7
U.S. born, black or African American 63 24 6 7 Foreign-born, black, African, Afro-Caribbean 63 24 6 7 American Indian, Native Alaskan 54 32 7 7 Non-Hispanic white 50 33 11 6 U.S. born, non-Hispanic white 50 33 11 6 Foreign-born, non-Hispanic white 55 32 6 7 Multi-racial 56 26 11 8
Other or unknown 52 30 11 7

70
Sufficient community activities other than Mass are provided. Percentage responding as such:
Strongly
agree Somewhat
agree Somewhat
disagree Strongly disagree
All Respondents: Weighted (equal parish size) 45% 38% 12% 5% Un-weighted 48 37 11 4 Parish Serves Community: Hispanic or Latino 51 36 11 3 Black, African American, African, Afro-Caribbean 56 32 9 3 Asian, Native Hawaiian, or other Pacific Islander 49 36 11 4 American Indian or Native Alaskan 32 40 16 12 Multicultural 46 39 12 4 Parishioner Race or Ethnicity: Hispanic or Latino 58 29 11 3 U.S. born, Hispanic or Latino 43 37 16 4 Foreign-born, Hispanic or Latino 63 26 9 3 Asian, Native Hawaiian, or other Pacific Islander
46
40
11
3
Filipino 51 39 8 3 Vietnamese 53 33 11 3 Korean 22 38 26 14 Other Asian, Native Hawaiian, Pacific Islander 41 43 13 3 Black, African American, African, Afro-Caribbean
51
34
10
4
U.S. born, black or African American 52 34 11 4 Foreign-born, black, African, Afro-Caribbean 51 35 10 4 American Indian, Native Alaskan 34 42 15 8 Non-Hispanic white 42 43 12 3 U.S. born, non-Hispanic white 42 42 12 3 Foreign-born, non-Hispanic white 40 43 13 5 Multi-racial 46 31 18 6
Other or unknown 43 40 11 5

71
Parishioners worship and share together as one community. Percentage responding as such:
Strongly
agree Somewhat
agree Somewhat
disagree Strongly disagree
All Respondents: Weighted (equal parish size) 56% 31% 9% 4% Un-weighted 56 32 9 4 Parish Serves Community: Hispanic or Latino 52 32 11 5 Black, African American, African, Afro-Caribbean 69 23 6 2 Asian, Native Hawaiian, or other Pacific Islander 62 29 7 2 American Indian or Native Alaskan 49 31 13 8 Multicultural 55 34 8 3 Parishioner Race or Ethnicity: Hispanic or Latino 57 30 10 3 U.S. born, Hispanic or Latino 50 36 10 4 Foreign-born, Hispanic or Latino 60 27 9 3 Asian, Native Hawaiian, or other Pacific Islander
60
31
7
2
Filipino 66 28 5 2 Vietnamese 67 26 6 1 Korean 29 38 21 12 Other Asian, Native Hawaiian, Pacific Islander 53 38 8 2 Black, African American, African, Afro-Caribbean
63
27
8
3
U.S. born, black or African American 59 29 9 3 Foreign-born, black, African, Afro-Caribbean 66 25 7 2 American Indian, Native Alaskan 52 33 10 5 Non-Hispanic white 47 36 12 5 U.S. born, non-Hispanic white 46 36 12 6 Foreign-born, non-Hispanic white 52 36 9 4 Multi-racial 55 32 10 4
Other or unknown 54 32 10 5

72
Parish communications are made in the language(s) used by parishioners. Percentage responding as such:
Strongly
agree Somewhat
agree Somewhat
disagree Strongly disagree
All Respondents: Weighted (equal parish size) 60% 30% 7% 3% Un-weighted 59 32 7 3 Parish Serves Community: Hispanic or Latino 62 31 5 2 Black, African American, African, Afro-Caribbean 68 22 7 3 Asian, Native Hawaiian, or other Pacific Islander 58 33 7 3 American Indian or Native Alaskan 55 33 8 5 Multicultural 57 34 7 3 Parishioner Race or Ethnicity: Hispanic or Latino 69 24 5 2 U.S. born, Hispanic or Latino 56 35 7 2 Foreign-born, Hispanic or Latino 74 20 4 2 Asian, Native Hawaiian, or other Pacific Islander
58
34
6
2
Filipino 61 32 5 3 Vietnamese 64 28 6 2 Korean 56 30 10 5 Other Asian, Native Hawaiian, Pacific Islander 50 40 8 2 Black, African American, African, Afro-Caribbean
65
25
6
4
U.S. born, black or African American 65 25 6 4 Foreign-born, black, African, Afro-Caribbean 65 24 7 5 American Indian, Native Alaskan 53 35 8 5 Non-Hispanic white 50 40 8 2 U.S. born, non-Hispanic white 50 41 8 2 Foreign-born, non-Hispanic white 56 33 9 3 Multi-racial 56 31 11 2
Other or unknown 54 35 8 3

73
The parish spreads the message to seek peace and justice. Percentage responding as such:
Strongly
agree Somewhat
agree Somewhat
disagree Strongly disagree
All Respondents: Weighted (equal parish size) 67% 25% 5% 3% Un-weighted 69 25 4 2 Parish Serves Community: Hispanic or Latino 71 24 3 2 Black, African American, African, Afro-Caribbean 76 20 3 1 Asian, Native Hawaiian, or other Pacific Islander 71 24 3 2 American Indian or Native Alaskan 59 25 8 8 Multicultural 67 27 5 2 Parishioner Race or Ethnicity: Hispanic or Latino 76 18 4 2 U.S. born, Hispanic or Latino 66 27 5 2 Foreign-born, Hispanic or Latino 80 15 3 2 Asian, Native Hawaiian, or other Pacific Islander
67
27
4
2
Filipino 72 24 3 1 Vietnamese 74 20 4 2 Korean 37 34 18 11 Other Asian, Native Hawaiian, Pacific Islander 63 31 4 2 Black, African American, African, Afro-Caribbean
74
21
4
1
U.S. born, black or African American 73 22 4 1 Foreign-born, black, African, Afro-Caribbean 75 20 4 1 American Indian, Native Alaskan 63 26 6 5 Non-Hispanic white 62 32 4 2 U.S. born, non-Hispanic white 62 33 4 2 Foreign-born, non-Hispanic white 64 30 3 2 Multi-racial 65 26 5 4
Other or unknown 65 27 5 3

74
The parish spreads the message to protect life. Percentage responding as such:
Strongly
agree Somewhat
agree Somewhat
disagree Strongly disagree
All Respondents: Weighted (equal parish size) 70% 22% 4% 3% Un-weighted 73 22 3 2 Parish Serves Community: Hispanic or Latino 77 19 3 2 Black, African American, African, Afro-Caribbean 75 20 4 1 Asian, Native Hawaiian, or other Pacific Islander 70 24 4 2 American Indian or Native Alaskan 62 25 6 7 Multicultural 72 24 3 2 Parishioner Race or Ethnicity: Hispanic or Latino 79 17 2 2 U.S. born, Hispanic or Latino 71 25 2 2 Foreign-born, Hispanic or Latino 83 14 2 1 Asian, Native Hawaiian, or other Pacific Islander
69
25
4
2
Filipino 73 23 2 1 Vietnamese 76 17 5 1 Korean 37 40 13 10 Other Asian, Native Hawaiian, Pacific Islander 65 29 4 2 Black, African American, African, Afro-Caribbean
76
19
4
1
U.S. born, black or African American 74 20 4 1 Foreign-born, black, African, Afro-Caribbean 77 18 4 1 American Indian, Native Alaskan 70 22 4 4 Non-Hispanic white 72 24 2 2 U.S. born, non-Hispanic white 73 23 2 2 Foreign-born, non-Hispanic white 71 25 2 2 Multi-racial 68 24 5 3
Other or unknown 69 24 5 3

75
This parish encourages a dialogue and collaboration among various cultures. Percentage responding as such:
Strongly
agree Somewhat
agree Somewhat
disagree Strongly disagree
All Respondents: Weighted (equal parish size) 53% 33% 10% 4% Un-weighted 55 33 9 3 Parish Serves Community: Hispanic or Latino 58 30 9 3 Black, African American, African, Afro-Caribbean 59 31 8 2 Asian, Native Hawaiian, or other Pacific Islander 58 31 8 2 American Indian or Native Alaskan 45 34 13 8 Multicultural 52 36 9 3 Parishioner Race or Ethnicity: Hispanic or Latino 62 27 8 3 U.S. born, Hispanic or Latino 47 39 11 3 Foreign-born, Hispanic or Latino 68 23 6 3 Asian, Native Hawaiian, or other Pacific Islander
55
34
9
3
Filipino 60 32 6 2 Vietnamese 65 26 8 1 Korean 21 36 27 15 Other Asian, Native Hawaiian, Pacific Islander 49 38 11 2 Black, African American, African, Afro-Caribbean
57
31
9
3
U.S. born, black or African American 49 38 10 4 Foreign-born, black, African, Afro-Caribbean 65 26 7 2 American Indian, Native Alaskan 50 36 11 4 Non-Hispanic white 48 38 11 3 U.S. born, non-Hispanic white 48 38 11 3 Foreign-born, non-Hispanic white 50 38 8 5 Multi-racial 54 33 8 5
Other or unknown 51 36 10 4

76
This parish reaches out to those who have lost a sense of faith. Percentage responding as such:
Strongly
agree Somewhat
agree Somewhat
disagree Strongly disagree
All Respondents: Weighted (equal parish size) 47% 32% 15% 6% Un-weighted 49 32 14 5 Parish Serves Community: Hispanic or Latino 46 33 15 6 Black, African American, African, Afro-Caribbean 55 29 12 4 Asian, Native Hawaiian, or other Pacific Islander 56 29 12 3 American Indian or Native Alaskan 43 30 17 10 Multicultural 48 33 14 5 Parishioner Race or Ethnicity: Hispanic or Latino 50 28 14 8 U.S. born, Hispanic or Latino 43 32 18 7 Foreign-born, Hispanic or Latino 53 27 13 8 Asian, Native Hawaiian, or other Pacific Islander
55
31
11
3
Filipino 60 31 7 2 Vietnamese 70 20 7 3 Korean 22 33 31 14 Other Asian, Native Hawaiian, Pacific Islander 48 33 15 4 Black, African American, African, Afro-Caribbean
52
31
13
4
U.S. born, black or African American 47 33 15 4 Foreign-born, black, African, Afro-Caribbean 56 30 10 5 American Indian, Native Alaskan 47 32 12 9 Non-Hispanic white 36 40 19 5 U.S. born, non-Hispanic white 36 40 19 5 Foreign-born, non-Hispanic white 37 39 18 7 Multi-racial 49 27 19 5
Other or unknown 47 34 12 6

77
This parish is growing in numbers. Percentage responding as such:
Strongly
agree Somewhat
agree Somewhat
disagree Strongly disagree
All Respondents: Weighted (equal parish size) 39% 33% 17% 10% Un-weighted 48 33 13 6 Parish Serves Community: Hispanic or Latino 45 32 14 9 Black, African American, African, Afro-Caribbean 53 31 13 4 Asian, Native Hawaiian, or other Pacific Islander 54 31 11 4 American Indian or Native Alaskan 28 34 19 19 Multicultural 47 36 13 5 Parishioner Race or Ethnicity: Hispanic or Latino 52 31 12 6 U.S. born, Hispanic or Latino 44 37 15 4 Foreign-born, Hispanic or Latino 55 29 10 6 Asian, Native Hawaiian, or other Pacific Islander
53
33
9
5
Filipino 60 32 6 2 Vietnamese 73 20 5 2 Korean 12 30 24 35 Other Asian, Native Hawaiian, Pacific Islander 44 39 13 5 Black, African American, African, Afro-Caribbean
50
35
11
4
U.S. born, black or African American 37 41 17 6 Foreign-born, black, African, Afro-Caribbean 61 30 5 3 American Indian, Native Alaskan 33 38 18 11 Non-Hispanic white 31 36 22 11 U.S. born, non-Hispanic white 30 36 22 11 Foreign-born, non-Hispanic white 38 36 20 6 Multi-racial 47 34 10 9
Other or unknown 51 33 11 5

78
How interested would you be in the following?... Adult faith formation classes Percentage responding as such:
Very much Somewhat A little Not at All
All Respondents: Weighted (equal parish size) 40% 34% 16% 10% Un-weighted 44 32 16 9 Parish Serves Community: Hispanic or Latino 47 27 17 10 Black, African American, African, Afro-Caribbean 47 32 15 6 Asian, Native Hawaiian, or other Pacific Islander 42 33 15 10 American Indian or Native Alaskan 41 36 16 7 Multicultural 41 35 15 9 Parishioner Race or Ethnicity: Hispanic or Latino 58 26 11 6 U.S. born, Hispanic or Latino 42 32 16 10 Foreign-born, Hispanic or Latino 65 23 9 4 Asian, Native Hawaiian, or other Pacific Islander
41
36
15
8
Filipino 45 35 14 6 Vietnamese 46 31 12 11 Korean 28 45 18 9 Other Asian, Native Hawaiian, Pacific Islander 34 38 17 11 Black, African American, African, Afro-Caribbean
50
32
13
6
U.S. born, black or African American 42 36 16 6 Foreign-born, black, African, Afro-Caribbean 56 28 11 5 American Indian, Native Alaskan 47 33 14 6 Non-Hispanic white 26 34 24 16 U.S. born, non-Hispanic white 25 34 25 16 Foreign-born, non-Hispanic white 33 31 20 16 Multi-racial 47 23 20 10
Other or unknown 39 31 18 12

79
How interested would you be in the following?... Collaboration with other parishes Percentage responding as such:
Very much Somewhat A little Not at All
All Respondents: Weighted (equal parish size) 36% 37% 19% 9% Un-weighted 40 35 17 8 Parish Serves Community: Hispanic or Latino 42 31 18 9 Black, African American, African, Afro-Caribbean 51 33 12 4 Asian, Native Hawaiian, or other Pacific Islander 38 36 17 9 American Indian or Native Alaskan 33 35 21 11 Multicultural 38 38 17 8 Parishioner Race or Ethnicity: Hispanic or Latino 50 30 14 6 U.S. born, Hispanic or Latino 42 32 16 10 Foreign-born, Hispanic or Latino 64 23 9 4 Asian, Native Hawaiian, or other Pacific Islander
38
38
17
7
Filipino 45 35 14 6 Vietnamese 46 31 12 11 Korean 16 37 24 22 Other Asian, Native Hawaiian, Pacific Islander 34 38 17 11 Black, African American, African, Afro-Caribbean
51
34
12
4
U.S. born, black or African American 42 36 16 6 Foreign-born, black, African, Afro-Caribbean 56 28 11 5 American Indian, Native Alaskan 39 36 20 6 Non-Hispanic white 25 38 24 13 U.S. born, non-Hispanic white 25 34 25 16 Foreign-born, non-Hispanic white 33 32 20 16 Multi-racial 45 30 17 7
Other or unknown 39 31 18 12

80
How interested would you be in the following?... Community service or volunteering Percentage responding as such:
Very much Somewhat A little Not at All
All Respondents: Weighted (equal parish size) 45% 34% 14% 6% Un-weighted 51 32 13 5 Parish Serves Community: Hispanic or Latino 49 32 14 6 Black, African American, African, Afro-Caribbean 64 25 7 3 Asian, Native Hawaiian, or other Pacific Islander 54 29 12 6 American Indian or Native Alaskan 42 33 17 8 Multicultural 48 34 13 5 Parishioner Race or Ethnicity: Hispanic or Latino 54 28 12 6 U.S. born, Hispanic or Latino 52 31 11 6 Foreign-born, Hispanic or Latino 55 27 12 6 Asian, Native Hawaiian, or other Pacific Islander
52
32
11
5
Filipino 57 30 9 4 Vietnamese 46 36 13 5 Korean 26 39 21 15 Other Asian, Native Hawaiian, Pacific Islander 50 33 12 5 Black, African American, African, Afro-Caribbean
62
28
8
3
U.S. born, black or African American 58 30 9 3 Foreign-born, black, African, Afro-Caribbean 64 27 7 2 American Indian, Native Alaskan 48 33 14 6 Non-Hispanic white 36 39 18 7 U.S. born, non-Hispanic white 36 38 18 8 Foreign-born, non-Hispanic white 37 42 15 6 Multi-racial 59 23 12 7
Other or unknown 48 30 17 6

81
How interested would you be in the following?... Whole family catechesis classes Percentage responding as such:
Very much Somewhat A little Not at All
All Respondents: Weighted (equal parish size) 37% 29% 18% 16% Un-weighted 44 29 16 11 Parish Serves Community: Hispanic or Latino 48 25 15 12 Black, African American, African, Afro-Caribbean 46 29 14 11 Asian, Native Hawaiian, or other Pacific Islander 41 30 17 12 American Indian or Native Alaskan 41 27 17 15 Multicultural 42 32 15 11 Parishioner Race or Ethnicity: Hispanic or Latino 60 23 11 6 U.S. born, Hispanic or Latino 45 29 16 10 Foreign-born, Hispanic or Latino 65 22 8 5 Asian, Native Hawaiian, or other Pacific Islander
42
33
16
9
Filipino 47 34 13 6 Vietnamese 44 28 19 9 Korean 18 33 24 26 Other Asian, Native Hawaiian, Pacific Islander 36 32 19 13 Black, African American, African, Afro-Caribbean
48
30
13
8
U.S. born, black or African American 39 32 18 11 Foreign-born, black, African, Afro-Caribbean 56 28 10 6 American Indian, Native Alaskan 49 29 13 9 Non-Hispanic white 22 31 24 23 U.S. born, non-Hispanic white 21 30 35 24 Foreign-born, non-Hispanic white 29 32 18 20 Multi-racial 47 22 19 12
Other or unknown 42 27 16 15

82
How interested would you be in the following?... Small faith communities Percentage responding as such:
Very much Somewhat A little Not at All
All Respondents: Weighted (equal parish size) 36% 35% 18% 11% Un-weighted 41 32 17 10 Parish Serves Community: Hispanic or Latino 45 27 17 11 Black, African American, African, Afro-Caribbean 45 31 16 9 Asian, Native Hawaiian, or other Pacific Islander 39 34 17 10 American Indian or Native Alaskan 37 38 17 8 Multicultural 39 34 17 10 Parishioner Race or Ethnicity: Hispanic or Latino 56 26 12 7 U.S. born, Hispanic or Latino 38 33 19 10 Foreign-born, Hispanic or Latino 62 24 9 5 Asian, Native Hawaiian, or other Pacific Islander
40
36
16
8
Filipino 44 36 14 6 Vietnamese 46 28 20 6 Korean 26 47 15 12 Other Asian, Native Hawaiian, Pacific Islander 34 36 20 10 Black, African American, African, Afro-Caribbean
46
31
15
8
U.S. born, black or African American 37 35 18 10 Foreign-born, black, African, Afro-Caribbean 53 29 12 6 American Indian, Native Alaskan 40 37 15 9 Non-Hispanic white 22 32 27 19 U.S. born, non-Hispanic white 22 32 28 19 Foreign-born, non-Hispanic white 23 37 22 19 Multi-racial 48 25 19 8
Other or unknown 34 32 20 15
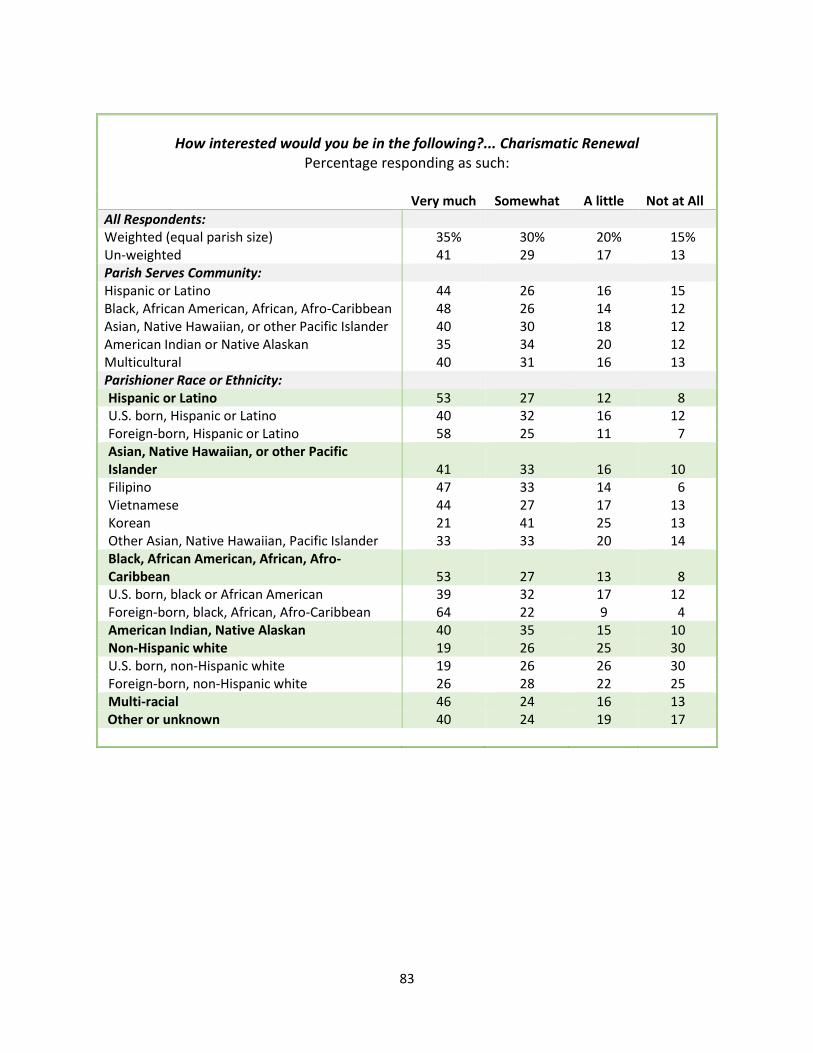
83
How interested would you be in the following?... Charismatic Renewal Percentage responding as such:
Very much Somewhat A little Not at All
All Respondents: Weighted (equal parish size) 35% 30% 20% 15% Un-weighted 41 29 17 13 Parish Serves Community: Hispanic or Latino 44 26 16 15 Black, African American, African, Afro-Caribbean 48 26 14 12 Asian, Native Hawaiian, or other Pacific Islander 40 30 18 12 American Indian or Native Alaskan 35 34 20 12 Multicultural 40 31 16 13 Parishioner Race or Ethnicity: Hispanic or Latino 53 27 12 8 U.S. born, Hispanic or Latino 40 32 16 12 Foreign-born, Hispanic or Latino 58 25 11 7 Asian, Native Hawaiian, or other Pacific Islander
41
33
16
10
Filipino 47 33 14 6 Vietnamese 44 27 17 13 Korean 21 41 25 13 Other Asian, Native Hawaiian, Pacific Islander 33 33 20 14 Black, African American, African, Afro-Caribbean
53
27
13
8
U.S. born, black or African American 39 32 17 12 Foreign-born, black, African, Afro-Caribbean 64 22 9 4 American Indian, Native Alaskan 40 35 15 10 Non-Hispanic white 19 26 25 30 U.S. born, non-Hispanic white 19 26 26 30 Foreign-born, non-Hispanic white 26 28 22 25 Multi-racial 46 24 16 13
Other or unknown 40 24 19 17

84
How interested would you be in the following?... Cursillo Percentage responding as such:
Very much Somewhat A little Not at All
All Respondents: Weighted (equal parish size) 31% 30% 20% 18% Un-weighted 37 30 18 15 Parish Serves Community: Hispanic or Latino 42 27 17 14 Black, African American, African, Afro-Caribbean 40 28 17 16 Asian, Native Hawaiian, or other Pacific Islander 37 30 17 15 American Indian or Native Alaskan 28 36 22 14 Multicultural 35 33 18 14 Parishioner Race or Ethnicity: Hispanic or Latino 50 28 13 9 U.S. born, Hispanic or Latino 34 32 20 14 Foreign-born, Hispanic or Latino 55 27 11 7 Asian, Native Hawaiian, or other Pacific Islander
36
34
18
12
Filipino 40 35 15 10 Vietnamese 50 25 15 10 Korean 24 33 28 15 Other Asian, Native Hawaiian, Pacific Islander 25 34 24 17 Black, African American, African, Afro-Caribbean
40
30
18
12
U.S. born, black or African American 34 32 18 16 Foreign-born, black, African, Afro-Caribbean 45 29 17 9 American Indian, Native Alaskan 29 37 19 15 Non-Hispanic white 17 25 26 32 U.S. born, non-Hispanic white 17 24 26 33 Foreign-born, non-Hispanic white 18 29 25 29 Multi-racial 48 22 20 11
Other or unknown 34 30 16 20

85
How interested would you be in the following?... Outreach programs to at-risk youth Percentage responding as such:
Very much Somewhat A little Not at All
All Respondents: Weighted (equal parish size) 48% 27% 14% 11% Un-weighted 56 25 12 7 Parish Serves Community: Hispanic or Latino 60 21 12 7 Black, African American, African, Afro-Caribbean 65 21 9 5 Asian, Native Hawaiian, or other Pacific Islander 52 25 13 10 American Indian or Native Alaskan 46 29 14 11 Multicultural 54 28 12 7 Parishioner Race or Ethnicity: Hispanic or Latino 73 17 7 4 U.S. born, Hispanic or Latino 62 22 11 5 Foreign-born, Hispanic or Latino 77 14 5 4 Asian, Native Hawaiian, or other Pacific Islander
51
29
13
7
Filipino 57 29 10 4 Vietnamese 53 24 13 10 Korean 21 36 22 21 Other Asian, Native Hawaiian, Pacific Islander 46 30 16 8 Black, African American, African, Afro-Caribbean
65
21
9
5
U.S. born, black or African American 62 23 9 6 Foreign-born, black, African, Afro-Caribbean 65 21 9 5 American Indian, Native Alaskan 56 25 11 8 Non-Hispanic white 38 32 18 13 U.S. born, non-Hispanic white 37 32 19 13 Foreign-born, non-Hispanic white 43 33 14 10 Multi-racial 60 21 12 7
Other or unknown 50 23 16 11

86
How interested would you be in the following?... Catholic fraternal societies Percentage responding as such:
Very much Somewhat A little Not at All
All Respondents: Weighted (equal parish size) 33% 32% 19% 16% Un-weighted 41 31 16 12 Parish Serves Community: Hispanic or Latino 47 28 15 11 Black, African American, African, Afro-Caribbean 43 28 16 13 Asian, Native Hawaiian, or other Pacific Islander 38 31 18 13 American Indian or Native Alaskan 29 36 22 14 Multicultural 38 34 16 12 Parishioner Race or Ethnicity: Hispanic or Latino 55 27 11 8 U.S. born, Hispanic or Latino 41 33 15 11 Foreign-born, Hispanic or Latino 60 25 9 6 Asian, Native Hawaiian, or other Pacific Islander
38
35
17
10
Filipino 42 36 15 7 Vietnamese 45 27 15 13 Korean 18 49 18 14 Other Asian, Native Hawaiian, Pacific Islander 32 33 20 15 Black, African American, African, Afro-Caribbean
48
29
14
9
U.S. born, black or African American 35 32 19 14 Foreign-born, black, African, Afro-Caribbean 59 27 9 6 American Indian, Native Alaskan 37 34 18 12 Non-Hispanic white 23 32 25 21 U.S. born, non-Hispanic white 22 31 26 21 Foreign-born, non-Hispanic white 27 37 18 19 Multi-racial 45 27 16 13
Other or unknown 41 29 15 15

87
How interested would you be in the following?... Catholic volunteer/aid organizations Percentage responding as such:
Very much Somewhat A little Not at All
All Respondents: Weighted (equal parish size) 45% 34% 13% 9% Un-weighted 53 30 11 6 Parish Serves Community: Hispanic or Latino 55 27 12 6 Black, African American, African, Afro-Caribbean 60 26 8 5 Asian, Native Hawaiian, or other Pacific Islander 51 30 11 8 American Indian or Native Alaskan 41 37 13 9 Multicultural 51 33 10 5 Parishioner Race or Ethnicity: Hispanic or Latino 63 25 8 4 U.S. born, Hispanic or Latino 54 30 11 5 Foreign-born, Hispanic or Latino 66 23 7 4 Asian, Native Hawaiian, or other Pacific Islander
53
31
10
6
Filipino 58 30 8 4 Vietnamese 56 27 12 5 Korean 24 48 14 14 Other Asian, Native Hawaiian, Pacific Islander 47 33 13 7 Black, African American, African, Afro-Caribbean
63
26
8
4
U.S. born, black or African American 54 30 10 7 Foreign-born, black, African, Afro-Caribbean 69 22 6 3 American Indian, Native Alaskan 50 31 12 8 Non-Hispanic white 35 39 17 9 U.S. born, non-Hispanic white 35 38 18 9 Foreign-born, non-Hispanic white 38 43 11 8 Multi-racial 60 25 9 6
Other or unknown 50 29 13 7

88
How interested would you be in the following?... Language classes for parishioners Percentage responding as such:
Very much Somewhat A little Not at All
All Respondents: Weighted (equal parish size) 40% 26% 17% 17% Un-weighted 47 26 14 12 Parish Serves Community: Hispanic or Latino 53 23 13 11 Black, African American, African, Afro-Caribbean 47 25 15 13 Asian, Native Hawaiian, or other Pacific Islander 44 27 15 14 American Indian or Native Alaskan 34 30 16 21 Multicultural 45 29 15 11 Parishioner Race or Ethnicity: Hispanic or Latino 62 22 9 7 U.S. born, Hispanic or Latino 48 29 13 11 Foreign-born, Hispanic or Latino 68 19 7 6 Asian, Native Hawaiian, or other Pacific Islander
44
30
15
11
Filipino 49 31 13 7 Vietnamese 56 22 13 9 Korean 22 35 16 27 Other Asian, Native Hawaiian, Pacific Islander 34 30 20 16 Black, African American, African, Afro-Caribbean
54
25
12
9
U.S. born, black or African American 47 27 14 13 Foreign-born, black, African, Afro-Caribbean 59 23 11 7 American Indian, Native Alaskan 42 27 12 19 Non-Hispanic white 29 28 21 23 U.S. born, non-Hispanic white 28 28 21 23 Foreign-born, non-Hispanic white 33 31 16 20 Multi-racial 55 17 14 14
Other or unknown 42 31 15 12

89
How interested would you be in the following?... Efforts to register voters Percentage responding as such:
Very much Somewhat A little Not at All
All Respondents: Weighted (equal parish size) 36% 27% 17% 20% Un-weighted 44 27 15 14 Parish Serves Community: Hispanic or Latino 47 23 15 15 Black, African American, African, Afro-Caribbean 57 24 11 7 Asian, Native Hawaiian, or other Pacific Islander 42 26 15 16 American Indian or Native Alaskan 35 26 18 21 Multicultural 40 30 16 14 Parishioner Race or Ethnicity: Hispanic or Latino 51 25 13 12 U.S. born, Hispanic or Latino 40 27 17 16 Foreign-born, Hispanic or Latino 55 24 11 10 Asian, Native Hawaiian, or other Pacific Islander
41
30
16
13
Filipino 48 30 15 7 Vietnamese 39 26 16 19 Korean 15 26 22 37 Other Asian, Native Hawaiian, Pacific Islander 32 31 19 19 Black, African American, African, Afro-Caribbean
58
24
11
7
U.S. born, black or African American 60 24 10 6 Foreign-born, black, African, Afro-Caribbean 56 25 12 8 American Indian, Native Alaskan 42 30 12 17 Non-Hispanic white 29 26 20 25 U.S. born, non-Hispanic white 29 26 21 25 Foreign-born, non-Hispanic white 35 27 16 22 Multi-racial 55 19 14 12
Other or unknown 44 25 17 14