Embed Size (px)
Citation preview

Cultural Diversity and Workplace Dynamics:
Jim Freeman and Graham Winch
E-mail: [email protected]
A Transmanche Link retrospective

April 19, 2023OR54 in Edinburgh 3-6 Sept
2012 2
Related publications Winch, G, Clifton, N. and Millar, C. (1997)
‘Culture and Organization: The Case of Transmanche-Link’, British Journal of Management, Vol. 8, No. 3, pp. 237–249.
Winch, G, Clifton, N. and Millar, C. (2000) ‘Organisation and Management in an Anglo-French consortium: The Case of Transmanche-Link’, Journal of Management Studies, Vol. 37, No. 5, pp. 663-687.

April 19, 2023OR54 in Edinburgh 3-6 Sept
2012 3
Cross culturalism
Cross-cultural project teams are increasingly the norm, globally.
Such projects accounted for nearly all gross capital formation - equivalent to 22% of the World GDP - in 2009 (http://www.worldbank.org/).

April 19, 2023OR54 in Edinburgh 3-6 Sept
2012 4April 19, 2023OR54 in Edinburgh 3-6 Sept
2012 4
Structure of Presentation
Background Data collection Modelling (SEM) results Conclusions

April 19, 2023OR54 in Edinburgh 3-6 Sept
2012 5
Cultural differences (re. Hofstede (1980))Power DistanceUncertainty AvoidanceIndividualism vs. CollectivismMasculinity vs. FemininityLong term orientation
Cultural differences (re. Trompenaars and Hamopden-Turner(1998))
Background

April 19, 2023OR54 in Edinburgh 3-6 Sept
2012 6
Relationships with people Neutral versus emotional Universalism versus particularism Achievement versus ascription Specific versus diffuse Attitude to Time: Sequential versus Synchronic Attitude to Environment Context Convergers and Divergers

April 19, 2023OR54 in Edinburgh 3-6 Sept
2012 7
Data for the project was collected through self-completed questionnaires distributed among the staff of the TML consortium (Winch et al., 2000).
Target respondents included first line supervisory level staff and above.
The questionnaire - based on the Van de Ven and Ferry scale (Van de Ven and Ferry, 1980) – aimed to capture measures on organisation and workplace dynamics
Data Collection

April 19, 2023OR54 in Edinburgh 3-6 Sept
2012 8
Additionally, Hofstede’s Value Survey Module was incorporated to identify and validate cultural differences between the British and the French working at TML.
There were 153 British and 52 French responses to the survey, representing an overall return of 39%.
Item responses were collected mainly on a 5 point Likert scale; demographic measurements on categorical scales.

April 19, 2023OR54 in Edinburgh 3-6 Sept
2012 9
Outliers Missing values Multivariate normality Sample size
Data hygiene checks

April 19, 2023OR54 in Edinburgh 3-6 Sept
2012 10
Using AMOS 16, modelling was carried out by methodically building and testing confirmatory factor analysis (sub)models before graduating to higher order structural regression (hybrid) models (Anderson and Gerbing, 1988).

April 19, 2023OR54 in Edinburgh 3-6 Sept
2012 11
Proposed model

April 19, 2023OR54 in Edinburgh 3-6 Sept
2012 12
Reliability
The research instrument was tested for reliability (internal consistency) using Cronbach’s to confirm the adequacy of measures for testing research hypotheses. According to a Hinton et al (2004) for
excellent reliability α ≥ 0.9high reliability 0.7 ≤ α < 0.9 moderate reliability 0.5 ≤ α < 0.7 andlow reliability α < 0.5.

April 19, 2023OR54 in Edinburgh 3-6 Sept
2012 13
Construct validity
To assess construct validity, a factor analysis was conducted using PCA as an extraction method with Varimax and Kaiser normalisation as a rotation method.

April 19, 2023OR54 in Edinburgh 3-6 Sept
2012 14
In general, variables loaded on each factor as anticipated and satisfied the conditions of construct validity both in terms of
discriminant validity (loadings of at least 0.4 and only one cross-loading slightly above |0.4| in the case of the Unit submodel) and
convergent validity (eigenvalues of at least 1, loadings of at least 0.4, items that load on to posited constructs).
Thus the validity of our data and findings was confirmed.

April 19, 2023OR54 in Edinburgh 3-6 Sept
2012 15
SEM Modelling results
Following a parallel approach to Winch et al. (2000) submodels for Workplace Dynamics were first formulated and tested at:
1. Unit Level2. Task Level and3. Individual Level
Next, submodels for Ideal Job Perceptions and Culture were developed.
April 19, 2023OR54 in Edinburgh 3-6 Sept
2012 16
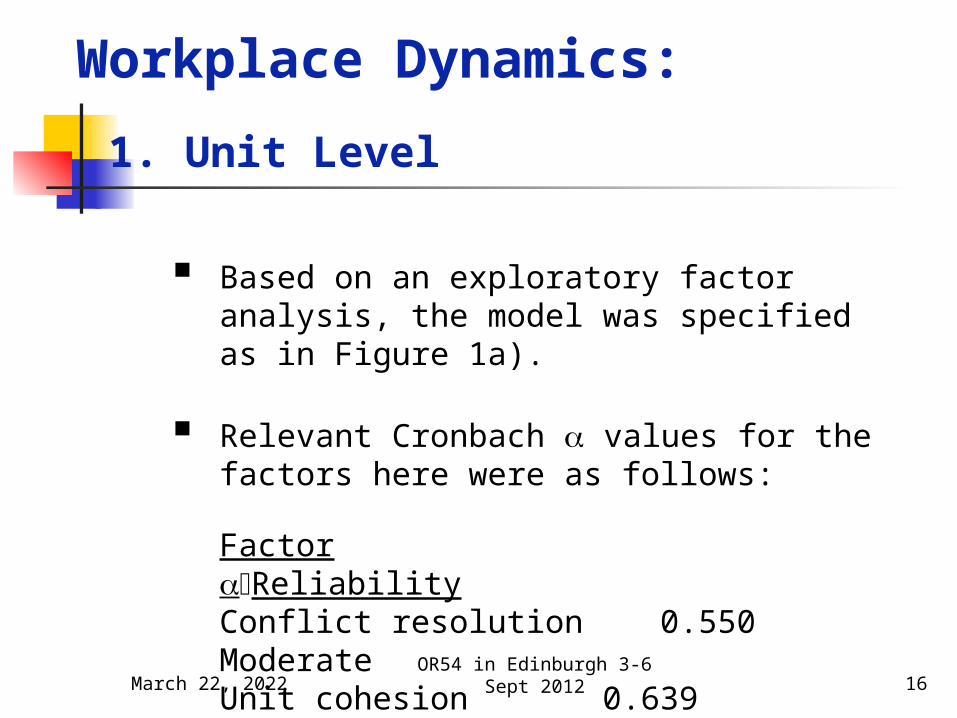
Based on an exploratory factor analysis, the model was specified as in Figure 1a).
Relevant Cronbach values for the factors here were as follows:
Factor ReliabilityConflict resolution 0.550 ModerateUnit cohesion 0.639 Moderate
Workplace Dynamics:
1. Unit Level

April 19, 2023OR54 in Edinburgh 3-6 Sept
2012 17
Figure 1 a)
April 19, 2023OR54 in Edinburgh 3-6 Sept
2012 18
Though the latter model was found to fit the data well, as a refinement, it was decided to allow the loading of the item ‘members of unit encourage excellence’ on to the Conflict resolution latent construct.
(The argument being that unit members cooperating to achieve excellence would also be well-disposed to resolving conflicts.)

April 19, 2023OR54 in Edinburgh 3-6 Sept
2012 19
Fit results for the revised model were as follows:
ThresholdAcceptability
CMIN/DF = 1.818 < 1-2 AcceptableCFI = 0.953 > 0.9 AcceptableRMSEA = 0.063 < 0.08Acceptable
with standardised estimates for the model summarised in Figure 1b).

April 19, 2023OR54 in Edinburgh 3-6 Sept
2012 20
Figure 1 b)

April 19, 2023OR54 in Edinburgh 3-6 Sept
2012 21
All loadings here were found to be statistically significant (p<0.05) and all relationships in the expected direction.

April 19, 2023OR54 in Edinburgh 3-6 Sept
2012 22
The CFA model in Figure 2a) captures the task-related dimensions in terms of the Control and coordination achieved at work and the Autonomy provided to employees in performing their job.
Relevant Cronbach values for the factors here were as follows:
Factor ReliabilityWork control 0.734 HighWork autonomy 0.819 High
2. Task Level

April 19, 2023OR54 in Edinburgh 3-6 Sept
2012 23
Figure 2 a)
April 19, 2023OR54 in Edinburgh 3-6 Sept
2012 24
Following encouraging results from fitting the above model to the data it was decided the error terms related to the indicators ‘authority in establishing procedures’ and ‘authority in establishing work exceptions’ could be allowed to be correlated since both items are concerned with the process flow while the rest relate to the actual task, quantum of work and work speed respectively.

April 19, 2023OR54 in Edinburgh 3-6 Sept
2012 25
Allowing for this refinement, fit details were:
CMIN/DF = 1.660 CFI = 0.968 RMSEA = 0.057
all of which were judged to be acceptable.
Standardised estimates are as summarised in Figure 2b).

April 19, 2023OR54 in Edinburgh 3-6 Sept
2012 26
Figure 2 b)

April 19, 2023OR54 in Edinburgh 3-6 Sept
2012 27
All indicator estimates are statistically significant
at the 5% level with the arrow directions too along expected lines.
April 19, 2023OR54 in Edinburgh 3-6 Sept
2012 28
3. Individual Level
The indicator variables analysed reflect individual behaviour and feelings at the workplace. The model specified is shown in Figure 3a).
Relevant Cronbach values for the factors here were as follows:
Factor ReliabilityJob satisfaction -0.525 LowInstrumental motivation 0.814 HighFeedback motivation 0.815 HighJob involvement 0.602Moderate

April 19, 2023OR54 in Edinburgh 3-6 Sept
2012 29
Figure 3 a)

April 19, 2023OR54 in Edinburgh 3-6 Sept
2012 30
In the next step, the model was marginally modified by allowing ‘motivation from promise of promotion’ to load on Feedback motivation in addition to Instrumental motivation’ This is a realistic assumption as the specified item has the characteristics of being both related to feedback and the material aspect of promotion.

April 19, 2023OR54 in Edinburgh 3-6 Sept
2012 31
Fit details were:
CMIN/DF = 1.603 CFI = 0.967 RMSEA = 0.054
all of which were judged to be acceptable.
Standardised estimates are as summarised in Figure 3b).

April 19, 2023OR54 in Edinburgh 3-6 Sept
2012 32
Model 3b)

April 19, 2023OR54 in Edinburgh 3-6 Sept
2012 33
Model 3b)
All regression weights for the indicators are statistically significant, high in magnitude and in the hypothesised direction.

April 19, 2023OR54 in Edinburgh 3-6 Sept
2012 34
Ideal Job Perceptions
The model in Figure 4 – which takes the form of a second order CFA - reflects the individual preferences and perceptions of an ideal job.
Relevant Cronbach values for the factors here were as follows:
Factor ReliabilityWork relations 0.477 LowJob content 0.544 ModerateExternal factors 0.607Moderate

April 19, 2023OR54 in Edinburgh 3-6 Sept
2012 35
Figure 4a)

April 19, 2023OR54 in Edinburgh 3-6 Sept
2012 36
Note that to aid identification of the model (Byrne, 2001), the residual terms R1, R2 and R3 were assumed to have the same variance
Fit details were as follows:
CMIN/DF = 1.818 CFI = 0.954 RMSEA = 0.052
all of which were judged to be acceptable.
Standardised estimates are shown in Figure 4b).

April 19, 2023OR54 in Edinburgh 3-6 Sept
2012 37
Figure 4b)
April 19, 2023OR54 in Edinburgh 3-6 Sept
2012 38
The latter model makes it possible to infer the strength of relationship between the first-order and second-order factor. The latent constructs – job content (0.89) and external factors (0.92) are strong measures of ideal job preferences followed by work relations (0.65) with all three being statistically significant. Additionally, all indicators load well on to the respective latent variables and in expected directions.

April 19, 2023OR54 in Edinburgh 3-6 Sept
2012 39
This model - based on three of Hofstede’s cultural dimensions – Collectivism, Uncertainty Avoidance and Power Distance - is displayed in Figure 5a).
Relevant Cronbach values for the factors here were as follows:
Factor ReliabilityCollectivism 0.305 LowUncertainty avoidance 0.624ModeratePower distance 0.459 Low
Culture

April 19, 2023OR54 in Edinburgh 3-6 Sept
2012 40
Figure 5a)

April 19, 2023OR54 in Edinburgh 3-6 Sept
2012 41
As with the previous model, the residual terms R1, R2 and R3 were assumed to have the same variance.
Model fit results were as follows:
CMIN/DF = 1.600 CFI = 0.876 RMSEA = 0.054
which were judged to be reasonably acceptable.
Standardised estimates for the model are shown in Figure 5b).

April 19, 2023OR54 in Edinburgh 3-6 Sept
2012 42
Figure 5b)

April 19, 2023OR54 in Edinburgh 3-6 Sept
2012 43
All indicators show sufficient loadings on their respective first order latent variables. The directions are also as hypothesised earlier. The latent constructs uncertainty avoidance (0.97) and collectivism (0.89) proved to be statistically significant (p<0.05) and hence, represent strong measures of culture. However, power distance (-0.16) is a borderline case in terms of its statistical significance (p<0.1).

April 19, 2023OR54 in Edinburgh 3-6 Sept
2012 44
Summarising hypothesis test relationships for the above, we have results as follows:
Standardised Expected regression
sign weight Conclusion___________________________________________________________________H1: Culture → Ideal Job Perceptions + 0.158* Supported
Unit levelH2: Culture → Conflict resolution - -0.103 Not
supportedH3: Culture → Unit cohesion + 0.071 Not supportedH4: Ideal Job Perceptions → Conflict resolution - -0.123 Not
supportedH5: Ideal Job Perceptions → Unit cohesion + 0.000 Not
supported
Relationships between Culture, Ideal Job Perceptions and
Workplace Dynamics

April 19, 2023OR54 in Edinburgh 3-6 Sept
2012 45
Standardised Expected regression
sign weight Conclusion___________________________________________________________________Task levelH6: Culture → Work control + 0.155* SupportedH7: Culture → Work autonomy - -0.074 Not
supportedH8: Ideal Job Perceptions → Work control + 0.174*
SupportedH9: Ideal Job Perceptions → Work autonomy - -0.079 Not supported
April 19, 2023OR54 in Edinburgh 3-6 Sept
2012 46
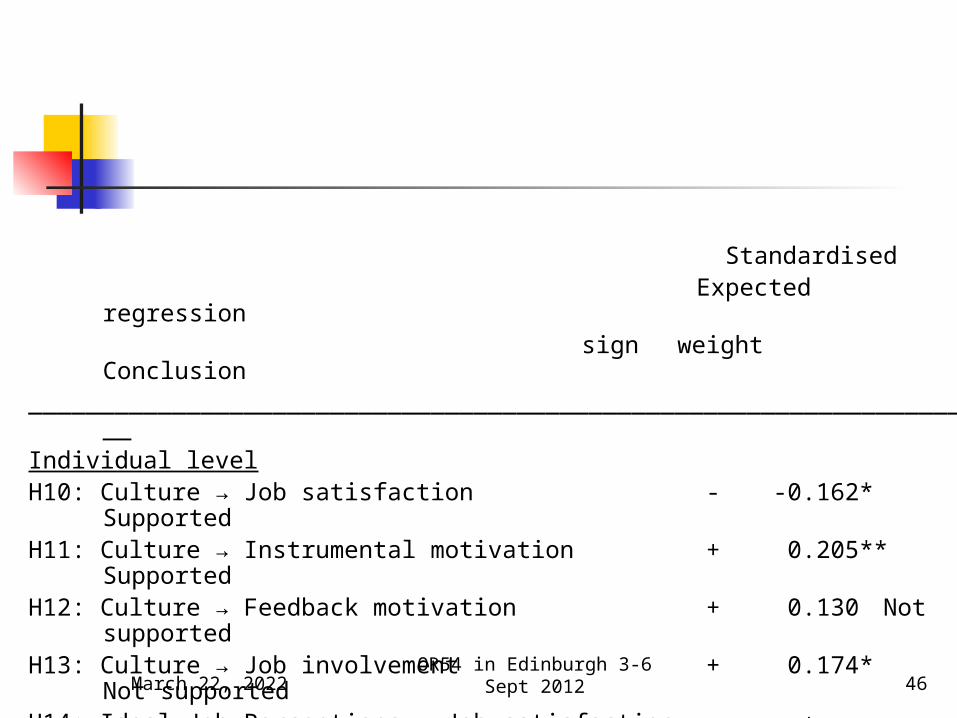
Standardised Expected regression
sign weight Conclusion___________________________________________________________________Individual levelH10: Culture → Job satisfaction - -0.162*
SupportedH11: Culture → Instrumental motivation + 0.205**
SupportedH12: Culture → Feedback motivation + 0.130 Not supportedH13: Culture → Job involvement + 0.174* Not
supportedH14: Ideal Job Perceptions → Job satisfaction + 0.249**
SupportedH15: Ideal Job Perceptions → Instrumental motivation + 0.075 Not
supported H16: Ideal Job Perceptions → Feedback motivation + 0.182* Supported
H17: Ideal Job Perceptions → Job involvement - -0.361** Supported

April 19, 2023OR54 in Edinburgh 3-6 Sept
2012 47
The final stage of the analysis involved tested the preceding (sub)models for invariance between the British and French groups. This was done by simultaneously fitting and estimating the (sub)model for each of the two groups and comparing the results.
A sequential, increasingly restrictive procedure of applying cross-group equality was employed. Of particular interest were:
1) factor loading paths, 2) factor variances / covariances
and 3) structural regression paths.
MULTIPLE GROUP ANALYSIS
April 19, 2023OR54 in Edinburgh 3-6 Sept
2012 48
For the testing, equal (forced) unstandardised parameter estimates were first derived for the two groups.
Next, the fit of the constrained model was compared to that of the unconstrained, baseline model.
Where the fit as signified by the chi-square statistic was found to be significantly worse, group variance between the British and the French was concluded.

April 19, 2023OR54 in Edinburgh 3-6 Sept
2012 49
Table 1: Multiple Group Invariance Analysis (Unit level)

April 19, 2023OR54 in Edinburgh 3-6 Sept
2012 50
As can be seen, the factor variance of conflict resolution differs significantly across theBritish and French groups and is the cause of overall non-invariance at the unit-level.
April 19, 2023OR54 in Edinburgh 3-6 Sept
2012 51
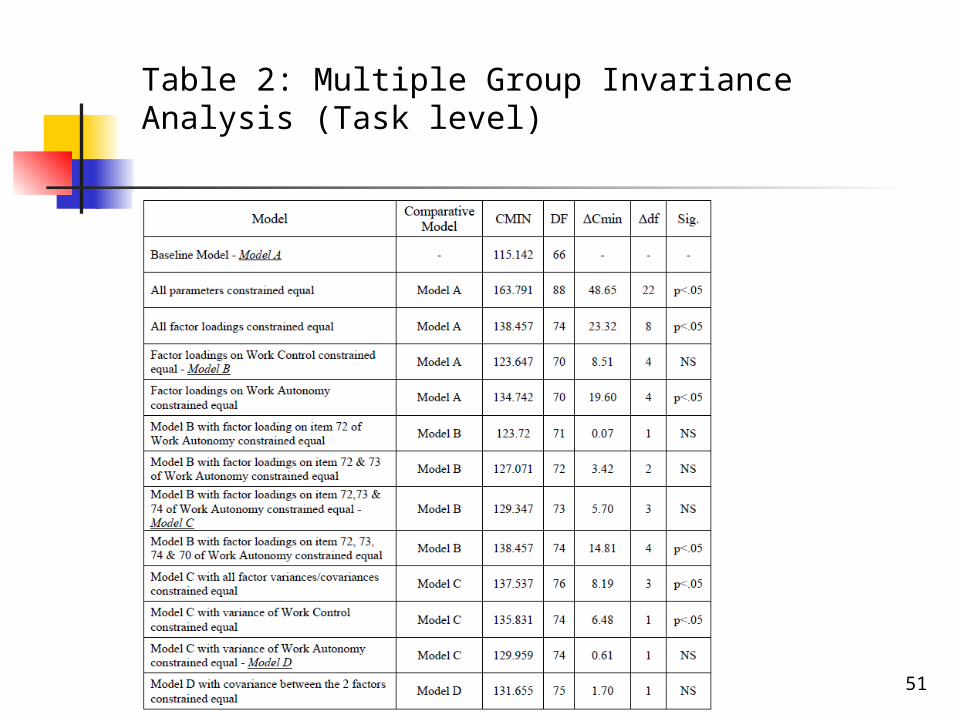
Table 2: Multiple Group Invariance Analysis (Task level)

April 19, 2023OR54 in Edinburgh 3-6 Sept
2012 52
Again it is clear there is non-invariance between the British and French groups. The reason for this is thought to be two-fold:
Though the British and the French appear to have a similar perception over the autonomy enjoyed at work, when it comes to determining the rate of task completion - they disagree significantly.
The variance in perceptions regarding work control is significantly different between the British and the French.

April 19, 2023OR54 in Edinburgh 3-6 Sept
2012 53
Table 3: Multiple Group Invariance Analysis (Individual level)

April 19, 2023OR54 in Edinburgh 3-6 Sept
2012 54
It is evident from the table that the structure for job involvement factor is not equivalent across the British and the French groups resulting in non-invariance.
Specifically, item 56 (sense of accomplishment if good performance) loads in a significantly different manner between the two groups.

April 19, 2023OR54 in Edinburgh 3-6 Sept
2012 55
Table 4: Multiple Group Invariance Analysis (Ideal Job Perceptions)

April 19, 2023OR54 in Edinburgh 3-6 Sept
2012 56
The results in Table 4 confirm significant non-invariance between the British and the French.
Since the R1, R2 and R3 errors were constrained to have equal variance in the model specification, it may be concluded that the variances of the error terms associated with the indicators are the cause of the non-equivalence.

April 19, 2023OR54 in Edinburgh 3-6 Sept
2012 57
Table 5: Multiple Group Invariance Analysis (Culture)
April 19, 2023OR54 in Edinburgh 3-6 Sept
2012 58
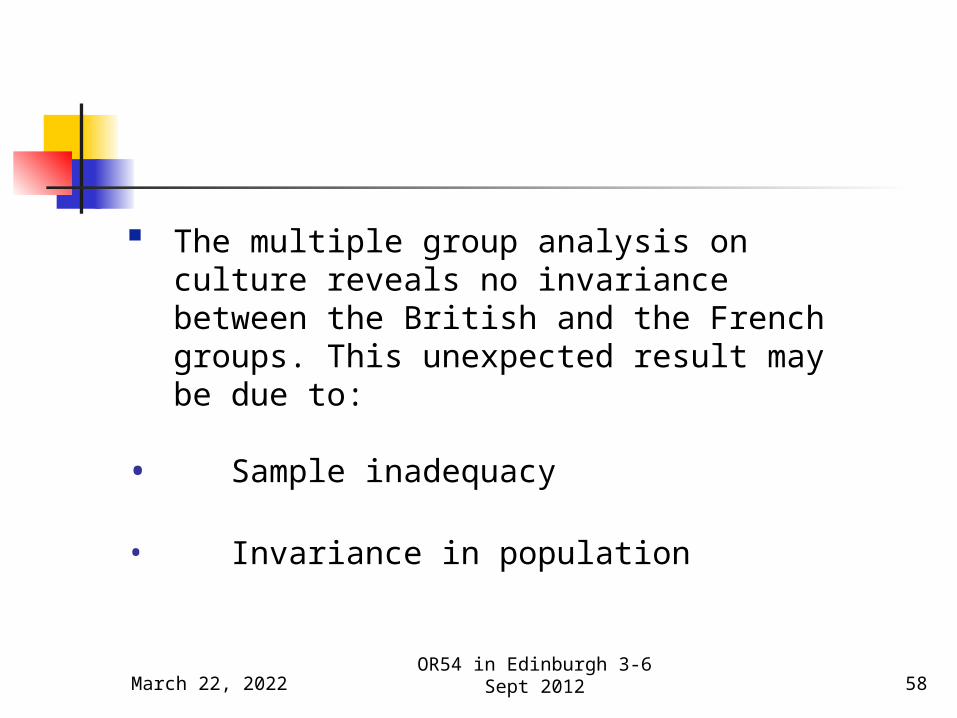
The multiple group analysis on culture reveals no invariance between the British and the French groups. This unexpected result may be due to:
• Sample inadequacy
• Invariance in population

April 19, 2023OR54 in Edinburgh 3-6 Sept
2012 59
Conclusions
The relationship between culture, job perception and workplace dynamics needs to be viewed holistically not on a piecemeal basis. Fortunately, SEM is well-placed for meeting this type of modelling requirement.
From the TML data collected, a series of significant submodels were developed - first in respect of workplace dynamics at the unit, task (organisational) and individual levels.

April 19, 2023OR54 in Edinburgh 3-6 Sept
2012 60
Then in relation to ideal job perceptions and cultural differences (culture).
The five submodels were next integrated into an overall schematic model.
A multiple group analysis showed significant non-invariance between the British and French samples for all submodels except (ironically) the culture submodel.

April 19, 2023OR54 in Edinburgh 3-6 Sept
2012 61
It is believed sampling inadequacies, may have particularly influenced the latter result.
Despite the latter and more general limitations, it is believed the study has significantly extended previous work in this area – and as a result various new insights into the understanding of workplace dynamics, ideal job perceptions and culture within an organisational context have been gained.