Embed Size (px)
Citation preview

FILE: 07JuneOverviewMapPublic.pdf
Cultural and Natural Resources Potentially Affected by Gulf Oil Spill
0 50 100 150 200 250 300 350 400 450 50025Miles
Oil Plume Forecast07 June 2010
Mobile
New Orleans
LAMS
ALFLPensacola
Tampa
BiloxiBaton Rouge
Everglades NP
Dry Tortugas NP
De Soto NM
Gulf Islands NS
Big CypressPreserve and NNL
CUBA
Key West NWR
Delta NWR
Breton NWR
St. MarksNWR
LowerSuwanee
NWR
ChassahowitzkaNWR
St. VincentNWR
Corkscrew NNL
Manatee NNL
Waccasassa NNL
Wakulla NNLMobile-
Tensaw NNL
LacassineNWR
Jean LafitteNHP
Panama City
Map compiled 07 June 2010Produced by Cultural Resources GIS 07 June Map 1
Cedar Keys NWR
JN Ding DarlingNWR
10,000 Islands NWR
Egmont Key NWR
National Key Deer Refuge
Mandalay NWR
Grand Bay NWR
Bayou Sauvage NWR
Miami
Havana
Gulf of Mexico
Ft. Jefferson Ft. Zachary Taylor
Crystal RiverMounds
GOV. STONE
Fts. Jackson &St. Philip
Ft. San Marcos
Extent of Oil Plumecomputed in GIS
from NOAA polygons
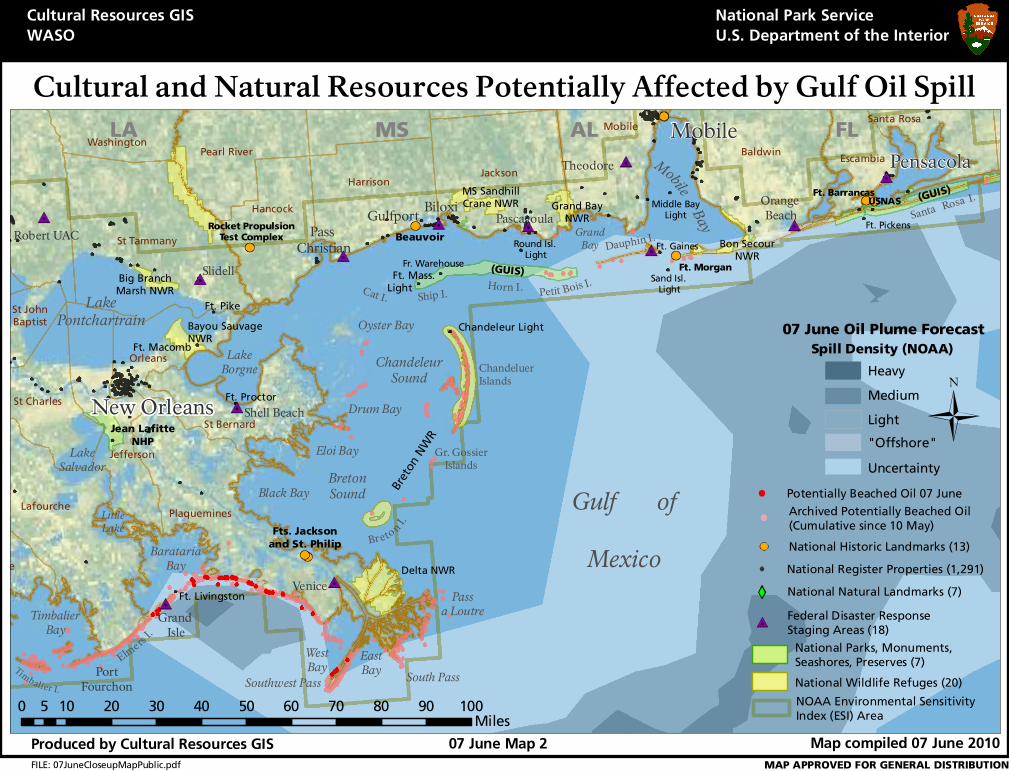
07 June Oil Plume Forecast
Spill Density (NOAA)
Heavy
Medium
Light
Uncertainty
"Offshore"
NOAA Environmental Sensitivity Index (ESI) Area
National Wildlife Refuges (20)
National Historic Landmarks (13)
National Register Properties (1,291)
National Natural Landmarks (7)
Federal Disaster ResponseStaging Areas (18)
National Parks, Monuments, Seashores, Preserves (7)
Potentially Beached Oil 07 June
UncertaintyOffshoreLightMediumHeavy
22,700 sq. mi.840 sq. mi.8,150 sq. mi.770 sq. mi.65 sq. mi.
Florida Straights
MAP APPROVED FOR GENERAL DISTRIBUTION
Archived Beached Oil(Cumulative since 10 May)
National Park Service
U.S. Department of the Interior
Cultural Resources GIS
WASO
Jefferson
Orleans
Okaloosa
Lafourche
Jackson
Baldwin
St Tammany
Plaquemines
Harrison
Mobile
Hancock
Terrebonne
Pearl River
St Bernard
St Charles
Livingston
Escambia
Washington
St JohnBaptist
St Helena
St James
Santa Rosa
FILE: 07JuneCloseupMapPublic.pdf
Map compiled 07 June 2010Produced by Cultural Resources GIS
Cultural and Natural Resources Potentially Affected by Gulf Oil Spill
0 10 20 30 40 50 60 70 80 90 1005Miles
ChandeleurSound
Bret
on N
WR
Delta NWR
Fts. Jacksonand St. Philip
Venice
Bayou SauvageNWR
Pass Christian
Shell Beach
Ft. Proctor
Ft. Macomb
Ft. Pike
Ft. Mass.Fr. Warehouse
Rocket PropulsionTest Complex
LA
07 June Map 2
National Park Service
U.S. Department of the Interior
Cultural Resources GIS
WASO
BaratariaBay
LakeBorgne
Black Bay
Eloi Bay
Drum Bay
BretonSound
MS
SlidellSand Isl.
Light
(GUIS)
Oyster Bay
Biloxi
Ship I.
Grand BayNWR
Mobile B
ay
Chandeleur Light
Light
Beauvoir
AL
Round Isl. Light
Passa Loutre
Horn I.
Dauphin I.
Br eto n I.
Gr. GossierIslands
Cat I.
Theodore
Ft. Morgan
Bon SecourNWR
Ft. Gaines
ChandeluerIslands
Orange Beach
Ft. BarrancasUSNAS
Pensacola
Ft. Pickens
FL
New Orleans
South PassSouthwest Pass
LakePontchartrain
Grand Isle
Middle BayLightPascagoula
Mobile
MS SandhillCrane NWR
Jean LafitteNHP
Petit Bois I.
Gulfport
PortFourchon
LakeSalvador
TimbalierBay
Timbalier I.
Robert UAC
LittleLake
Big BranchMarsh NWR
Gulf of
Mexico
Elmers
I.
GrandBay
EastBay
WestBay
Ft. Livingston
Santa Rosa I.(GUIS)
MAP APPROVED FOR GENERAL DISTRIBUTION
National Natural Landmarks (7)
NOAA Environmental Sensitivity Index (ESI) Area
National Wildlife Refuges (20)
National Historic Landmarks (13)
National Parks, Monuments, Seashores, Preserves (7)
Archived Potentially Beached Oil(Cumulative since 10 May)
National Register Properties (1,291)
Federal Disaster ResponseStaging Areas (18)
07 June Oil Plume Forecast
Spill Density (NOAA)
Uncertainty
"Offshore"
Light
Medium
Heavy
Potentially Beached Oil 07 June

MS
ALFL Walton
Santa RosaEscambiaBaldwin
Mobile
Jackson
FILE: 07JuneDetailMap.pdf
Map compiled 07 June 2010Produced by Cultural Resources GIS
Cultural and Natural Resources Potentially Affected by Gulf Oil Spill
0 10 20 30 40 50 60 70 80 90 1005Miles
07 June Map 3
National Park Service
U.S. Department of the Interior
Cultural Resources GIS
WASO
MobileMobile-Tensaw
NNL
Pet it B oi s I.
Dauphin I.
PensacolaSanta Rosa I.
Bon SecourNWR
Theodore
(GUIS)
(GUIS)
Ft. Pickens
Ft. Barrancas Naval AirStationOrange
Beach
Ft. Morgan
Ft. Gaines
Sand Isl.Light
Middle BayLight
Mo
bi le
Ba
y Bon SecourBay
Grand BayNWR
GrandBay
NavarreEast Bay
Ft. PickensState Park
Aquatic PreserveGulf StatePark
Navarre BeachState Park
Background: http://services.arcgisonline.com/arcgis/services/World_Street_Map
Perdido Key
MAP APPROVED FOR GENERAL DISTRIBUTION
Fairhope
Milton
GulfShores
National Parks, Monuments, Seashores, Preserves (7)
NOAA Environmental Sensitivity Index (ESI) Area
National Wildlife Refuges (20)National Natural Landmarks (7)
National Register Properties (1,291)
National Historic Landmarks (13)
Federal Disaster ResponseStaging Areas (18)
Archived Potentially Beached Oil(Cumulative since 10 May)
07 June Oil Plume Forecast
Spill Density (NOAA)
Uncertainty
"Offshore"
Light
Medium
Heavy
Potentially Beached Oil 07 June
Gulf of Mexico
Destin
EGLINAIR FORCE BASE
Choctawatchie Bay
Topsail HillPreserve
State Park
MiramarBeach
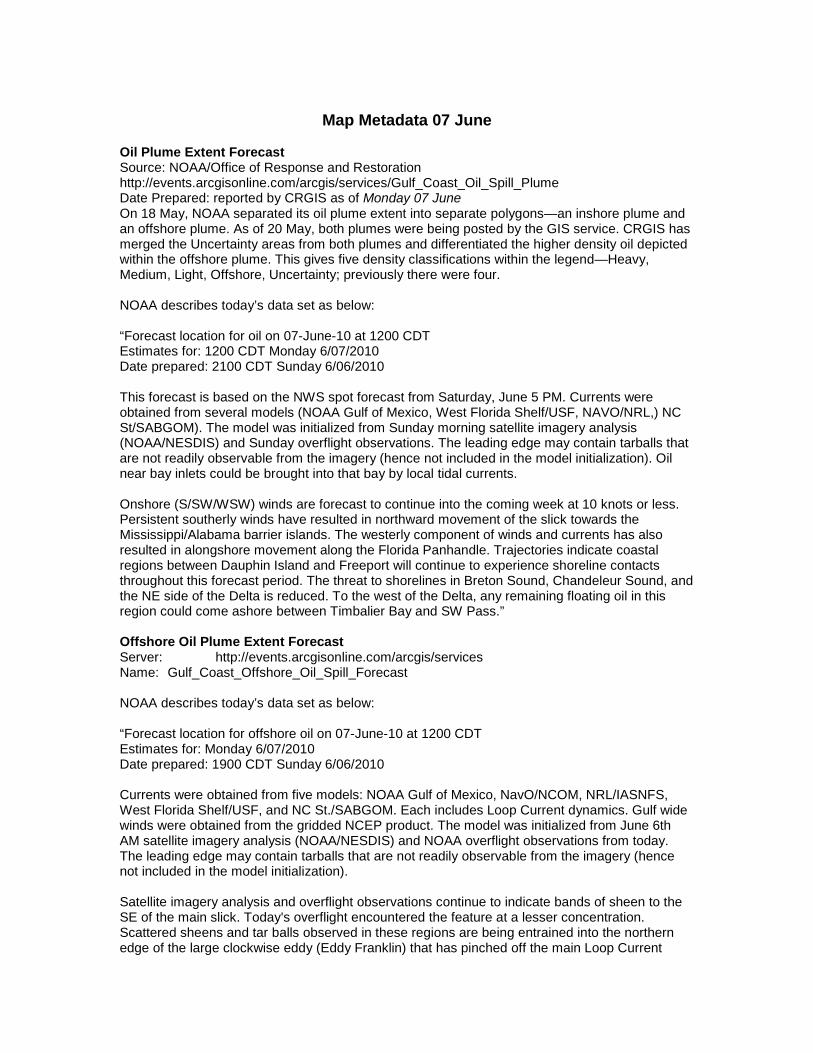
Map Metadata 07 June
Oil Plume Extent Forecast Source: NOAA/Office of Response and Restoration http://events.arcgisonline.com/arcgis/services/Gulf_Coast_Oil_Spill_Plume Date Prepared: reported by CRGIS as of Monday 07 June On 18 May, NOAA separated its oil plume extent into separate polygons—an inshore plume and an offshore plume. As of 20 May, both plumes were being posted by the GIS service. CRGIS has merged the Uncertainty areas from both plumes and differentiated the higher density oil depicted within the offshore plume. This gives five density classifications within the legend—Heavy, Medium, Light, Offshore, Uncertainty; previously there were four. NOAA describes today’s data set as below: “Forecast location for oil on 07-June-10 at 1200 CDT Estimates for: 1200 CDT Monday 6/07/2010 Date prepared: 2100 CDT Sunday 6/06/2010 This forecast is based on the NWS spot forecast from Saturday, June 5 PM. Currents were obtained from several models (NOAA Gulf of Mexico, West Florida Shelf/USF, NAVO/NRL,) NC St/SABGOM). The model was initialized from Sunday morning satellite imagery analysis (NOAA/NESDIS) and Sunday overflight observations. The leading edge may contain tarballs that are not readily observable from the imagery (hence not included in the model initialization). Oil near bay inlets could be brought into that bay by local tidal currents. Onshore (S/SW/WSW) winds are forecast to continue into the coming week at 10 knots or less. Persistent southerly winds have resulted in northward movement of the slick towards the Mississippi/Alabama barrier islands. The westerly component of winds and currents has also resulted in alongshore movement along the Florida Panhandle. Trajectories indicate coastal regions between Dauphin Island and Freeport will continue to experience shoreline contacts throughout this forecast period. The threat to shorelines in Breton Sound, Chandeleur Sound, and the NE side of the Delta is reduced. To the west of the Delta, any remaining floating oil in this region could come ashore between Timbalier Bay and SW Pass.” Offshore Oil Plume Extent Forecast Server: http://events.arcgisonline.com/arcgis/services Name: Gulf_Coast_Offshore_Oil_Spill_Forecast NOAA describes today’s data set as below: “Forecast location for offshore oil on 07-June-10 at 1200 CDT Estimates for: Monday 6/07/2010 Date prepared: 1900 CDT Sunday 6/06/2010 Currents were obtained from five models: NOAA Gulf of Mexico, NavO/NCOM, NRL/IASNFS, West Florida Shelf/USF, and NC St./SABGOM. Each includes Loop Current dynamics. Gulf wide winds were obtained from the gridded NCEP product. The model was initialized from June 6th AM satellite imagery analysis (NOAA/NESDIS) and NOAA overflight observations from today. The leading edge may contain tarballs that are not readily observable from the imagery (hence not included in the model initialization). Satellite imagery analysis and overflight observations continue to indicate bands of sheen to the SE of the main slick. Today's overflight encountered the feature at a lesser concentration. Scattered sheens and tar balls observed in these regions are being entrained into the northern edge of the large clockwise eddy (Eddy Franklin) that has pinched off the main Loop Current

(LC). Trajectories indicate that some of these sheens may continue southward along the eastern edge of Eddy Franklin, whereas some are being entrained into the counter-clockwise eddy to the NE of the main LC eddy. Further to the east, a second narrow band of semi-contiguous transparent sheens previously observed was not seen today. This feature may or may not be related to the BP spill.” Feder al Disaster Staging A reas Source: Obtained from Deepwater Horizon (M C252) --- Situation Status M ap Source Date: 5/19/2010 In addition to the UAC at Robert LA, and the ICP at Houma, LA, the staging areas are: Dauphin Island, Orange Beach, and Theodore AL; Panama City, Pensacola, Port St. Joe, and St. Marks, FL; Amelia, Cocodrie, Grand Isle, Shell Beach, Slidell, St. Mary, and Venice LA; Biloxi, Pascagoula, and Pass Christian, MS. National Historic Landmarks Source: National Register Information System, National Park Service Data is a subset of the National Register of Historic Places Source Date: 1966 to 5/7/2010 Restricted Data is retained for in-house maps and hidden for publically distributed maps. National Register Properties Source: National Register Information System, National Park Service Source Date: 1966 to 5/7/2010 Restricted Data is retained for in-house maps and hidden for publically distributed maps. National Natural Landmark s Source: National Natural Landmarks Program, National Park Service Source Date: 5/11/2010 National W ildlif e R ef uges Source: Derived f rom U.S. National A tlas Federal Lands Source Date: 2000 National Parks, Monuments, Seashores, Preserves Source: NPS GIS Data Store Source Date: 2/17/2010 Environmental Sensitivity Index Area The Environmental Sensitivity Index (ESI) map for the Gulf Coast has been developed by NOAA's Office of Response and Restoration. The purpose of the ESI is to identify sensitive resources that may be impacted as a result of an oil spill. NOAA has defined three types of sensitive resources: shoreline habitats, biological resources, and human use resources (including cultural resources). The Index map is an aggregation of 1:24000 USGS quadrangle boundaries covering areas within which these resource types are at risk. The National Park Service has used the ESI in conducting its own assessment of the potential impact of the Deep Horizon BP Oil Spill because the ESI Area map comes from an authoritative source (NOAA), it provides a consistent geographic framework for agencies to use in responding to the incident, and it allows a reasonable area to take into account the potential impacts of recovery e.g. staging areas, clean up infrastructure, access roads etc. on cultural resources.