Embed Size (px)
Citation preview
TOWARDS THE DEVELOPMENT OF A FFS TOOL FOR THE
INSPECTION OF CORROSION UNDER INSULATION
Yves Gunaltun1, Dyana Ambrose2, Patrick Hivert3 and Gary Penney4
. 1, 2 Mechanical Engineering, Gas Research Centre (GRC), Petroleum Institute, Abu Dhabi, UAE
3, 4 Pipeline Services, Abu Dhabi, UAE
ABSTRACT
Corrosion under insulation (CUI) is a major problem for industry. Extensive removal and reinstatement
of insulation for inspection is prohibitively costly. A non-destructive testing (NDT) tool which can
characterise areas of CUI damage in insulated piping and pipelines with minimal removal of insulation
is required. Sufficient data about the CUI is required to allow fitness-for-service (FFS) to be assessed.
Guided wave testing (LRUT) is a long range ultrasonic technique that was developed in the mid 1990’s
to provide the solution to CUI inspection of piping and pipelines. The technology, understanding and
application of LRUT has been continuously developed over the last 15 years, but is still a screening
technique which is currently unable to provide dimensions of CUI. Indications reported by LRUT must
thus be followed up using a second NDT technique to confirm and quantify CUI damage.
A project sponsored by the Petroleum Institute, Abu Dhabi, has been established to improve on
commercially available LRUT and develop a FFS tool to allow integrity management decisions to be
made from LRUT inspections.
In the first phase of the project, an independent evaluation of the performance of LRUT was performed,
in terms of probability of detection (POD) for the system and operators/analysts. A purpose built test
loop was constructed to be representative of real-world conditions, including metal loss defects
simulating CUI. Future phases will (i) evaluate and develop better understanding of key variables and
factors affecting the performance of LRUT, aiming at developing best practice guidance, and (ii)
develop a FFS tool based directly on LRUT data.
The results of the first phase are presented in this paper, with a number of interesting observations and
lessons learnt that can aid in improving the outcomes from LRUT for CUI and for piping and pipelines
in general.
Keywords: Corrosion under insulation, CUI; Long range UT; Guided wave testing; Carbon steel; Corrosion
Defects, fitness-for-service, FFS, probability of detection, POD, piping, pipelines.
BACKGROUND AND INTRODUCTION
Corrosion under Insulation (CUI) is recognized as a major corrosion problem, which costs
the oil & gas, chemical & petrochemical, and food processing industries millions of dollars
a year in inspection, repair and replacement costs. CUI can be detrimental to the integrity of
insulated pipelines, process pipework or vessels if not detected early, causing leaks leading
to possible catastrophic events.
The current capability of guided wave – known as guided wave testing or long range
ultrasonic testing (LRUT) – CUI detection equipment (without global removal of insulation)
is that they are only capable of screening for the presence of in-service corrosion and provide
insufficient information about defects for thorough assessment of continued fitness-for-
service (FFS). Further modifications are required to produce a CUI tool capable of providing
FFS output from LRUT technology. This paper describes a project sponsored by the
Petroleum Institute, Abu Dhabi, which is being performed to develop a cost effective solution
to the identification, quantification and assessment of CUI.
PROJECT PHASES
Phase 1 thoroughly and rigorously benchmarked the current state of the art by an independent
study to determine the Probability of Detection (POD) of the latest generation of LRUT
system for CUI applications. The Phase 1 scope was to design, construct and prepare a test
loop with defined defects to evaluate and test existing technology for detecting CUI. In Phase
2 it is proposed to develop a LRUT tool generating suitable inspection data for and to perform
FFS assessment of CUI in insulated pipe without extensive insulation removal. This paper
presents selected results and findings from the Phase 1 study that will be of interest to the
wider inspection and non-destructive testing (NDT) community.
OBJECTIVES
The objectives of the work were:
To perform a probability of detection (POD) experiment for detection of CUI using
LRUT on a specially designed and constructed test loop simulating a real-world situation.
To evaluate LRUT performance, probability of detection and false calls using data
collected on the test loop.
APPROACH
A test loop was designed and constructed to optimally evaluate the performance of LRUT
for detection and evaluation of CUI. Stage 1 experiments evaluated the effect of insulation,
repeatability of test data and defined the defect sizes for testing in Stage 2 experiments. In
Stage 2, multiple flaws simulating CUI were inserted in the test loop and LRUT data
collected from a number of test locations. The data was analysed by 9 experienced LRUT
Level 2 operators and the results analysed to determine the performance of the LRUT system.
CORROSION UNDER INSULATION
In order to work towards developing a tool to detect and quantify CUI, it was important to
understand the mechanism behind CUI, the types of CUI found in industry and how this can
be mitigated. A comprehensive study on the subject was thus performed. Key points relating
to CUI are summarised below.
The main critical factors contributing to CUI include:
1. Design of insulation system, insulation type, temperature, environment (humidity,
rainfall and chlorides from marine environment, industrial environments containing
high SO2).
2. Poor design and/or installations that allow water to become trapped.
3. Increasing metal temperature up to the point where the water evaporates quickly.
4. Metal temperatures between the boiling point 100°C and 121°C, where water is less
likely to vaporize and insulation stays wet longer.
5. Marine environments or areas where significant amounts of moisture may be present,
the upper temperature range where CUI may occur can be extended significantly
above 121°C.
6. Insulating materials that hold moisture (wick).
7. Cyclic thermal operation or intermittent service.
8. Equipment that operates below the water dew point tends to condense water on the
metal surface thus providing a wet environment.
9. Contaminants that may be leached out of the insulation or airborne contaminants that
exist in the environment such as chlorides (marine environments) or SO2 (stack
emissions).
The profile of defects simulating CUI (chosen to be representative of actual in-service CUI)
is described in a subsequent section.
DESIGN OF EXPERIMENT
General Experimental Approach
A trained and certified LRUT operator performed an initial trial, based on progressive
machining of the same flaw, designed to determine appropriate flaw sizes to satisfy the
criteria for the range of flaw sizes providing very low POD (not expected to be detected) to
very high POD (readily detectable).
Multiple artificial defects (metal loss flaws simulating CUI) were then made in the test loop
for inclusion in the POD trials. Spacings between defects were varied on a random basis
along the length of the circa 130m long test loop. The spacing could not be predictable for
the blind trials. This density of discontinuity distribution also allowed a number of the target
defects to be inspected from more than one location along the pipe. Industrial norms are cited
as in the region of 30 to 40 as being a sufficient number of flaws to generate a robust POD
study (Rummel, 1982) (Gandossi & Annis, 2010) (Annis & Gandossi, 2012) (Førli et al,
1998) (US Department of Defense, 2009). A sufficient number of defects were included in
this study.
Peak amplitudes were recorded in the LRUT software for each flaw (so they could be
evaluated relative to standard reporting thresholds). The intention was to establish response
versus size (‘a-hat vs. a’) relationships. This may be revisited in future studies, but the
challenge is that in guided wave testing multiple frequencies are used in collecting and
analysing data. Guided wave indications (flaws/defects) and features display different peak
amplitudes at different frequencies, which makes ‘a-hat vs. a’ analysis very difficult to
perform. Mostly reporting from the LRUT software is from a (often single) frequency
selected by the operator/interpreter. For a given sample size, the response versus size
approach generally yields a more accurate POD estimate, because more information is being
used (Berens & Hovey, 1985). Signal-to-noise (S/N) ratios can be estimated from the A-
scans recorded in the LRUT software.
The operators generated one set of results without the use of focussing. In future studies
another set of data may be considered following the selective use of focussing according to
standard procedures, resulting in separate PODs in each case.
Analysis of Essential and Influential Parameters
The influential and essential parameters were identified together with a justification for each.
This approach follows the guidelines detailed in MIL-HDBK-1823A (US Department of
Defense, 2009), but also take into account other guidelines (Førli et al, 1998) (Berens &
Hovey, 1985) (American Society of Mechanical Engineers, 2010) where appropriate which
include:
Parameters that are fixed (or lying within a defined range) during the POD trial.
Parameters to be varied (tested) during the trial and why these are important.
Nuisance (uncontrolled) parameters.
Procedure and equipment parameters were compiled and divided divided into 2 sets (ENIQ
Recommended Practice 1: Influential/essential Parameters, 2005):
Set 1: Parameters which particularly affect the outcome of the inspection taking into
account the selected values for the input essential parameters related to the component
and defects.
Set 2: Parameters which affect the outcome of the inspection but only if they differ by a
substantial margin from the values chosen for the trials.
Set 1 parameters are those that will require particular attention when assessing the relevance
of the trials data to a given inspection, using the current system (the portability of the POD
study).
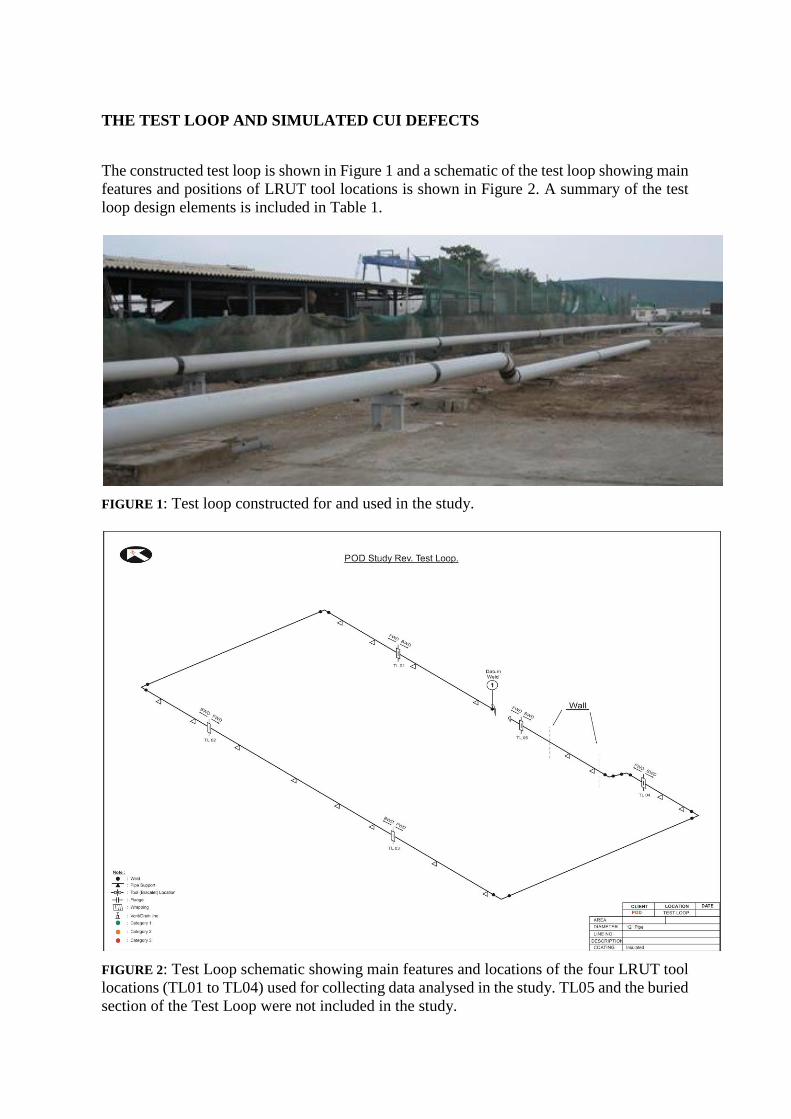
THE TEST LOOP AND SIMULATED CUI DEFECTS
The constructed test loop is shown in Figure 1 and a schematic of the test loop showing main
features and positions of LRUT tool locations is shown in Figure 2. A summary of the test
loop design elements is included in Table 1.
FIGURE 1: Test loop constructed for and used in the study.
FIGURE 2: Test Loop schematic showing main features and locations of the four LRUT tool
locations (TL01 to TL04) used for collecting data analysed in the study. TL05 and the buried
section of the Test Loop were not included in the study.
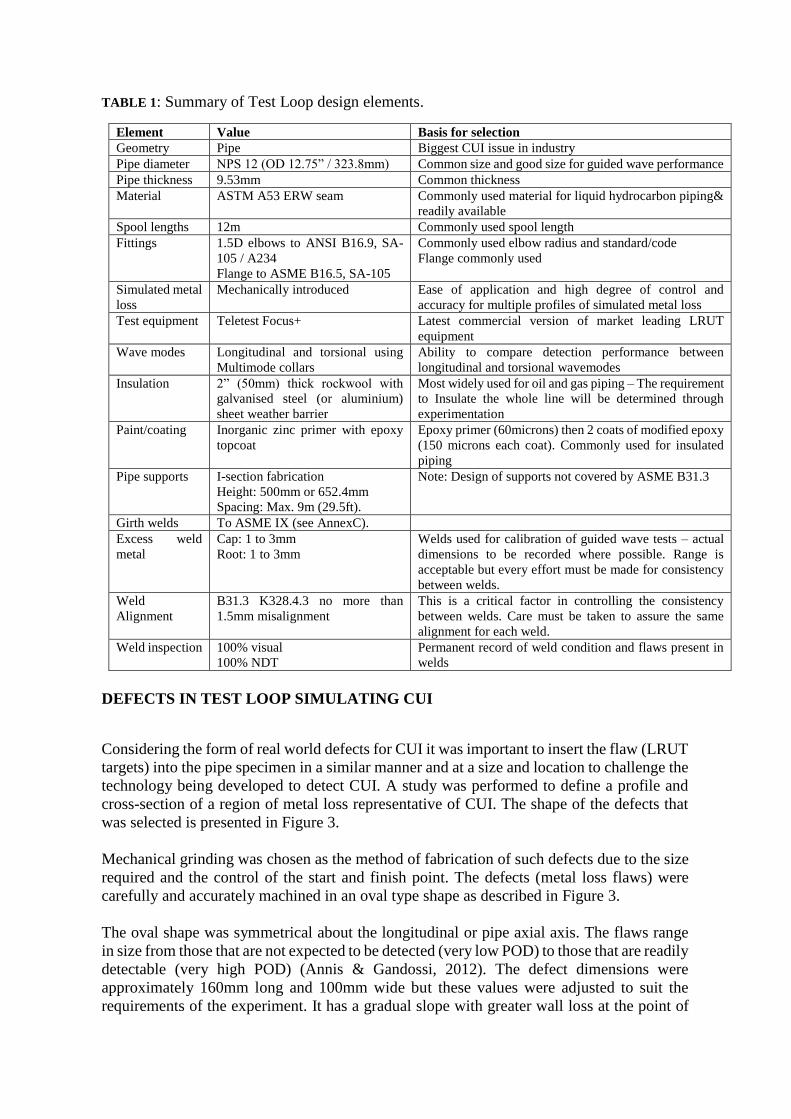
TABLE 1: Summary of Test Loop design elements.
DEFECTS IN TEST LOOP SIMULATING CUI
Considering the form of real world defects for CUI it was important to insert the flaw (LRUT
targets) into the pipe specimen in a similar manner and at a size and location to challenge the
technology being developed to detect CUI. A study was performed to define a profile and
cross-section of a region of metal loss representative of CUI. The shape of the defects that
was selected is presented in Figure 3.
Mechanical grinding was chosen as the method of fabrication of such defects due to the size
required and the control of the start and finish point. The defects (metal loss flaws) were
carefully and accurately machined in an oval type shape as described in Figure 3.
The oval shape was symmetrical about the longitudinal or pipe axial axis. The flaws range
in size from those that are not expected to be detected (very low POD) to those that are readily
detectable (very high POD) (Annis & Gandossi, 2012). The defect dimensions were
approximately 160mm long and 100mm wide but these values were adjusted to suit the
requirements of the experiment. It has a gradual slope with greater wall loss at the point of
Element Value Basis for selection
Geometry Pipe Biggest CUI issue in industry
Pipe diameter NPS 12 (OD 12.75” / 323.8mm) Common size and good size for guided wave performance
Pipe thickness 9.53mm Common thickness
Material ASTM A53 ERW seam Commonly used material for liquid hydrocarbon piping&
readily available
Spool lengths 12m Commonly used spool length
Fittings 1.5D elbows to ANSI B16.9, SA-
105 / A234
Flange to ASME B16.5, SA-105
Commonly used elbow radius and standard/code
Flange commonly used
Simulated metal
loss
Mechanically introduced Ease of application and high degree of control and
accuracy for multiple profiles of simulated metal loss
Test equipment Teletest Focus+ Latest commercial version of market leading LRUT
equipment
Wave modes Longitudinal and torsional using
Multimode collars
Ability to compare detection performance between
longitudinal and torsional wavemodes
Insulation 2” (50mm) thick rockwool with
galvanised steel (or aluminium)
sheet weather barrier
Most widely used for oil and gas piping – The requirement
to Insulate the whole line will be determined through
experimentation
Paint/coating Inorganic zinc primer with epoxy
topcoat
Epoxy primer (60microns) then 2 coats of modified epoxy
(150 microns each coat). Commonly used for insulated
piping
Pipe supports I-section fabrication
Height: 500mm or 652.4mm
Spacing: Max. 9m (29.5ft).
Note: Design of supports not covered by ASME B31.3
Girth welds To ASME IX (see AnnexC).
Excess weld
metal
Cap: 1 to 3mm
Root: 1 to 3mm
Welds used for calibration of guided wave tests – actual
dimensions to be recorded where possible. Range is
acceptable but every effort must be made for consistency
between welds.
Weld
Alignment
B31.3 K328.4.3 no more than
1.5mm misalignment
This is a critical factor in controlling the consistency
between welds. Care must be taken to assure the same
alignment for each weld.
Weld inspection 100% visual
100% NDT
Permanent record of weld condition and flaws present in
welds
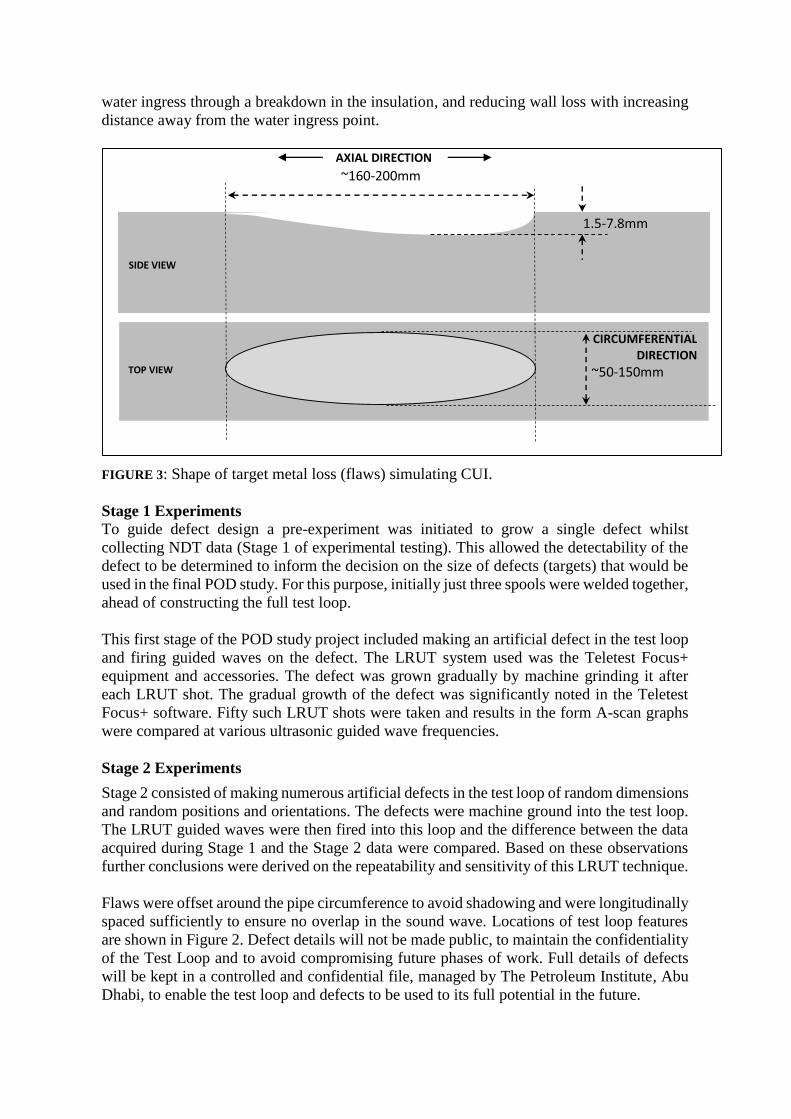
water ingress through a breakdown in the insulation, and reducing wall loss with increasing
distance away from the water ingress point.
FIGURE 3: Shape of target metal loss (flaws) simulating CUI.
Stage 1 Experiments
To guide defect design a pre-experiment was initiated to grow a single defect whilst
collecting NDT data (Stage 1 of experimental testing). This allowed the detectability of the
defect to be determined to inform the decision on the size of defects (targets) that would be
used in the final POD study. For this purpose, initially just three spools were welded together,
ahead of constructing the full test loop.
This first stage of the POD study project included making an artificial defect in the test loop
and firing guided waves on the defect. The LRUT system used was the Teletest Focus+
equipment and accessories. The defect was grown gradually by machine grinding it after
each LRUT shot. The gradual growth of the defect was significantly noted in the Teletest
Focus+ software. Fifty such LRUT shots were taken and results in the form A-scan graphs
were compared at various ultrasonic guided wave frequencies.
Stage 2 Experiments
Stage 2 consisted of making numerous artificial defects in the test loop of random dimensions
and random positions and orientations. The defects were machine ground into the test loop.
The LRUT guided waves were then fired into this loop and the difference between the data
acquired during Stage 1 and the Stage 2 data were compared. Based on these observations
further conclusions were derived on the repeatability and sensitivity of this LRUT technique.
Flaws were offset around the pipe circumference to avoid shadowing and were longitudinally
spaced sufficiently to ensure no overlap in the sound wave. Locations of test loop features
are shown in Figure 2. Defect details will not be made public, to maintain the confidentiality
of the Test Loop and to avoid compromising future phases of work. Full details of defects
will be kept in a controlled and confidential file, managed by The Petroleum Institute, Abu
Dhabi, to enable the test loop and defects to be used to its full potential in the future.
~160-200mm
~50-150mm TOP VIEW
SIDE VIEW
AXIAL DIRECTION
CIRCUMFERENTIAL DIRECTION
1.5-7.8mm
DATA COLLECTION AND INTERPRETATION
The Teletest Focus+ manufacturer’s standard guidance for principles of operation and
interpretation were provided to all operators providing interpretation reports. However,
initially, the results and reports supplied from the LRUT operators taking part in the study
were presented in too varied a way and were not based on the same (consistent) approach to
defining features and indications, and were thus not useful in analysing the performance of
the system or the LRUT operators. Subsequently, a clarification instruction sheet was issued
to all operators in the study and their reports were reissued in a more consistent format,
significantly aiding analysis and comparison.
RESULTS OF THE STUDY
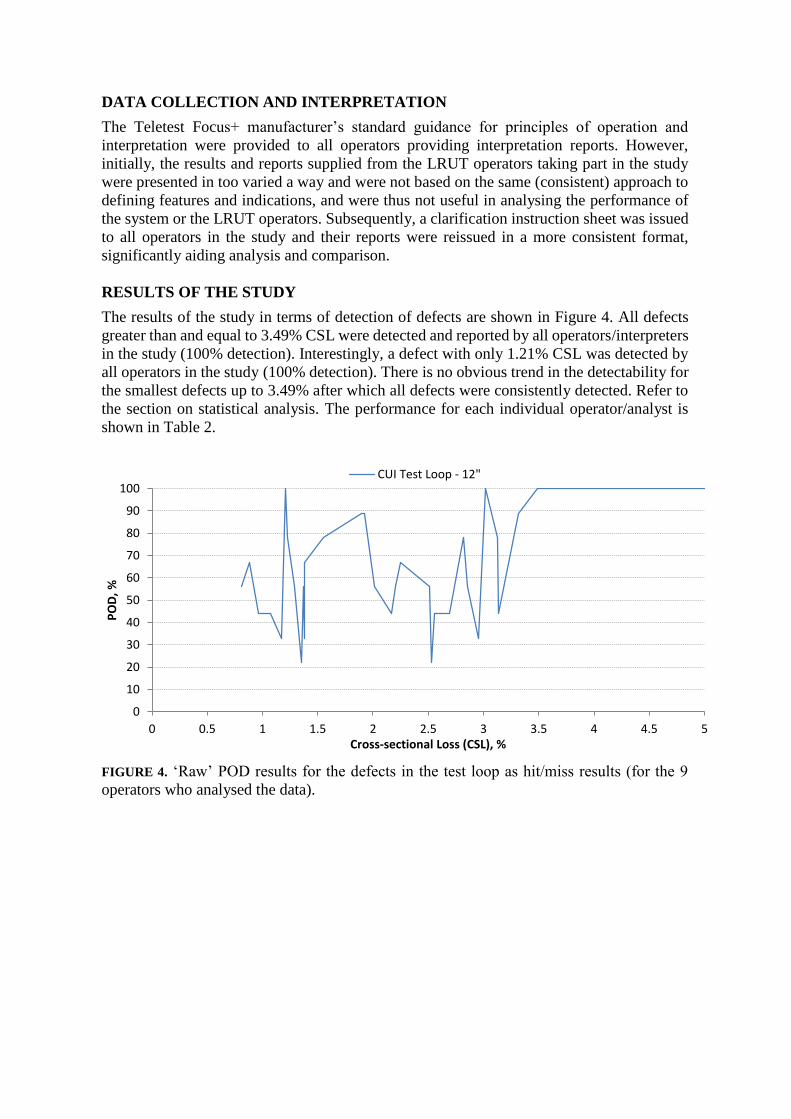
The results of the study in terms of detection of defects are shown in Figure 4. All defects
greater than and equal to 3.49% CSL were detected and reported by all operators/interpreters
in the study (100% detection). Interestingly, a defect with only 1.21% CSL was detected by
all operators in the study (100% detection). There is no obvious trend in the detectability for
the smallest defects up to 3.49% after which all defects were consistently detected. Refer to
the section on statistical analysis. The performance for each individual operator/analyst is
shown in Table 2.
FIGURE 4. ‘Raw’ POD results for the defects in the test loop as hit/miss results (for the 9
operators who analysed the data).
0
10
20
30
40
50
60
70
80
90
100
0 0.5 1 1.5 2 2.5 3 3.5 4 4.5 5
PO
D,
%
Cross-sectional Loss (CSL), %
CUI Test Loop - 12"
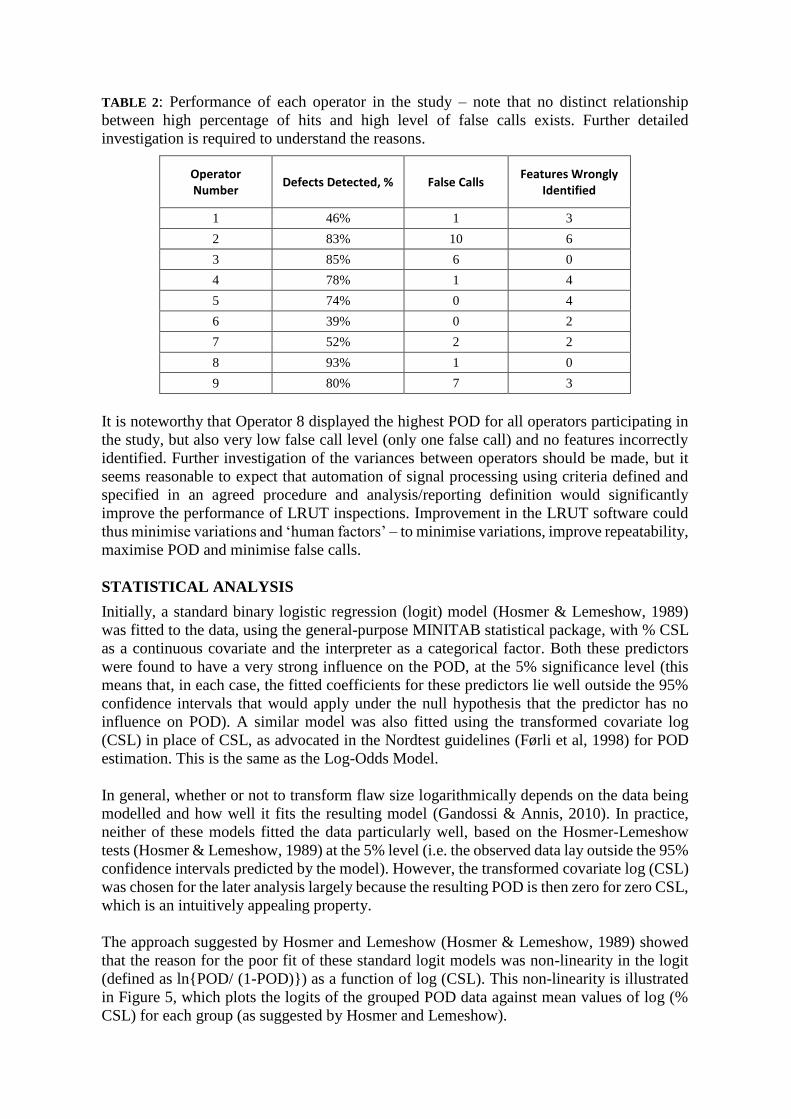
TABLE 2: Performance of each operator in the study – note that no distinct relationship
between high percentage of hits and high level of false calls exists. Further detailed
investigation is required to understand the reasons.
Operator Number
Defects Detected, % False Calls Features Wrongly
Identified
1 46% 1 3
2 83% 10 6
3 85% 6 0
4 78% 1 4
5 74% 0 4
6 39% 0 2
7 52% 2 2
8 93% 1 0
9 80% 7 3
It is noteworthy that Operator 8 displayed the highest POD for all operators participating in
the study, but also very low false call level (only one false call) and no features incorrectly
identified. Further investigation of the variances between operators should be made, but it
seems reasonable to expect that automation of signal processing using criteria defined and
specified in an agreed procedure and analysis/reporting definition would significantly
improve the performance of LRUT inspections. Improvement in the LRUT software could
thus minimise variations and ‘human factors’ – to minimise variations, improve repeatability,
maximise POD and minimise false calls.
STATISTICAL ANALYSIS
Initially, a standard binary logistic regression (logit) model (Hosmer & Lemeshow, 1989)
was fitted to the data, using the general-purpose MINITAB statistical package, with % CSL
as a continuous covariate and the interpreter as a categorical factor. Both these predictors
were found to have a very strong influence on the POD, at the 5% significance level (this
means that, in each case, the fitted coefficients for these predictors lie well outside the 95%
confidence intervals that would apply under the null hypothesis that the predictor has no
influence on POD). A similar model was also fitted using the transformed covariate log
(CSL) in place of CSL, as advocated in the Nordtest guidelines (Førli et al, 1998) for POD
estimation. This is the same as the Log-Odds Model.
In general, whether or not to transform flaw size logarithmically depends on the data being
modelled and how well it fits the resulting model (Gandossi & Annis, 2010). In practice,
neither of these models fitted the data particularly well, based on the Hosmer-Lemeshow
tests (Hosmer & Lemeshow, 1989) at the 5% level (i.e. the observed data lay outside the 95%
confidence intervals predicted by the model). However, the transformed covariate log (CSL)
was chosen for the later analysis largely because the resulting POD is then zero for zero CSL,
which is an intuitively appealing property.
The approach suggested by Hosmer and Lemeshow (Hosmer & Lemeshow, 1989) showed
that the reason for the poor fit of these standard logit models was non-linearity in the logit
(defined as ln{POD/ (1-POD)}) as a function of log (CSL). This non-linearity is illustrated
in Figure 5, which plots the logits of the grouped POD data against mean values of log (%
CSL) for each group (as suggested by Hosmer and Lemeshow).
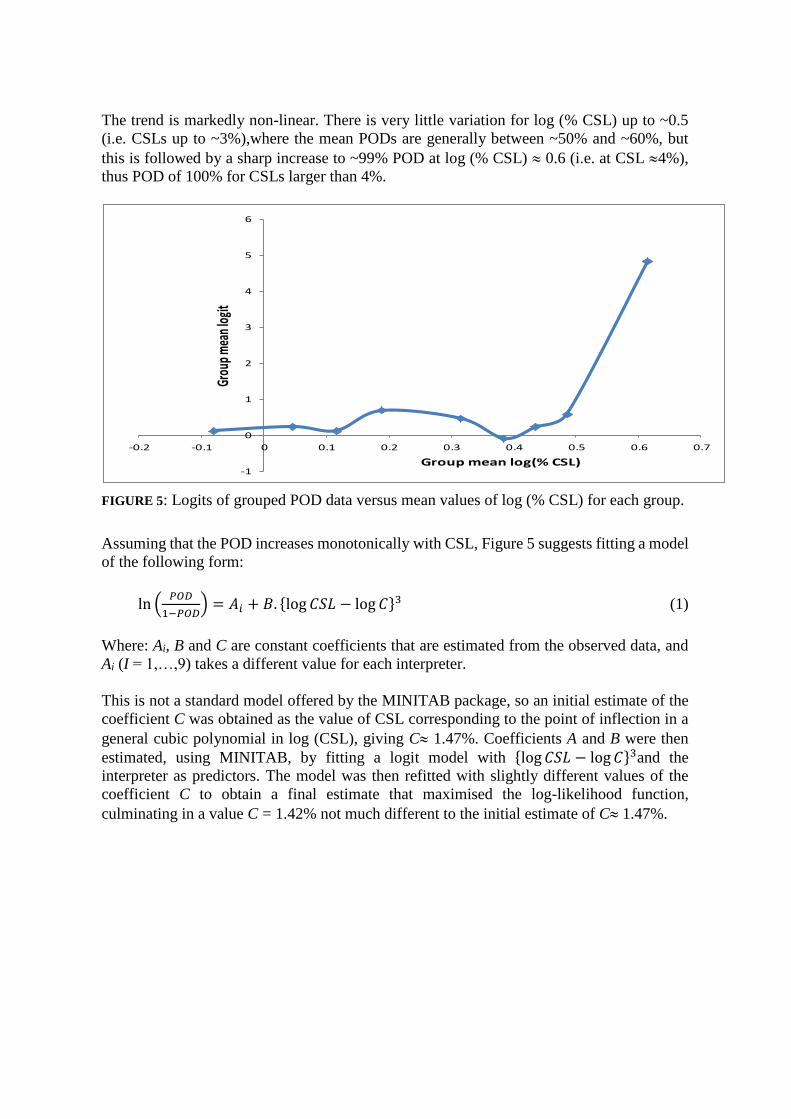
The trend is markedly non-linear. There is very little variation for log (% CSL) up to ~0.5
(i.e. CSLs up to ~3%),where the mean PODs are generally between ~50% and ~60%, but
this is followed by a sharp increase to ~99% POD at log (% CSL) 0.6 (i.e. at CSL 4%),
thus POD of 100% for CSLs larger than 4%.
FIGURE 5: Logits of grouped POD data versus mean values of log (% CSL) for each group.
Assuming that the POD increases monotonically with CSL, Figure 5 suggests fitting a model
of the following form:
ln (𝑃𝑂𝐷
1−𝑃𝑂𝐷) = 𝐴𝑖 + 𝐵. {log𝐶𝑆𝐿 − log 𝐶}3 (1)
Where: Ai, B and C are constant coefficients that are estimated from the observed data, and
Ai (I = 1,…,9) takes a different value for each interpreter.
This is not a standard model offered by the MINITAB package, so an initial estimate of the
coefficient C was obtained as the value of CSL corresponding to the point of inflection in a
general cubic polynomial in log (CSL), giving C 1.47%. Coefficients A and B were then
estimated, using MINITAB, by fitting a logit model with {log𝐶𝑆𝐿 − log 𝐶}3and the
interpreter as predictors. The model was then refitted with slightly different values of the
coefficient C to obtain a final estimate that maximised the log-likelihood function,
culminating in a value C = 1.42% not much different to the initial estimate of C 1.47%.
-1
0
1
2
3
4
5
6
-0.2 -0.1 0 0.1 0.2 0.3 0.4 0.5 0.6 0.7
Grou
p m
ean
logi
t
Group mean log(% CSL)
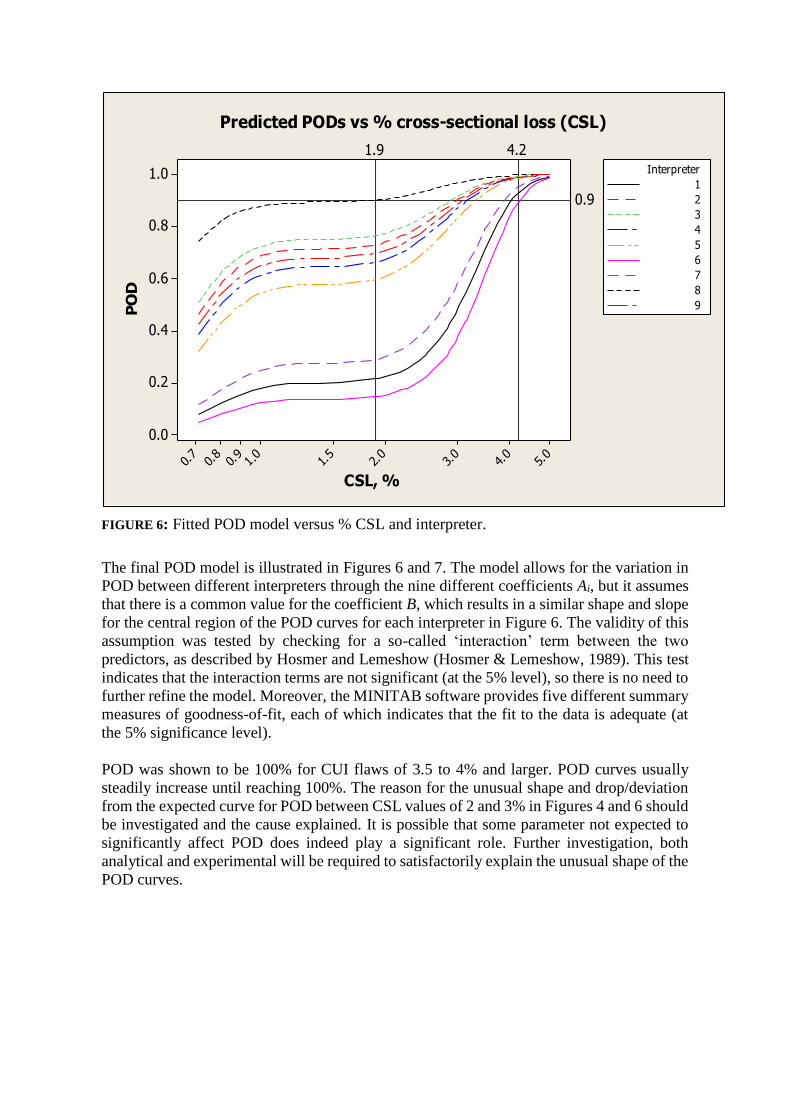
FIGURE 6: Fitted POD model versus % CSL and interpreter.
The final POD model is illustrated in Figures 6 and 7. The model allows for the variation in
POD between different interpreters through the nine different coefficients Ai, but it assumes
that there is a common value for the coefficient B, which results in a similar shape and slope
for the central region of the POD curves for each interpreter in Figure 6. The validity of this
assumption was tested by checking for a so-called ‘interaction’ term between the two
predictors, as described by Hosmer and Lemeshow (Hosmer & Lemeshow, 1989). This test
indicates that the interaction terms are not significant (at the 5% level), so there is no need to
further refine the model. Moreover, the MINITAB software provides five different summary
measures of goodness-of-fit, each of which indicates that the fit to the data is adequate (at
the 5% significance level).
POD was shown to be 100% for CUI flaws of 3.5 to 4% and larger. POD curves usually
steadily increase until reaching 100%. The reason for the unusual shape and drop/deviation
from the expected curve for POD between CSL values of 2 and 3% in Figures 4 and 6 should
be investigated and the cause explained. It is possible that some parameter not expected to
significantly affect POD does indeed play a significant role. Further investigation, both
analytical and experimental will be required to satisfactorily explain the unusual shape of the
POD curves.
CSL, %
PO
D
5.0
4.0
3.0
2.0
1.5
1.0
0.9
0.8
0.7
1.0
0.8
0.6
0.4
0.2
0.0
0.9
4.21.9
Interpreter
5
6
7
8
9
1
2
3
4
Predicted PODs vs % cross-sectional loss (CSL)
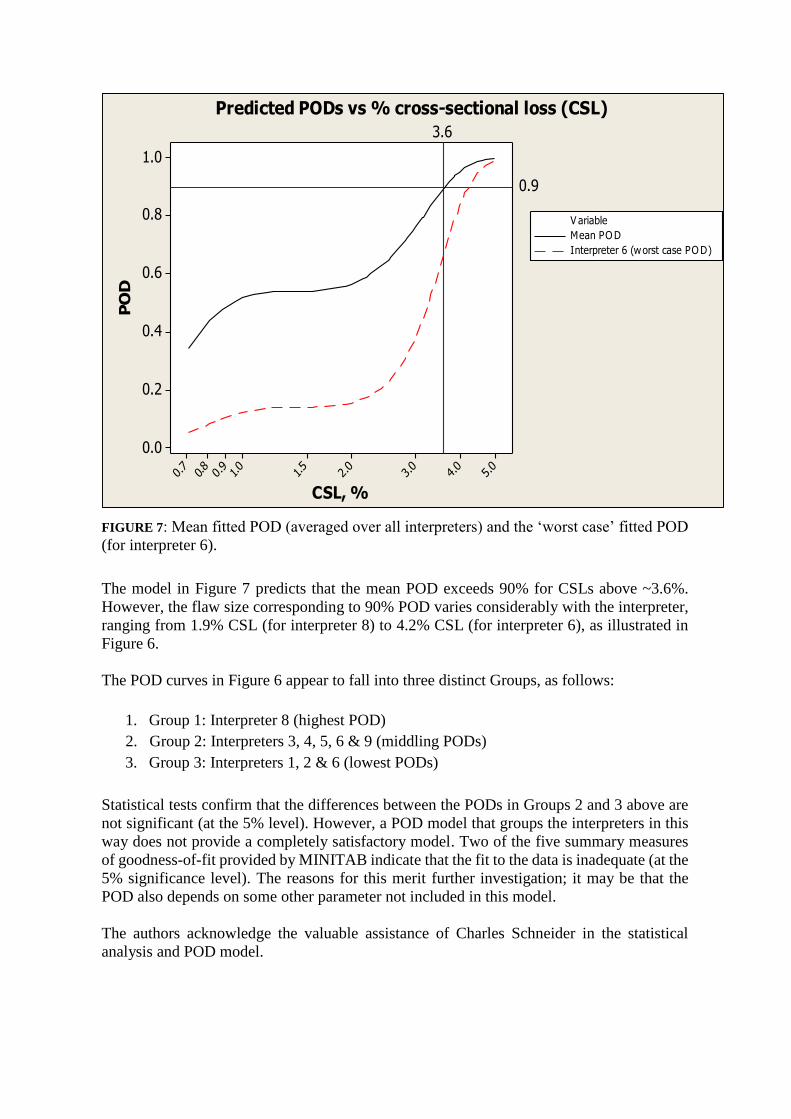
FIGURE 7: Mean fitted POD (averaged over all interpreters) and the ‘worst case’ fitted POD
(for interpreter 6).
The model in Figure 7 predicts that the mean POD exceeds 90% for CSLs above ~3.6%.
However, the flaw size corresponding to 90% POD varies considerably with the interpreter,
ranging from 1.9% CSL (for interpreter 8) to 4.2% CSL (for interpreter 6), as illustrated in
Figure 6.
The POD curves in Figure 6 appear to fall into three distinct Groups, as follows:
1. Group 1: Interpreter 8 (highest POD)
2. Group 2: Interpreters 3, 4, 5, 6 & 9 (middling PODs)
3. Group 3: Interpreters 1, 2 & 6 (lowest PODs)
Statistical tests confirm that the differences between the PODs in Groups 2 and 3 above are
not significant (at the 5% level). However, a POD model that groups the interpreters in this
way does not provide a completely satisfactory model. Two of the five summary measures
of goodness-of-fit provided by MINITAB indicate that the fit to the data is inadequate (at the
5% significance level). The reasons for this merit further investigation; it may be that the
POD also depends on some other parameter not included in this model.
The authors acknowledge the valuable assistance of Charles Schneider in the statistical
analysis and POD model.
CSL, %
PO
D
5.0
4.0
3.0
2.0
1.5
1.0
0.9
0.8
0.7
1.0
0.8
0.6
0.4
0.2
0.0
3.6
0.9
V ariable
Mean PO D
Interpreter 6 (worst case PO D)
Predicted PODs vs % cross-sectional loss (CSL)
CONFIDENT LIMITS
Appendix II of the Nordtest guidelines (Førli et al, 1998) gives formulae for confidence limits
on the POD in the simple case of a univariate linear model, but these formulae are not directly
applicable to the model illustrated in Figure 6. The MINITAB software provides confidence
limits for ordinary linear regression (e.g. ậ vs a analysis), but not for logistic regression
(hit/miss data). As a long term aim, use of amplitude data will be considered to estimate
robust confidence limits for the PODs as part of future work programmes.
The main source of variability in the POD model is the interpreter (as illustrated in Figure
6). It is unclear from the hit/miss data alone what parametric distribution (if any) could be
used to model the observed variability with the interpreter. However, it is possible to quantify
the variability in the POD with interpreter to a certain extent by treating the ‘worst case’ POD
in Figure 7 (for Interpreter 6) as a non-parametric tolerance limit on this variability (Owen,
1962), e.g. ~93% of interpreters are expected to have a better POD than Interpreter 6 with
50% confidence. Thus, the POD for Interpreter 6 provides a central estimate of the lower
93% confidence limit on the variability and, in this sense, 4.2% CSL provides an estimate of
the flaw size above which the POD exceeds 90% with 93% confidence. While this is a non-
standard approach, it does provide a provisional estimate of uncertainty in the predicted POD.
INFLUENCE OF SOUND VELOCITY ON PERFORMANCE
Factor potentially causing variability and/or errors in performance: Sound velocity value
used in the software not matching actual value on the test pipe.
The value for sound velocity used in the calculation of axial positions of features is set
automatically in the LRUT software. In cases where the actual value is different to that
assumed by the software, it is not easy to manually override the software-selected value.
In the current study, the pipe wall temperature was higher during the data collection exercise
than the temperature assumed in the LRUT software, with a resultant discrepancy in the
reported positions for features (axial distance). For example, the test loop surface temperature
on 29 June 2014 at 13:15 was 59.7°C.
Incorrect recording of the distance (axial location along length of the line) of ‘calls’ is critical
for follow-up quantitative NDT. If the distance reported by LRUT is too inaccurate, the
chances of the follow-up NDT finding the feature are negligible (depending on access to the
line). Additionally, when the software is reporting a feature at a particular axial location and
the analyser is aware of a feature such as a pipe support that is actually at this distance
(physically measured) it is easy for the analyser to misreport the feature (in this case as a pipe
support indication). This is bad for the reputation of the technology and obviously bad for
assuring the integrity of the line if existent flaws are not able to be identified, measured and
managed.
KEY FINDINGS FROM THE STUDY
The following are the key findings from the experimental and analytical work performed on
the project:
1. Metal loss with cross-sectional loss (CSL) ≥3.5% was detected consistently by every
operator/interpreter in the study (100% detection). Estimation of POD using statistical
methods reported a worse case POD of >90% with 93% confidence limits for CSL
>4.2%. This is an improvement on results of previous published studies (Technical
Software Consultants Limited, 2001) (HOIS2000).
2. Variability and scatter in analysis results were observed for defects with CSL <3.5%. For
current inspections, where CSL ≥3.5% is acceptable, LRUT can be used with confidence
(if good practice is followed). 3.5% CSL is below the value currently considered to be
the lower threshold for commercially deployed LRUT. Lowering the limit for 100% POD
in terms of CSL <3.5% will require further development.
3. Interestingly, a defect with CSL = 1.21% (2.52mm deep in the 9.5mm wall thickness)
was detected by all nine LRUT operators/analysts participating in the study (i.e. 100%
detection). This is significantly below the minimum size capability claimed by LRUT
equipment manufacturers. The reason for this is not understood and will require further
investigation.
4. The repeatability of LRUT data from multiple tests (data collection) from the same
location was very good.
5. No detectable effect of insulation on the LRUT data collected and hence the test loop was
uninsulated for the testing programme.
6. No noticeable impact on performance of identifying defects around the bends was
observed.
7. Consistent reporting of flaws and features is dependent on well prepared technique sheets
and specification of reporting (‘call’) levels for indications on A-scans, with these being
followed.
8. Variability in reported analysis results requires further investigation to understand the
causes. Variability can come from different approaches to interpreting LRUT data by
different operators. This study highlighted the importance of having suitably detailed and
robust procedures and technique sheets for LRUT to minimise variations and errors from
interpretation and reporting thresholds between operators. This is an area that could be
addressed within formal training of LRUT operators; e.g. the CSWIP training and
certification programme for LRUT Levels 1 to 3 (CSWIP - TWI Certification Ltd, 2011).
The potential to increase automated data analysis in LRUT software and modify methods
of collecting and presenting raw data should be explored – aiming at reducing variability
between LRUT operators.
9. Pipe wall temperature had an effect on the sound velocity and thus estimation of axial
location of features and defects. Pipe metal temperature affects the velocities of the
guided wave acoustic pulses and hence uncorrected variations in actual and predicted
values result in errors in distance measurements. The data from each operator in this study
was corrected for the variation in sound velocity, so did not affect the results of this study,
but if not corrected, this would have a significant effect on results of real world
inspections.
10. A number of factors and variables were identified to affect LRUT results, such as
variations in pipe temperature described above. These require further investigation to be
understood and quantified, and where necessary improved on or their effect minimised.
CLOSING REMARKS
Highly useful insights and findings were made which could allow improved performance of
LRUT inspections. The constructed test loop in Abu Dhabi is a unique and highly valuable
facility for further research & development, and for training of LRUT operators. The study
identified a number of development areas that will allow LRUT to be deployed with
increased confidence and performance. Improved understanding of variables and factors
affecting the results of LRUT inspections, leading to improved ability to predict extent of
CUI directly from LRUT data, is required to provide data for FFS assessments. The potential
for further development is considered highly encouraging and the second phase of the
project, concerning the development of a Fitness For Service Tool is currently ongoing.
REFERENCES
1. American Society of Mechanical Engineers. Boiler and pressure vessel code, Section V -
Nondestructive examination, Article 14 - Examination system qualification. ASME,
(2010).
2. Annis C. & Gandossi L, Influence of sample size and other factors on hit/miss probability
of detection curves, ENIQ Report No. 47, JRC, Petten, EUR 25200 EN . Publications Office
of the European Union, (2012 January).
3. Berens A. P. & Hovey P. W, The sample size and flaw size effects in NDI reliability
experiments. (D. O. Thompson & D. E. Chimenti Eds.) Review of Progress in Quantitative
NDE , 4, 1327-1334, (1985).
4. CSWIP - TWI Certification Ltd. Requirements for the Certification of Personnel Engaged
in Non-Destructive Testing in Accordance with the Requirements of EN 473 and ISO 9712
APPENDIX 1 Examinations PART 11: Long Range Ultrasonic Inspector, Levels 1, 2 and
3, 2nd Edition, TWI Certification Ltd, (2011).
5. ENIQ Recommended Practice 1: Influential/essential Parameters, European Network for
Inspection and Qualification (ENIQ) Report No. 24 (2). Publications Office of the European
Union, (2005 June).
6. Førli O. & Al E. Guidelines for NDE reliability determination and description. Nordtest
NT TECHN Report No. 394 . Nordtest, (1998 April).
7. Gandossi L. & Annis C. Probability of detection curves: statistical best practices. ENIQ
Report No. JRC EUR 24429 EN. Publications Office of the EU, (2010 November).
8. Georgiou G. A, PoD Curves, their derivation, application and limitations. Insight, 49 (7),
409-413, (2007).
9. HOIS2000. Corrosion Reliability Inspection Scheduling - CRIS. HOIS2000.
10. Hosmer D. W. & Lemeshow S, Applied logistic regression. New York: John Wiley &
Sons, (1989).
11. Owen D. B, Handbook of statistical tables. 317. Reading, Massachusetts: Addison-
Wesley, (1962).
12. Rummel W. D. Recommended practice for a demonstration of non-destructive evaluation
(NDE) reliability on aircraft production parts, Materials Evaluation, 40, (1982).
13. Technical Software Consultants Limited, Reliability assessment for containers of
hazardous material RACH. Health & safety Executive, (2001).
14. US Department of Defense, Non-destructive evaluation system reliability assessment.
Philadelphia, PA, United States of America: Standardization Order Desk, Building 4D, 700
Roberts Avenue, (2009).