Embed Size (px)
Citation preview

CUES: Cognitive Usability Evaluation System Matthew Pike
Department of Computer Science Swansea University, UK
Max L. Wilson Mixed Reality Lab
University of Nottingham, UK [email protected]
Anna Divoli & Alyona Medelyan Pingar Research
[email protected] [email protected]
ABSTRACT A Cognitive Usability Evaluation System, CUES, was constructed to allow the simple integration of cognitive data from a commercialized EEG brain scanner, with other common usability measures, such as interaction logs, screen capture, and think aloud. CUES was iteratively evaluated with a small number of participants to understand whether and how the visualisation of EEG data alongside other measures, provided value for usability evaluation. Results indicate that although there are a lot of objective measurements available from the brain scanner, the largest value came from qualitatively identifying EEG patterns, and correlating them with think aloud data. Recommendations for using CUES and for future developments are both provided.
Categories and Subject Descriptors H5.2. Information interfaces and presentation (User Interfaces): evaluation/methodology, screen design.
Keywords Information Seeking, Cognitive Load Theory, EEG, Usability
1. INTRODUCTION Evaluation of user interfaces is typically restricted by what can be observed in specifically designed experimental environments or through fieldwork. Aside from objective measures like time to complete a task, researchers use questionnaires, interviews, think-aloud protocols, and subjective observations to determine how satisfied or frustrated the users are with a particular interface. In some way, mouse movements, eye-tracking patterns, or differences in heart rate can indicate emotional state of the subject, but arguably, looking at the brain activity directly would be more effective and accurate. Different neuro-imaging devices and electromagnetic brain scanners have been recently introduced as tools that can assist interface evaluation [1, 5] and they were found to be accurate [2, 3]. In 2011, Wilson argued that brain scanning devices might be useful for evaluating search user interfaces and their impact on a user’s cognitive load [6]. In this paper, we introduce the Cognitive Usability Evaluation System, or CUES, as a universal tool to integrate cognitive EEG data with other standard usability measurements. CUES can be used to run studies with multiple participants and capture various data that may assist researchers in performing the evaluation. CUES is designed to capture brain activity, as returned by an off-the shelf EEG-device Emotiv EPOC1. In addition, CUES visualizes the captured outputs as shown in Figure 1, such as mouse movements (callout #2), audio (#3), and EEG data (#5).
To our knowledge, CUES is the first usability evaluation system that features a brain scanning device as an integral part. However, others have reported experimental results of using alternative
devices for measuring brain activity as users perform specific tasks. Kitamura et al used fMRI outputs to show that after repeating the task of learning how to use chopsticks the neural activity patterns indeed indicate learning [2]. Cernea et al [1] used the same EEG-device as the one used in CUES, the EPOC1. Their goal was to evaluate EPOC’s accuracy as it predicts users’ facial expressions (smiling, blinking) and their emotional state (calmness, excitement, engagement, frustration). Cernea et al found that EPOC’s predictions are accurate in 70% to 100% cases, with the exception of excitement but concluded that it may be a hard to define excitement as an intrinsically mental activity. Vi and Subramanian [5] were able to accurately detect confusion created by user interface design using the EPOC. Despite providing difficult to use, and often noisy data, these overall positive experiences of using brain scanners as research tools, as well as the lack of functioning systems for running user studies, have motivated us to build CUES. The following sections describe CUES and provide a formative study of the value provided by the EEG data.
Figure 1: A screenshot of the CUES Visualiser.
2. CUES CUES is a collection of applications that allows researchers to manage, automate and visualise user studies, as described below.
2.1 Study Setup and Recording CUES provides an intuitive interface for managing study related data, including: participant details, study tasks, study conditions and the data sources to capture during a study. CUES’ study setup component provides a range of settings for managing participants in different study conditions. Having configured the study, it can then be “run” within CUES. CUES is designed to capture interactions between participants and web pages. To facilitate this, CUES provides a simple customised web browser, which to a participant appears indifferent from their everyday browser. In the background, however, the browser is capturing: audio, brain data, screenshots, mouse trails, and JavaScript based web events. Audio is captured from the machines input device (e.g. Microphone). Brain data is acquired from the Emotiv EPOC 1 http://www.emotiv.com/
Presented at EuroHCIR2012. Copyright © 2012 for the individual papers by the papers' authors. Copying permitted only for private and academic purposes. This volume is published and copyrighted by its editors.

device. As well as providing the raw Electroencephalography (EEG) signal, CUES collects the EPOC’s pre-classified emotions (Engagement, Excitement, Frustration, etc.) and facial features (Smile Extent, Frown Extent, etc.). Screenshots of the webpage, as seen by the user, are captured at specified intervals, with a full-page capture occurring upon each page load. Finally, JavaScript web events are captured via a custom JavaScript library that is injected into each page by the browser. These events allow CUES to capture user interactions with the web page such as button clicks, highlighted text, data entry etc. All captured data is stored in a suitable, open format (Audio: wav, Screenshots: JPEG, Other: XML) allowing the data to be analysed using other software as well as the Visualiser (described below).
2.2 Visualising the Study The Visualiser, shown in Figure 1, provides a way of correlating various types of data in a time series. CUES also offers options to customize of the visualisations, such as choosing which brain data and/or web events to include on the timelines. Further, and perhaps most importantly, the evaluator can stack multiple records on top of each other for comparison, allowing them to compare, for example, one participant’s performance on multiple tasks, or several participants’ performance on a certain task. A hierarchical tree (#1) is provided for browsing the available recordings, which is ordered by study tasks, conditions and participants. Once selected, each recording is opened within its own tab (#2). Every visualisation within a single recording is linked to the audio waveform display (#3). The waveform visualises the audio captured during the study, and optionally has the ability to be played with sound or muted (useful when comparing many recordings at once).
Brain data are plotted on a 2D graph (#4), and emotions can be selectively added to the graph via the emotion selector (#5). Additionally, web events (such as page loads, mouse overs and mouse clicks) can be selectively added to the graph (#4) through the event selector (#6). Each event is added at the bottom of the chart at the point in time that the event occurred. Hovering over the event’s box on the chart gives additional event details (#7).
Finally, there are additional visualisations that utilise the captured screenshots and mouse data. A researcher may select their desired visualisation from the tab component (#8). In Figure 1, we see that the participant’s view of the web page at time X is overlaid with their recent mouse trail (#9). Other visualisations include a heat map of the cursor position, trail location on the entire page, the entire page by itself, and the visible region view.
3. FORMATIVE EVALUATION OF CUES To study the utility of the brain data we adapted the RITE method [4] to iteratively make changes to the methodology as we learned about CUES’ capabilities. This process involved reflecting on the utility and value of the data captured after each participant, and trialling alternative configurations, such as: capturing facial expressions with the camera, turning off features, separating or joining the recording of subtasks to find the right level for analysis, and so on. This process allowed us to examine and contrast recommendations for using and improving CUES.
3.1 Procedure and Participants To create a scenario within which to trial CUES, tasks were designed to evaluate the design of 4 very different taxonomy interfaces: Yippy, CarrotSearch, MeSH, and ESD. Taxonomies like these are a common form of Search User Interface feature. The first two of these systems present automatically generated categorisations of web search results, yet Carrot provides users
with alternative visualizations. The last two allow users to browse carefully designed taxonomies aiming at more expert audience. MeSH in particular, is highly specialized and is used mostly for automatic indexing tasks. This variation ensured different reactions from the participants. We chose this particular scenario, as it aligned with our other interests. Our findings about these taxonomy interfaces will be presented in a separate future paper.
Six digital economy graduate students with different backgrounds, including graphical design, geography, and economics, were recruited to take part in the study. Gender was balanced, and age ranged between 22 and 45. Participation involved: 1) consent form (approved by the institution’s ethics committee) and setup of the EPOC Emotive EEG scanner, 2) Phase 1: non-interactive brain response to systems’ designs, 3) Phase 2: content-agnostic exploration of the systems, 4) Phase 3: applied exploration of the systems, and 5) a final debriefing interview. The applied Phase-3 involved participants searching for content relating to their current research, whereas Phase 2 always began with the initial query: ‘Schools’. Participation took 1 hour, where participants were allowed to take breaks from wearing the Emotiv if needed. Participants were given an Amazon voucher for their time.
3.2 Quantitative Analysis In analysing the system, we first found that certain outputs from the EPOC had more value than others. Frustration, Short Term Excitement (STE), and Engagement were the three emotions that showed most variance during interaction. While Meditation showed almost no variation at any point in the study, Long Term Excitement (LTE) showed some usable variation for recordings of 10 minutes or longer. These were infrequent in the study, and so our analysis focused on Frustration, STE and Engagement.
Although apparently a form of objective measurement, analysing EEG data does not lend itself comfortably to summarisation or statistical comparison. As can be seen in Figure 1, the data varies dramatically throughout a task phase. One may hypothesise that average emotive values would help find the “most exciting” or the “most frustrating” system. However, as can be seen in Figure 3, participation averages tend to approximate with each other as they go through a number of peaks and troughs. Further, from the very first interaction with the system, participation diverges. This divergence in behaviour means that the data at t=20s for one user is based on a completely different interaction for another participant. Consequently, to make a standard comparison, we must take a common event and examine the corresponding data. In our study, this was most obviously represented by Phase 1, in which all participants were shown every UI one at a time, creating data that could be compared both within and between participants.
To further investigate the types of analyses that the CUES Visualiser could support in future developments, we performed some manual analyses of the example data, shown in Figures 2-4. Statistical Analyses. Figure 2 summarizes the average responses for frustration and STE for three of the participants (p3, p4 and p6). The comparison shows that different systems create varying initial and delayed emotions. MeSH and ESD, for example, create initial peaks of frustration, but drop lower after 20s, while Yippy creates a form of frustration that peaks later. It is possible to take some statistics, with the peak of STE for MeSH being almost significantly highest at t=11s (F(2)=6.47, p=0.056). Summarising Data. Figure 3 shows graphs from Phase 2 that compare results from different participants for the same system. We should note that there is some data capture issues in places. The engagement data for participants p4 and p5, for example, are
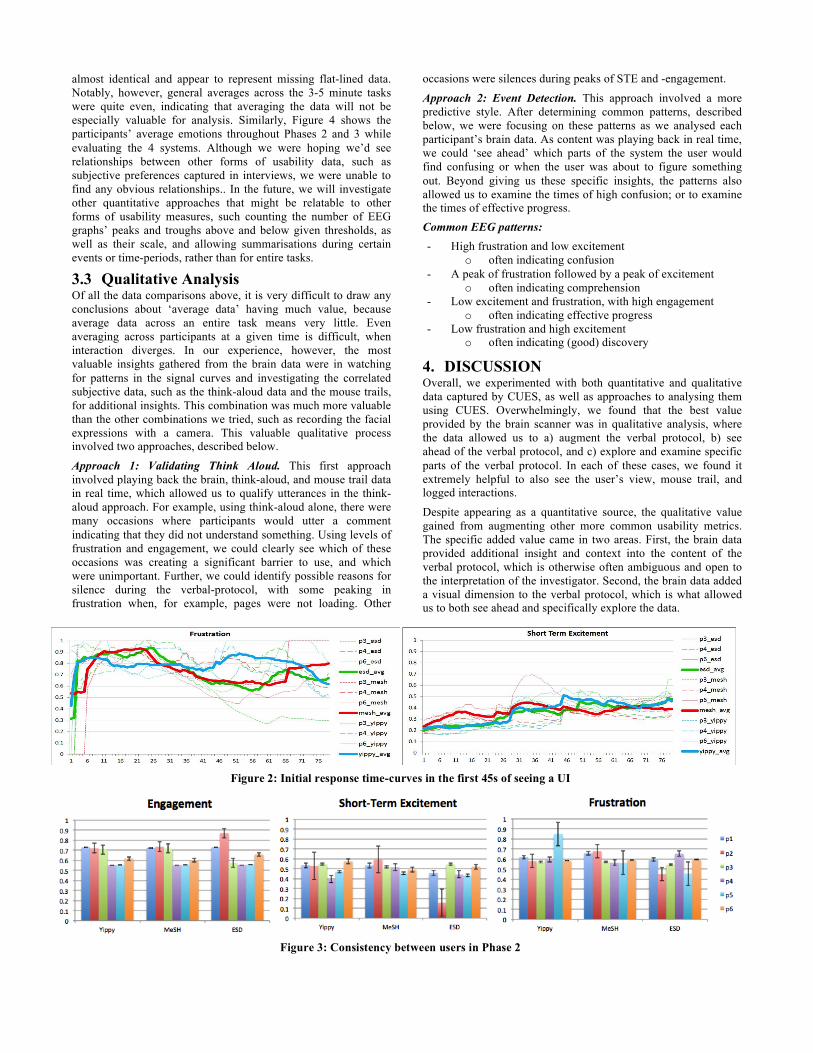
almost identical and appear to represent missing flat-lined data. Notably, however, general averages across the 3-5 minute tasks were quite even, indicating that averaging the data will not be especially valuable for analysis. Similarly, Figure 4 shows the participants’ average emotions throughout Phases 2 and 3 while evaluating the 4 systems. Although we were hoping we’d see relationships between other forms of usability data, such as subjective preferences captured in interviews, we were unable to find any obvious relationships.. In the future, we will investigate other quantitative approaches that might be relatable to other forms of usability measures, such counting the number of EEG graphs’ peaks and troughs above and below given thresholds, as well as their scale, and allowing summarisations during certain events or time-periods, rather than for entire tasks.
3.3 Qualitative Analysis Of all the data comparisons above, it is very difficult to draw any conclusions about ‘average data’ having much value, because average data across an entire task means very little. Even averaging across participants at a given time is difficult, when interaction diverges. In our experience, however, the most valuable insights gathered from the brain data were in watching for patterns in the signal curves and investigating the correlated subjective data, such as the think-aloud data and the mouse trails, for additional insights. This combination was much more valuable than the other combinations we tried, such as recording the facial expressions with a camera. This valuable qualitative process involved two approaches, described below.
Approach 1: Validating Think Aloud. This first approach involved playing back the brain, think-aloud, and mouse trail data in real time, which allowed us to qualify utterances in the think-aloud approach. For example, using think-aloud alone, there were many occasions where participants would utter a comment indicating that they did not understand something. Using levels of frustration and engagement, we could clearly see which of these occasions was creating a significant barrier to use, and which were unimportant. Further, we could identify possible reasons for silence during the verbal-protocol, with some peaking in frustration when, for example, pages were not loading. Other
occasions were silences during peaks of STE and -engagement.
Approach 2: Event Detection. This approach involved a more predictive style. After determining common patterns, described below, we were focusing on these patterns as we analysed each participant’s brain data. As content was playing back in real time, we could ‘see ahead’ which parts of the system the user would find confusing or when the user was about to figure something out. Beyond giving us these specific insights, the patterns also allowed us to examine the times of high confusion; or to examine the times of effective progress. Common EEG patterns: - High frustration and low excitement
o often indicating confusion - A peak of frustration followed by a peak of excitement
o often indicating comprehension - Low excitement and frustration, with high engagement
o often indicating effective progress - Low frustration and high excitement
o often indicating (good) discovery
4. DISCUSSION Overall, we experimented with both quantitative and qualitative data captured by CUES, as well as approaches to analysing them using CUES. Overwhelmingly, we found that the best value provided by the brain scanner was in qualitative analysis, where the data allowed us to a) augment the verbal protocol, b) see ahead of the verbal protocol, and c) explore and examine specific parts of the verbal protocol. In each of these cases, we found it extremely helpful to also see the user’s view, mouse trail, and logged interactions.
Despite appearing as a quantitative source, the qualitative value gained from augmenting other more common usability metrics. The specific added value came in two areas. First, the brain data provided additional insight and context into the content of the verbal protocol, which is otherwise often ambiguous and open to the interpretation of the investigator. Second, the brain data added a visual dimension to the verbal protocol, which is what allowed us to both see ahead and specifically explore the data.
Figure 2: Initial response time-curves in the first 45s of seeing a UI
Figure 3: Consistency between users in Phase 2

4.1 Limitations Despite finding a lot of value in analyzing the EPOC data qualitatively, there are still some well-known limitations to using EEG data. First and foremost, EEG data is easily confounded by body movement. The motor control of fingers, hands, and arms, for example, can create noisy data and arbitrary peaks. In CUES, however, the cross-validation in the think-aloud and brain data allows for some of this noise to be ignored. So far, however, we have not specifically measured body movement.
Further, we frequently saw, especially during the interviews, frustration correlate with speaking. Although it seems like a verbal protocol may, therefore, completely mask the data, we found it was times when participants had to think and explain what was happening. In this case, the verbal protocol often made frustration and lack of understanding more visible in the system.
There are many other limitations to the study, which was only a formative investigation into the utility of CUES , using a scenario focused on evaluating a single form Search User Interface feature. We plan to run a much larger hypothesis-driven evaluation of CUES in the future.
4.2 Recommendations for using CUES Good data. Despite concerns, we were able to get good data regardless of hair length, etc. However, one must watch out for flat-lined data from one or 2 bad sensors, which leads to data loss. Waiting for data. We discovered that there is a 10s lead time as certain pre-classified measures begin to show. Short tasks, such as visual exposure, need to be extended to include this lead time. LTE required tasks must be 10+ minutes long to have value. Comfort. We learnt that participants could wear the device for sustained periods of time. Some participants experienced mild discomfort after wearing the device for more than 40 minutes.
Task Chunking. Correctly separating out tasks is important. If you want to compare a person’s response to System A versus System B, they must be in separate recordings to facilitate easy comparison and analysis.
4.3 CUES Improvements Conducting the study allowed us to identify several areas for improving CUES. One feature of the system captures an entire website, rather than just the page view, but this created an unusual page load event that, in turn, created artificial levels of frustration in our first participant. To be useful, this element needs an alternative implementation to have no visual effect on the user. Further, we also wished to separate the viewport capture frame
rate from the mouse data, as the current mouse trail was limited to the frame rate chosen for screen capture. In order to avoid data loss, it was suggested that a warning appear during tasks when any of the EPOC sensors lost its signal. In regards to the Visualiser, greater control was desired to easily see all the elements when stacking several records on top of each other. In this paper, we also explored alternative visualisation and analyses, which we hope to integrate in the future. Feedback also indicated that global controls, rather than per record, were desirable, to avoid constant reconfiguration from the default. Finally, the motion and control over the viewport and playback is currently tied; future versions will allow independent control.
5. CONCLUSIONS This paper described CUES, a prototype system designed to utilise cheap off the shelf EEG brain scanners to help run usability studies. A formative evaluation provided many insights into the value of different features. Despite being primarily objective in nature, we found that the EEG data was most effective when analysed qualitatively in parallel with think-aloud data. The EEG data a) helped to validate or qualify ambiguous think aloud comments, and b) added a visual dimension to the verbal protocol allowing us to look ahead at their experience and explore the data for certain events. Ultimately, we conclude that a lot of value can be gained from using CUES to investigate EEG brain measurements in parallel with other usability measures such as logs, screen captures, and think-aloud protocols.
6. REFERENCES [1] Cernea, D., Olech, P.-S., Ebert, A. and Kerren, A., EEG-
Based Measurement of Subjective Parameters in Evaluations. In HCII'11 - Posters, 279-283. 2011
[2] Kitamura, Y., Yamaguchi, Y., Hiroshi, I., Kishino, F. and Kawato, M., Things happening in the brain while humans learn to use new tools. In CHI'03, 417-424. 2003
[3] Liu, Y., Sourina, O. and Nguyen, M.K., Real-Time EEG-Based Human Emotion Recognition and Visualization. In CW'10, 262-269. 2010
[4] Medlock, M., Wixon, D., Terrano, M., Romero, R. and Fulton, B., Using the RITE method to improve products; a definition and a case study. In Usability Professionals Association. 2002
[5] Vi, C. and Subramanian, S., Detecting error-related negativity for interaction design. In CHI'12, 493-502. 2012
[6] Wilson, M.L., Evaluating the Cognitive Impact of Search User Interface Design Decisions. In EuroHCIR 2011, 27-30. 2011
Figure 4: Internal Consistency between users in Phases 2 and 3. Favourite and least favourite system and systems with
favourite features are also shown (based on the interview questions at the end of the study).