Embed Size (px)
Citation preview
Cthru Technical Brief
Gary MorrisCenter of Higher Learning
Stennis Space Center
Outline
cthru History
What is cthru?
Hardware for cthru
Software for cthru
File formats
Tasks of cthru
cthru Facts
Future enhancements
Video presentation

cthru History
• created by Mississippi State in 1995 by Dr. Robert J. Moorhead and Scott Nations
• a prototype for visualizing an ocean circulation model for Supercomputing 95
• new capabilities have been added to cthru

What is cthru?Cthru is a high performance visualization tool for viewing ocean model output data.
It currently supports visualizing ocean currents and sea surface height.
The software runs on a SGI ONYX2 Infinite Reality 2 deskside visualization computer with 4 processors.
The data is visualized on a Immersadesk R2 6 foot by 4 foot rear projection display screen.
Users can navigate the visualization in real-time using a wand and stereo glasses.
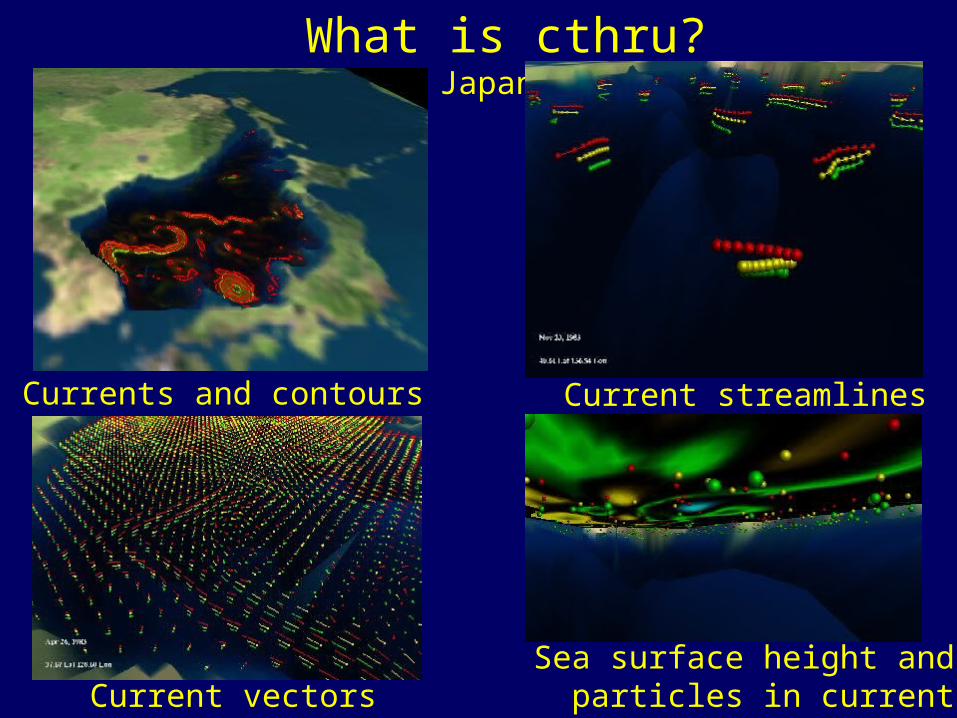
What is cthru? Sea of Japan
Currents and contours
Current vectors
Current streamlines
Sea surface height and particles in current
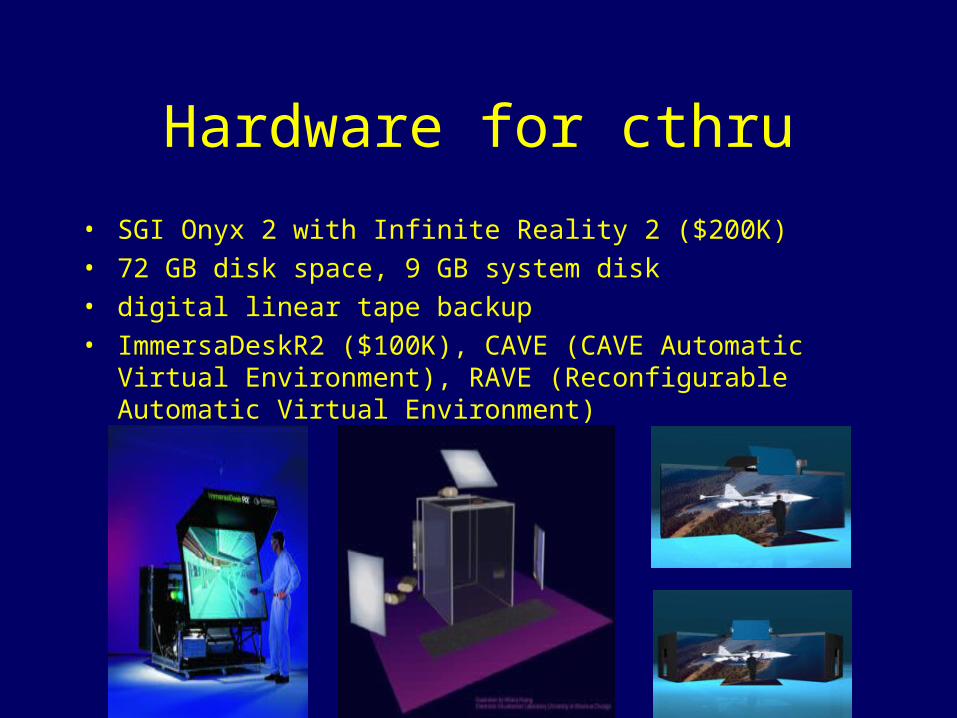
Hardware for cthru
• SGI Onyx 2 with Infinite Reality 2 ($200K)• 72 GB disk space, 9 GB system disk• digital linear tape backup• ImmersaDeskR2 ($100K), CAVE (CAVE Automatic Virtual
Environment), RAVE (Reconfigurable Automatic Virtual Environment)

Hardware for cthru
• a minimum of 4 R1000 CPU’s
• high speed Internet access
• tracking equipment (wand, stereoscopic glasses, tracking gloves, HMD’s, etc)
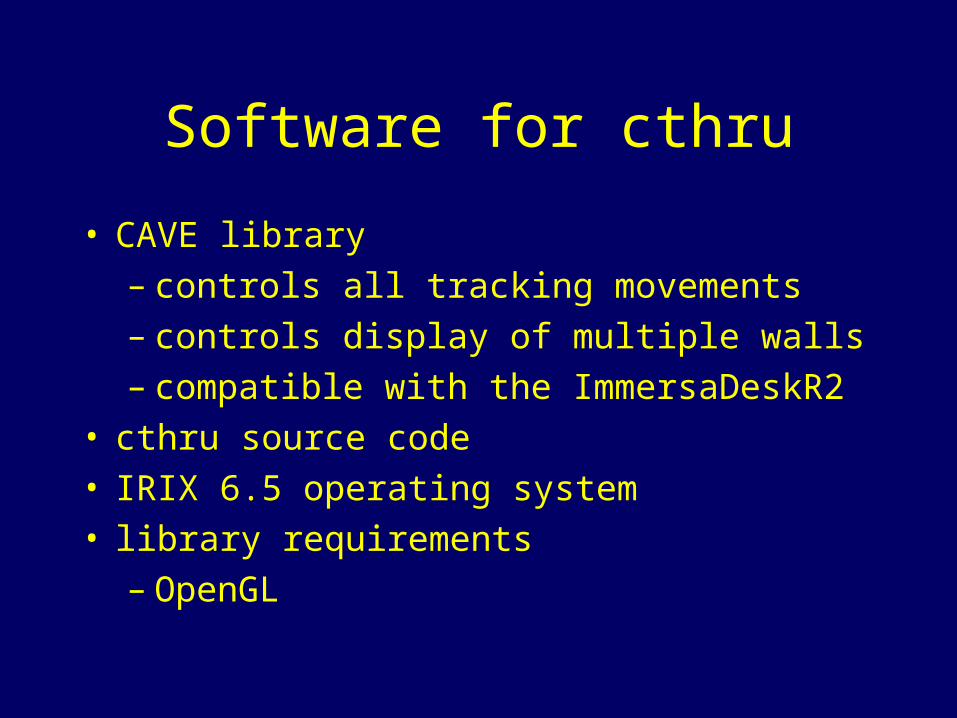
Software for cthru
• CAVE library– controls all tracking movements– controls display of multiple walls– compatible with the ImmersaDeskR2
• cthru source code• IRIX 6.5 operating system• library requirements
– OpenGL
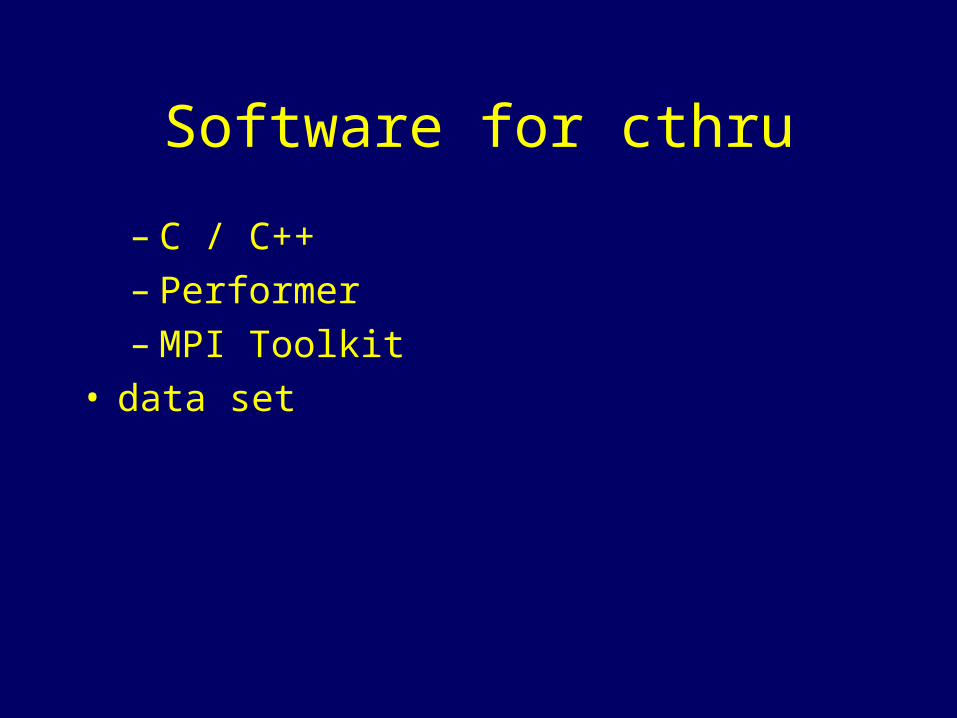
Software for cthru
– C / C++ – Performer– MPI Toolkit
• data set
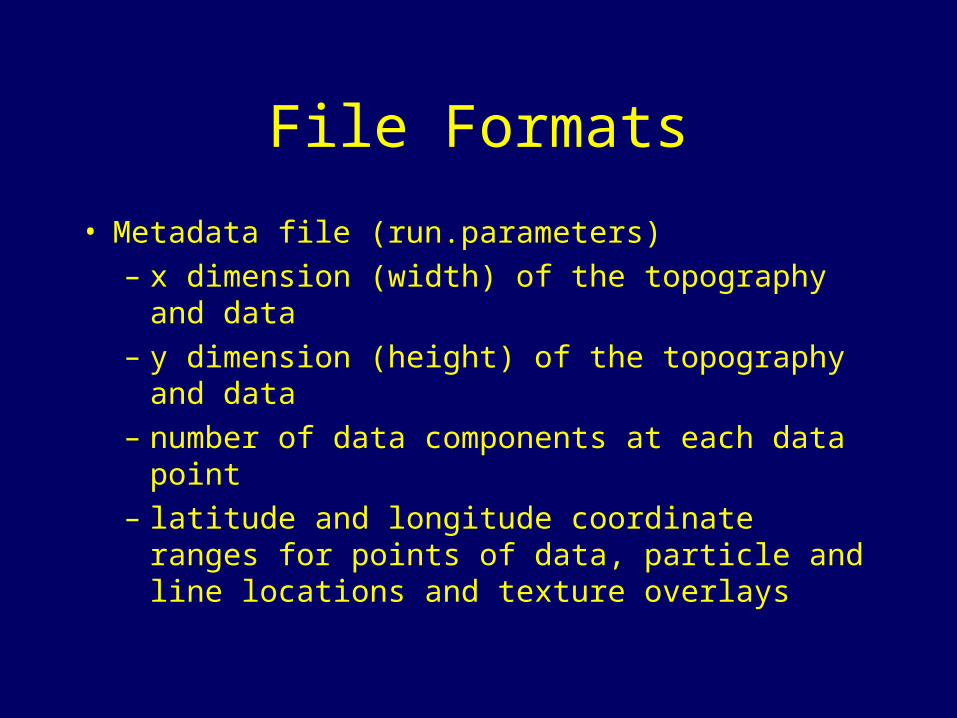
File Formats
• Metadata file (run.parameters)
– x dimension (width) of the topography and data
– y dimension (height) of the topography and data
– number of data components at each data point
– latitude and longitude coordinate ranges for points of data, particle and line locations and texture overlays
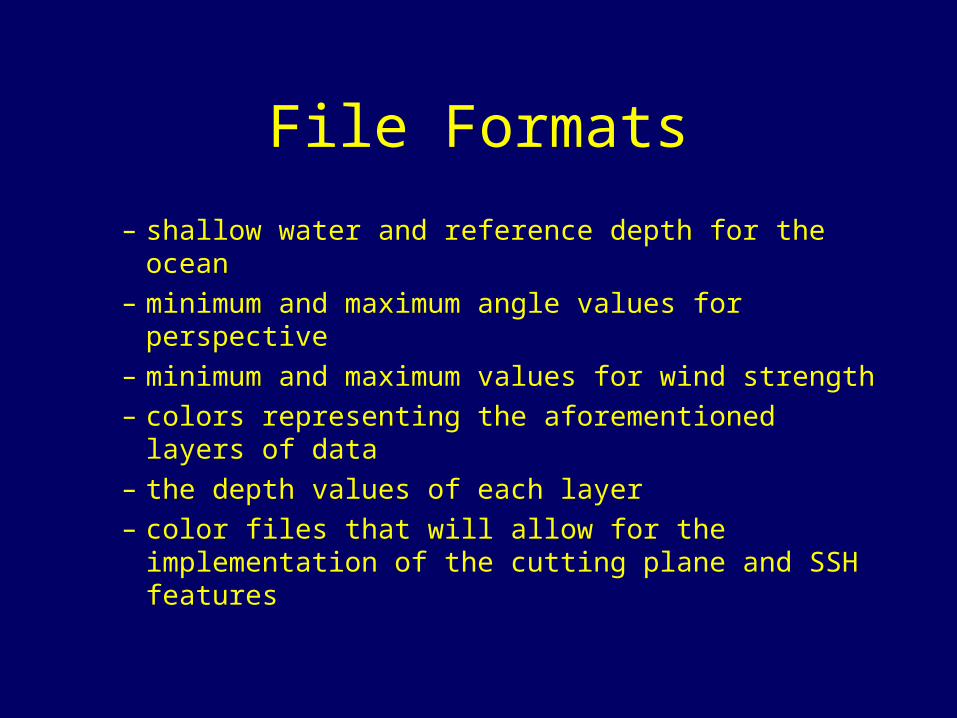
File Formats
– shallow water and reference depth for the ocean– minimum and maximum angle values for
perspective– minimum and maximum values for wind strength– colors representing the aforementioned layers of
data– the depth values of each layer– color files that will allow for the implementation
of the cutting plane and SSH features
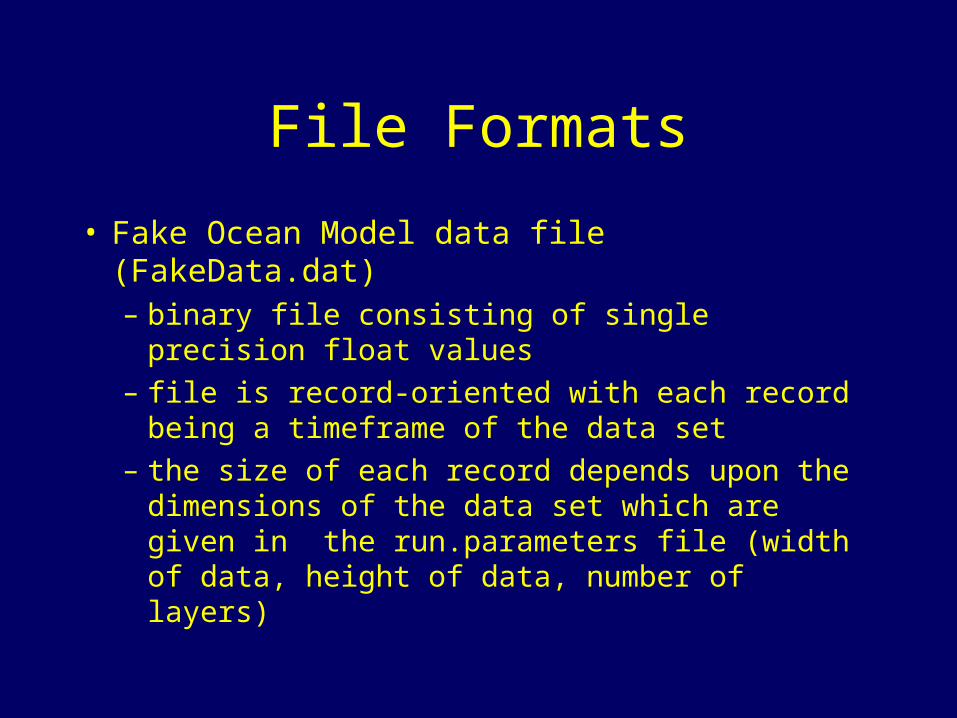
File Formats
• Fake Ocean Model data file (FakeData.dat)– binary file consisting of single precision float
values
– file is record-oriented with each record being a timeframe of the data set
– the size of each record depends upon the dimensions of the data set which are given in the run.parameters file (width of data, height of data, number of layers)
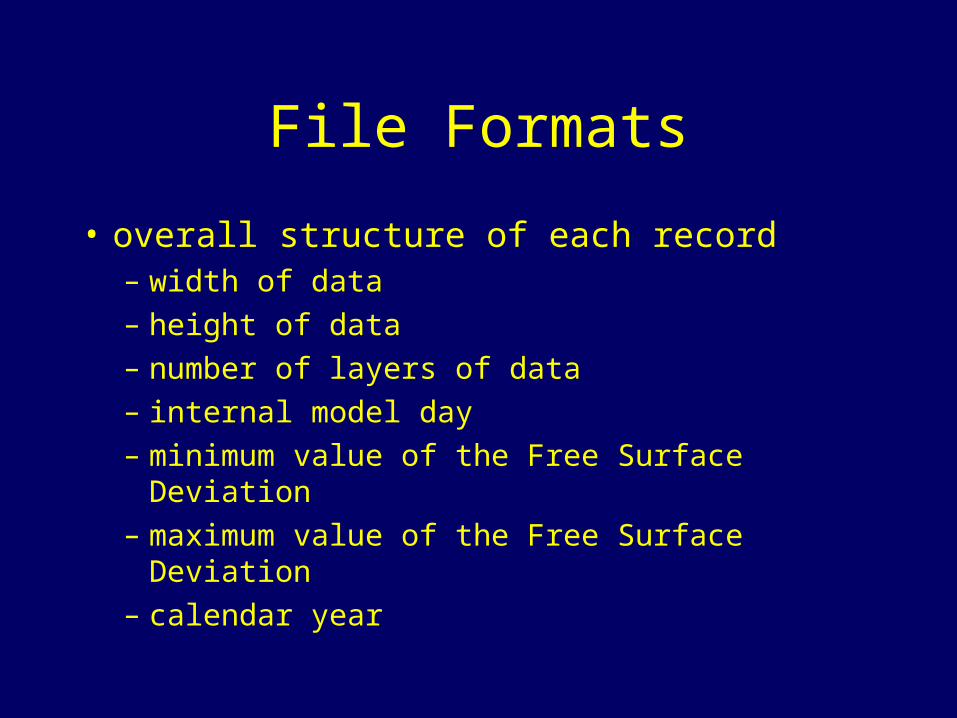
File Formats
• overall structure of each record– width of data
– height of data
– number of layers of data
– internal model day
– minimum value of the Free Surface Deviation
– maximum value of the Free Surface Deviation
– calendar year
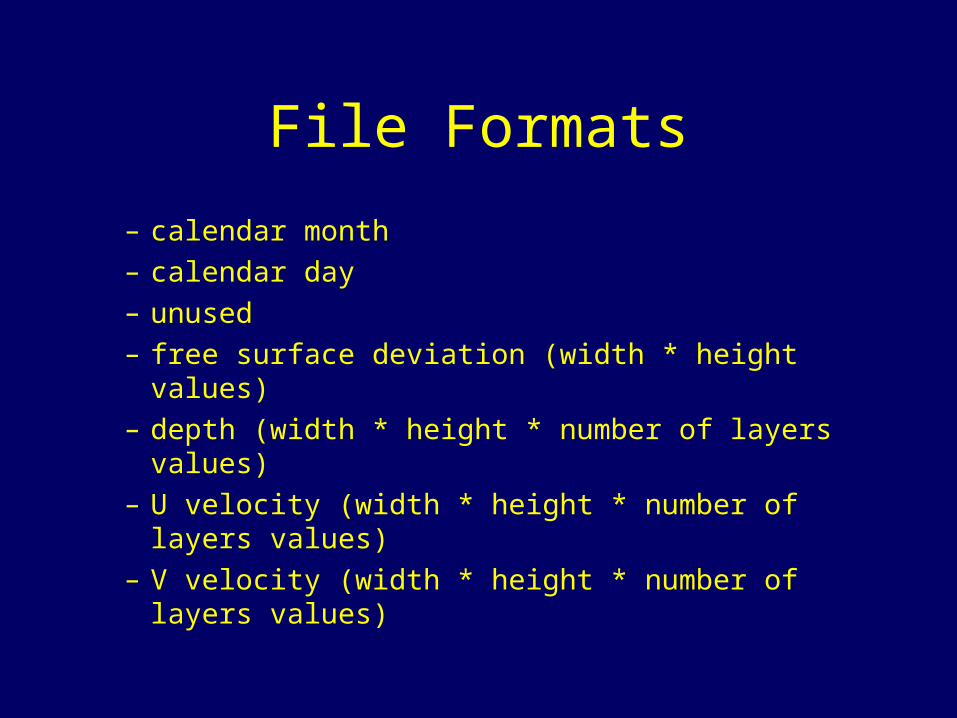
File Formats
– calendar month– calendar day– unused– free surface deviation (width * height values)– depth (width * height * number of layers values)– U velocity (width * height * number of layers
values)– V velocity (width * height * number of layers
values)
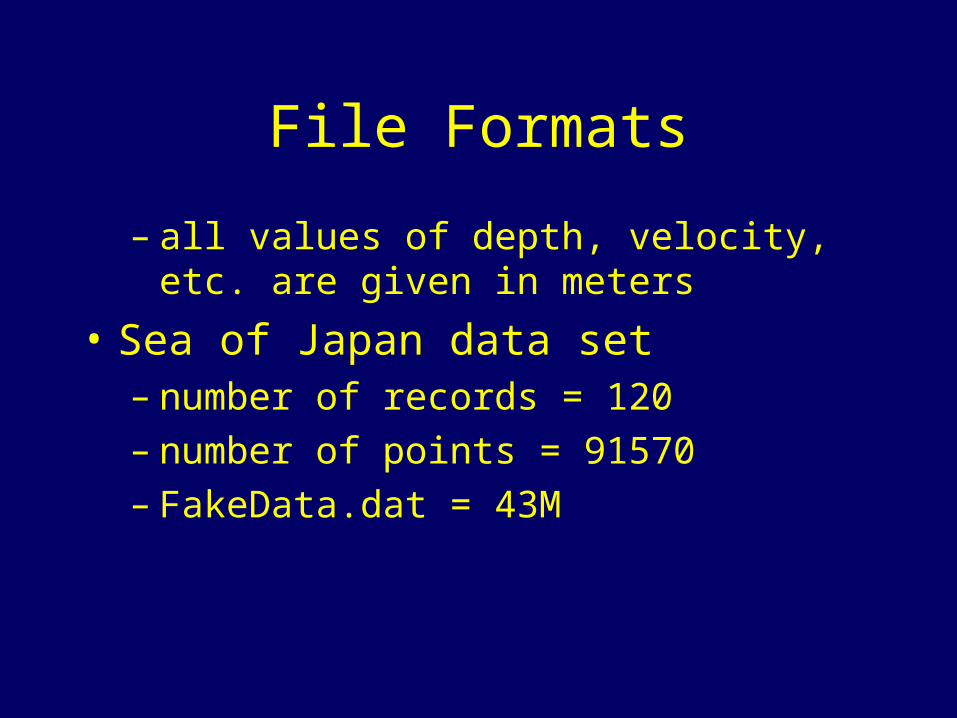
File Formats
– all values of depth, velocity, etc. are given in meters
• Sea of Japan data set– number of records = 120– number of points = 91570– FakeData.dat = 43M

Tasks of cthru
• Fake Ocean Model– loop through the raw data of each point– send data to Extraction Task
• Extraction Task– extracts and categorizes data received
from Fake Ocean Model– communicates to the Child Process the
categorized data

Tasks of cthru
• Child Process– “liazon officer” that communicates with
Fake Ocean Model and Extraction Task– will kill all external tasks upon shutdown– enables Parent Process to display data by
storing data in an arena
• Parent Process– forks off Child Process
Tasks of cthru
– handles user interface– handles the graphical display– implements the CAVE library

Tasks of cthru
• Fake Ocean Model reads raw data
• Fake Ocean Model sends data to Extraction Task
• Extraction Task sends modified data to Child Process
• Child Process receives data and puts it into the arena
• Parent process displays current data
FileFake
OceanModel
ExtractionTask
ChildProcess
ParentProcess
cthru Facts
• can only illustrate sea surface height and current data
• can only be run on SGI equipment
• can only work with a specified file format
• can only service rectilinear projection
• is not easily configurable
cthru Facts
• is not a generic package
• is generic in the sense that cthru can visualize sea surface heights and currents for any part of the world provided the data is in the correct file format
Future Enhancements
• texture mapping– only store in memory what is viewable (clip
mapping)– location dictates resolution (mip mapping)
• collaboration– requires high speed Internet access– simultaneous research
Future Enhancements
– enables a collection of remote sites to view the same data set in real time simultaneously
– any interaction made by a participant is propagated throughout the collaborative community
– features include option toggling, avatars, video/audio streaming, camera capture, etc.
Future Enhancements
• information display and legends– provides more information – “position pole” feature
• data ingest processing and display of new data sets– handle different types of data sets– makes cthru a more generic package
Future Enhancements
• level of detail and subsection– subsample a desired reigon– the desired region would consist of a
higher resolution