Embed Size (px)
Citation preview
California Community Colleges – Chancellor’s Office | 113 Colleges | 72 Districts | 2.1 Million Students 1
CTE Data UNLOCKED
• Introduce you to a suite of resources to support CTE data usage
• Show how tools like the LaunchBoard Program Snapshot can support processes like program review and planning
• Update on other tabs of the LaunchBoard
Objectives
California Community Colleges – Chancellor’s Office | 113 Colleges | 72 Districts | 2.1 Million Students

3
Task Force Roll Out
14 Regional College & Faculty Conversations
Over 700 attendees, including 40% faculty
6 Strong Workforce Town Hall Meetings
Over 500 participants in regions across the state
6 expert background papers on common themes Workforce Data & Outcomes
Curriculum Development & Instructors
Structured Pathways and Student Support (2 parts)
Regional Coordination
Funding
5 meetings of the 26-member Task Force
221 website & 10 letters during public comment period
California Community Colleges – Chancellor’s Office | 113 Colleges | 72 Districts | 2.1 Million Students
• Create common workforce metrics for all state funded CTE programs. • Expand the definition of student success to better reflect the wide array
of CTE outcomes of community college students. • Establish a student identifier for high school students and those enrolled
in postsecondary education and training programs to enable California to track workforce progress and outcomes for students across institutions and programs.
• Increase the ability of governmental entities to share employment, licensing, certification, and wage outcome information.
• Improve the quality, accessibility, and utility of student outcome and labor market data to support students, educators, colleges, regions, employers, local workforce investment boards, and the state in CTE program development and improvement efforts.
Recommendations: Workforce Data & Outcomes
California Community Colleges – Chancellor’s Office | 113 Colleges | 72 Districts | 2.1 Million Students
CTE DATA UNLOCKED Getting Support:
California Community Colleges – Chancellor’s Office | 113 Colleges | 72 Districts | 2.1 Million Students 5
• Provides tools, training, technical assistance, and funding to support better use of CTE outcomes data and labor market information
• Strengthens ongoing capacity for CTE data usage in program review, accreditation, integrated planning, and regional and sector-based program design
• Supports the development of regional workforce plans and prepares for $200 million in new CTE funding that will be available in 2017
CTE Data Unlocked

Provide an overview on CTE data at regional trainings: • learn about the expanded CTE metrics on the
Student Success Scorecard • get hands-on experience using statewide tools like
the LaunchBoard to answer common questions • send a team including a senior administrator (CEO,
CIO, or CSSO), plus one or more CTE deans, faculty, and institutional researchers
Building Awareness (Spring 2016)
Build system-wide capacity to find, understand, and use data:
• provide training for Chancellor’s Office technical assistance providers on how to use CTE data tools and labor market information
• release resources to support colleges in integrating these data sources into college processes such as program review, accreditation, and integrated planning
Deepening Expertise (Summer 2016)
• How to use data tools in various usage cases such as program review, accreditation, and planning, offered in various formats including: – Two minute videos – Seven page guides – Detailed how-to guides – Animated PowerPoints
• Short documents on how to analyze and work with metrics such as employment and earnings data and labor market information
Resource Examples
Support the development of regional workforce plans: • release regional reports that integrate labor market
information and student outcomes data from Data Mart, the LaunchBoard, the CTE Employment Outcomes Survey, and other sources
• host meetings with colleges, employers, and other educational partners to create regional workforce plans
Expanding Regional Data Use (Fall 2016)
Support colleges in integrating regional plans and CTE data into core activities:
• offer $50,000 in funding and 10 hours of technical assistance to support CTE data usage (for colleges that attended spring training)
• host in-depth “super-user” trainings to help practitioners develop a deeper understanding of CTE data tools and labor market information.
• provide one free year of participation in the CTE Outcomes Survey (tracks employment and other post-college outcomes)
• roll out three years of participation in the CATEMA system (tracks participation in articulated courses and eligibility for credit)
Supporting College Data Usage (2016-2017)
• Onsite training with student services professionals, faculty, and deans on using employment data for educational planning and to strengthen support services
• Onsite training with a specific department or program, where participants examine outcomes in various statewide data tools
• Hands-on support to pull and format data from statewide data tools to support local and regional processes like program review, accreditation, and planning
• Technical support to examine TOP code assignments and identify data points that are missing from the LaunchBoard, leading to recommendations on how to improve data quality in statewide tools
Technical Assistance Examples
• Hire a communications consultant to develop outreach and educational planning materials based on data found in the LaunchBoard, Salary Surfer, and other tools
• Hire a consultant or pay faculty release time to gather stories on skills-builder students and analyze skills-builder pathways, to provide a deeper understanding of these students, course clusters, and outcomes
• Support integration of the CATEMA system, including faculty stipends to support the development of processes with K-12 partners and A&R offices to gather and process information on articulated courses and credit by exam
• Improve response rates for the CTE Outcomes Survey, such as purchasing services that can provide updated contact information for former students or providing faculty stipends to develop communications plans to clarify the importance of the survey to students
Funding Examples
• training content, locations, and dates • requirements to receive funding and technical assistance • full details on CTE Data Unlocked http://doingwhatmatters.cccco.edu/LaunchBoard/CTEDataUnlocked.aspx
Find Out More
LAUNCHBOARD PROGRAM SNAPSHOT
Tools You Can Use:
California Community Colleges – Chancellor’s Office | 113 Colleges | 72 Districts | 2.1 Million Students 15

16
The LaunchBoard Program Snapshot Tab
California Community Colleges – Chancellor’s Office | 113 Colleges | 72 Districts | 2.1 Million Students
• Access student outcomes, employment and earnings data, and labor market information by program, sector, college, and region
• View visual reports that answer questions like "are the right number of people being trained for available jobs" and "how much money are students making“
• Drill down into detailed data tables on student characteristics, milestones, and success
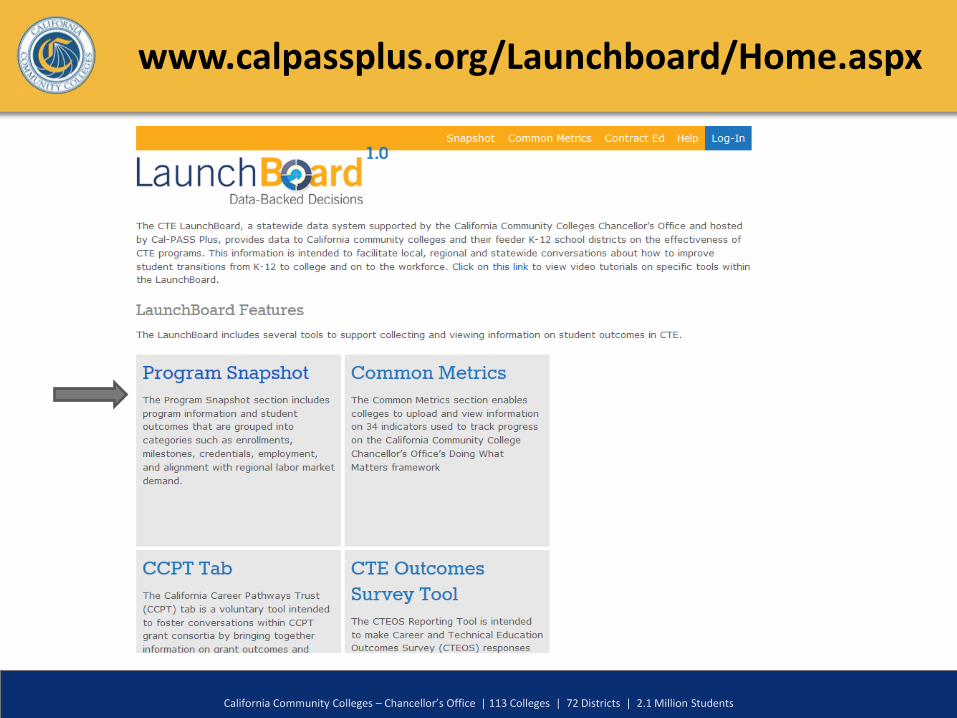
www.calpassplus.org/Launchboard/Home.aspx
California Community Colleges – Chancellor’s Office | 113 Colleges | 72 Districts | 2.1 Million Students

18
Determine what you want to see
California Community Colleges – Chancellor’s Office | 113 Colleges | 72 Districts | 2.1 Million Students
19
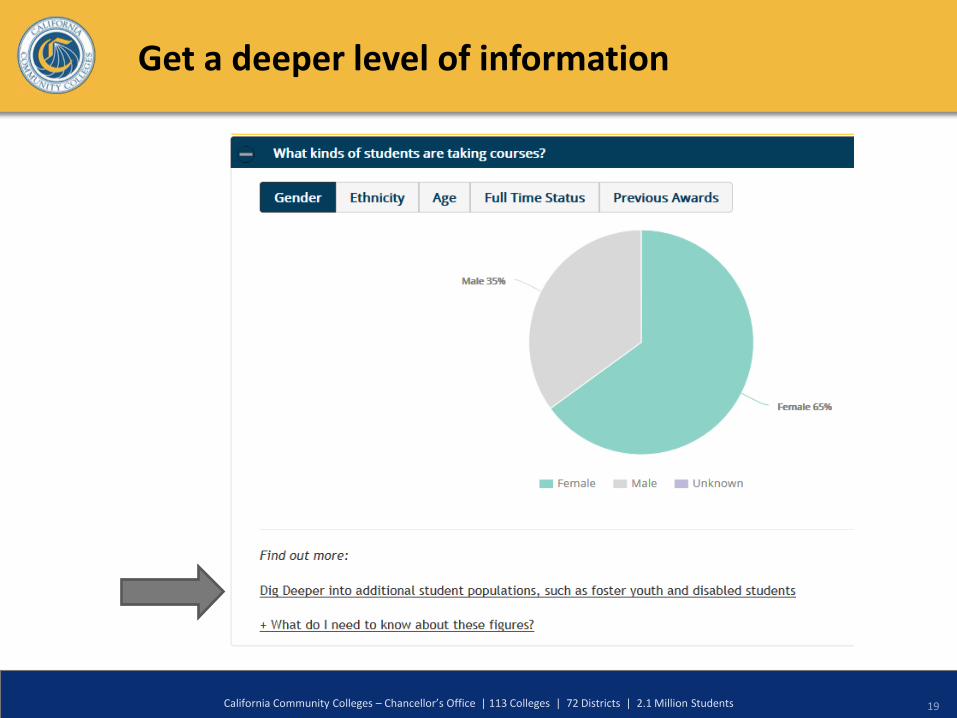
Get a deeper level of information
California Community Colleges – Chancellor’s Office | 113 Colleges | 72 Districts | 2.1 Million Students
20
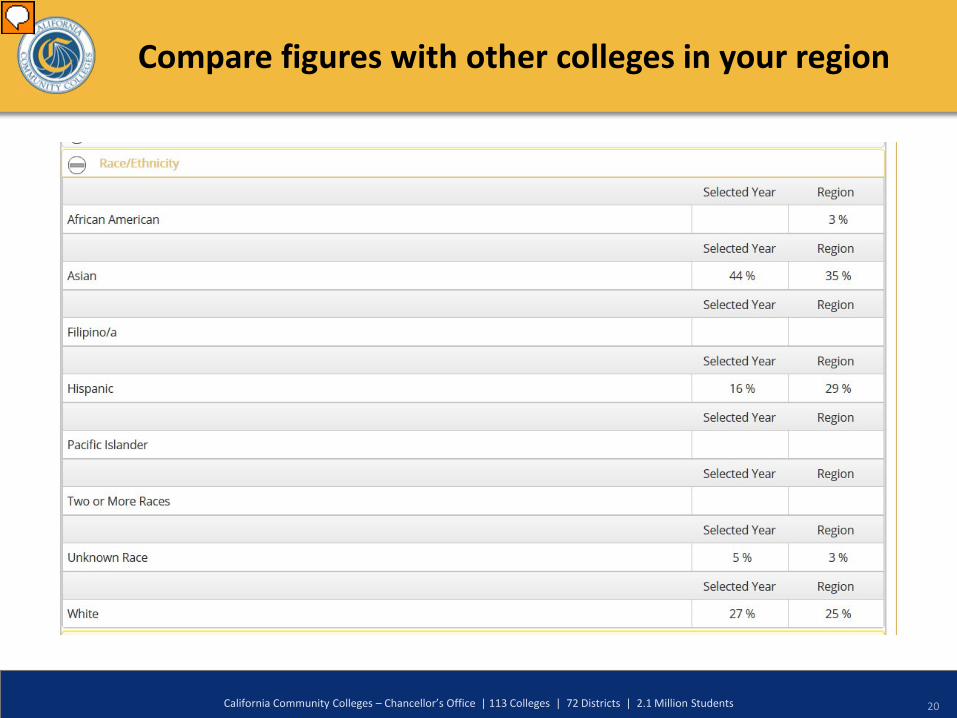
Compare figures with other colleges in your region
California Community Colleges – Chancellor’s Office | 113 Colleges | 72 Districts | 2.1 Million Students
21 California Community Colleges – Chancellor’s Office | 113 Colleges | 72 Districts | 2.1 Million Students
Scenario 1: Evaluating Access & Success
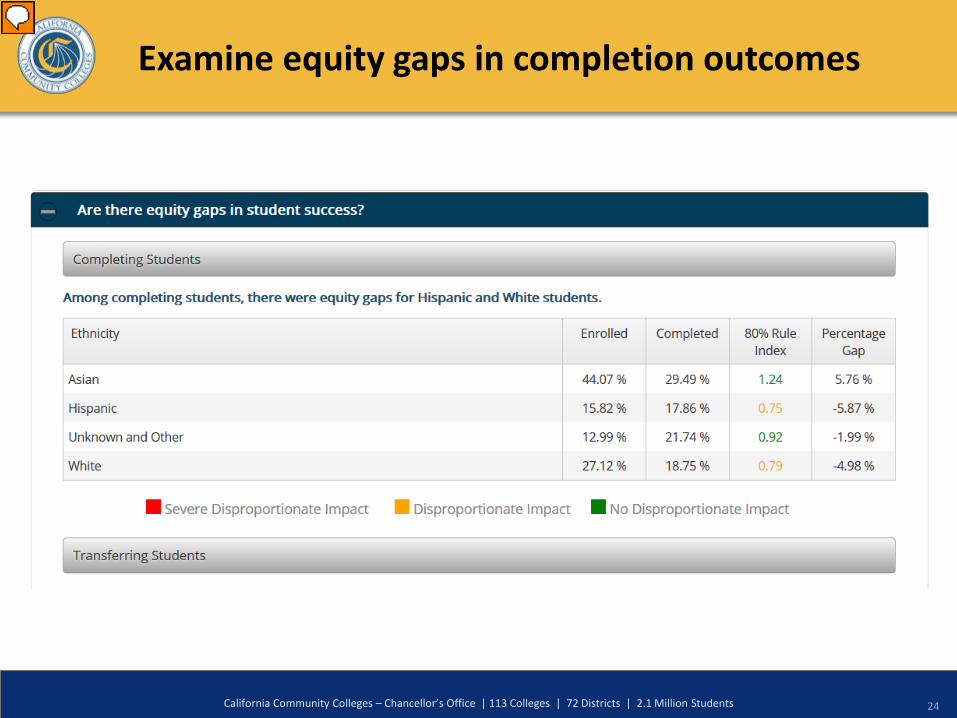
What types of students are in my program? Are there equity gaps in success?
LaunchBoard Usage Cases

22
See how many students started with credentials
California Community Colleges – Chancellor’s Office | 113 Colleges | 72 Districts | 2.1 Million Students
23
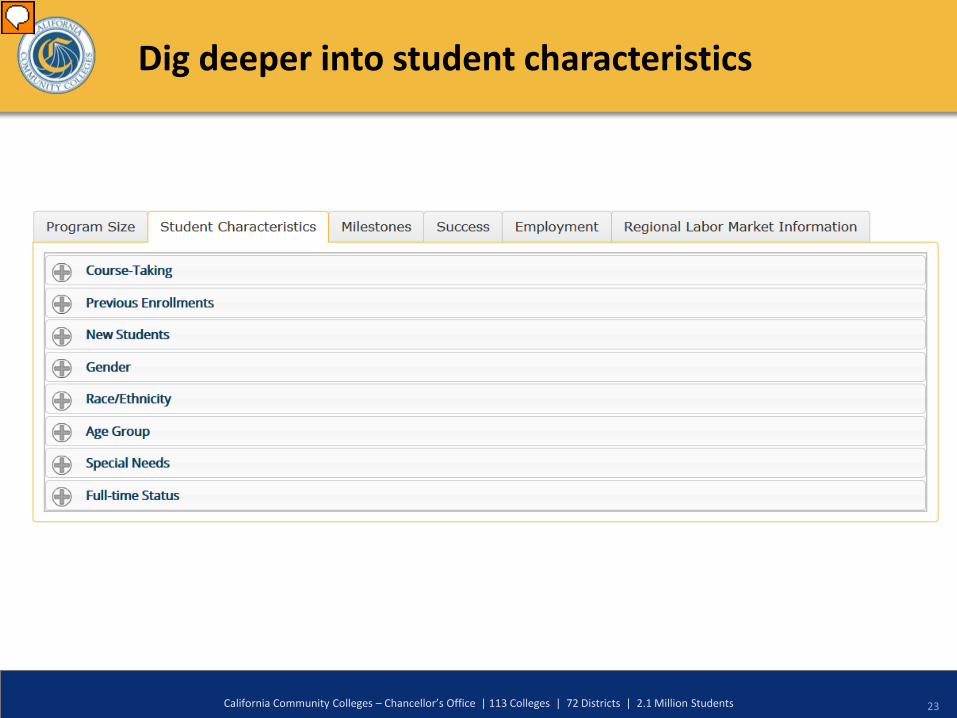
Dig deeper into student characteristics
California Community Colleges – Chancellor’s Office | 113 Colleges | 72 Districts | 2.1 Million Students
24
Examine equity gaps in completion outcomes
California Community Colleges – Chancellor’s Office | 113 Colleges | 72 Districts | 2.1 Million Students

25 California Community Colleges – Chancellor’s Office | 113 Colleges | 72 Districts | 2.1 Million Students
Scenario 2: Understanding the Labor Market
What kinds of jobs are there? Do my students make more money?
LaunchBoard Usage Cases

26
Labor Market Information: Environmental Technology
California Community Colleges – Chancellor’s Office | 113 Colleges | 72 Districts | 2.1 Million Students
27 California Community Colleges – Chancellor’s Office | 113 Colleges | 72 Districts | 2.1 Million Students
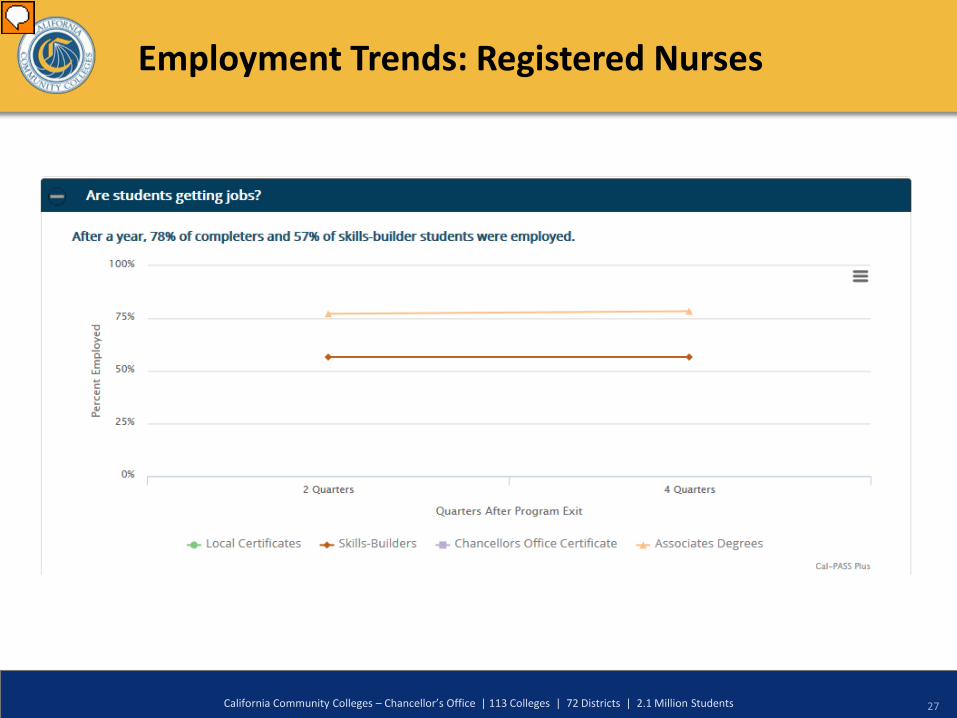
Employment Trends: Registered Nurses
28 California Community Colleges – Chancellor’s Office | 113 Colleges | 72 Districts | 2.1 Million Students
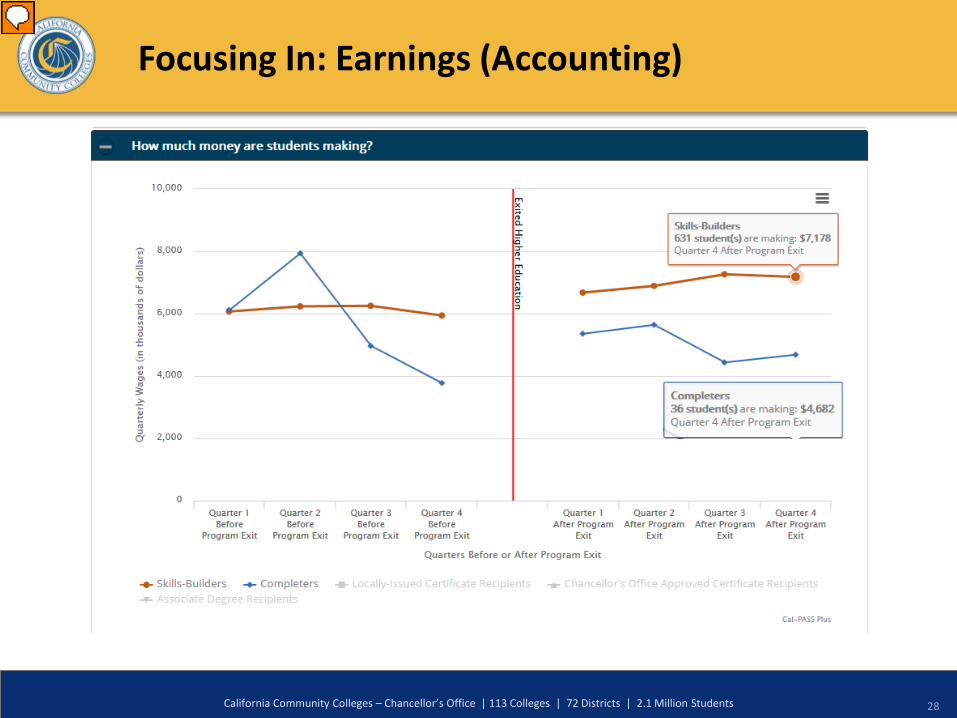
Focusing In: Earnings (Accounting)

• Various two-minute videos describing how to use the LaunchBoard for specific tasks like starting a new program, program review, equity planning, and accessing employment and earnings data
• Four-minute video on why we need to count skills-builders in CTE success measures
• Eight minute video on earnings outcomes for various CTE pathways
• Two guides on understanding and using labor market information
http://doingwhatmatters.cccco.edu/LaunchBoard.aspx
Find Out More
OTHER LAUNCHBOARD TABS
Tools You Can Use:
California Community Colleges – Chancellor’s Office | 113 Colleges | 72 Districts | 2.1 Million Students 30
Draft metrics have been developed, based on statewide goals, such as: • Increase the number of students who earn a certificate or degree that
prepares them for the workforce • Increase the number students who attain multiple credentials that help them
advance up a career ladder • Secure job retention, economic mobility, and living-wage earnings • Support economic development
The metrics are currently being vetted with stakeholders and will be in place to track outcomes for 2016-17
Common Metrics
California Community Colleges – Chancellor’s Office | 113 Colleges | 72 Districts | 2.1 Million Students
• Currently working on a rebuild that includes all years of data (for colleges that signed the MOU allowing for the data transfer)
• Like the Program Snapshot, the tab will include both data tables and visual charts
CTEOS

• Through a partnership with Aeries, K-12 consortia members can track information on CCPT outcomes in Aeries’ online student information application and upload results into the LaunchBoard
• Functionality, and an updated how-to guide, will be in place by April
CCPT


![201312131504346 [Unlocked]](https://img.pdfslide.us/doc/110x75/56d6be7c1a28ab30169254b4/201312131504346-unlocked.jpg)


![ECA [UandiStar.org].Unlocked](https://img.pdfslide.us/doc/110x75/55cf9005550346703ba264d6/eca-uandistarorgunlocked.jpg)