Embed Size (px)
Citation preview

Chapter 5 Outline
Process Map/Spaghetti Diagram Cause & Effect Fishbone Diagram Cause & Effect Matrix Reproducibility & Repeatability (Gage R&R) Capability Analysis Components of Variation Studies FMEA

Process Map/Spaghetti Diagram

What is a Process Map?
A process map is a graphical representation of the flow of a process
A detailed process map includes information that can be used to improve the process, such as:• Process Times• Quality• Costs• Inputs• Outputs

Types of Process Map
Basic process map Detailed process map Work-flow (spaghetti diagrams) Top-down flowchart Deployment flowchart Opportunity flowchart Current State / Future state maps

Uses of a Process Map
Identify areas for focus of improvement efforts Identify and eliminate non-value added steps Combine operations Assist root cause analysis Baseline for failure mode and effect analysis (FMEA) Identify potential controllable parameters for designed
experiments Determine needed data collection points Eliminate unnecessary data collection steps

Detailed Process Map Example
PICKLE RINSE
(Y's)Acid freeDebris removed
(Y's)Surface cleanliness- Removel of sand- Removal of rust- 'Defect free'
SHOTBLAST
(Y's)Surface cleanliness (dust / rust free)Surface roughness
HANG ON PENDANTS
STAND
UNCOATED FITTINGS
(x's)C TimeC Shot size / mix of sizesN HumidityS Type / Material / Original size of gritN Effectiveness of seperatorN Product geometryN Condition of machineN Dust arrestor conditionS Amount of work being shotblastC Time between pickle and shotblastN Operator
(x's)C TimeN Product geometryN OperatorS Rocked / Not rockedS Method of packing
(x's)C Make up of mix, Concentration and % of Hydrochloric Acid, Hydrofluoric Acid, Activol, WaterC Pickling timeS Age of mix / SGN Quality of work / containerN Containers / tankN Product geometryS Packing methodN OperatorS Shotblast prior to pickling
LYE BATH
(Y's)Uniformity of fluxNo excess flux (removed by Dry ing Oven)
DRYING TUNNEL
(Y's)Dry castingsWarm castings
DIP IN ZINC BATH / BUMP
(Y's)Coating Quality- Thickness of z inc / z inc alloy layers- Uniformity of coverage- Total coverage- Appearance- Roughness / tex ture- Composition of coating
WATER SPRAY KNOCK OFF
RUMBLE
(Y's)AppearanceSmooth Finish
(Y's)Zinc : Zinc Alloy thicknessAppearance (brightness)Removal of ash (c leanliness)Fitting temperature COATED
FITTINGS
(x 's)C Speed of chain / time in bathC Temperature of lye bathC Make up of lye bathS Cleanliness of lye bathN Geometry of partsS Pendant sty le / orientation of workS Amount per pendantS Weight of product per minute put through bath (Heat removal + heat pickup)S Time from shotblastN Humidity
(x 's)C Speed of chainS Temperature of tunnelN Geometry / Mass of fittingsN HumidityS Air velocity
(x 's)S Quality of supplier / materialsC Temperature of z incS Level of drossS Level of leadN Geometry / mass of fittingsN Operator (Skimming surface / agitation of pendants)S Quality of pendantsN Specifiacation (BS, ISO, EN)S Rate of withdrawalS Fluidity of z incN Power of bumper unit
(x 's)S Water volumeN Water temperatureC Speed of chainN Mass / Geometry of fittings (Rate of cooling)
(x 's)C TimeC Number of fittings per loadN Geometry of fittingsS Condition of rumbling barrel

Process Maps
Should include• Major activities and tasks• Sub-processes• Process boundaries• Inputs• Outputs
Documents reality, not how you think the process is supposed to be completed
Should identify opportunities for improvement

Steps for Process Mapping
Scope the process• Identify the start and end points of the process of interest
Document the top level process steps• Create a flow chart
Identify the inputs and outputs• What are the results of doing each process step? (Y’s)• What impacts the quality of each Y? (x’s)
Characterise the inputs

Characterising Inputs
Inputs can be classified as one of three types Controllable (C)
• Things you can adjust or control during the process• Speeds, feeds, temperatures, pressures….
Standard Operating Procedures (S)• Things you always do (in procedures or common sense things)
• Cleaning, safety….
Noise (N)• Things you cannot control or don not want to control
(too expensive or difficult)• Ambient temperature, humidity, operator...

Example
Machining a shaft on a lathe
Inputs (x’s)Rotation speedTraverse speedTool typeTool sharpnessShaft materialShaft lengthMaterial removal per cutPart cleanlinessCoolant flowOperatorMaterial variationAmbient temperatureCoolant age
Outputs (Y’s)DiameterTaperSurface finish
CCCCCCCSCNNNS

BEFORE40 NVA STEPS
NOTE: FROM THE CUSTOMER’S VIEWPOINT ALL OF ORDER ENTRY IS NON-VALUE ADDED
Order Entry Process MapAs-Is
AFTER11 NVA STEPS
REMEMBER: FROM THE CUSTOMER’S VIEWPOINT ALL OF ORDER ENTRY IS NON-VALUE ADDED
We eliminated the steps that were NVA and
UNNECESSARY (WASTE)BEFORE
40 NVA STEPS
Order Entry Process MapNew

Work-flow or Spaghetti Diagram
A work flow diagram is a picture of the movements of people, materials, documents, or information in a process.
Start by tracing these movements onto a floor plan or map of the work space.
The purpose of the work-flow diagram is to illustrate the inefficiency in a clear picture.
How can you make the map look simpler? What lines can you eliminate?
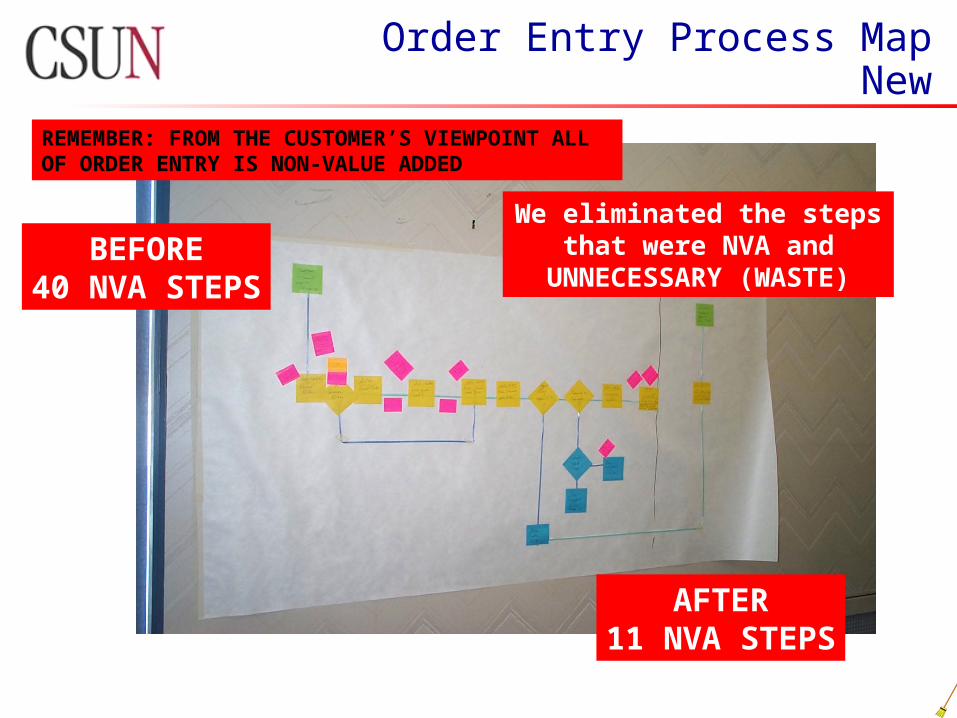
56 Frame (Small Motor) Assy & Fabrication - Before
BEFORE KAIZEN:Area: 4640 sq ftOperator Travel: 3696 ftProduct Travel: 1115 ft
xxx x
x xxx
x

Cause & Effect Fishbone Diagram

Cause & Effect Fishbone Diagram
Objectives
• To understand the benefits of Cause & Effect Analysis
• To understand how to construct a C & E Diagram
Analysis
• A method a work group can use to identify the possible causes of a problem
• A tool to identify the factors that contribute to a quality characteristic

Uses of C & E Fishbone Diagram
Visual means for tracing a problem to its causes
Identifies all the possible causes of a problem and how they relate before deciding which ones to investigate
C & E analysis is used as a starting point for investigating a problem

Fishbone Diagram
Effect
• The problem or quality characteristic
• The effect is the outcome of the factors that affect it
Effect

Fishbone Diagram
Causes
All the factors that could affect the problem or the quality characteristic
Five Major Categories
• Materials
• Methods
• People
• Machines
• Environment

Effect
PeopleMethodsMaterial
Machine Environment

Cause & Effect matrix

The Eight Steps in Cause and Effect Analysis
Define the Effect
Identify the Major Categories
Generate Ideas
Evaluate Ideas
Vote for the Most Likely Causes
Rank the Causes
Verify the Results
Recommend Solutions

Rating of Importance to
Customer
1 2 3 4 5 6 7 8 9 10 11 12 13 14 15
Total
Process Step Process Input
1 02 03 04 05 06 07 08 09 0
10 011 012 013 014 015 016 017 018 019 020 0
0
Total 0 0 0 0 0 0 0 0 0 0 0 0 0 0 0
Lower Spec
Target
Upper Spec
1
2
3
4
5&6

Reproducibility & Repeatability (Gage R&R)
“Data is only as good as the system that measures it. If you can’t measure it, you can’t manage it.”

“I often say that when you measure what you are speaking about and express it in numbers, you know something about it.”
LORD KELVIN, 1891
He clearly stressed that little progress is possible in any field of investigation without the ability to measure. The progress of
measurement is, in fact, the progress of science.
The Science of Measurement

Objectives
Measurement Systems Analysis Key Terminology Variable Gauge R&R
• A tool for estimating measurement system error• How to conduct a gauge R&R• Minitab Output
Gauge R & R Study Exercise

Definitions
Variable Data• Continuous measurements such as length, voltage, viscosity
Repeatability• Variation in measurements obtained with one gage when used
several times by one appraiser. Reproducibility
• Variation in the average of the measurements made by different appraisers using the same measurement system.

What is GR&R?
Measurement Systems Analysis
GRRRRRRR!!!
2T = 2
p + 2m
2T = Total Variance
2p = Process Variance
2m = Measurement Variance
How good is our measurement system?

Gauge R&R Allows Control of the Measurement System

Variable Gauge R&R - What’s Involved?
1 Gauge
3 Appraisers
10 Parts

How to set up a Variable GRR Study
Preparation & Planning 1 Gauge 3 Operators (Appraisers) 10 Parts 3 Trials Randomize the readings Code the parts (blind study) if possible 3 Ops x 10 parts x 3 trails = 90 Data Points 4 Ops x 10 parts x 3 trails = 120 Data Points

Minitab Gage R&R Graphical Output
The number of distinct categories of parts that the process is currently able
to distinguish (Must distinguish at least 5 types of parts)

Acceptability Criteria
R&R Indices 10% Acceptable Measurement System• 10% - 30% May be acceptable based upon application,
cost of measurement device, cost of repair, etc.
30% Not acceptable. Measurement system needs improvement.
Number of Distinct Categories Index• 1 Unacceptable. One part cannot be
distinguished form another.• 2 -4 Generally unacceptable 5 Recommended
Mod
ule
002
5

Minitab Gage R&R Graphical Output

Minitab Gage R&R Graphical Output

Minitab Gage R&R Graphical Output
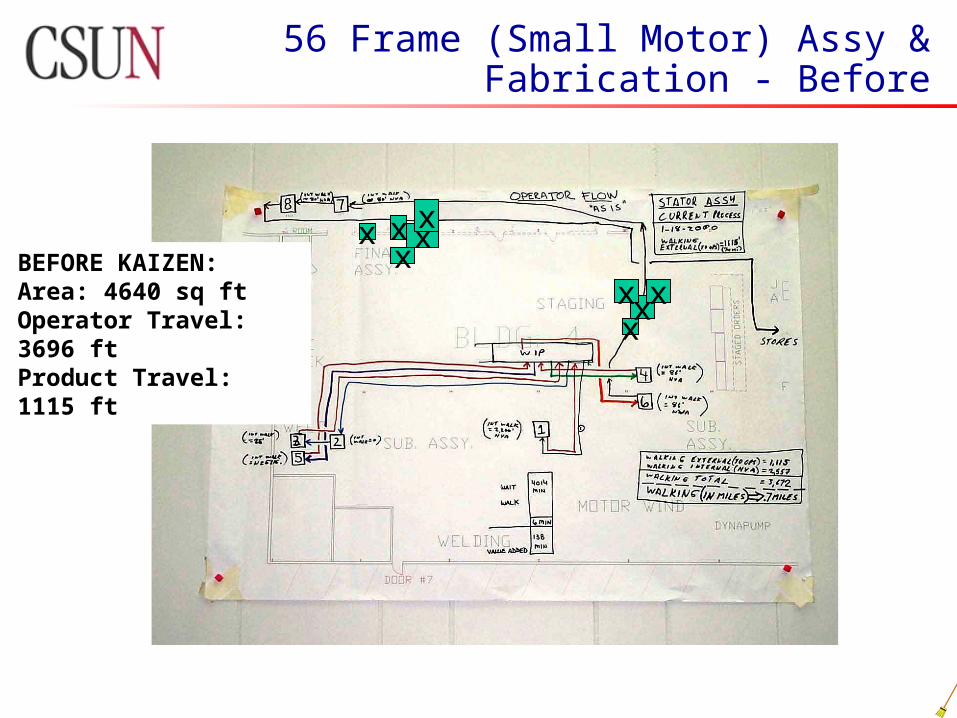
Minitab Gage R&R Statistical Output

Minitab Gage R&R Statistical Output

Capability Analysis

Process Capability Study
Cpk & Cp
•Cpk incorporates information about both the process spread and the process mean, so it is a measure of how the process is actually performing.
•Cp relates how the process is performing to how it should be performing. Cp does not consider the location of the process mean, so it tells you what capability your process could achieve if centered.

Process Capability Study

Non-normal distributions
•Use Capability Analysis (Nonnormal) to assess the capability of an in-control process when the data are from the nonnormal distribution. A capable process is able to produce products or services that meet specifications.
•The process must be in control and follows a nonnormal distribution before you assess capability. If the process is not in control, then the capability estimates will be incorrect.
•Nonnormal capability analysis consists of a capability histogram and a table of process capability statistics

Questions? Comments?