Embed Size (px)
Citation preview
The Analysis of Performance and Vulnerability of Colorado
Emergency Response Networks
By
Fadi F. Mohsen
A thesis submitted to the Faculty of Graduate School of the
University of Colorado at Colorado Springs
in Partial Fulfillment of the Requirements
for the Degree of
Master of Science in Computer Science
Department of Computer Science
2010

II
Copyright by Fadi F Mohsen 2010
All Rights Reserved

III
This thesis for the Master of Science degree by
Fadi F. Mohsen
has been approved for the
Department of Computer Science
by
_______________________________________________________
Dr. C. Edward Chow, Chair
_______________________________________________________
Dr. Jugal Kalita
_______________________________________________________
Dr. Roger Sambrook
_______________________________
Date
IV
Fadi F. Mohsen (M.S., Computer Science)
A Simulation Study of Emergency Response Networks
Thesis directed by Professor Edward Chow
The increasing demand on the internet, and the fact that the Local, State and hospitals
share the Internet bandwidth with the public put the critical health information sharing at
risk. In the last ten years, we have suffered from different kinds of flu (e.g. Avian flu,
Swine flu (H1N1)); scientists are expecting more to come. In these kinds of situations, all
the health organizations need to exchange the information to increase their situation
awareness and then to publish information to the public in the form of instructions, latest
news, and statistics. This thesis started by studying the Colorado Health Emergency
Response systems and procedures, plus investigating the actions that need to be taken in
case of an emergency like that of the pandemic flu. The focus was on the importance of
information flow and the utilization of the Internet. An Ontology framework for the US
Air Force Academy Emergency Management is built using Protégé and presented here as
a proof of concept on the importance of information flow in case of an emergency. The
above information has been collected by searching the literature, interviewing people
from the health field, attending UCCS Public Health Colloquium, and participating in an
El Paso County full-scale emergency exercise. This thesis provides a model built using
Google Earth that shows the emergency response nodes, systems, and websites. From this
model a simple network simulation model was formulated then implemented using
Network Simulator 3 (NS-3) for evaluating the adequacy of network bandwidth and
server capacity under stress. Due to the fact that the systems and the websites used by the

V
emergency nodes are spread over the US and served by different ISPs [which are
reluctant or unwilling to share network related information], it is difficult to get accurate
information about the US internet backbone. The NS-3 program was an implementation
of an oversimplified model, so its results could not be generalized. Instead, the thesis
draws some conclusions and focus on studying the counties’ websites performance and
security. The performance tests are done using a benchmarking tool called ab, whereas
the security tests are done using Nessus. The thesis has analyzed the importance of these
websites as part of an emergency management process. The performance and security test
results show:
1. The relation between performance and hosting location: Websites’ performance is
affected by the hosting locations, the average speed for the in-state hosted
websites is six times the out-state hosted websites. The relation between the
security and hosting party: Websites’ security is affected by hosting party; the
number of risks is 11 times higher for the websites hosted with the private sector
versus those hosted with the non-private sector.
An architecture was proposed for a secure responsive hosting solution based on the LVS
load balancing technique. The solution provides a secure and fast hosting environment
for the health agencies’ systems and websites.
VI
Acknowledgements
I would like to take the opportunity to sincerely thank Dr. Edward Chow for the support, effort, and the valuable time he has spent supervising me, and for the direction to guide me through the challenging coursework I have taken with him.I would like to thank Dr. Roger Sambrook for the encouragement he has provided, and the direction to guide me through my work at NISSSC. I would like to thank Dr. Jugal Kalita for the insightful thinking he has given me through his comments on my proposal.
VII
Table of Contents
Abstract
………………………………………………………………...
VI
Acknowledgment ……………………………………………………...
IX
Table of Contents ……………………………………………………..
X
List of Figures …………………………………………………………
XIII
List of Tables ………………………………………………………….
XIV
Appendices …………………………………………………………….
XIV
Chapter 1 Introduction 1 1.1 Related Work …………………………………………………………………...
3 1.2 Background ……………………………………………………………………..
5 1.3 Emergency Management ………………………………………………………..
5 1.4 Information Sharing …………………………………………………………….
8
Chapter 2 USAFA Emergency Management Ontology
12
2.1 Ontology ………………………………………………………………………...
12 2.2 USAFA Problem Description …………………………………………………..
15 2.3 Creating Classes ………………………………………………………………...
18 2.4 Creating Slots …………………………………………………………………...
19
VIII
2.5 Slots Facets ……………………………………………………………………..
19 2.6 Adding Instances ………………………………………………………………..
20 2.7 Creating Queries ………………………………………………………………..
21
Cheater 3 US Health Organization & Structure ………………
24
Chapter 4 Colorado Health Emergency Network ……………
27
4.1 NS-3 Introduction ………………………………………………………………
27 4.2 NS-3 Model ……………………………………………………………………
28 4.3 NS-3 Experiments ………………………………………………………………
38 4.4 Conclusion ……………………………………………………………………...
41
Chapter 5 Technical Work 43 5.1 Health Emergency Network’s Nodes …………………………………………...
44 5.2 Emergency Systems …………………………………………………………….
45 5.3 Websites’ Hastings & Locations ………………………………………………..
45 5.4 Nodes’ Interactions……………………………………………………………...
48 5.5 Websites’ Analysis ……………………………………………………………...
49
Chapter 6 Performance & Security Analysis ……………………….
51
Chapter 7 A proposed Solution ………………………………………
58
7.1 Introduction ……………………………………………………………………..
58 7.2 LVS ……………………………………………………………………………..
58 7.3 LVS & Health Emergency Network ……………………………………………
59 7.4 LVS Load Balancer ……………………………………………………………..
62
Chapter 8 Lessons Learned …………………………………………..
63

IX
8.1 Field Research …………………………………………………………………..
63 8.2 Building the First Model ………………………………………………………..
64 .3 The Proposed Solution ………………………………………………………….
64
Chapter 9 Future Work ………………………………………………
65
Chapter 10 Conclusions ………………………………………………
67
References ……………………………………………………………..
69
List of FiguresFigure 2.1 AFA Systems 6
Figure 2.2 Protégé Classes 16Figure 2.3 Protégé Slots 18Figure 2.4 Protégé Slots Facet 19Figure 2.5 Protégé Instances 20Figure 2.6 Protégé Query 21Figure 3.1 USA HHS Structure 22Figure 3.2 U.S. 10 Regions list 25Figure 3.3 U.S. 10 Regions map 26Figure 4.1 NS-3 Basic Components 26
X
Figure 4.2 Google Earth Model 29Figure 4.3 Qwest IP Network Statistics Tool. 30Figure 4.4 Simple Model for Colorado Health Emergency Network 31Figure 4.5 The Run’s Delay Disparity 34Figure 4.6 Run’2 Lost Packets Disparity 39Figure 5.1 81Solutions Website (www.81solutions.com) 41Figure 5.2 the closest point obtained using Google Maps 46Figure 5.3 Colorado Local Health Departments’ Websites’ Hosting Locations. 46Figure 5.4 Colorado Hospitals’ Websites’ Hosting Locations. 47Figure 6.1 Nessus scan results on the local health department’s websites. 48Figure 6.2 ab sample results 52Figure 6.3 ab command results on the 17 largest population counties 55Figure 7.1 A Proposed Solution Structure 60

XI
List of Tables
Table 4.1 The Values Obtained From Qwest IP Network Statistics. 32Table 4.2 Calculated Lines Bandwidth between different major cities. 33Table 4.3 NS-3 values 38Table 4.4 NS-3 Log Analysis 41Table 5.1 Health Emergency Internet related actions. 49
<right after references>Appendices
Appendix A 73A.1 Local Helath Departments' Websites' Hosting Location 73A.2 Hospitals' Websites' Hosting Location 73A.3 Local Health Departments' Websites' Hosting Party 74A.4 Hospitals' Websites' Hositng Party 74Appendix B 76B.1 Downloading Google Earth 76B.2 Installing Google Earth 76B.3 Starting Google Earth 77B.4 Opening kml and kmz files 78Appendix C 79C.1 Subscribe to Plugin Feed 79C.2 Download Nessus 79C.3 Starting Nessus Server 80C.4 Starting Nessus Web 81
XII
C.5 Exploring Nessus 81C.6 Nessus During A Scan 82C.7 Short Report 82Appendix D 83D.1 Downloading and Installing Protege 83D.2 Running AFA Ontology 83D.3 Exploreing Protege 84Appendix E 85E.1 Download NS-3 85E.2 Running NS-3 Code 85E.3 NS-3 Output 86E.4 NS-3 Code 86
Chapter 1
Introduction The usage of the internet has grown dramatically the last ten years until it became a
vital part in our daily lives. Education, business, and even entertainment rely heavily on
the Internet. Nowadays, internet plays an important role in the emergency response
operations as well, by providing the space through which most of the information can go
through. The faster the information can go through, the more likely lives can be saved,
since the information helps people to be aware of the situation and react positively
accordingly. Much of the U.S critical infrastructure is potentially vulnerable to cyber-
attack. Critical infrastructure is defined in the USA PATRIOT Act as those “systems and
assets, whether physical or virtual, so vital to the United States that the incapacity or
destruction of such systems and assets would have a debilitating impact on security,
national economic security, national public health or safety, or any combination of those
matters.” [USA PATRIOT 2001]. The emergency response systems tend to achieve high
coordination among the different parties which are involved in the incident recovery.
These systems tend to support the incident recovery in two main ways:
2
First of all, it supports the information sharing; terrorist attacks, natural disasters,
and large scale and organized criminal incidents require advanced information sharing
capabilities. Moreover, enterprise wide information sharing is also required to support the
anti-terrorist operations according to the National Information Exchange Model [NIEM
2007]. And this could be applied to health emergencies, according to the World Health
Organization; the contamination of food for terrorist purposes is a real and current threat.
Secondly, it helps the decision makers by providing them with complete, on time,
accurate, and relevant information. In a pandemic flu situation, hospitals, local, state, and
federal health departments need to exchange information about the situation such as
number of reported cases, severity, and affected areas, etc. This helps making better
decisions such as closing the schools, canceling all the air trips to the infected areas etc.
Researchers have been investigating several kinds of models and methodologies to make
the information sharing real and effective [Baja and Ram 2007, Bharosa et al. 2009, Lee
and Rao 2007]. Others studied the survivability, resiliency, and protection of critical
infrastructure which includes the systems and networks [Ellison et al. 2002, , Dekker
2005, Schintler et al. 2007]. A notable addition from emergency and health people in this
course is illustrated here [Potter et al. 2004].
This study is to model the information flows between the health units during a
pandemic flu and to simulate part of it. Simulation has been chosen as the thesis method
because it offers great insight in the communications inner workings and details [Jha, and
Wing 2001, Chen et al. 2002, Woltjer et al. 2006]. But most of the above studies and
methodologies have been conducted and tested in automatically generated networks or in
a lab.
3
In this research, a model for the network between Colorado health units is
formulated using their actual physical locations, and their server’s physical locations. The
information and knowledge about their communications are collected by searching the
literature, interviewing people from the field, attending an UCCS Public Health
Colloquium, and participating in an El Paso County full-scale exercise. The UCCS Public
Health Colloquium has taken place between March 23-25, with the aim of understanding
and utilizing information in public health emergency. The El Paso County full-scale
exercise or the “NOAA’s ARK” exercise took place on June 5 and its objectives were to
focus on evaluating emergency response procedures, identifying areas for improvement,
and achieving a collaborative attitude. The simulation environment that is used for
translating the conceptual model into the simulation model is NS 3 [Azadehdel et al.
2009]. The last part of the thesis focuses on studying Colorado counties websites from
performance and security perspectives.
In this thesis an Ontology for USAFA (United States Air Force Academy)
Emergency Management is built, the steps that were followed to build this Ontology are
identical to those used in building Colorado Health Emergency Networks model. The
results obtained from applying these steps in the USAFA case were captured using the
Protégé, whereas using Google Maps in case of Colorado Health Emergency Networks.
The two models could be then used to conduct simulation studies. For example, based on
the USAFA Emergency Management Ontology, a simulation study can be done to test
the effect of removing or changing any of the elements on the Emergency Management
operations. For the Colorado Health Emergency Networks model, a simple model was the
created and implemented using NS-3 to test the network survivability. The results
4
showed that accurate results could not be obtained because of the complexity that turned
the focus to the end nodes, e.g. websites, systems, performance and security.
The success and direction of a research depends on information availability, in the
case of USAFA Emergency Management, information were available and accessible
because of a contract between the University of Colorado at Colorado Springs and
USAFA. This contract made accessing the information, interviewing people and using
the systems possible and convenient. In the case of Colorado Health Emergency
Networks limited information was available, getting them was not easy. The Emergency
Management for USAFA and Colorado Health has many similarities, e.g. systems,
connections and interactions. The thesis realized this similarity and used the USAF
Emergency Management study conclusions to analyze the Colorado Health Emergency
Networks but instead of building Ontology which was part of a contract in case of USAF,
Google Earth model was built. Building an ontology for Colorado Health Emergency
Networks based on the analysis conducted in this these could be done easily, but there
was no need for it.
1.1 Related Work
When I started searching the literature, I ran into a deadlock state. I found so many
resources, different titles, purposes and approaches. It was like travelling across desert
with no clear direction. I was looking for a suitable title to unify all of the works, papers,
and experiments I have found. Finally, I found that title which is “Building an Integrated
System for Emergency Response Operations”. Having this title in consideration, each
5
work I found can fit. The work here as well goes underneath that title because it helps to
explain the information flow in case of a pandemic flu outbreak. The information flows
between local health departments, and hospitals, and between the local health
departments and the public. Some of the related works to this thesis were by Wiechers et
al. 2004, Burstein and Diller 2004 and Bharosa and Lee 2009, Dirk et al. 2009 . The
thesis focus is on the Information flow within the health networks domain. The study
provides many conclusions about potential risks and difficulties in the current networks
and draws some suggestions and opportunities to enhance and to fix them. . The thesis
provides the basis for more studies to follow as it offers the collected information in a kml
and xml file extension. The thesis provides a case on using ontology in emergency
management.
The proposed approach has many essential benefits over the approaches suggested
by the literature.
The thesis used an actual domain and environment; the results then can be mapped to
other places. The thesis’ main focus is on the information flow between health
departments and discards the other agencies, such as the FBI or police, for two reasons:
first of all, the proposed scenario is a pandemic flu outbreak and most likely the local
health departments and hospitals are the most involved parties. Second, the thesis, by
limiting its scope, avoids dealing with political issues, since cross-agency information
sharing is still in progress and has a lot of difficulties. The thesis’ main focus is to grab
peoples’ attention to the communication problem that may affect the flow of information
during a pandemic flu. This thesis is going to help in developing a system that uses the
latest technology mentioned as a suggestion to better communicate during a hazard. My
6
work will result in a basic idea for future works to come since I have kept the thesis data
(addresses, ip, websites, etc. ) in an xml and kml format that are easy to share and r-use.
The model can be easily extended, as more information becomes available, and can be
easily added to the model.
1.2 Background
Past history has shown that the lack of information sharing amongst the various
agencies in an emergency situation and that caused harm and lose. Information sharing
has been poor and needs improvement as this is the core of emergency management.
1.3 Emergency Management
Emergency management and hazard recovery systems are essential components in
today’s communications throughout the world [Tarchi 2009]. These systems consist of
different parts: e.g., communication means data warehouses, maps, and data integration
engines. These systems tend to achieve high coordination between the different parties
that are involved in the incident recovery. The aim of these systems can be illustrated in
three words: avoidance, response, and recover. Risk avoidance can be achieved by
planning ahead. Managers develop plans of action for when the disaster occurs. These
plans include personal training, systems testing, and exercising. The response phase
includes the recalling of the required emergency tools, personal, and first responders in
the affected area. The last phase is the recovery phase. The aim of this phase is to restore
the affected area to its previous state. Recovery efforts are mainly concerned with actions
that involve rebuilding destroyed property, re-employment, and the repair of other
7
essential infrastructure. Emergency management systems vary in their capabilities and
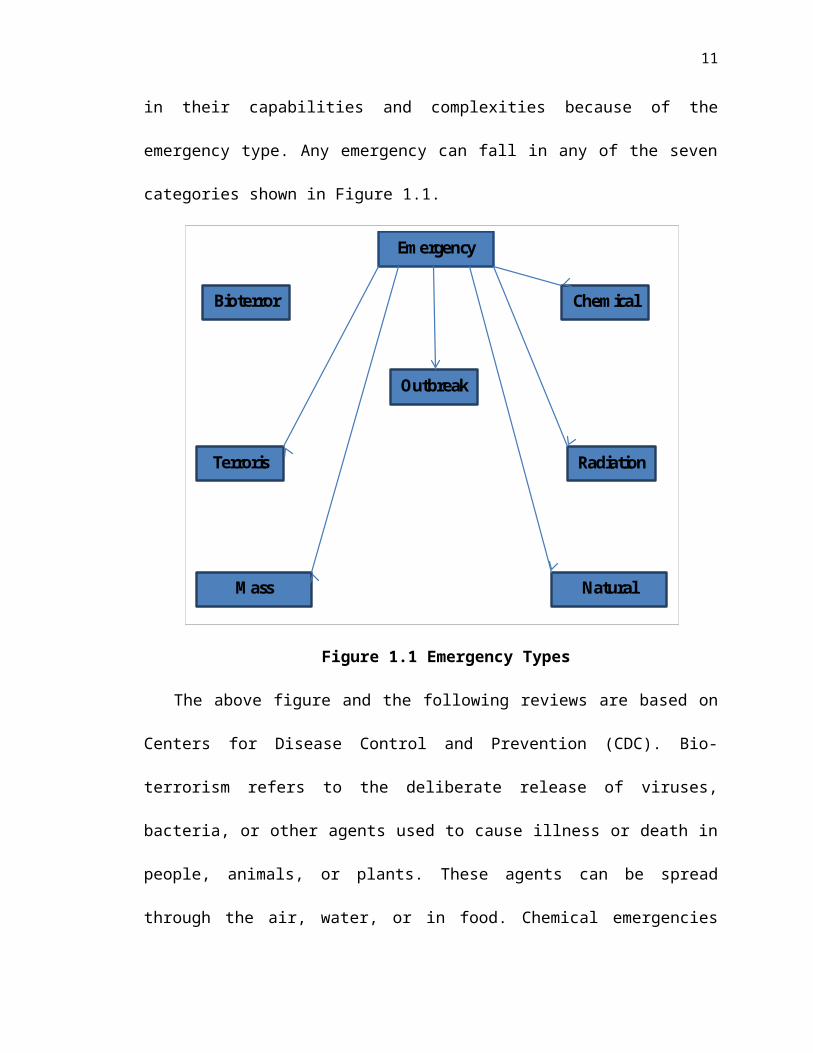
complexities because of the emergency type. Any emergency can fall in any of the seven
categories shown in Figure 1.1.
Emergency
Terrorism
Outbreaks
Radiation
Natural Disasters
Mass Casualties
Chemical Bioterrorism
Figure 1.1 Emergency Types
The above figure and the following reviews are based on Centers for Disease
Control and Prevention (CDC). Bio-terrorism refers to the deliberate release of viruses,
bacteria, or other agents used to cause illness or death in people, animals, or plants. These
agents can be spread through the air, water, or in food. Chemical emergencies occur
when a hazardous chemical is released and the release has the potential for harming
people’s health. Mass Casualties refer to incidents such as fires, explosions, mass transit
accidents, such as train crashes or bridge collapses, which cause numerous deaths and
injuries. Natural disasters refer to such natural occurrences as earthquakes, extreme heat,
8
floods, hurricanes, landslides and mudslides, tornadoes, tsunamis, volcanoes, wildfires,
and winter weather. Outbreaks refer to flu epidemics, viruses, or other contagious
diseases and can also include food-borne outbreaks such as salmonella or E. coli.
Radiation emergency could be a nuclear power plant accident or a terrorist event such as
a dirty bomb or nuclear attack, which would expose people to significantly higher levels
of radiation than are typical in daily life, leading to health problems such as cancer or
even death. Terrorism refers to a deliberate act of murder and destruction which disrupts
infrastructure and is directed towards civilians with the aim of meeting a political end.
The study here focuses on the Outbreak emergency, specifically the case of epidemic flu.
Regardless of the emergency type, the emergency management systems have to achieve
high coordination between the agencies involved by sharing the right information in the
right time which in turn results in making the correct decisions.
1.4 Information Sharing
Terrorist attacks, natural disasters, and large-scale and organized criminal incidents
require an advanced nation’s information sharing capabilities. Moreover, enterprise-wide
information sharing is also required to support the anti-terrorist operations (Introduction
to the National Information Exchange Model [NIEM 2007]. As the importance of
information sharing in the above cases cannot be denied, information sharing is also
important in other situations, like in the case of epidemic flu, for example. In the
epidemic flu scenario, reports, news, and instructions have to be exchanged to help the
9
people in charge to make decisions and to spread the awareness between Inhabitants.
Besides its importance, information sharing has triple axes: politics, methods, and
survivability.
Politics comes from the fact that information should happen between different
agencies where each agency has different objectives, polices and operational
environments. The results from a preliminary study by Lee and Rao 2007 revealed that
the current inter-agency information sharing systems in use does not reflect social and
operational environments of emergency management organizations. The study
administered a survey questionnaire to emergency responders such as law enforcement
personnel, intelligence agents, firefighters, emergency medical staffs, and other
government employees in the emergency management’s area. One important way of
agencies’ collaboration according to Degwekar and DePree 2007 is to share not only
data, but also human and organizational knowledge useful for decision support, and
problem solving and activity coordination. The politics axis is the most complicated and
presently it has not been resolved. The colloquium, large scale exercise, and the interview
with the Elpaso County personnel assured that Therefore one must rely on the methods
and survivability axes to resolve those issues.
The methods are the set of technologies and tools that have been used to approach
cross-agencies information sharing. Extensible Markup Language (XML) for instance has
been largely used as a technology solution for cross-agency information sharing [Bajaj
and Ram 2003]. Cross-agency information sharing from the technology perspective is
the integration of structured information between heterogeneous data bases. Each agency
has its own systems, databases and applications. A tremendous amount of work can be
10
found in the literature that targets the integration issue [Hayne and Ram 1990; Reddy at
al. 1994; Larson at al. 1989; Batini at al. 1986; Hearst 1998; Ram and Park 2003; Ram
and Zhao 2001]. XML became famous when the researchers started paying attention to
the area of the integration of unstructured information, for example, free text documents
between heterogeneous information sources [Bajaj and Ram 2003]. Khare and Rifkin
1997, Sneed 2002 and Glavinic 2002 have pointed out the advantages of the XML as a
means of adding varying degrees of structure to information, and as a standard for
exchanging information over the WWW [Bajaj and Ram 2003]. More information
sharing technologies to be mentioned here are schema matching [Dhamankar et al. 2004;
He and Chang 2004], data privacy [Agrawal et al. 2003; Zhang and Zhao 2005], and
schema mapping [Pantel et al. 2005; Yu and Popa 2005].
Survivability is the last axis discussed here. Emergency Response Network
survivability is the ability to continue functioning under an attack or pressure. Attacks
can be of two types: insider attacks and outside attacks. Insider threats tend to cause more
harm and losses. According to a survey done by CERT the loss resulting from insider
attacks is much bigger than any other attacks. An Insider is a legitimate user who acts
against a running system. This act mostly happens as a kind of revenge. An employee
who is about to lose his job may run an insider attack to steal confidential information or
just harm the system; whereas outside attacks are those launched from remote computer
and targeting servers, routers, and links. The above mentioned attacks could happen
against health agencies and departments and for this reason the thesis conducts some
security tests. The pressure can be an issue and might be on the servers (websites),
routers and links. Most if not all of the health agencies and departments are sharing the
11
public internet bandwidth which is an uncontrolled unpredictable environment. In case of
an emergency, ambulances use the public streets, but in a controlled fashion. Switching
the siren on is enough for the public to clear the roads for the ambulances plus the ability
of using the police for this purpose or even controlling the traffic lights. Is that possible in
the internet world? For instance, emergency related data could be forwarded in high
priority. That is possible but requires some changes to be made on local health
department’s internet connections.
The rest of the thesis is organized as follows: Chapter 2 presents the USAFA
Emergency Management’s Ontology. Chapter 3 describes the US Health Organization
and Structure. Chapter 4 examines Colorado Health Emergency Networks and relations.
Chapter 5 focuses on the methods and techniques used to accomplish this work. Chapter
6 gives the performance and security analysis. Chapter 7 proposes a solution for the
identified problems. Chapter 8 highlights the lessons learned. Chapter 9 sketches the
future work. Chapter 10 offers conclusions.
12
Chapter 2
USAFA Emergency Management Ontology
2.1 Ontology
Ontology is defined [Neches et al., 1991] as a set of basic terms and relationships of
a vocabulary within an area or subject. In Emergency Management, the terms or entities
are: people, infrastructures, communication devices, and emergency response systems.
Ontology also includes rules to combine terms and relations that extend the vocabulary.
A rule can be, for instance stated as: “when a fire is occurring in a building we know that
we should communicate with people by audio notifications instead of visual ones since
smoke can reduce visibility, but also that we could use the same kind of alert for
compensating disabilities, e.g. alerting blind users of a critical or dangerous event”
[Malizia et al., 2009]. Ontology has been used in many fields, such as Software
13
Development Life Cycle (SDLC), Security, and others. Ontologies are used through the
Software Development Life Cycle (SDLC starting from the analysis and design and
ending with the deployment ), [Happel and Seedorf, 2006]. In the analysis and design
phase, ontology can be used for both, to describe requirements specification documents
and formally represent requirements knowledge. In the implementation phase, ontology is
used to narrow the gap between design and implementation. Finally, in the deployment
phase, ontology is used to provide a mechanism to capture knowledge about the problem
domain. Reasoning can then be applied to reuse this knowledge for various purposes. In
security, the ontology supports the modeling of the basic security concepts and their
relationships. The advantages of deploying the ontology are: (a) express the most
important security concepts, (b) realize the relations among the above concepts, (c)
provide a common understanding and vocabulary of security issues among application
developers, and (d) facilitate the development of secure applications [Dritsas et al.,].
Besides that, ontology has been successfully used in emergency management.
Malizia et al., 2009 has developed ontology for emergency notification systems
accessibility. Their ontology helps in automatically adapting the notification of alerts to
different kinds of users, including elderly and disabled, depending on the type of
technologies and devices they can access and considering the impact of the disaster on
alerts communication and infrastructures. Ruzhi et al., 2009 presented a solution to the
problem that resulted from keeping the emergency preplans in static text or electronic
document which is difficult for emergency decision-makers to achieve accurately and
quickly. Their solution is based on putting forward an emergency preplan knowledge
representation framework. Starting by analyzing emergency preplan textual knowledge,
14
an emergency preplan ontology was built, and finally, an emergency preplan semantic
retrieval system was implemented with the help of ontology reasoning mechanism. Xiang
et al., 2008 addressed the need for building collaborative Crisis Information Management
Systems. They used an effective ontology to establish a solid common ground for such
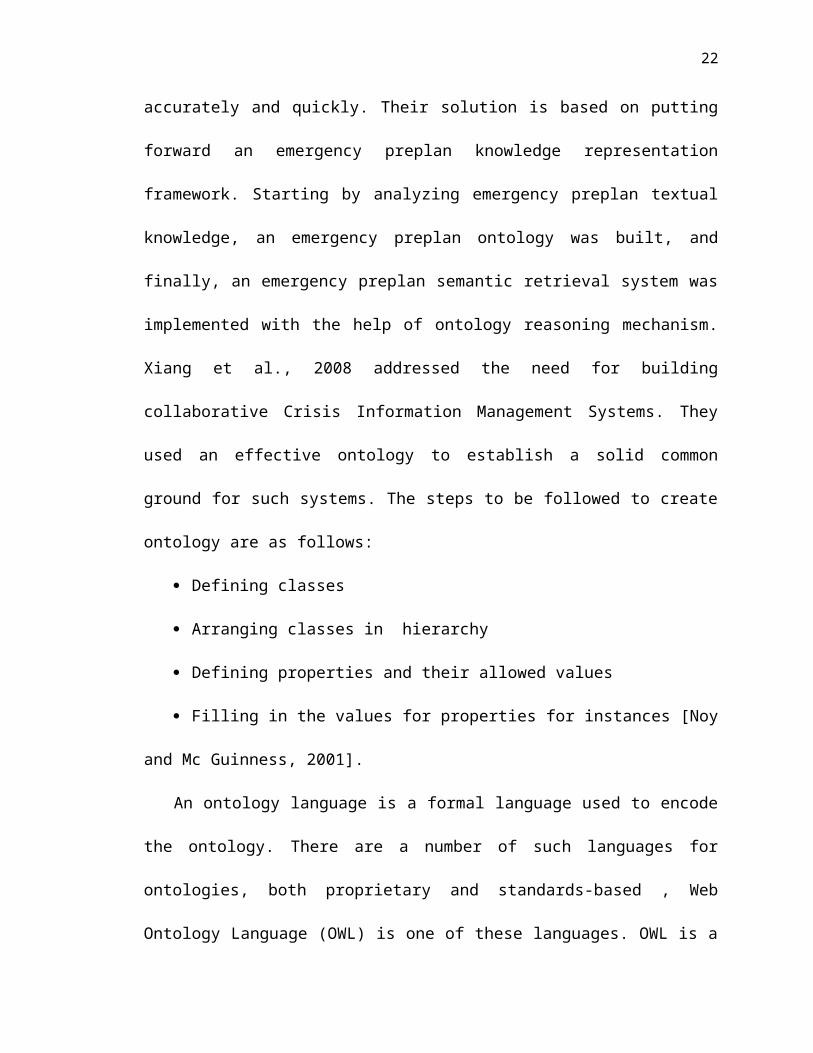
systems. The steps to be followed to create ontology are as follows:
Defining classes
Arranging classes in hierarchy
Defining properties and their allowed values
Filling in the values for properties for instances [Noy and Mc Guinness, 2001].
An ontology language is a formal language used to encode the ontology. There are a
number of such languages for ontologies, both proprietary and standards-based , Web
Ontology Language (OWL) is one of these languages. OWL is a language for making
ontological statements, developed as a follow-on from the Resource Description Format
(RDF) and RDF Schema (RDFS) , as well as earlier ontology language projects including
Ontology Interference Layer (OIL), DARPA Agent Markup Language (DAML),
DARPA in turn stands for Defense Advanced Research Projects Agency and
DAML+OIL[w3.org]. OWL is intended to be used over the World Wide Web, and all its
elements, such as classes, properties and individuals are defined as RDF resources, and
identified by URIs. The good point here is that ontology is a perfect choice for modeling
multi-agency systems because the ontology can be encoded using universal languages,
like OWL, which is basically developed from RDF, which in turn is easy to share and run
over the World Wide Web.
15
1.2 USAFA Problem Description:
The United States Air Force Academy (USAFA) realizes that an effective response
to emergency incidents requires a complex interconnection of information flows among
its sections and organizations. At the University of Colorado at Colorado Springs
(UCCS), the National Institute of Science, Space and Security Centers (NISSSC)
objectives are a clear scientific understanding of USAF emergency management and a
model for constructing and implementing effective and secure emergency management
systems. They propose to build the data dictionary assembly and then define elemental
level relationships that will form the body of a nearly completed ontological description
of incident management behavior for USAF. In the early stages, the set of all systems
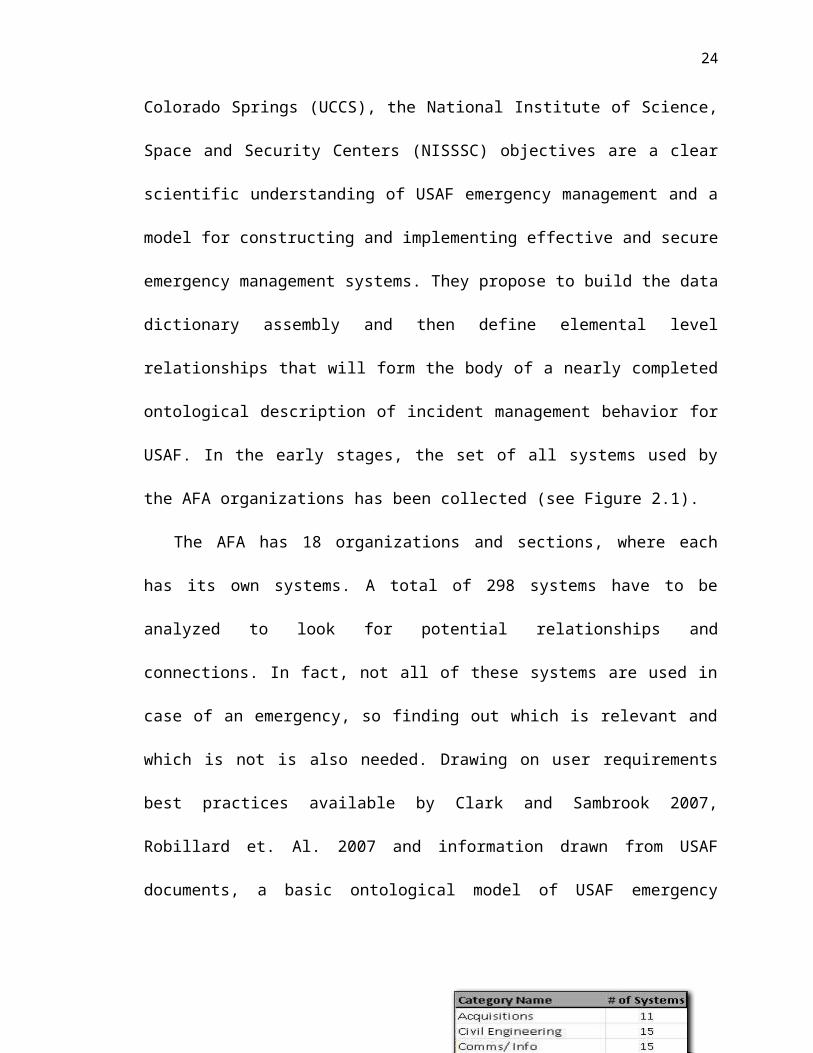
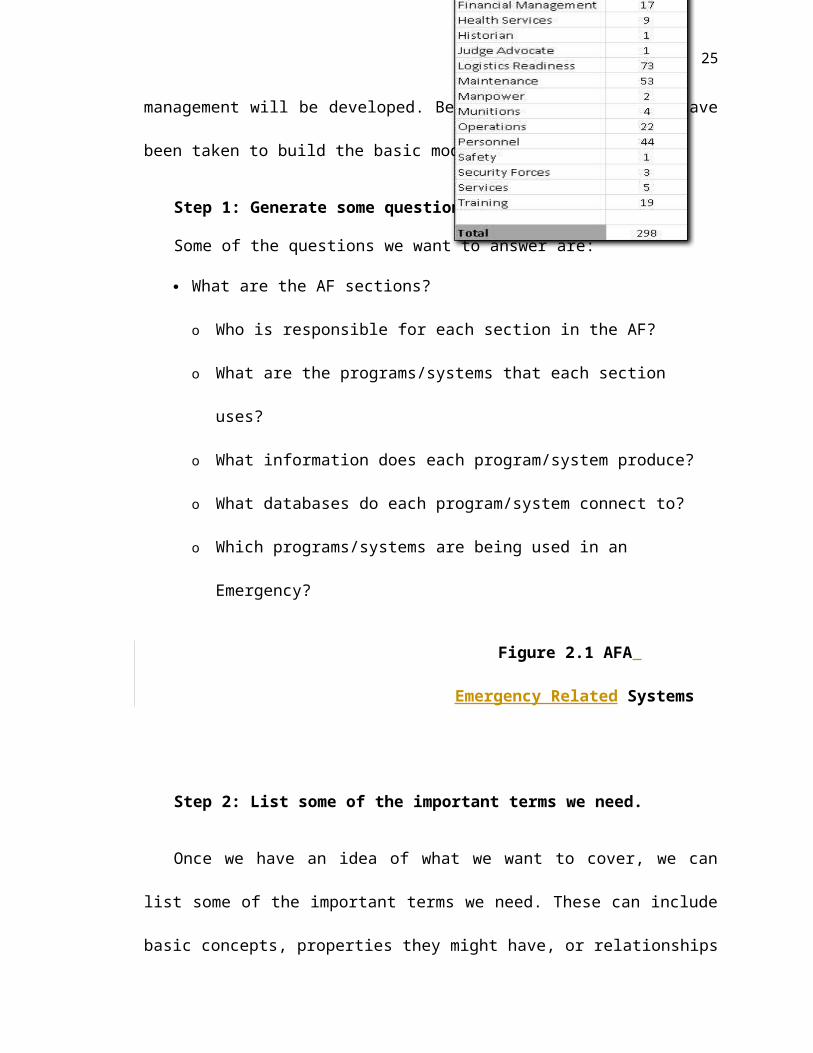
used by the AFA organizations has been collected (see Figure 2.1).
The AFA has 18 organizations and sections, where each has its own systems. A total
of 298 systems have to be analyzed to look for potential relationships and connections. In
fact, not all of these systems are used in case of an emergency, so finding out which is
relevant and which is not is also needed. Drawing on user requirements best practices
available by Clark and Sambrook 2007, Robillard et. Al. 2007 and information drawn
from USAF documents, a basic ontological model of USAF emergency management will
be developed. Below are the steps that have been taken to build the basic model:
Step 1: Generate some questions about the domain.
Some of the questions we want to answer are:
What are the AF sections?
o Who is responsible for each section in the AF?
o What are the programs/systems that each section uses?
16
o What information does each program/system produce?
o What databases do each program/system connect to?
o Which programs/systems are being used in an Emergency?
Figure 2.1 AFA Emergency
Related Systems
Step 2: List some of the important terms we need.
Once we have an idea of what we want to cover, we can list some of the important
terms we need. These can include basic concepts, properties they might have, or
relationships between them. As a start we can just collect the terms without regard to the
role they might play in the ontology.
Step 3: Categorize the different terms according to their function in the ontology.
When we have a fairly complete list, we can start to categorize the different terms
according to their function in the ontology. Concepts that are objects, such as AF
Weather or Captain, are likely to be best represented by classes. Properties of the classes,
such as Location or Responsible, can be represented by slots, and restrictions on
properties or relationships between classes and or slots, are represented by slot facets.
Protégé_3.4.4 is used to create the basic ontology. Protégé is developed at the
Stanford Center for Biomedical Informatics Research [protege.stanford.edu]. Building an
ontology using Protégé has to be in the following sequence:
Creating classes
Creating slots
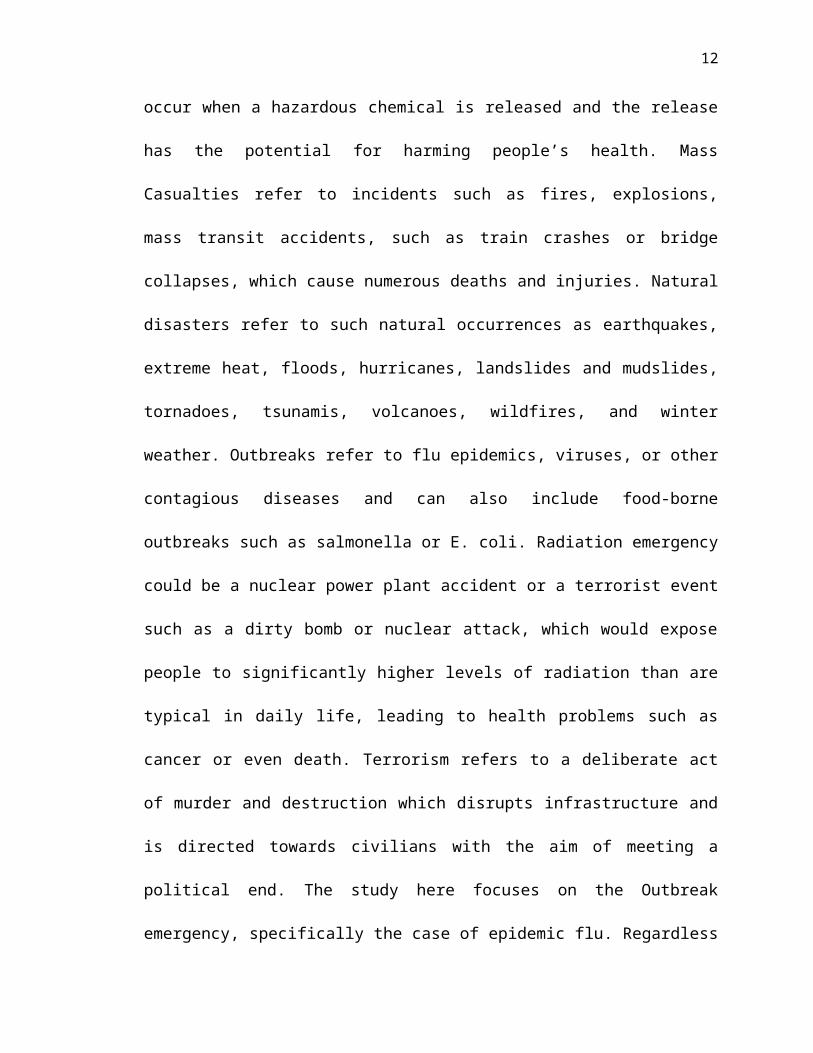
Figure 2.2 Protégé Classes
17
Creating slot facets
Entering instances
Creating a relationship between instances
Creating and saving a query
In the subsequent sections, we will go over these steps; first, we will show the
classes, the slots, and slot facets will follow. Then, we will show how to add instances,
and at the end we will show how creating and running queries can be done.
2.3 Creating Classes
In this section, we list the concepts that constitute the AFA emergency management.
These concepts should be general enough to describe the domain probably, because of
that we processed the systems first. Processing the systems has been done via identifying
every system characteristics, such as users, data, and organization.
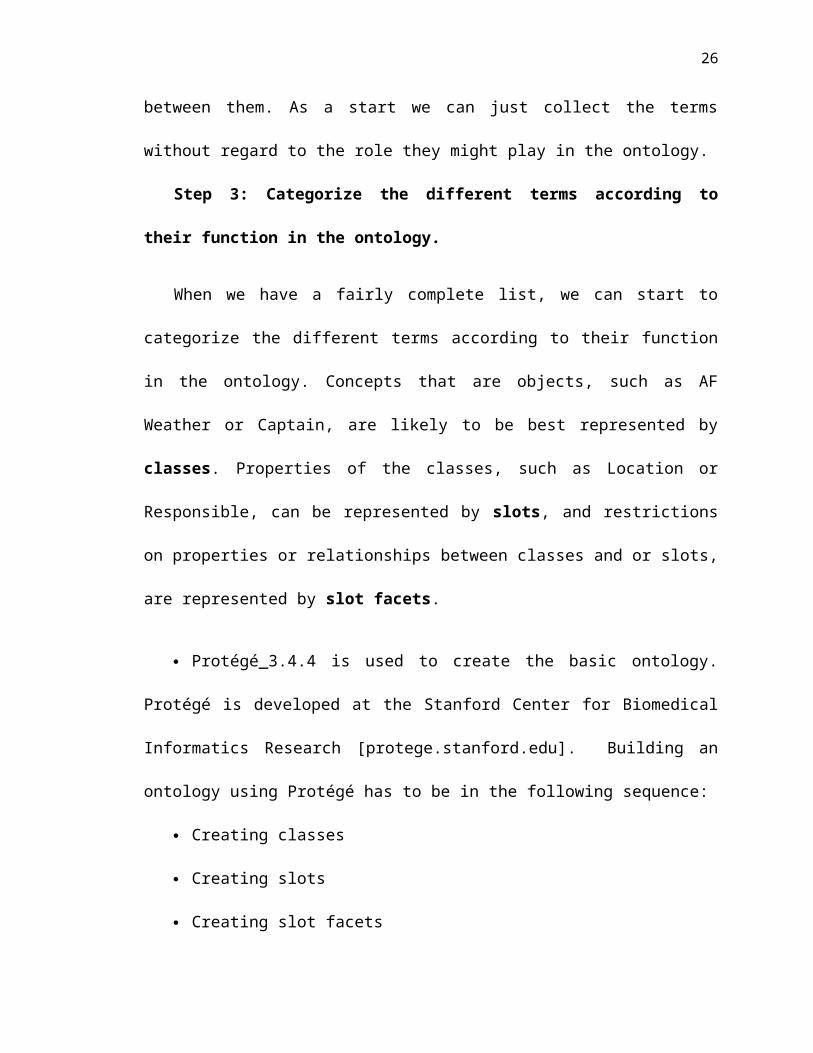
The idea behind keeping the concepts general is to accept as many instances as
possible; later on we can add more details to the basic model. The four general
Classes ((Internal_Access_Software and
External_Access_Software) and Data.
Figure 2.2 shows these classes, notice that
how every Protégé class should be a
subclass of THING class.
External_Access_Software class has two
Figure 2.3 Protégé Slots
18
super classes: THING and Software. This gives the ability to have multiple relations
between the ontology concepts.
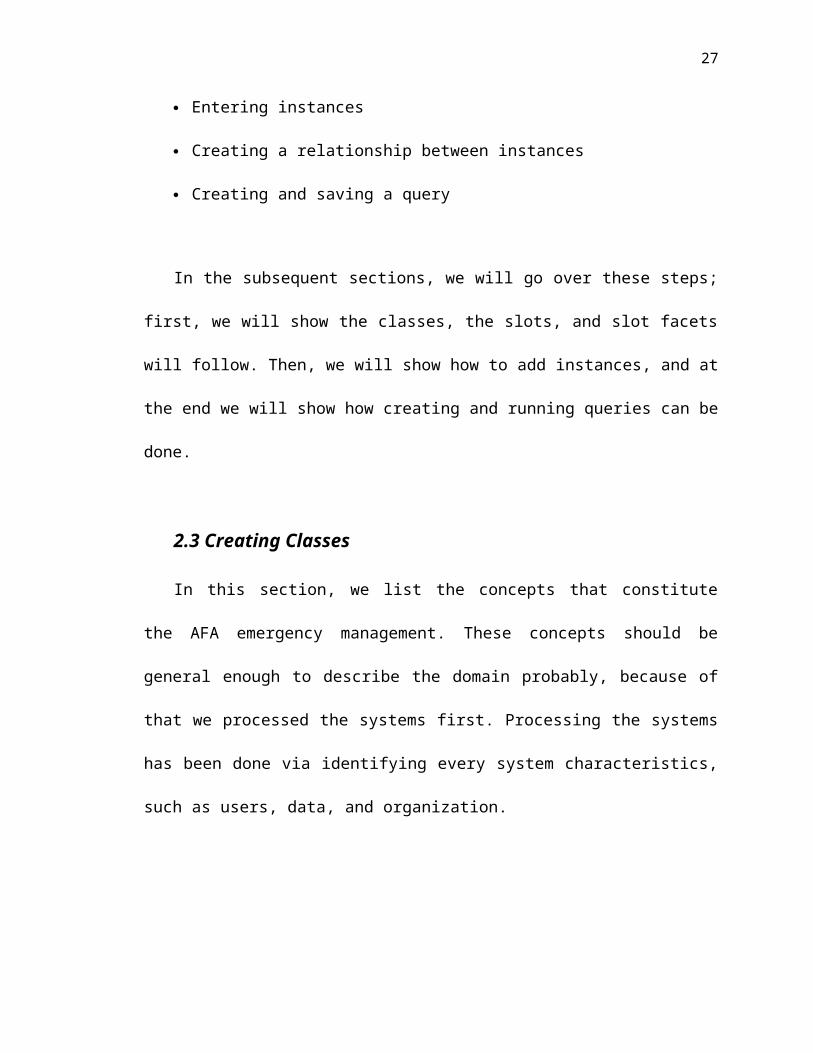
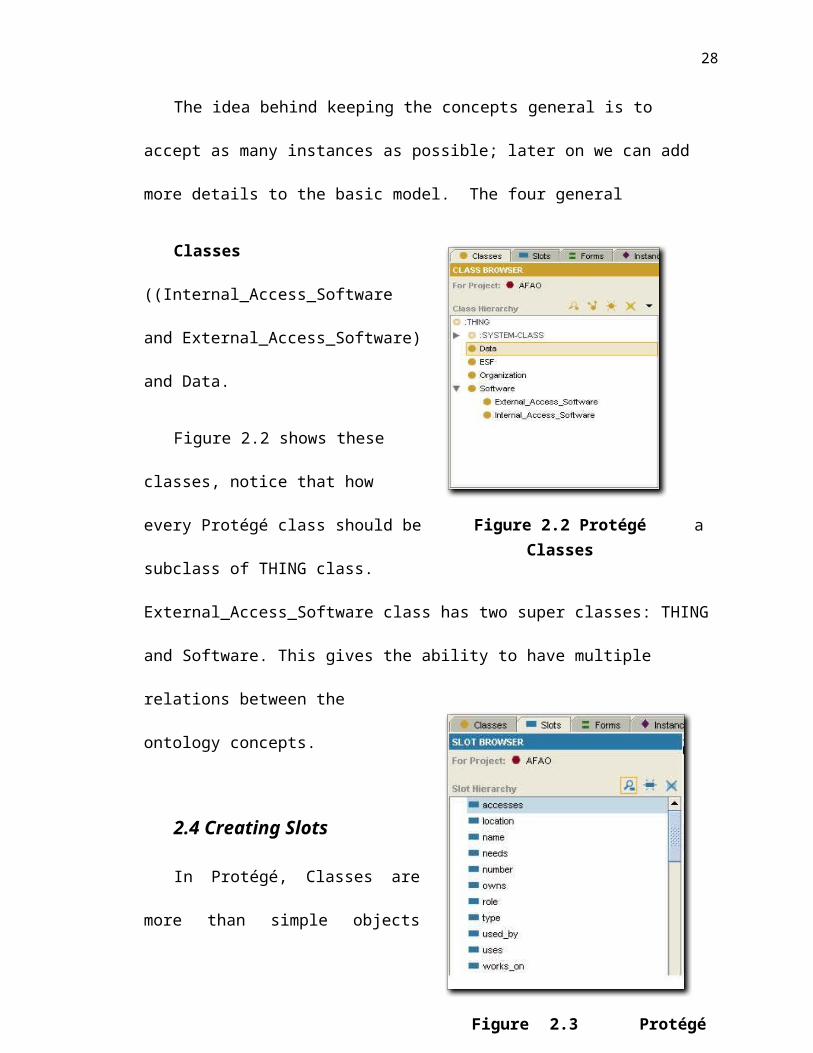
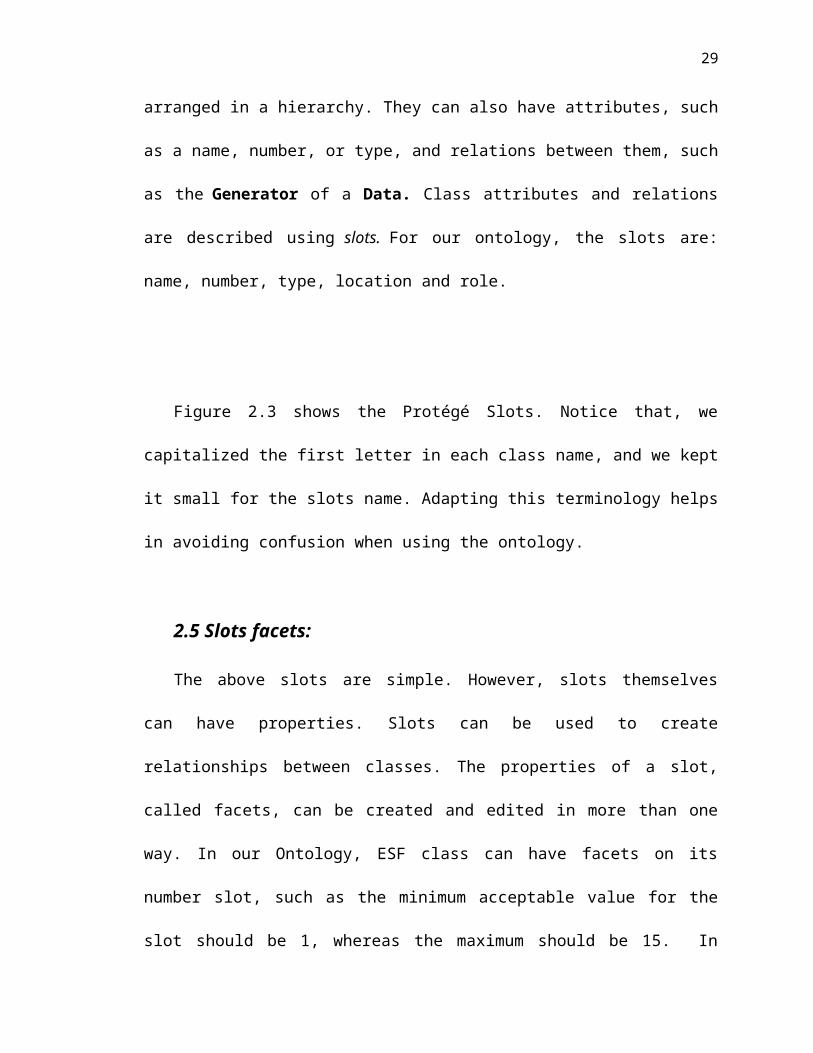
2.4 Creating Slots
In Protégé, Classes are more than simple objects arranged in a hierarchy. They can
also have attributes, such as a name, number, or type, and relations between them, such as
the Generator of a Data. Class attributes and relations are described using slots. For our
ontology, the slots are: name, number, type, location and role.
Figure 2.3 shows the Protégé Slots.
Notice that, we capitalized the first letter
in each class name, and we kept it small
for the slots name. Adapting this
terminology helps in avoiding confusion
when using the ontology.
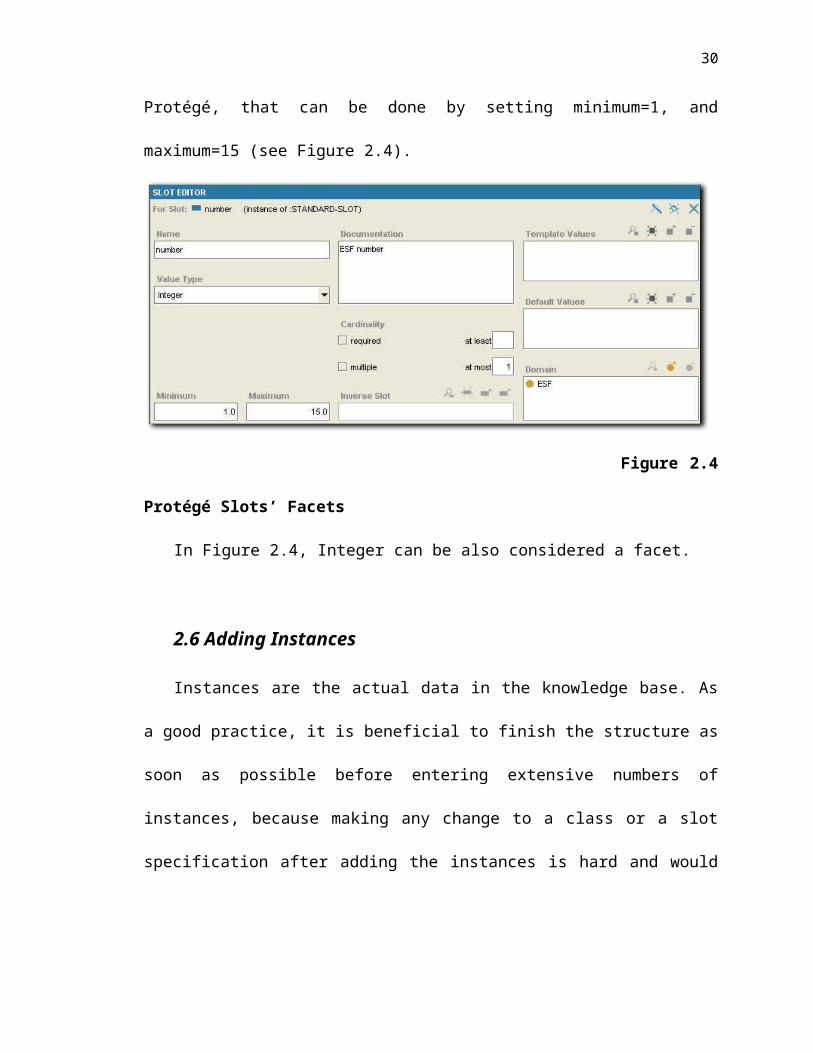
2.5 Slots facets:
The above slots are simple. However,
slots themselves can have properties. Slots can be used to create relationships between
classes. The properties of a slot, called facets, can be created and edited in more than one
way. In our Ontology, ESF class can have facets on its number slot, such as the minimum

19
acceptable value for the slot should be 1, whereas the maximum should be 15. In
Protégé, that can be done by setting minimum=1, and maximum=15 (see Figure 2.4).
Figure 2.4 Protégé Slots’ Facets
In Figure 2.4, Integer can be also considered a facet.
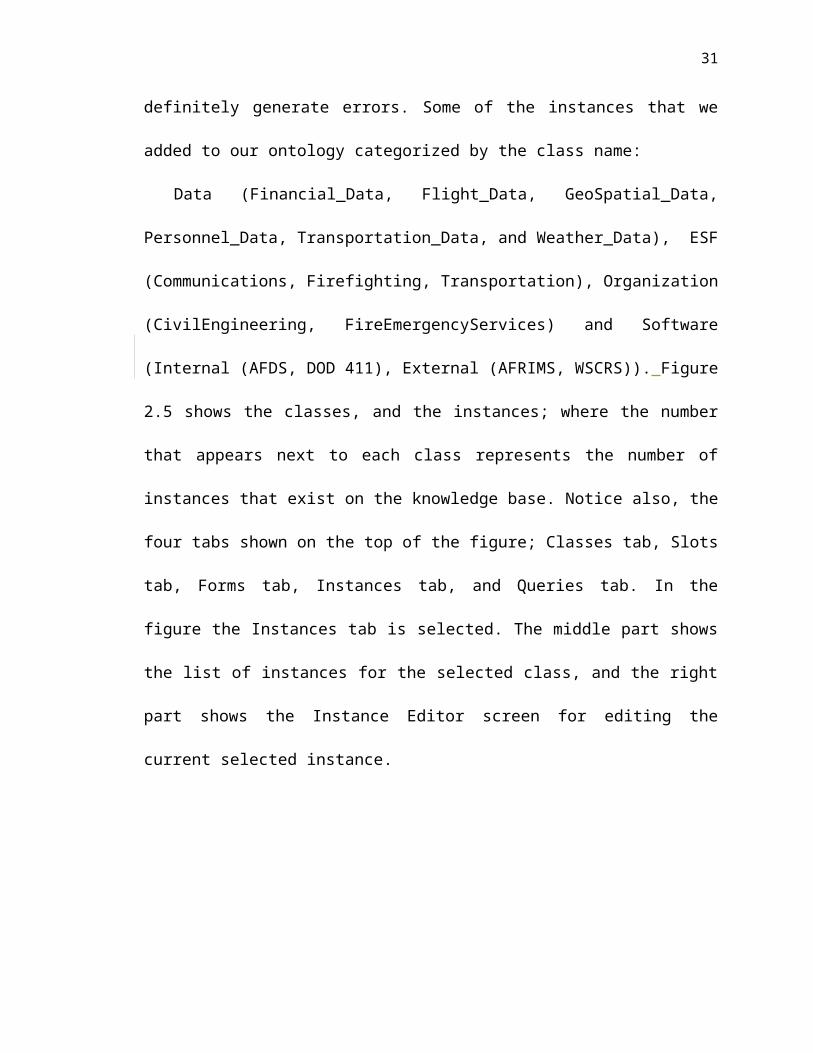
2.6 Adding Instances
Instances are the actual data in the knowledge base. As a good practice, it is
beneficial to finish the structure as soon as possible before entering extensive numbers of
instances, because making any change to a class or a slot specification after adding the
instances is hard and would definitely generate errors. Some of the instances that we
added to our ontology categorized by the class name:
Data (Financial_Data, Flight_Data, GeoSpatial_Data, Personnel_Data,
Transportation_Data, and Weather_Data), ESF (Communications, Firefighting,
Transportation), Organization (CivilEngineering, FireEmergencyServices) and Software
(Internal (AFDS, DOD 411), External (AFRIMS, WSCRS)). Figure 2.5 shows the
classes, and the instances; where the number that appears next to each class represents the
20
number of instances that exist on the knowledge base. Notice also, the four tabs shown on
the top of the figure; Classes tab, Slots tab, Forms tab, Instances tab, and Queries tab. In
the figure the Instances tab is selected. The middle part shows the list of instances for the
selected class, and the right part shows the Instance Editor screen for editing the current
selected instance.
Figure 2.5 Protégé Instances
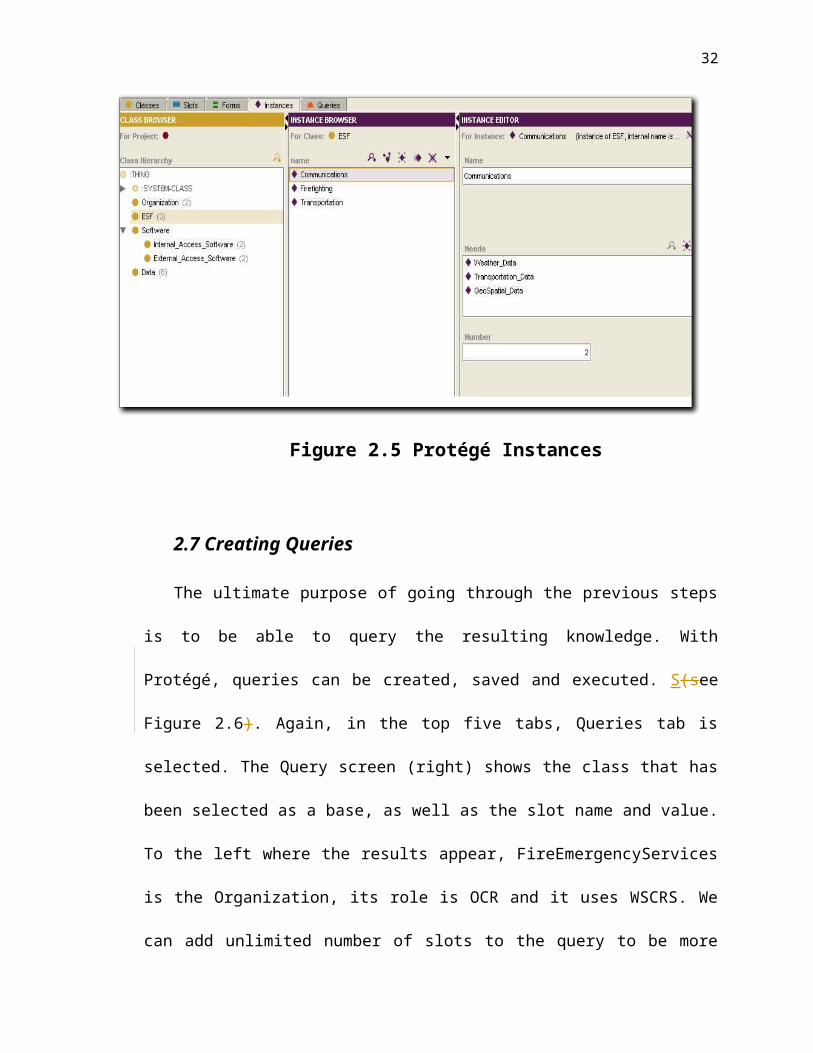
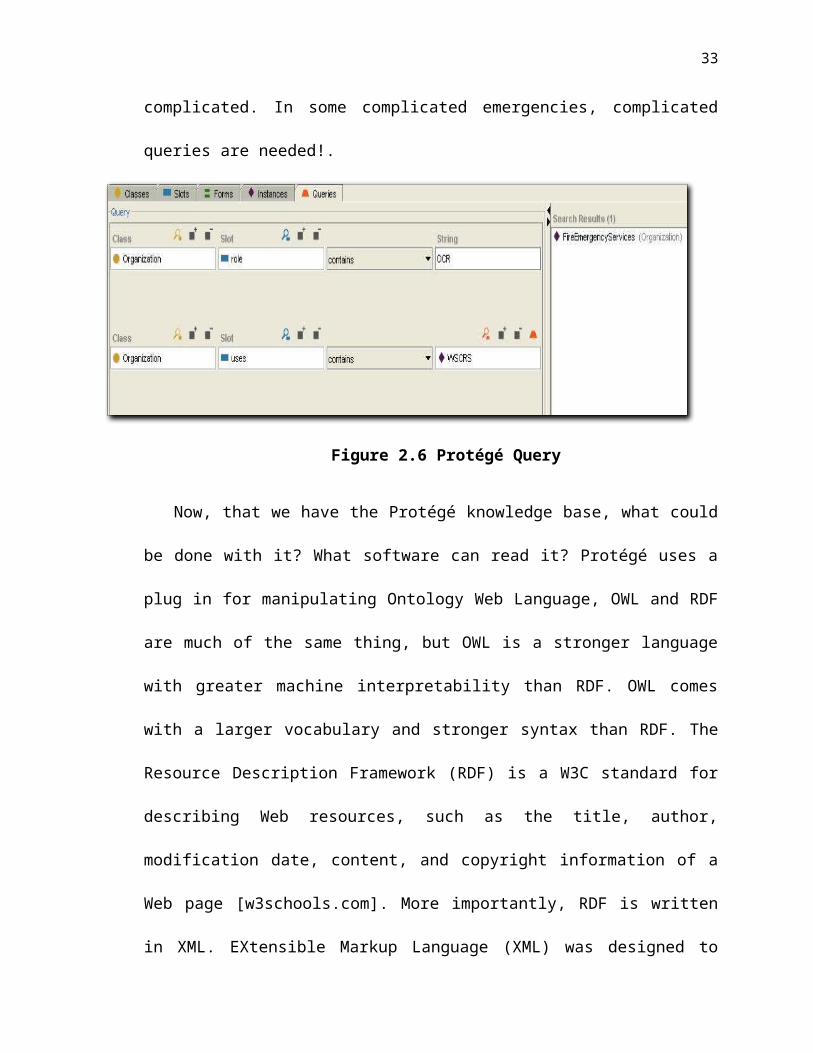
2.7 Creating Queries
The ultimate purpose of going through the previous steps is to be able to query the
resulting knowledge. With Protégé, queries can be created, saved and executed. S(see
Figure 2.6). Again, in the top five tabs, Queries tab is selected. The Query screen (right)
shows the class that has been selected as a base, as well as the slot name and value. To
the left where the results appear, FireEmergencyServices is the Organization, its role is
21
OCR and it uses WSCRS. We can add unlimited number of slots to the query to be more
complicated. In some complicated emergencies, complicated queries are needed!.
Figure 2.6 Protégé Query
Now, that we have the Protégé knowledge base, what could be done with it? What
software can read it? Protégé uses a plug in for manipulating Ontology Web Language,
OWL and RDF are much of the same thing, but OWL is a stronger language with greater
machine interpretability than RDF. OWL comes with a larger vocabulary and stronger
syntax than RDF. The Resource Description Framework (RDF) is a W3C standard for
describing Web resources, such as the title, author, modification date, content, and
copyright information of a Web page [w3schools.com]. More importantly, RDF is written
in XML. EXtensible Markup Language (XML) was designed to transport data. From this
connection, a conclusion could be made; Protégé has the ability to export the resulted
knowledge base into different formats (e.g. HTML, OWL, RDF schema, etc.), so
depending on the needed software the output can be changed accordingly. In the AFA
case, the resulted ontology exported into an XML file format, and then integrated into
Keyhole Markup Language (KML) files. KMLis an XML grammar and file format for
22
modeling and storing geographic features such as points, lines, images, polygons, and
models for display in Google Earth, Google Maps and other applications
[earth.google.com].
23
Chapter 3
US Health Organization and Structure
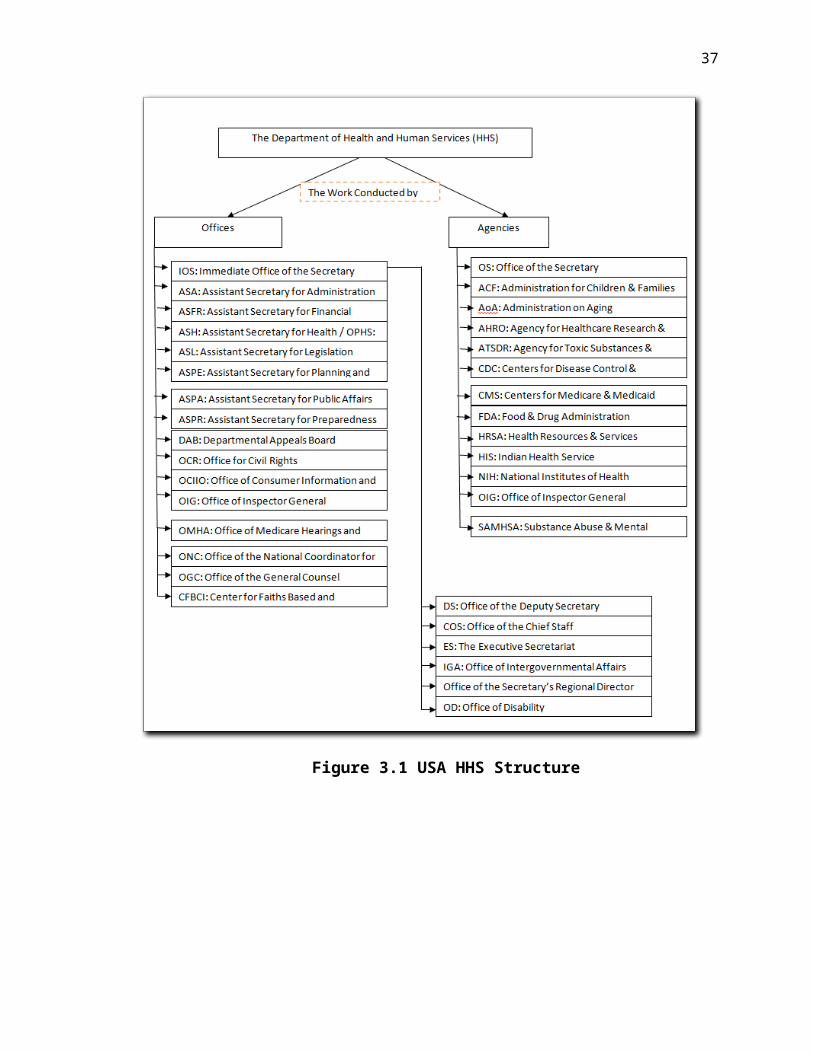
The Department of Health and Human Services (HHS) is the United States
government’s principal agency for protecting the health of all Americans and providing
essential human services, especially for those who are least able to help themselves. The
work of HHS is conducted by the Office of the Secretary and 11 agencies (see Figure
3.1). The agencies perform a wide variety of tasks and services, including research,
public health, food and drug safety, grants and other funding, health insurance, and many
others.
Offices are that subdivisions of the office of the secretary provide direct support for the
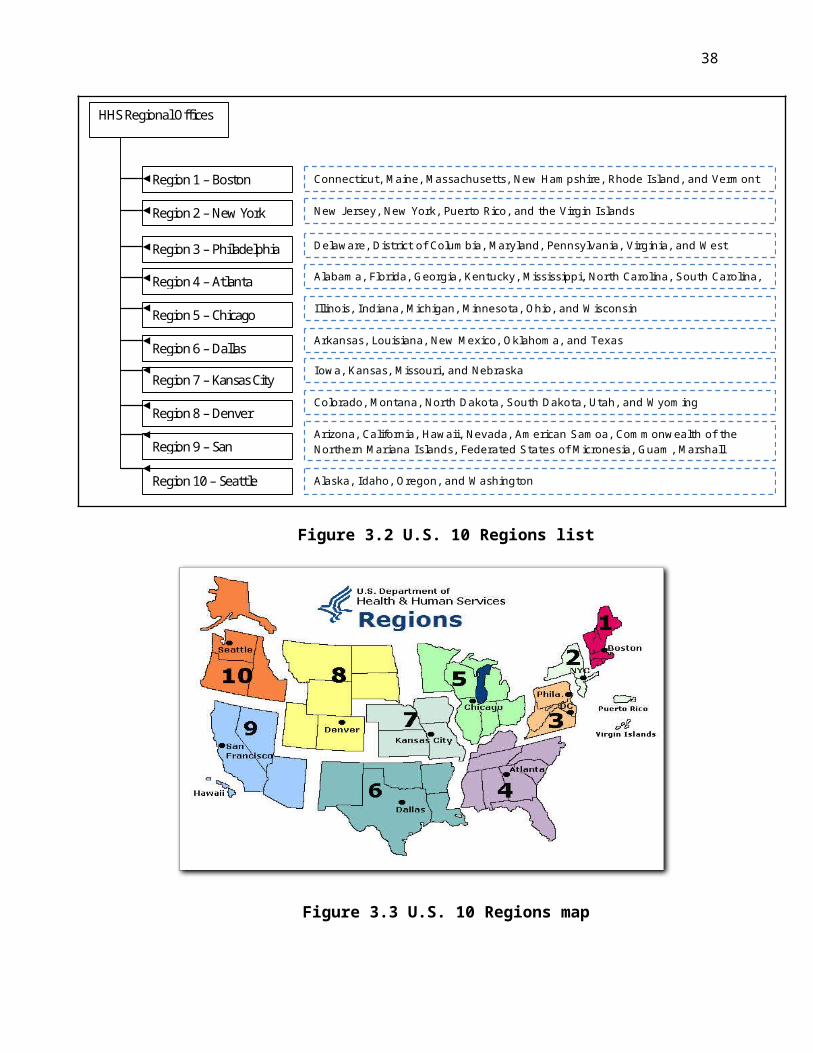
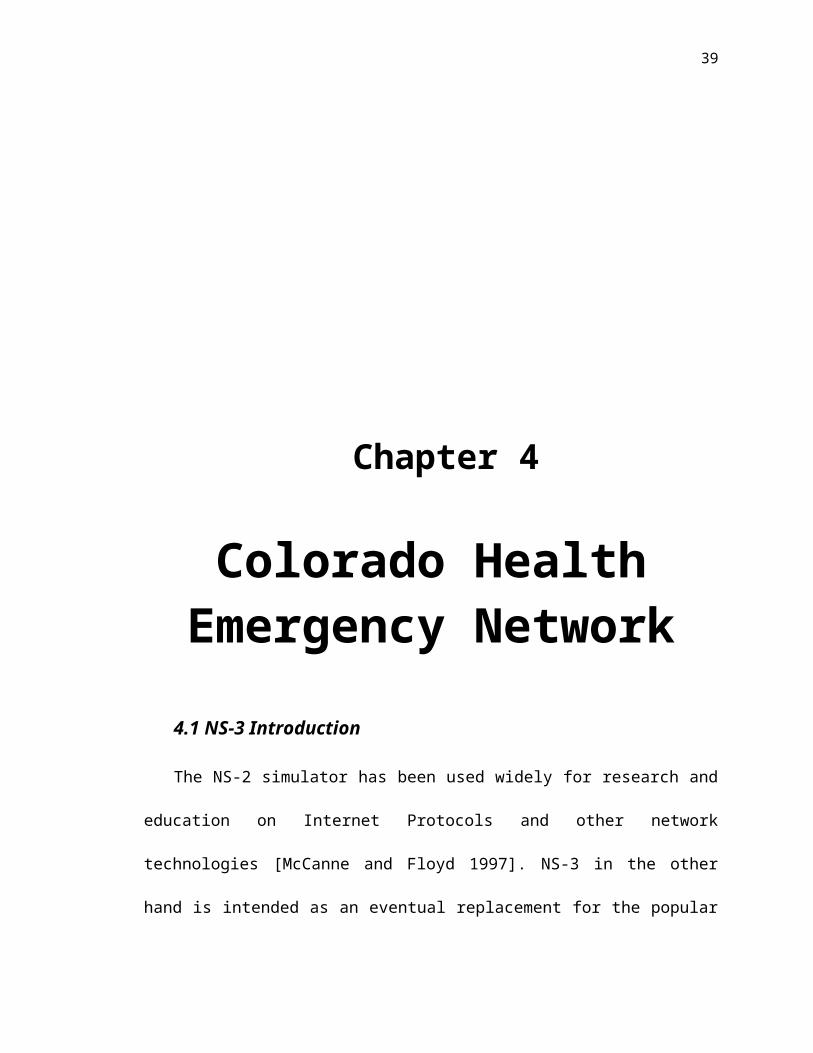
secretary's initiatives [www.hhs.gov]. HHS has divided the US into 10 regions, where each region
has at least 4 states; Figure 3.2 lists these regions and the member states, whereas Figure 3.3
shows them over distributed over the US map. Each region has a central office, for instance,
24
region 1 contains Connecticut, Maine, Massachusetts, New Hampshire, Rhode Island, and
Vermont. The central office is located in Boston. Colorado is located within region 8. In each
state there is the Department of Health and Human Services, and in each county it has a
department. In Colorado, The Department of Health and Human Services is located in Denver,
and it oversees the state’s 64 counties.
Figure 3.1 USA HHS Structure
25
Region 1 – Boston
Region 10 – Seattle
Region 2 – New York
Region 9 – San Francisco
Region 3 – Philadelphia
Region 4 – Atlanta
Region 5 – Chicago
Region 6 – Dallas
Region 7 – Kansas City
Region 8 – Denver
HHS Regional Offices
Connecticut, Maine, Massachusetts, New Hampshire, Rhode Island, and Vermont
New J ersey, New York, Puerto Rico, and the Virgin Islands
Delaware, District of Columbia, Maryland, Pennsylvania, Virginia, and West Virginia Alabama, Florida, Georgia, Kentucky, Mississippi, North Carolina, South Carolina, and Tennessee I llinois, Indiana, Michigan, Minnesota, Ohio, and Wisconsin
Iowa, Kansas, Missouri, and Nebraska
Arkansas, Louisiana, New Mexico, Oklahoma, and Texas
Colorado, Montana, North Dakota, South Dakota, Utah, and Wyoming
Arizona, California, Hawaii, Nevada, American Samoa, Commonwealth of the Northern Mariana Islands, Federated States of Micronesia, Guam, Marshall Islands, and Republic of Palau Alaska, Idaho, Oregon, and Washington
Figure 3.2 U.S. 10 Regions list
Figure 3.3 U.S. 10 Regions map
26
Chapter 4
Colorado Health Emergency Network
4.1 NS-3 Introduction
The NS-2 simulator has been used widely for research and education on Internet
Protocols and other network technologies [McCanne and Floyd 1997]. NS-3 in the other
hand is intended as an eventual replacement for the popular NS-2 simulator, but not an
extension. NS-3 is a discrete-event network simulator for Internet systems, targeted
primarily for research and educational use. NS-3 is free software, licensed under the
GNU GPLv2 license, and is publicly available for research, development, and use. Based
on borrowed concepts and implementations from several open source simulators
including NS-2 and the works of Lecage and Henderson 2006, and Riley 2003, NS-3 was
27
built. NS-3 differs from NS-2 in several ways, including: new software core, attention to
realism, software integration, and support for virtualization, testbed integration, attribute
system, and tracing architecture. NS-3 has been the best overall performance, and is
capable of carrying out large-scale network simulations in an efficient way [Weingartner
et al. 2009]. However, NS-3 is still in the early stages, and more models and capabilities
needed to be ported from NS-2. Scripting in NS-3 is done in C++ or Python. As of NS-
3.2, most of the NS-3 API is available in Python, but the models are written in C++ in
either case. A working knowledge of C++ and object-oriented concepts is required to use
NS-3. The NS-3 uses several components of the GNU (toolchain) for development. A
software toolchain is the set of programming tools available in the given environment
[http://en.wikipedia.org/wiki/GNU_toolchain]. NS-3 uses gcc, GNU binutils, and gdb.
NS-3 can be used in Linux or a Linux-like environment [www.nsnam.org]. Running NS-
3 under Windows is also possible, e.g. Cygwin environment.
4.2 NS-3 Model
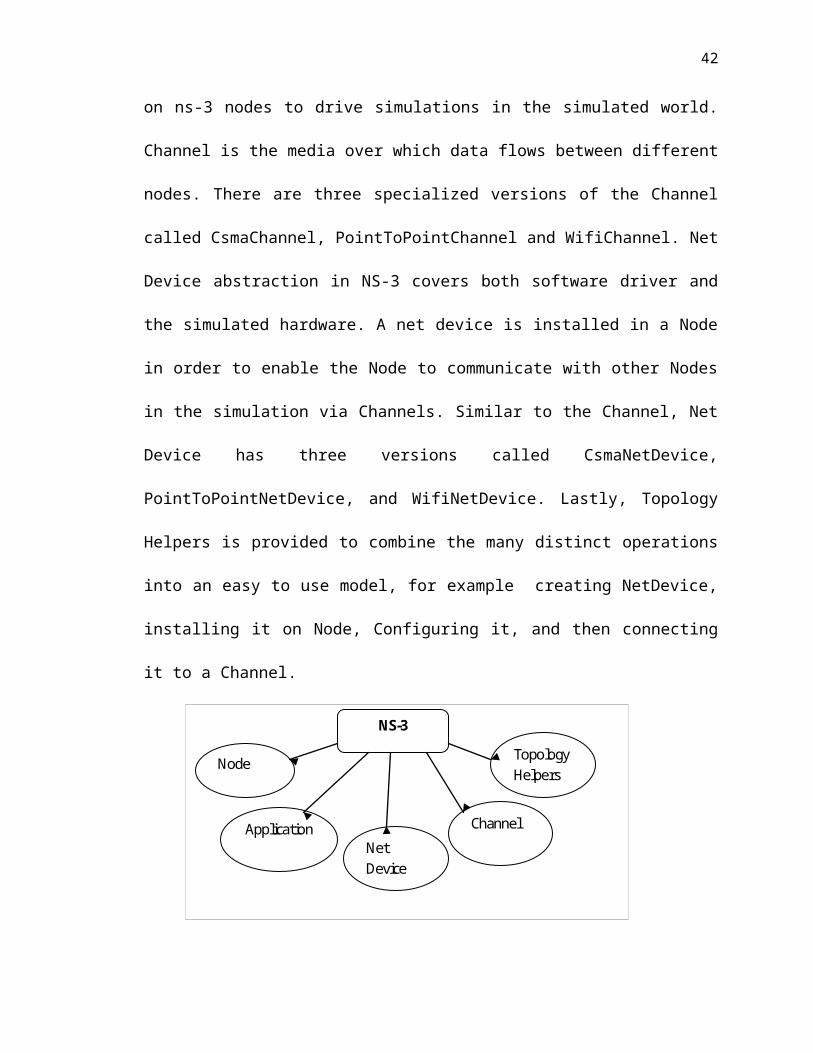
NS-3 uses the commonly networking terms, but with different meanings, (see Figure
4.1).
Starting from the left: Node is the basic computing device abstraction used by NS-3.
Node corresponds to host or sometimes an end system. Because NS-3 is a network
simulator, not specifically an internet simulator, the term host is not used, since it is
closely related with the internet and its protocols. Application is the basic abstraction for
a user program that generates some activity to be simulated. This term does not include
the concept of operating system and privilege levels. NS-3 applications run on ns-3 nodes
28
to drive simulations in the simulated world. Channel is the media over which data flows
between different nodes. There are three specialized versions of the Channel called
CsmaChannel, PointToPointChannel and WifiChannel. Net Device abstraction in NS-3
covers both software driver and the simulated hardware. A net device is installed in a
Node in order to enable the Node to communicate with other Nodes in the simulation via
Channels. Similar to the Channel, Net Device has three versions called CsmaNetDevice,
PointToPointNetDevice, and WifiNetDevice. Lastly, Topology Helpers is provided to
combine the many distinct operations into an easy to use model, for example creating
NetDevice, installing it on Node, Configuring it, and then connecting it to a Channel.
NS-3
Channel
Topology Helpers
Net Device
Node
Application
Figure 4.1 NS-3 Basic Components
The thesis is using the Topology Helpers to build the Emergency Network topology.
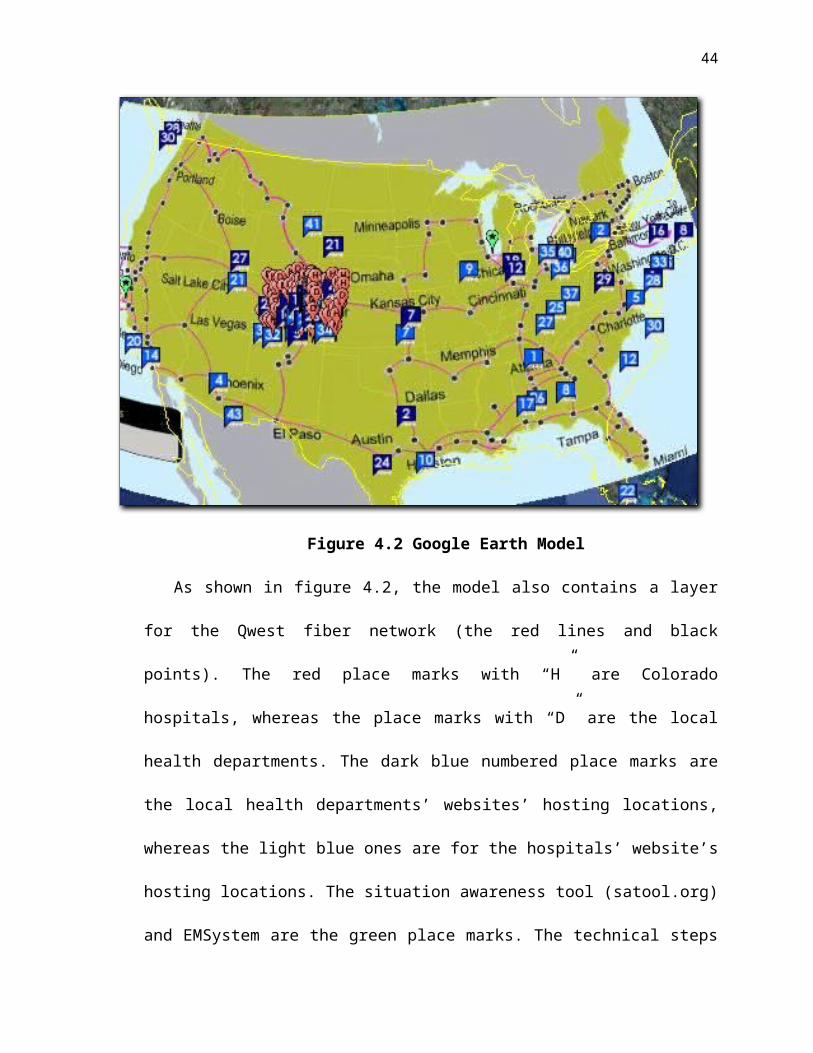
The thesis has adapted the agile like method in solving the problem. The Google
Earth model (see Figure 4.2) plays like a prototyping stage for the problem that helps
define the NS-3 model attributes. As new information becomes available, it will be added
to the basic model. The model shows the different nodes: Hospitals, Local Health
29
Departments, and their websites locations it also shows the Satool, EMSystem and the
Department of Health and Human Services and the Emergency Office.
Figure 4.2 Google Earth Model
As shown in figure 4.2, the model also contains a layer for the Qwest fiber network
(the red lines and black points). The red place marks with “H” are Colorado hospitals,
whereas the place marks with “D” are the local health departments. The dark blue
numbered place marks are the local health departments’ websites’ hosting locations,
whereas the light blue ones are for the hospitals’ website’s hosting locations. The
situation awareness tool (satool.org) and EMSystem are the green place marks. The
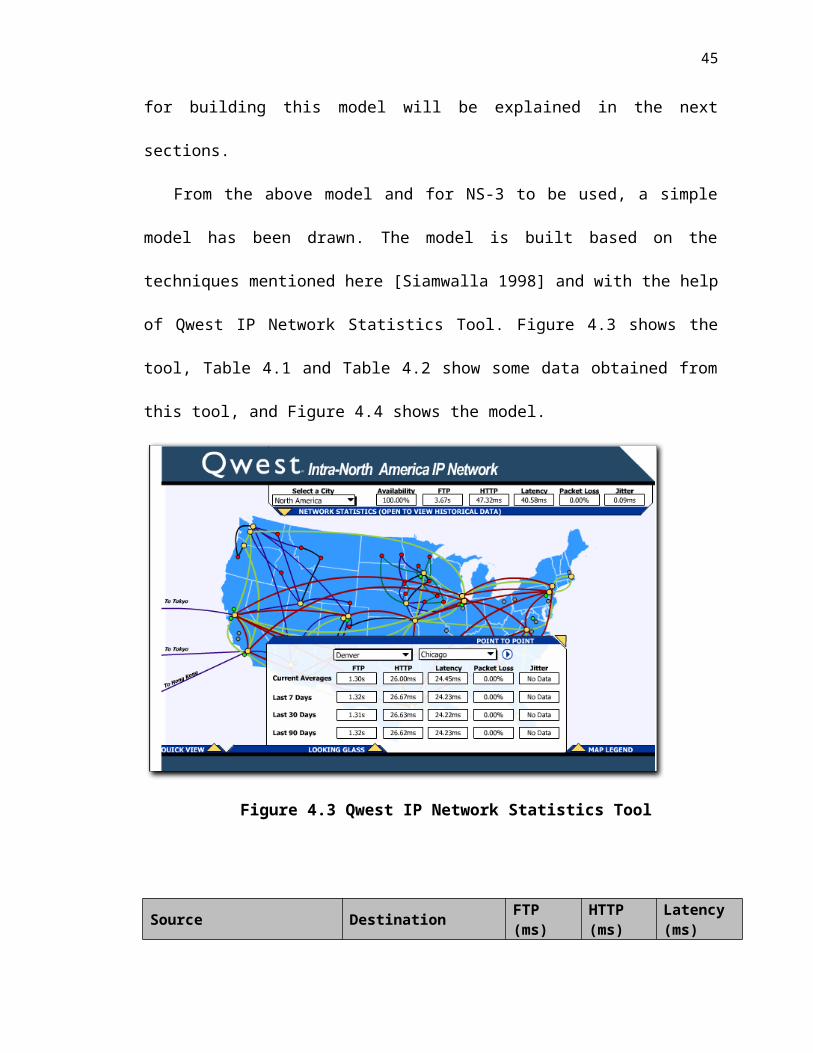
technical steps for building this model will be explained in the next sections.
From the above model and for NS-3 to be used, a simple model has been drawn. The
model is built based on the techniques mentioned here [Siamwalla 1998] and with the
30
help of Qwest IP Network Statistics Tool. Figure 4.3 shows the tool, Table 4.1 and Table
4.2 show some data obtained from this tool, and Figure 4.4 shows the model.
Figure 4.3 Qwest IP Network Statistics Tool
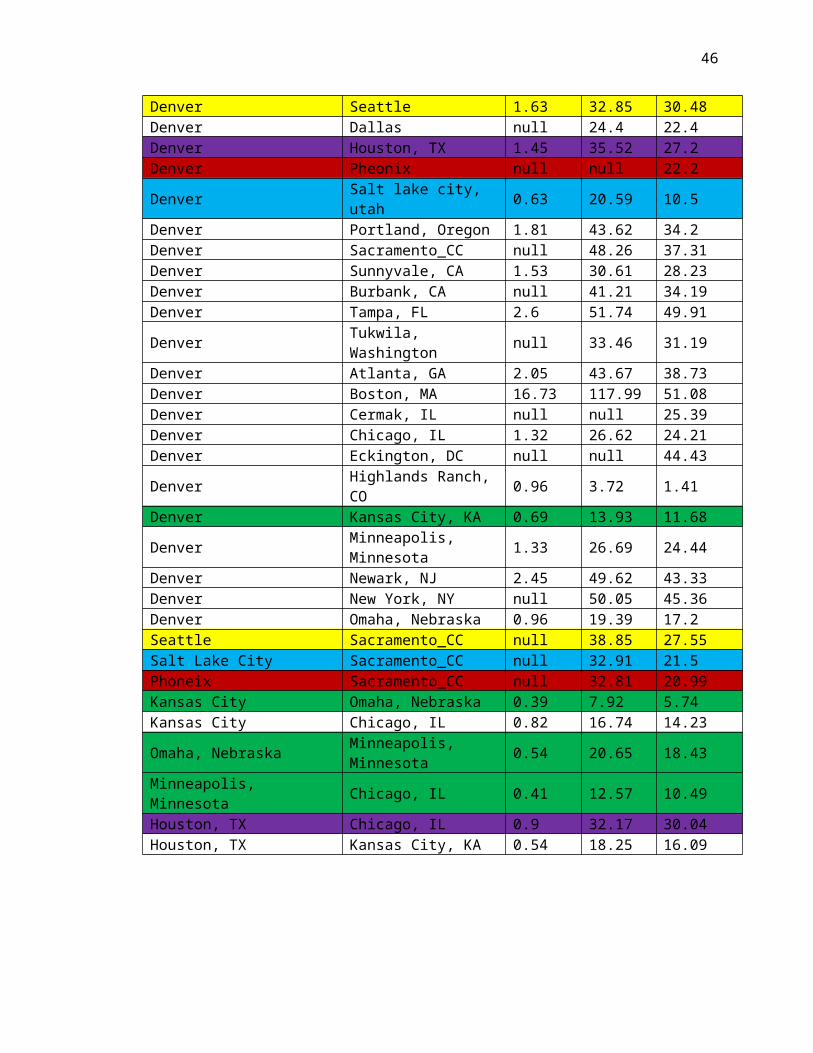
Source Destination FTP (ms) HTTP (ms)
Latency (ms)
Denver Seattle 1.63 32.85 30.48Denver Dallas null 24.4 22.4Denver Houston, TX 1.45 35.52 27.2Denver Pheonix null null 22.2Denver Salt lake city, utah 0.63 20.59 10.5Denver Portland, Oregon 1.81 43.62 34.2Denver Sacramento_CC null 48.26 37.31Denver Sunnyvale, CA 1.53 30.61 28.23Denver Burbank, CA null 41.21 34.19Denver Tampa, FL 2.6 51.74 49.91Denver Tukwila, Washington null 33.46 31.19Denver Atlanta, GA 2.05 43.67 38.73Denver Boston, MA 16.73 117.99 51.08Denver Cermak, IL null null 25.39Denver Chicago, IL 1.32 26.62 24.21
31
Denver Eckington, DC null null 44.43Denver Highlands Ranch, CO 0.96 3.72 1.41Denver Kansas City, KA 0.69 13.93 11.68Denver Minneapolis, Minnesota 1.33 26.69 24.44Denver Newark, NJ 2.45 49.62 43.33Denver New York, NY null 50.05 45.36Denver Omaha, Nebraska 0.96 19.39 17.2Seattle Sacramento_CC null 38.85 27.55Salt Lake City Sacramento_CC null 32.91 21.5Phoneix Sacramento_CC null 32.81 20.99Kansas City Omaha, Nebraska 0.39 7.92 5.74Kansas City Chicago, IL 0.82 16.74 14.23Omaha, Nebraska Minneapolis, Minnesota 0.54 20.65 18.43Minneapolis, Minnesota Chicago, IL 0.41 12.57 10.49Houston, TX Chicago, IL 0.9 32.17 30.04Houston, TX Kansas City, KA 0.54 18.25 16.09
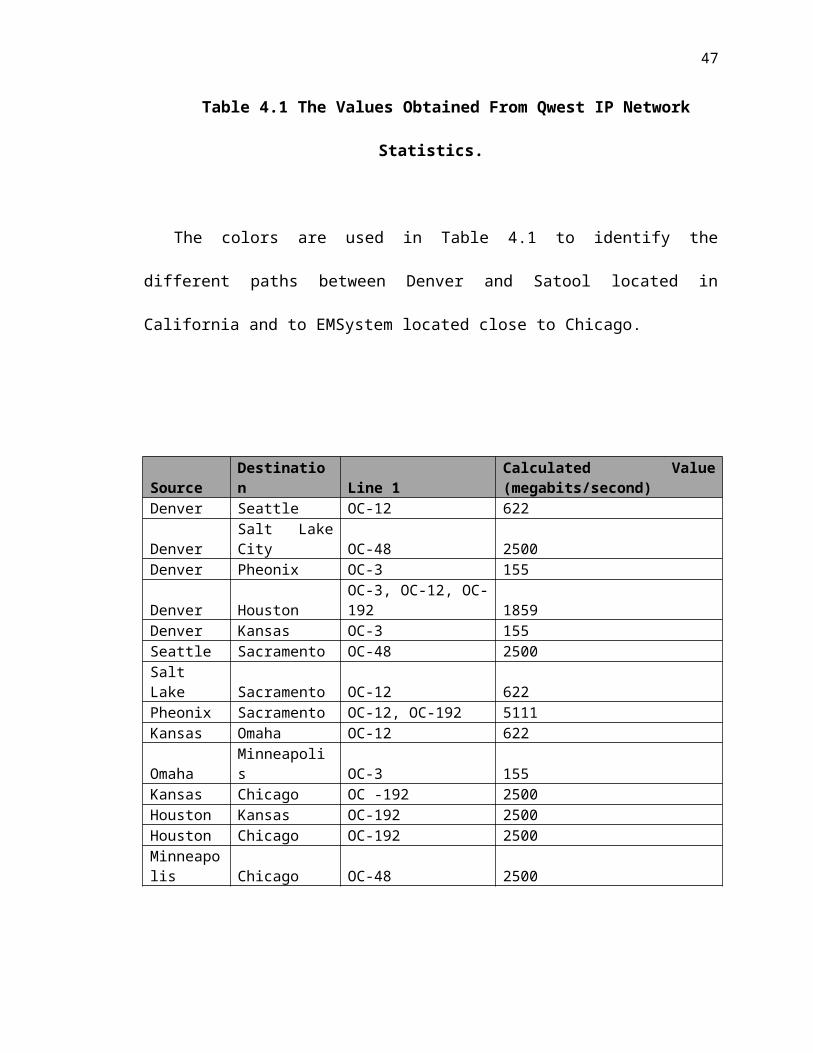
Table 4.1 The Values Obtained From Qwest IP Network Statistics.
The colors are used in Table 4.1 to identify the different paths between Denver and
Satool located in California and to EMSystem located close to Chicago.
Source Destination Line 1Calculated Value (megabits/second)
Denver Seattle OC-12 622Denver Salt Lake City OC-48 2500Denver Pheonix OC-3 155Denver Houston OC-3, OC-12, OC-192 1859Denver Kansas OC-3 155Seattle Sacramento OC-48 2500Salt Lake Sacramento OC-12 622Pheonix Sacramento OC-12, OC-192 5111Kansas Omaha OC-12 622Omaha Minneapolis OC-3 155Kansas Chicago OC -192 2500
32
Houston Kansas OC-192 2500Houston Chicago OC-192 2500Minneapolis Chicago OC-48 2500
Table 4.2 Calculated Lines Bandwidth between different major cities.
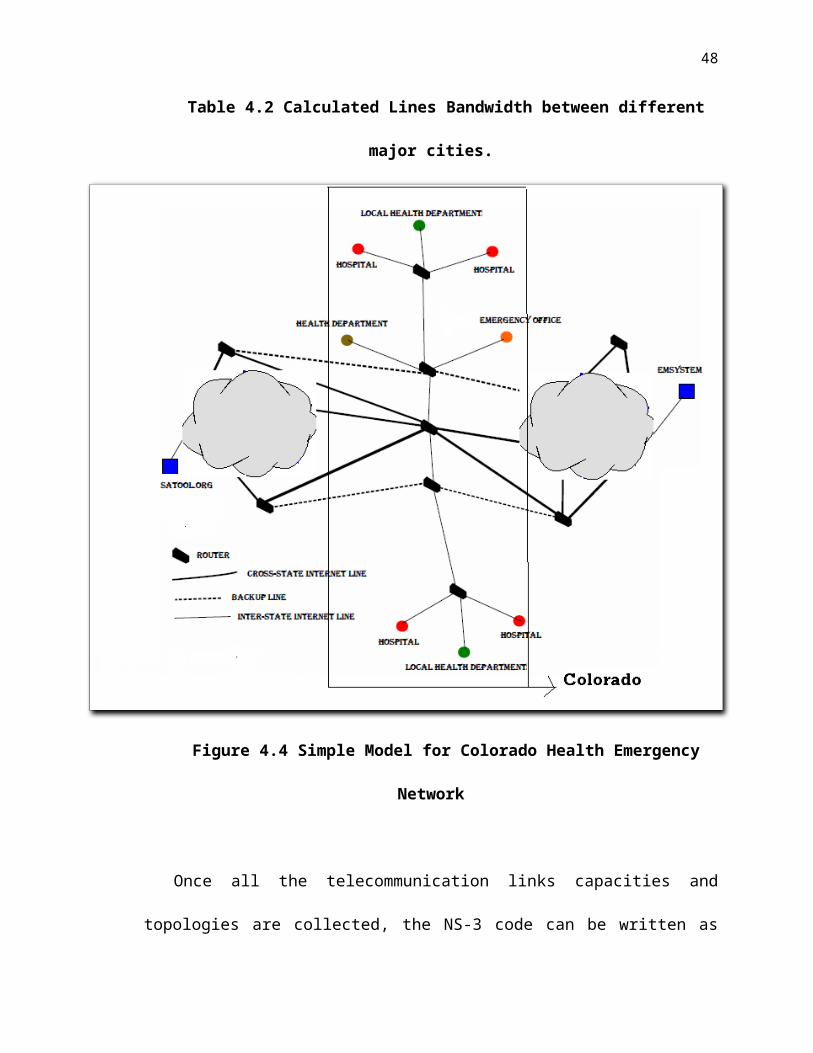
Figure 4.4 Simple Model for Colorado Health Emergency Network
Once all the telecommunication links capacities and topologies are collected, the
NS-3 code can be written as follows to simulate the network traffic and collect
33
information about the network performance. Writing the NS-3 code starts by creating the
nodes,
NodeContainer c;
c.Create (24);
And then relating these nodes together as follows,
NodeContainer s1r1 = NodeContainer (c.Get (0), c.Get (2));
NodeContainer r1r2 = NodeContainer (c.Get (2), c.Get (3));
NodeContainer r1r3 = NodeContainer (c.Get (2), c.Get (4));
NodeContainer r1r4 = NodeContainer (c.Get (2), c.Get (5));
r1 node and r2 are directly connected.
After connecting the created nodes, a TCP/IP stack should be installed in all the
nodes, and this can be done with the following command,
InternetStackHelper internet;
internet.Install (c)
Creating the channels will follow,
PointToPointHelper p2p;
p2p.SetDeviceAttribute("DataRate",StringValue ("2500Mbps"));
p2p.SetChannelAttribute ("Delay", StringValue ("27.55ms"));
NetDeviceContainer d1d2=p2p.Install (r1r2);
The next step is to assign the IP addresses,
34
Ipv4AddressHelper ipv4;
ipv4.SetBase ("10.1.1.0", "255.255.255.0");
ipv4.Assign (d1d2);
Creating router nodes, initializing routing database and setting up the routing tables
in the nodes is the next step,
Ipv4GlobalRoutingHelper::PopulateRoutingTables ();
The following lines of code are used to set up a UDP echo server application on
Satool.org node we have previously created..
UdpEchoServerHelper echoServerS(9);
ApplicationContainer serverAppsSatool=
echoServerS.Install(c.Get(0));
serverAppsSatool.Start(Seconds(1.0));
serverAppsSatool.Stop(Seconds(100.0));
The last two lines will cause the echo server application to start at one second into
the simulation and to stop at twenty seconds into the simulation.
This application is installed on EMSystem as well. For future work, it could be
installed on the nodes representing the websites. The echo client application is set up
using a method similar to that for the server.
35
UdpEchoClientHelper echoClientSh (is1.GetAddress (0), 9);
echoClientSh.SetAttribute("MaxPackets",UintegerValue(10000));
echoClientSh.SetAttribute("Interval", TimeValue (Seconds (0.00001)));
echoClientSh.SetAttribute("PacketSize",UintegerValue(1024));
ApplicationContainer clientAppsSh = echoClientSh.Install (c.Get (23));
clientAppsSh.Start (Seconds (2.0));
clientAppsSh.Stop (Seconds (20.0));
The echo client application is installed on the department of health node and the
local health departments’ nodes. For the echo client, five different Attributes have to be
set: “RmoteAddress”, “RemotePort”, “MaxPackets”, “Interval” and “PacketSize”.
The next lines of code are used to monitor and report back packet flows observed
during a simulation which we will analyze in Section 4.3.
Ptr<FlowMonitor> flowmon;
if (enableFlowMonitor)
{
FlowMonitorHelper flowmonHelper;
flowmon = flowmonHelper.InstallAll ();
}
if (enableFlowMonitor)
{
flowmon->SerializeToXmlFile("My-global-routingResult.flowmon", true, true);
}
36
At this point, what left, is to run the simulation? The first statement runs the
simulator whereas the last two lines are to cleanup and exit.
Simulator::Run ();
Simulator::Destroy ();
Return 0;
The thesis is providing the full code (See Appendix).
4.3 NS-3 Simulation Results
The NS-3 implementation for Colorado Health Emergency Network’s model presented in
the previous section integrated with the values from Table 1 and Table 2 is tested. The
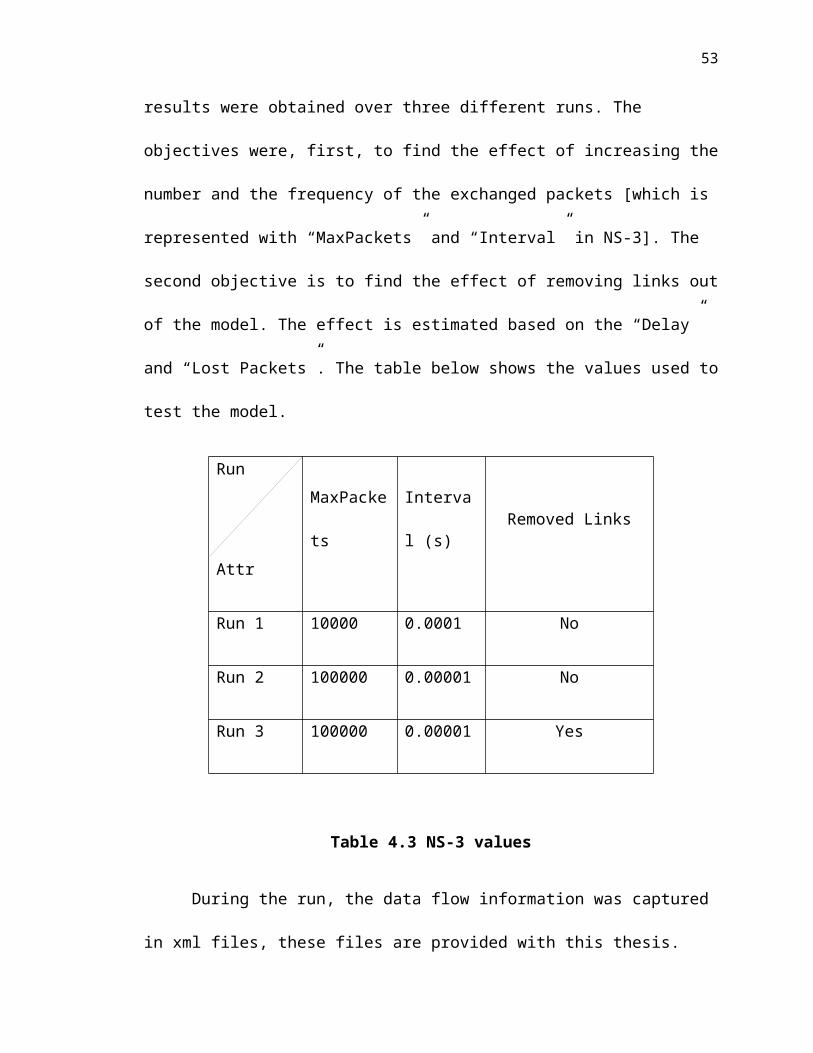
results were obtained over three different runs. The objectives were, first, to find the
effect of increasing the number and the frequency of the exchanged packets [which is
represented with “MaxPackets” and “Interval” in NS-3]. The second objective is to find
the effect of removing links out of the model. The effect is estimated based on the
“Delay” and “Lost Packets”. The table below shows the values used to test the model.
Run
AttrMaxPackets Interval (s) Removed Links
Run 1 10000 0.0001 No
Run 2 100000 0.00001 No
Run 3 100000 0.00001 Yes
37
Table 4.3 NS-3 values
During the run, the data flow information was captured in xml files, these files are
provided with this thesis.
The simulation time is selected to be twenty seconds simulation time (not processing
time), which is suitable to cover all of the events presented in chapter 5. Figure 4.5 and
Figure 4.6 show the results summary. In Figure 16, notice how the delay is affected by
both the number and frequency of exchanged packets, and the removed links. In Run 3,
the delay is high because we removed four links out of the model and we used a higher
value for the “MaxPackets” and a lower value for “Interval”. In Run 2, the delay is lower
because we returned the links back to the model. In Run 1, the delay is lower than Run 2
because we decreased the “MaxPackets” and increased the “Interval”. Run1 represents
the early stage of an emergency; Run 2 represents the second stage, whereas Run3 is the
emergency peak. During the early stages of an emergency, the departments and hospitals
exchange less information compared to those exchanged in the next stages until it reaches
the maximum. In Preparing for an emergency, the worst case should be considered.
38
Run 1 Run 2 Run 330000000000
30200000000
30400000000
30600000000
30800000000
31000000000
31200000000
31400000000
31600000000
Delay
Delay
Figure 4.5 The Run’s Delay Disparity
Figure 4.6 shows the great effect of removing the links out of the model
on the number of lost packets. The number of lost packets dropped down when we
returned the links back to the model. Whereas, reducing the number of generated packets
and the frequency has no effect on the packet loss. From Run 1 to Run 2 the number of
lost packets remains the same.
To find the mystery behind the increase on the “Delay” and “Lost
Packets”, the NS-3 log files have to be re-visited. Table 4.4 shows the number of packets
each node in the model [presented in the previous section] has processed. In Run 3, Node
8 and Node 13 have received twice and four times what they have received in Run 2 and
Run 1. Reducing the number of links made these two routers deal with large number of
packets more than they could handle. This situation forced them to delay some packets
and drop others. If we to build a conclusion based on these results, it would be,
39
emergency’s websites and systems hosting company’s backbone is critical and need to be
investigated.
Run 1 Run 2 Run 30
100020003000400050006000700080009000
10000
Lost Packets
Lost Packets
Figure 4.6 Runs’ Lost Packets Disparity
Node # Packets (Run 3) Node # Packets (Run 2) Node # Packets (Run 1)0 1272 0 1272 0 12721 1274 1 1274 1 12748 2546 8 637 8 637
13 1274 13 637 13 63723 10638 23 10638 23 163824 10640 24 10640 24 1640…. … … … … …
Table 4.4 NS-3 Log Analysis
4.4 Conclusions
40
The NS-3 code could not help in drawing any conclusions because of the
oversimplifications and the complexity of the internet. NS-3 works best on a close
environment. The distribution of health systems and websites across the US restricts the
success of using NS-3. The thesis was counting on getting more information from the
private sector and research lab about the US internet backbone, but it did not work out.
The thesis’ main focus was on studying the information flow between the health nodes in
case of emergency. Google Earth model revealed important information about the
emergency network. The network is spread over the US and could be simulated with the
current information and tools. The purpose of this study is to discover some risks related
to information sharing and flow in case of emergency. In the last section, performance
and security issues will be tested for the emergency network end nodes. The Google
Earth model leads to that trend.
41
Chapter 5
Technical Work
5.1 Health Emergency Network Nodes
A scenario of future health emergency, like, pandemic flu was derived from the back
ground research and the interview with El Paso County Health Department. The scenario
was useful to identify the nodes and their roles.
The scenario starts by a call from a local hospital (H1) to a local health department
(D1). The call is to inform seeing 10-15 patients with similar symptoms, such asfever
(usually high), headache, muscle aches, chills extreme tiredness, dry cough, runny nose,
and stomach symptoms). D1 will also inform the Colorado Department of Public Health
and Environment (CDPHE).The Center for Disease Control and Prevention (CDC) will
take over by sending its surveillance group to H1 location for the purpose of interviewing
patients and getting more data. CDC will report to CDPHE the results. The results show
the existence of pandemic flu situation. CDPHE will publish an alert into the Situation
42
Awareness Tool (SATOOL) and ask for more input from other local health departments
and hospitals. As time passes,more reports and news are published into the SATOOL.
Each local health department has to stay connected by reading every update coming out
on the SATOOL. The local health departments in some situations have to make some
decisions, like, shutting down the schools. The hospitals will be heavily dependent on
their nearest health departments on getting the instructions, updates on the situation, and
required procedures. The hospitals may get this information via the fax, email or the
health department’s websites. The hospitals have to update their information on
EMSystem (e.g. number of beds, staff, ambulances, etc.); the Emergency Office will need
this information to process the requests coming in. Local health departments will play a
monitoring role over the EMSystem.
From the above scenario, the following nodes have been identified:
1) Colorado Department of Public Health and Environment (CDPHE),
2) Local Health Departments (64),
3) Hospitals (98),
4) State Emergency Office.
5) Centers for Disease Control and Prevention.
The locations for the above nodes are saved on Google Earth. The Hospitals marked
with H, Local Health Departments with D,
5.2 Emergency Systems
The Emergency Systems are Situation Awareness Tool, EMSystem, and the web
technology. There are more, but these are the top most used internet related systems.
43
5.3 Emergency Node’s Websites Hosting and Locations
To find out the emergency nodes’ websites’ hosting and locations,
http://www.whoishostingthis.com and www.81solutions.com are used. The first website
gives the hosting company of a given website, whereas the second website gives its
location on a map. But the location is just shown on a map, so maps.google.com has to be
used to find the address. The following figures explain that:
Figure 5.1 shows the result of querying 81solutions.com on
www.elpasocountyhealth.com. Is it on 17th street, Wazee street or Wynkoop street? The
three choices have been tried; the closest point to it was on 1660 Wynkoop St, Denver,
Colorado 80202 (see Figure 5.2).
Figure 5.1 81Solutions Website (www.81solutions.com)
44
Figure 5.2 the closest point obtained using Google Maps
The nodes list, websites, addresses, IPs, IPs locations, and the host companies are
provided in excel and xml formats. Figure 5.3 shows that nearly 50% of Colorado Local
Health Departments are hosted outside Colorado State, and more than that for the
hospitals (see Figure 5.4). The details are tabulated in the Appendix.
45
Colorado Outside
Figure 5.3 Colorado Local Health Departments’ Websites’ Hosting Locations.
ColoradoOutside
Figure 5.4 Colorado Hospitals’ Websites’ Hosting Locations.
To find out the hosting companies for both local health and hospitals, a tool from
whoishostingthis.com has been utilized and verified using netcraft.com. The former tool
takes various chunks of info from several databases and then tries to do simple research
and find the web hosting provider. It differs from other tools which pull the results from
46
some huge database. This database is sometimes obsolete and does not support specific
countries (Top Level Domains). The tool used in this study is not 100% accurate, but it
works well enough, and certainly better than doing this research by hand.
5.4 The Health Emergency Nodes’ Interactions
The following table summarizes the health emergency related interactions.
Node System/Tech Action
CDPHE Satool Write
Local Health Depts. Satool Read
Hospitals EMSystem Updates
Emergency Office EMSystem Read
Local Health Depts. EmSystem Monitor/View
Hospitals Websites Write
Local Health Depts. Websites Write
Table 5.1 Health Emergency Internet related actions.
5.5 Local Health Department’s Websites Analysis
47
The pandemic flu scenario mentioned earlier has revealed the importance of local
health department websites in the emergency management process. It is the way through
which these departments reach the people. The information that has to be published is
vital for saving peoples’ lives. Satool.org receives feeds from the social networks like
“Facebook” and “Twitter”. These feeds would help the health personnel “read” what is
on peoples’ minds. The posts that most people make on the social networks could be used
to figure out any misunderstanding to the disease or the situation. Correct information
that solves these misunderstood issues could be then published on the websites. These
websites have to be secured and running on a good performance machines. The next
section discusses these two criteria by investigating the biggest 17 counties health
departments’ websites.
48
Chapter 6
Performance and Security Analysis
For the performance and security study, two factors have been identified. Hosting
location (inside or outside the state), and hosting party (Commercial or Non-commercial
hosting).The health departments’ websites’ security issue has been raised here because
these websites are considered critical infrastructure as explained earlier. Since some of
these websites and systems are hosted by the private sector, security might be a concern
Private sector’s main concern is achieving higher profit. Security and survivability cost
money, so they might skip security to get cost effective systems. Schintler et al.
2007clarified this issue, “A problem facing all nations is that they have the responsibility
for securing infrastructure but critical aspects are owned by the private sector” [chap. 14].
49
The thesis investigated the websites’ security and its relation with the hosting party. A
security test has been launched over the hosting websites using Nessus [Cordova 2010].
Nessus can perform remote security checks, and suggest solutions for security problems.
The test results for launching Nessus on Colorado health departments’ websites are
shown below.
Com (high
)
Non-com (h
igh)
Com (Med
ium)
Non-com (M
edium)
Com (Low)
Non-com (Lo
w)
Com (Open
Ports)
Non-com (O
pen Ports
)0
20406080
100120140160180
Figure 6.1 Nessus scan results on the local health department’s websites.
The hosting IP addresses and the vulnerable websites have been removed from the
figure for ethical reasons. The figure clearly explains the relation between commercial
hosting and security. Over the four types of vulnerabilities (High, Medium, Low, and
Open ports), commercial hosting proved to be non-secure. These vulnerabilities can be
used by “bad guys” to steal confident information, change the contents by providing false
information, and/or shutting the server down. Indeed, if anything of the fore-mentioned
happens, emergency management is in danger and so are the people. Examples of these
vulnerabilities are: the remote host is missing patches; perhaps the apache chunked
50
encoding vulnerability. Versions of the Apache web server up to and including 1.3.24 and
2.0 up to and including 2.0.36 contain a bug in the routines which deal with invalid
requests which are encoded using chunked encoding. This bug can be triggered remotely
by sending a carefully crafted invalid request. The remote FTP server allows credentials
to be transmitted in clear text. It is possible to determine the exact time set on some hosts
which is classified as an ICMP Timestamp Request Remote Date Disclosure. Look at the
following vulnerability description
Synopsis:
The remote FTP server is affected by multiple vulnerabilities.
Description:
The remote host is running Serv-U File Server, an FTP server for Windows.
The installed version of Serv-U is earlier than 9.0.0.1 and as such is
reportedly affected by following issues : - Provided 'SITE SET' command is
enabled, an authorized user may be able to crash the remote FTP server by
sending a specially crafted 'SITE SET TRANSFERPROGRESS ON' command. -
An unprivileged user may be able to view all drives and virtual paths for drive
'\'.
As we clarified earlier, these risks are critical on the emergency management
survivability and efficiency. If the above vulnerability could be compromised, the
website’s, and systems hosted on that server are at risks, which means their role in the
emergency management will become idle. Performance test is done using apache
benchmarking tool called ab [ab]. The test applied on the 17 largest population counties.
Sample of the test results is shown below. The ab runs are launched over the weekend to
51
get more accurate results and to avoid any inconvenience that may arise from stressing
the website. Command variables were set to be:
-n 5000: ab will send 5000 number of requests to the server in order to perform for the benchmarking session.
-c 20 : 20 is concurrency number i.e. ab will send 5 number of multiple requests to perform at a time to the server.
52
Figure 6.2 ab Sample Results
More complicated studies could be done to analyze the ab results, in this study the
number of request per second used to prove the performance problem validity.
53
Average
(Req
uests/s
ec) - I
n
Average
(Req
uests/s
ec) - O
ut
Average
(Req
uests/s
ec) - C
om
Average
(Req
uests/s
ec) - N
on-com
0100200300400500600
Series1
Figure 6.3 ab command results on the 17 largest population counties
Figure 6.3 shows ab command run results. The average speeds of the websites
hosted on servers located within Colorado state borders is a way greater than those
located outside. For instate hosting the average speed is 500 requests/sec, and less than
100 requests/sec for the outside hosting. Another comparison is made regarding the speed
between commercial and non-commercial the result appears on Figure 6.3. The result
shows the average speed of non-commercial hosting is double the average speed of
commercial hosting.
Does the performance affect the emergency management process?
Absolutely! The faster the people receive the information the more life could be
saved. I will take one county to demonstrate the effect of bad performance on emergency
management or broadcasting the knowledge about the disease and situation.
County T, population 1,250,000, and health website performance is 20 requests/sec.
54
Assume that 1/10 of the population make requests for the health website. That means
125,000 requests, since these requests will be made using different locations, then
assuming that these requests arrives into 5 different equal groups with one minute
difference. Then:
The first 25,000 arrives first and will take them 25000/20 = 20 minutes to finish.
The second group will take them 20 + 19 = 39 minutes.
The third group will take them 20 + 19 + 18 = 57 minutes.
The fourth group will take them 20 + 19 + 18 + 17 = 74 minutes.
The fifth group will take them 20 + 19 + 18 + 17 + 16 = 90 minutes.
The above assumption with its bad consequences assumed that the users are just
browsing the first page which contains the needed information, and that they are just
browsing that page only once. This shows how important the performance during the
emergency.
55
Chapter 7
A proposed solution
7.1 Introduction
As we clarified earlier, the health emergency network suffers from performance and
security problems. The proposed solution has to solve them at first hand, to offer new
advantages and to be cost effective. The following sections will show how LVS could
handle all of that.
7.2 LVS
LVS (Linux Virtual Server Clusters) came out as a solution to the increasing demand
on the Internet. The increasing demand or the traffic put the websites under pressure to
keep up, particularly during peak periods of activity [Zhang and Zhang 2003]. The basic
idea of LVS is to combine multiple physical servers into one virtual server, which
eliminates single points of failure (SPOF). LVS has been used mostly by companies that
56
have mission-critical applications on the internet, and require always-on service. The
LVS provides highly-available and highly-scalable network services.
7.3 LVS and Health Emergency Network
The proposed solution is based on using LVS to provide the health emergency
network with an always-on service’s requirement. This solution solves the performance
and security issues by providing a self-hosting service. By so doing, the risks of breaking
into any of them from neighbors will be removed. Another benefit is the performance can
be improved because the load can be estimated, since the location of the hosting servers
and the users are located within the same area. Moreover, the number of users for each
website and system will be known ahead from the population numbers and emergency
management procedures. The server’s upgrades and updates can be set to fit the local
health departments and the hospitals, which give them enough time to update their
methods and functions. Failing to update the methods and functions for website’s code
when the hosting’s webserver or operation system is upgraded is risky. Both the local
health departments and the hospitals could work together to get that infrastructure done
(see Figure 7.1). In Colorado we counted 64 local health departments and 98 hospitals, so
the cost will be reasonable. In Figure 7.1, emergency’s websites and systems will be
hosted in Real Server (N), Real Server (C) and Real Server (S). The three servers have
the same content and any change on one of them should be then synchronized to the
others. The three servers appear as a single (virtual) server. The proposed solution
structure shown in Figure 7.1 includes backup and recovery plans in case of failure which
guarantees the continuous flow of information between emergency nodes themselves and
between them and the public.
57
Figure 7.1 A Proposed Solution Structure
Sequence of operations:
1) A user makes a request
2) Dynamic DNS returns Director 1 IP address
3) Director 1 direct the request to the one of the servers (Load Balance)
4) The selected server processes the request and returns the result back to the user
The above architecture can easily balance the load between the three servers
according to scheduling algorithms [Zhang and Zhang 2003]. More nodes (servers) can
be easily added or removed to the cluster to achieve scalability, for instance, in case of an
emergency more nodes can be added to avoid any failure. The three servers have to be
programmed to not to accept any request unless it is directed by any of the two directors,
so that many attacks can be avoided. A programmed set of status messages have to flow
58
between directors and the Dynamic DNS and the directors and the servers. The purpose
of the first set of messages is for the Dynamic DNS to change the sequence of look up
table’s records. For example, if the Dynamic DNS doesn’t receive “I’m a life message”
from the Director 1; it will substitute the first record with Director 2 address. Whereas the
purpose of the second set of messages is to accept or reject any request not directed by
any of the directors. For instance, if the 3 servers don’t receive “I’m a live” messages
from the two directors then they will start accepting any requests even If they are not
directed. The proposed architecture doesn’t necessarily need to buy new hardware, given
that some of; If not all of the local health departments and hospitals have their own
servers and hardware which can be utilized to implement the architecture.
7.4 LVS Load Balance
In the previous sections, we said that the director or the load balancer balance the
traffic into the servers using different techniques. In this section we will go over them and
describe the one used in the proposed solution. There are three load balancing techniques:
VS/NAT, VS/DR, and VS/TUN. Virtual Server via Network Address Translation is used
when there is a shortage in IP addresses and due to security considerations whereas the
load balancer and real servers should be interconnected by a switch or a hub. Virtual
Server via Direct Routing requires that load balancer and the real servers must have one
of their interfaces physically linked by an uninterrupted segment of LAN such as
Ethernet switch. Virtual Server via IP Tunneling uses IP tunneling which is a technique
to encapsulate IP datagrams within IP datagrams, which allows datagrams destined for
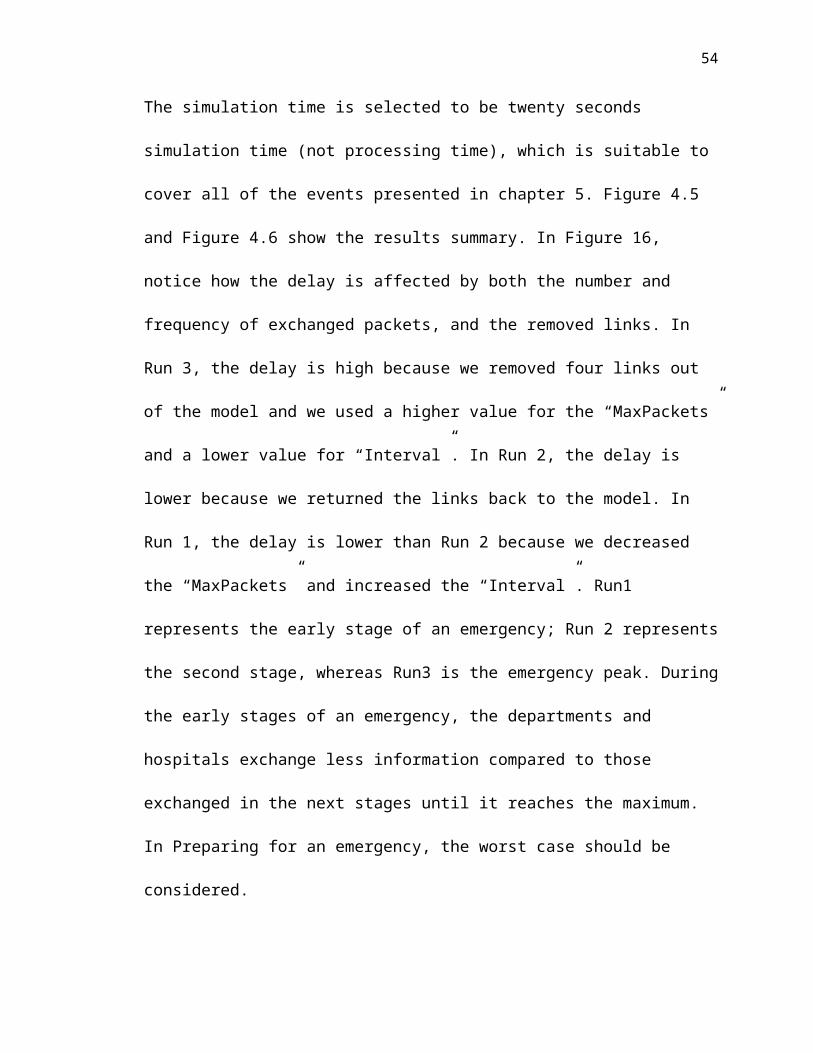
59
one IP address to be wrapped and redirected to another IP address. Real servers can have
any real IP addresses, and the servers and the load balancer can be geographically
distributed. The proposed solution uses this technique since this technique could survive
in case of load balancer failure. When the load balancer receives a request, it encapsulates
the packets within an IP datagram and forwards it to any of the servers. The server
receives the encapsulated packet, then decapsulates it, processes it, and returns the results
directly to the user.
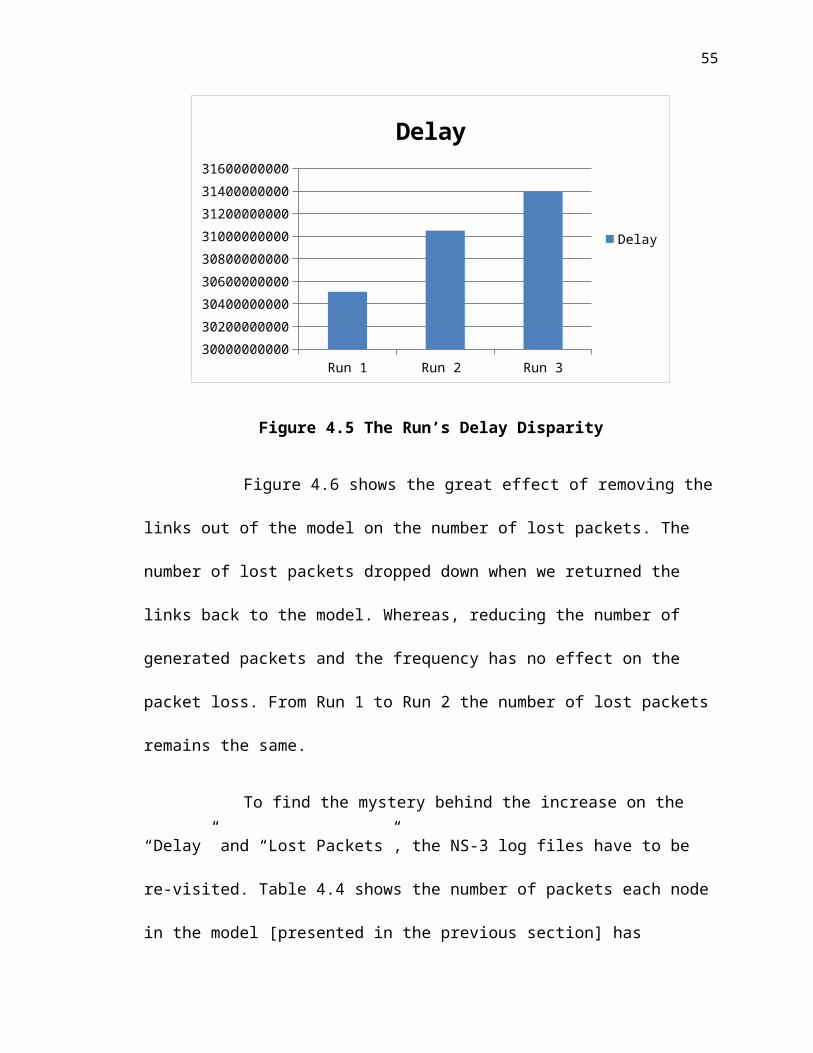
60
Chapter 8
Lessons Learned
This chapter describes the experiences and lessons learned from analyzing Colorado
Health Emergency Network with the focus on the information sharing technology and
survivability.
8.1 Field Research
The most difficult part of the thesis was to conduct the emergency management field
study. The study’s resources can be classified into two categories: the literature and the
onsite visits/interviews. Searching the literature at the beginning was so hard because the
first founded papers could not be easily categorized and analyzed. Background
knowledge was needed and later on gained while working on emergency related
certificates. The onsite information is obtained from meeting with people from the field
by setting up appointments with them or just having a dialog. Setting an appointment
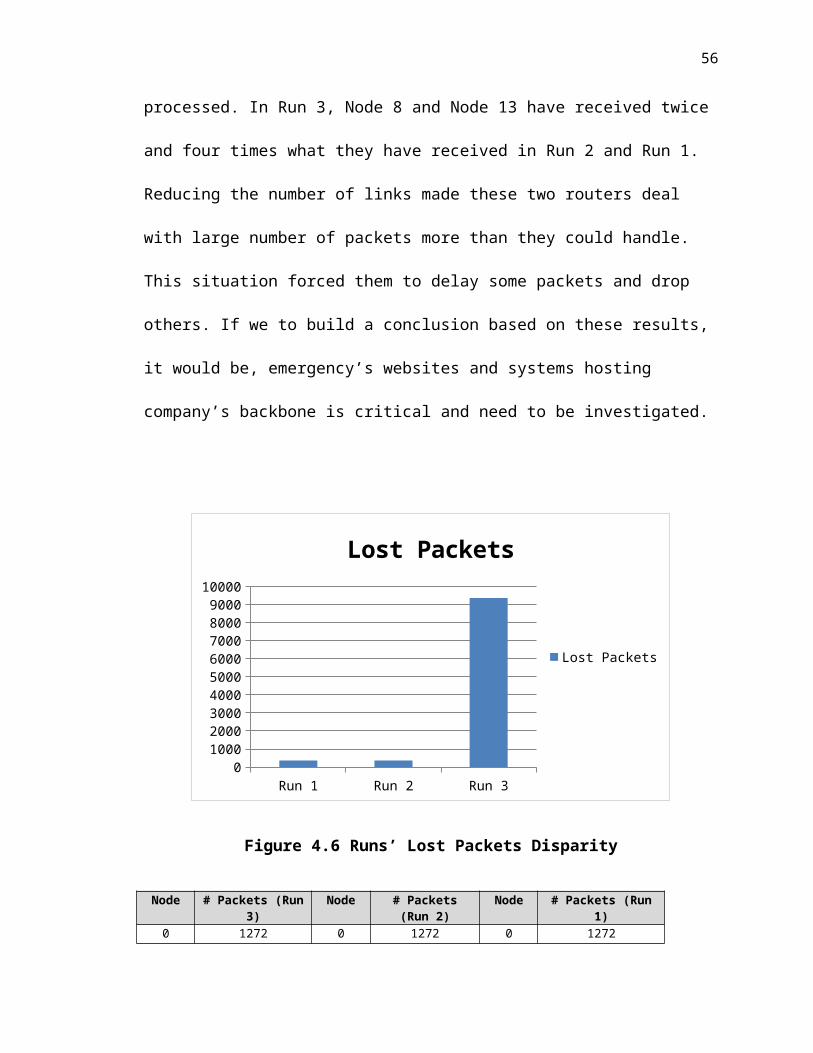
61
required patience and perseverance. Attending the colloquium and participating in the El
Paso County Exercise were not possible without approaching the right people and
keeping track of the thesis’s related events and activities.
8.2 Building the First Model
The first model has to meet the balance between the real world and the available
information. The facts that health emergency tools were spread over the US make the
modeling of the real world so complicated and in the other hand, the available
information was very rare and insufficient. The solution was to build a simplified model
that could tell something about the real world and possible to be implemented using NS-
3.
8.3 Proposed Solution
In fact, suggesting a solution started as a challenge and ended as a success. The
solution had to solve the identified problems, to offer new advantages and to be cost
effective. The suggested solution has utilized the knowledge obtained from taking
courses at UCCS: CS591, CS526, and CS691, since these courses require solving
challenging home works.
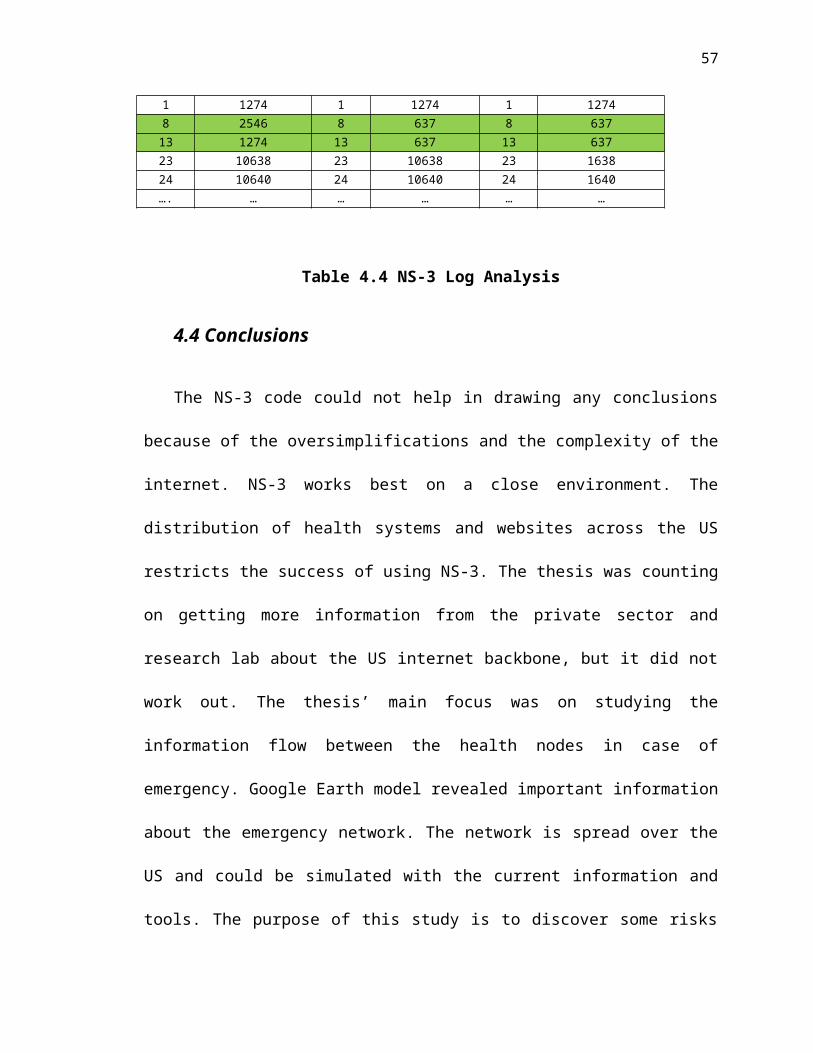
62
Chapter 9
Future Work
The main focus of the thesis has been on the display of Colorado health emergency
network nodes, connections and visual displays. As part of this thesis, good information
regarding the systems in use, the flow of information and the emergency management
plans have been collected. One of thesis objectives is to study the Internet infrastructure
survivability, in so doing, an NS-3 model for the Colorado Health Emergency Network
has been built. This model has integrated Qwest Internet Network information and
statistics. The results obtained from this model could not be generalized because more
information was needed. The future work is to extend this model by collecting more
information regarding the US Internet network. This information can be obtained from a
company like Qwest. Regarding the security and performance analysis results, two future
63
works can be done. First, searching for better hosting, better hosting means security and
performance are assured. Finding the hosting company’s backbone is critical and should
be studied. Most of these companies tend to hide their backbone’s details for competition
reasons; so, the second future work is to implement the proposed solution mentioned in
Chapter 7. Implementing the proposed solution requires the health staff’s approval which
is difficult without showing them evidences. These evidences would be a case study on
the possibility for implementing the new proposed solution to host the local health
departments, and hospital’s websites and their emergency systems. The results obtained
from this study could be then communicated to the health staff, for them to make a
decision. The last possible future work would be to automate the steps I have went
through to visualize the health emergency network. This tool could be then be used by
other states’ health emergency networks, and enhance their performance and security .
64
Chapter 10
Conclusions
Information sharing is on the core of emergency management thus survivability is
critical; survivability is the ability to continue functioning with the existence of pressure
and danger. Colorado Health Emergency Network and its functionality were documented
through interviewing people from the field. It is found that Colorado Health Emergency
Network is diffused across the US. This diffusion complicates the assurance or
assessment of its survivability, since it depends on so many factors. A simplified model
for their network is developed and simulated. An NS-3 implementation for that model
was built. The simulation results show the current network is capable of handling surge
of network traffic under pandemic situations.. The performance and security analysis
show that the current health emergency’s websites and systems in use are inadequate and
require attention. A strong connection between the performance and hosting location was
made. In-state’s hosting has a performance advantage over the out-state’s hosting. On the
65
other hand, non-commercial hosting is more secure than commercial hosting. A solution
was proposed that offers secure and high speed hosting. The solution utilizes Linux
Virtual Server Clusters (LVS) which has been used in the Internet to achieve scalable,
speed and secure webhosting services.
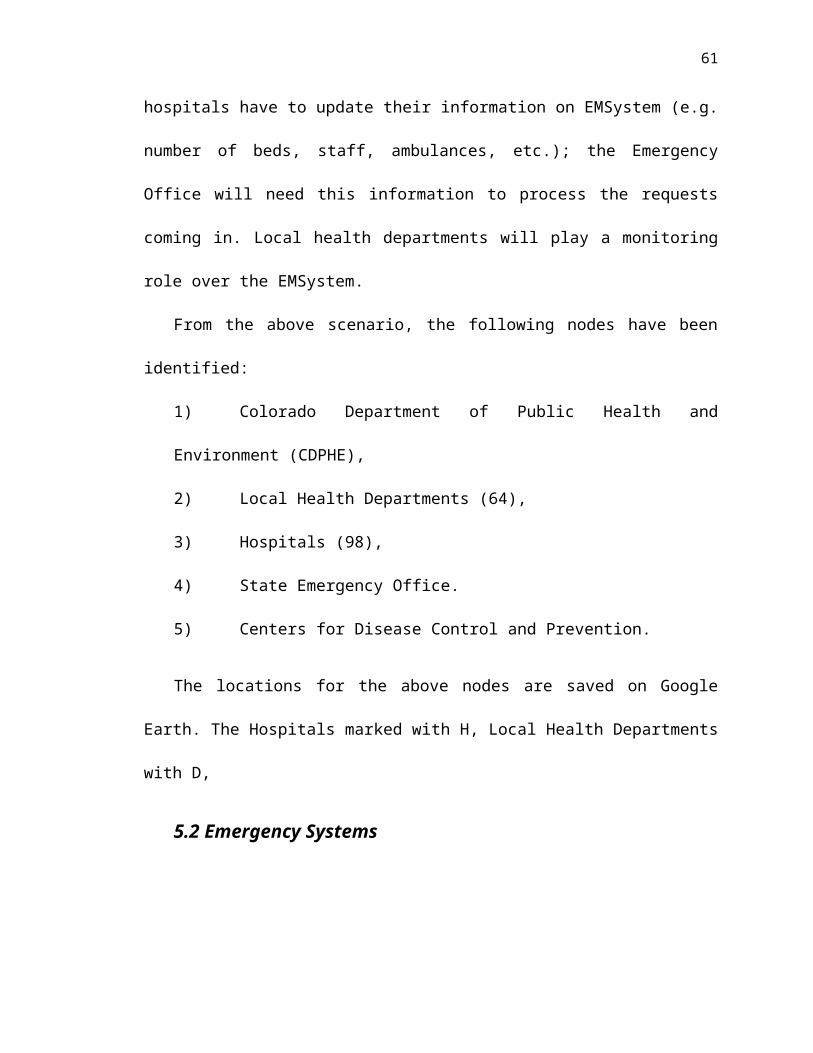
66
References:
ab – Apache HTTP server benchmarking tool, http://httpd.apache.org/docs /2.2/programs/ ab.html .
Agrawal, R., Evfimievski, A., Srikant, R. Information Sharing across Private Databases. SIGMOD, USA, 2003, pp. 86- 97.
Azadehdel, R., Dadashtabar, K., Enami, E. Design and Architecture of A New Crisis Situation Room (CSR). . In Proceedings of the 10th Annual Interanational conference on Digital Government Research: Social Networks: Making Connections between Citizens, Data and Government. ACM, 2009, pp. 302-308
Bajaj, A., Ram, S. (Oct-Dec 2003). IAIS: A Methodology to Enable Inter-Agency Information Sharing in
eGovernment. Emergencymanagement,Wikipedia, http://en.wikipedia.org/wiki/Emergency_management.
Batini, C., Lenzerini, M., Navathe, S. B. A Comparative analysis of methodologies for database schema integration. ACM Computing Services, 1986, 18(4), pp. 323-364.
Bharosa, N., Lee, J., Janssen, M., Rao, H. A Case Study of Information Flows in Multi-Agency Emergency Response Exercises.
Bharosa, N., Lee, J. A Case Study of Information Flows in Multi-Agency Emergency Response Exercises.In Proceedings of the 10th Annual International Conference on Digital Government Research: SocialNetworks: Making Connections between Citizens, Data and Government. 2009, 277-282.
Burstein, H., M., Diller, E., D. A Framework for Dynamic Information Flow in Mixed-Initiative
Human/Agent Organizations. 20(3), 2004, 283-298.
Chen, D., Garg, S., Trivedi, K.. Network survivability performance evaluation: A quantitative approach with applications in wireless ad-hoc networks. In Proceedings of the 5th ACM international workshop on Modeling analysis and simulation of wireless and mobile systems. Atlanta, Georgia, 2002, pp. 61-68.
.Clarke, J.L. Sambrook, R.C. A review of emergency operations center and crisis control software. White Paper US Air Force Office of GeoIntegration.
Degwekar, S., DePree, J., Beck, H., Thomas, C., Su, S. Event-triggered data and knowledge sharing among collaborating government organizations. In Proceedings of the 8th annual international conference on Digital government research: bridging disciplines & domains, Philadelphia, Pennsylvania, 2007, pp. 102-111.
Dekker, A. (2005). Simulating network robustness for critical infrastructure networks. Proceedings of the Twenty-eighth Australasian conference on Computer Science. 38, 59-67. Retrieved January 1, 22010, from ACM Digital Library.
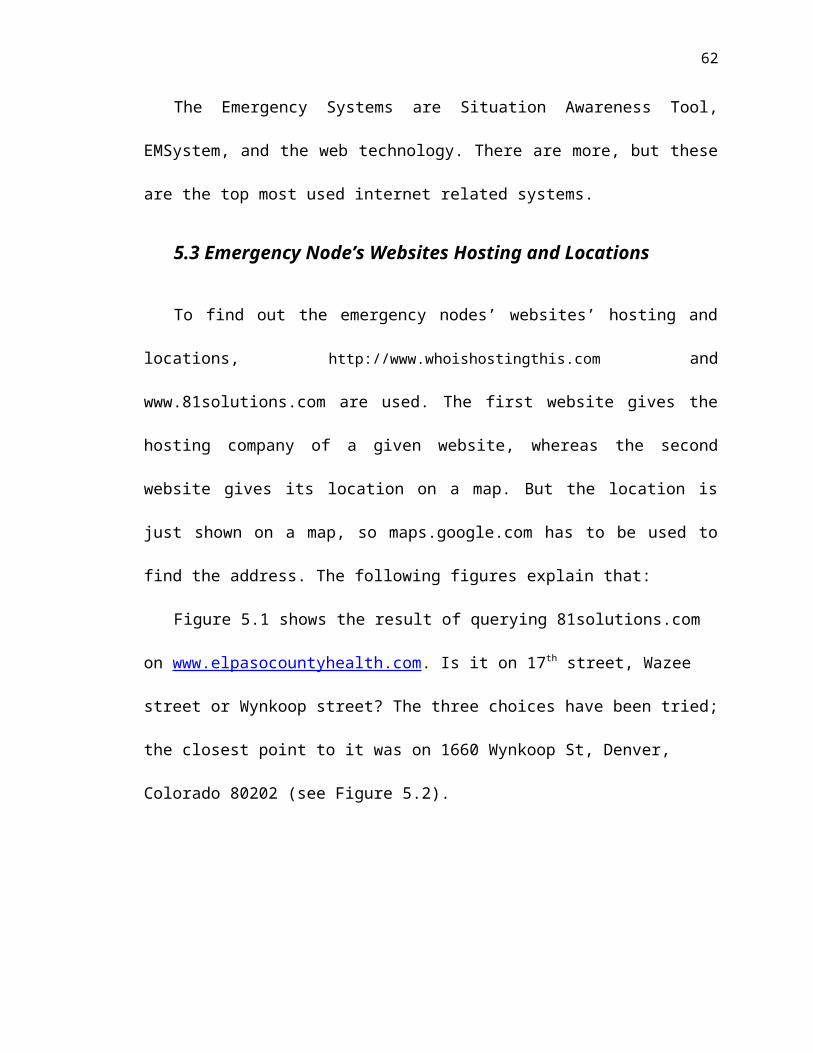
67
Dhamankar, R. et al. iMAP: Discovering Complex Semantic Matches between Database Schemas. SIGMOD, France, 2004, pp. 383-394.
Dirk, B., Schiller, B., Aitenbichler, E., Liebau, N. Towards a Distributed Crisis Response Communication System. Proceedings of the 6th International ISCRAM Conference, Gothenburg, May 2009
Dritsas, S., Gymnopoulos, L., Aryda, M., Alopoulos, T., Kokolakis, S., Lambrinoudakis, C., Ritzalis, S. Employing Ontologies for the development of Security Critical Applications. Department of Informatics, Athens University of Economics and Business, GR-10434, Greedce 2006. Computer Science 189/2005, pp. 187-201.
Ellison, R. Linger, R. Lipson, H. Mead, N. Moore, A. (2002). Foundations for survivable systems engineering. Retrieved January 1, 2010, from http://www.cert.org/archive/html/SSE_foundations.html.
Floyd, S., Paxson, V. Difficulties in simulating the internet. IEEE/ACM Transactions on Networking (TON). 9, 4 (2001), 392-403.
G. F. Riley. Large Scale Network Simualtions with GTNETS. In Proceedings of the 2003 Winter Simulation Conference, 2003.
Hayne, S., Ram, S. Multi- User View Integration System (MUVIS)- An Expert System for View Integration. In the IEEE International Conference on Data Engineering (ICDE). 1990, pp. 402-409.
He, B., Chang, K. A holistic paradigm for large scale schema matching. SiGMOD, France, 2004, pp. 20-25.
Hearst, M. Trends and controversies: Information Integration. IEEE Intelligent Systems Journal, 1998, pp. 12-24.
Hoppel, H., Seedorf, S. Application of Ontologies in Software Engineering. In Workshop on Semantic Web Enabled Software Engng., 5th Intnl. Semantic Web Conf. (2006).
Jack, P., David, A., Dale, H., Sukumar, D. Architecture and Principles of a Modern Integrated Emergency Medical Information Network. Topics in Emergency Medicine: April/May/June 2004 - Volume 26 - Issue 2 - p 103-109
Jack, P., David, A., Dale, H., Sukumar, D. Architecture and Principles of a Modern Integrated Emergency Medical Information Network. Topics in Emergency Medicine: April/May/June 2004 - Volume 26 - Issue 2 - p 103-109
Jha, S., Wing, J. Survivability analysis of networked systems. In Proceedings of the 23rd International Conference on Software Engineering. Toronto, Ontario, 2001, pp. 307-317.
Larson, J. A., Navathe, S. B. Elmasri, R. A Theory of Attribute Equivalence in Databases with Application to Schema Integration. In IEEE Transactions on Software Engineering, 1989, 15(4), pp. 449-463..
Lee, J., Rao, H., R. Exploring the Causes and Effects of Inter-Agency Information Sharing Systems Adoption in the Anti/Counter-Terrorism and Disaster Management Domain.
Lee, J., Rao, H., R. Exploring the Causes and Effects of Inter-Agency Information Sharing Systems
Adoption in the Anti/Counter-Terrorism and Disaster Management Domain. In Proceedings of the 8th annual international conference on Digital government research: bridging disciplines & domains,
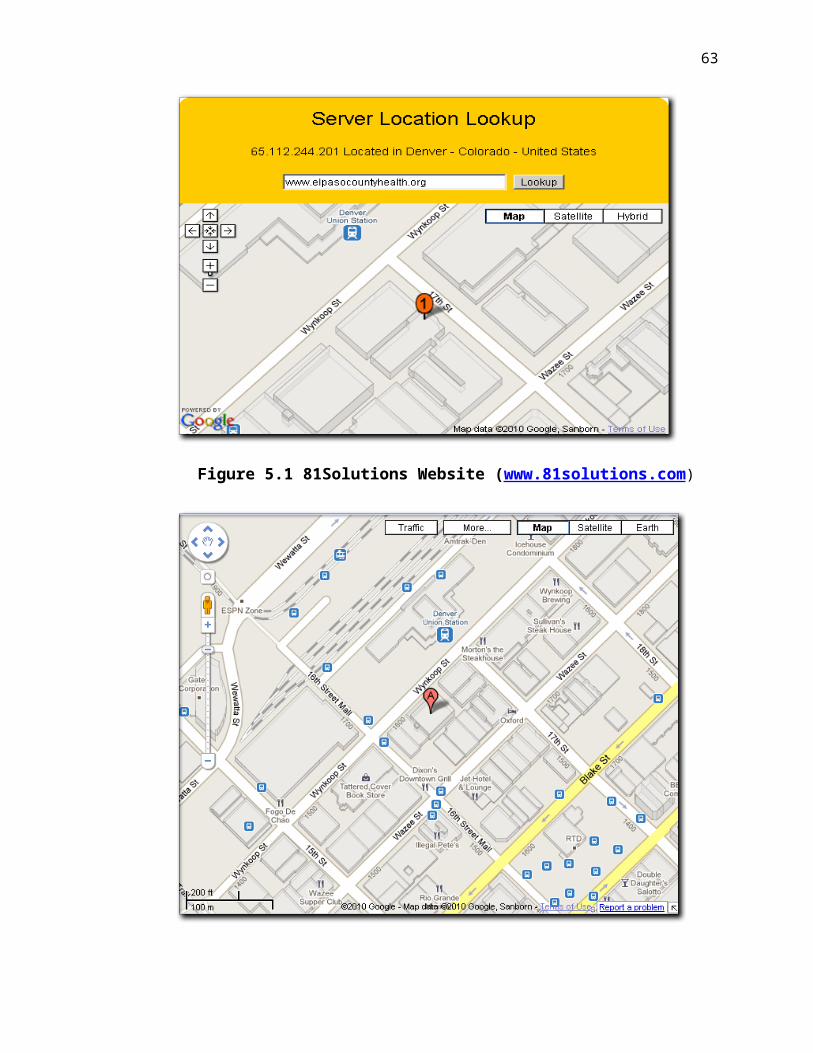
68
Philadelphia, Pennsylvania, 2007. Pp. 155-163.
Malizia, A., Onorati, T., Diaz, P., Aedo, I., Astorga-Paliza, F. An ontology for emergency notification systems accessibility. Expert Systems with Applicatons 37(2010), pp. 3380-3391.
M., Lecage and T.R. Henderson. Yet another network simulator. In WNS2 ’06:Proceeding from the 2006 workshop on ns-2: the IP network simulator, page 12, New York, NY, USA, 2006. ACM.
National Information Exchange Model (NIEM) Program Management Office. Introduction to the National Information Exchange Model (NIEM), Document Version 3. Available from http: // www.niem.gov/files/NIEM_Introduction.pdf (2007); accessed 1 March 2010.
Neches, R., Fikes, R., Finin, T., Gruber, T., Senator, T., Swartout, W. Enabling technology for knowledge sharing. Al Magazine 2006, 12(3), pp. 119-125.
Noy, N.F., Mc Guinness, D.L. “Ontology Development 101: A Guide to creating your first ontology”. Stanford Knowledge Systems Laboratory Technical Report KSL-01-05. 2001.
Pantel, P., Philipot, A., Hovy, E. Aligning Database Columns using Mutual Information. National conference on Digital Government Research, Georgia, 2005, pp. 205-210.
Ruzhi, X., Xiaoliang, D., Feng, Y., Peiguang, L. Emergency preplan knowledge representation and semantic retrieval system based on ontology. In Proceedings of the ICMECG’09 International Conference on Management of e-Commerce and e-Government, Jinan, China, 2009, pp. 124-127.
Reddy, M. P., Prasad, B. E., Reddy, P. G., Gupta, A. A methodology for Integration of Heterogeneous Data-bases. In IEEE Transactions on knowledge and Data Engineering, 1994, 6(6), pp. 920-933.
Ram, S., Zhao, H. Detecting both schema-level and instance level correspondences for the integration of E-catalogs. Paper presented at the Workshop on Information Technology and Systems (WITS), 2001.
R. Siamwalla, R. Sharma, and S. Keshav. Discovering internet topology. IEEE INFOCOM’ 99. July 1998.
Ram, S. Park, J. Semantic conflict resolution ontology (SCROL): An efficient hierarchical ontology schema for detecting and resolving data and schema-level semantic conflicts. IEEE Transactions on Knowledge and Data Engineering , 2003, 15(5).
S. McCanne and S. Floyd. The LBNL network simulator. Software on-line: http://www.isi.edu/nsnam. 1997, Lawrence Berkeley Labortory.
Schintler, L.A. , Gorman, S. , Kulkarni, R. , Stough, R. (2007). Moving from protection to resiliency: A path to securing critical infrastructure. In A.T. Murry, T.H. Grubesic (Ed.), critical infrastructure (pp. 291-307). School of Public Policy, George Mason University, USA.
State Demography Office. Colorado Population Estimates by County 2000-2008. Colorado Department of Local Affairs, 2008.
Tarchi, D., Fantacci, R., Marabissi, D. The Communication Infrastructure for Emergency Management: the In.Sy.Eme. Vision. IWCMC’09, June 21-24, 2009, Leipzig, Germany, pp.618-622.
United and Strengthening America by Providing Appropriate Tools Required to Intercept and Obstruct Terrorism (USA PATRIOT) Act, P.L. 107-56, Title X, Section 1016. 2001.
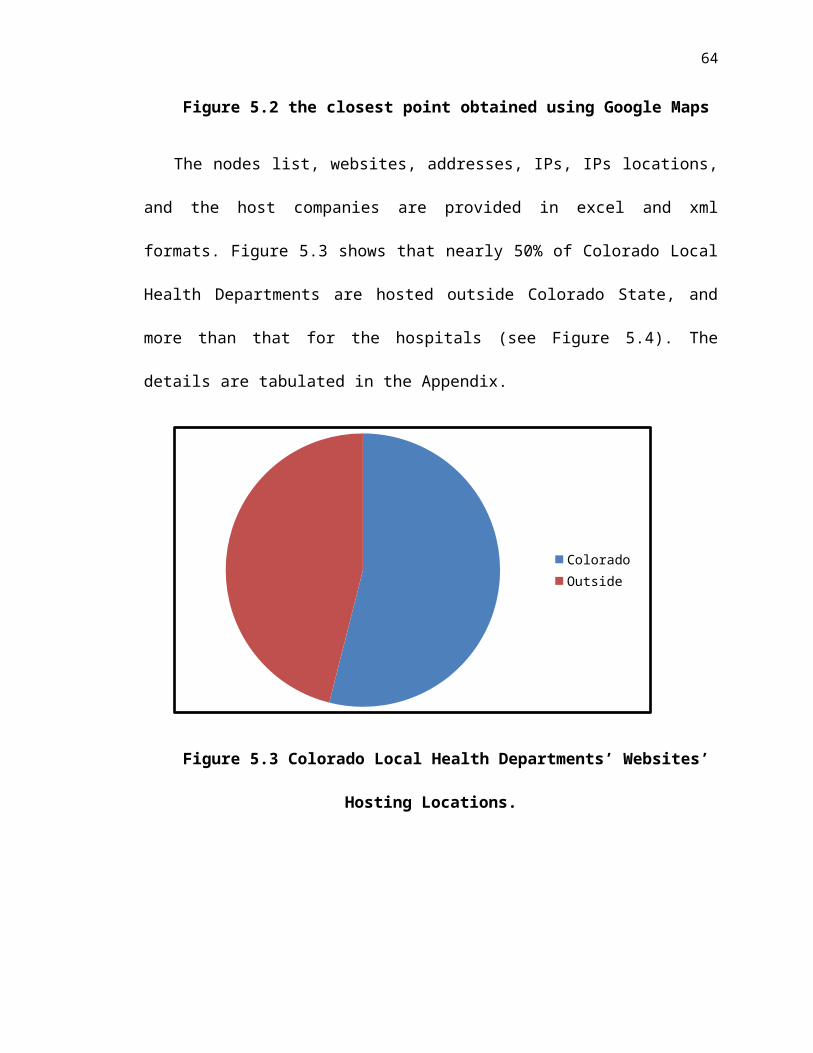
69
Woltjer, R., Trnka, J., Lundberg, J., Johansson, B. Role-playing exercises to strengthen the resilience of command and control systems. In the Proceeding of the 13th European on cognitive ergonomics: trust and control in complex socio-technical systems. Zurich, Switzerland, 2006, pp. 71-78.
Wikipedia. Ontology Language. Retrieved June 21, 2010 from http://en.wikipedia.org/wiki/Ontology_language
Wiechers, W., Daskapan, S., Vree, W. Simulating the establishment of trust infrastructures in multi-agent systems. Proceedings of the 6th international conference on Electronic commerce, 2004. Pp. 255-264.
Weingartner, E., Lehn, H., Wehrle, K . A performance comparison of recent network simulators. IEEE International Conference on Communications. Dresden, 2009, Pp. 1-5.
Weingartner, E., Lehn, H., Wehrle, K. A performance comparison of recent network simulators. IEEE International Conference on Communications. Dresden, 2009, pp. 1-5.
Xiang, L., Gang, L., Anhong, L., Jian, Z., Ning, A., Lian, L., Yongzhong, S. Building a practical ontology for emergency response systems. In Proceedings of the International Conference on Computer Science and Software Engineering, Wuhan, Hubei, 2008, pp. 222-225.
Yu, C., Popa, L. Semantic Adaptation of Schema Mappings when Schema Evolve. Norway, 2005, pp. 1006-1017.
Zhang, W., Zhang, W. Linux Virtual Servers Clusters. Linux Magazine, 2003, pp. 1-13.
Zhang, N., Zhao, W. Distributed Privacy Preserving Information Sharing. VLDB, Norway, 2005, pp. 889-900.
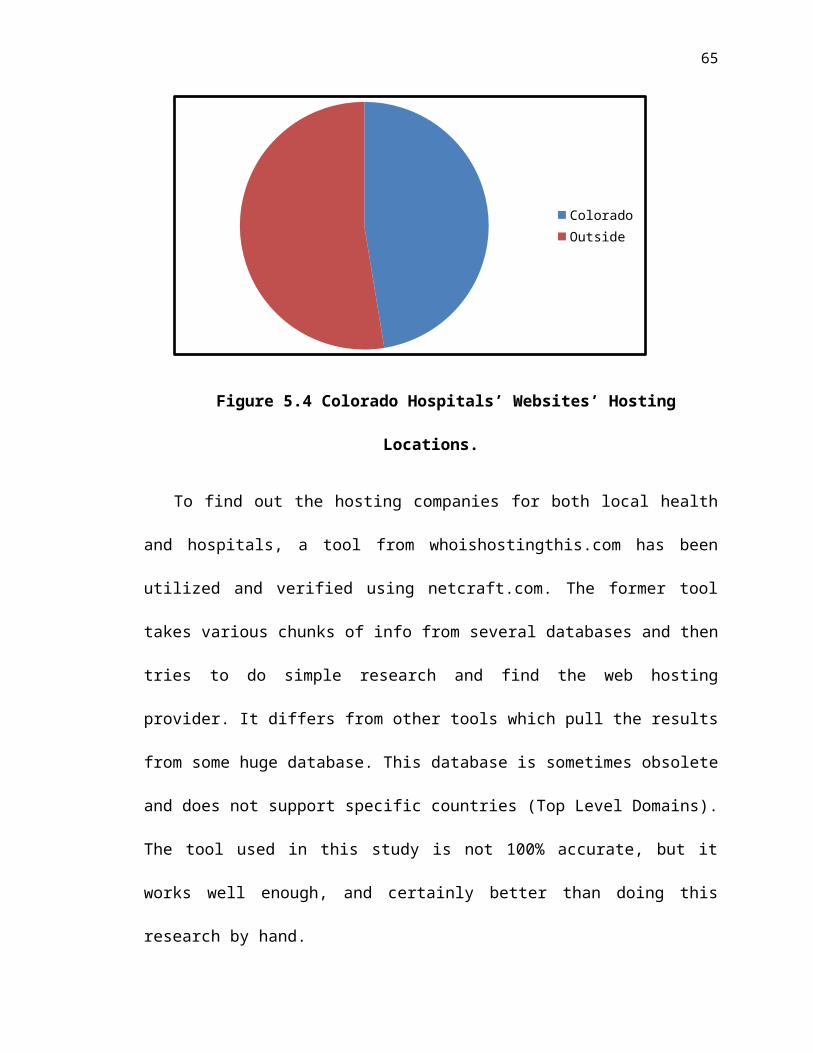
70
Appendix A:
Websites’ Hosting Party and Location A.1 Local Health Departments’ Websites’ Hosting Location
This table shows the Local Health Departments’ Websites’ hosting per state.
State # of websitesColorado 41Kansa 8Texas 4Pennsylvania 4California 4Illinois 3Utah 3Florida 1Massachustts 1New york 1Wisconsin 1Washington 1
A.2 Hospitals’ Websites’ Hosting Location This table shows the Local Health Departments’ Websites’ hosting per state.
State # of websitesColorado 46
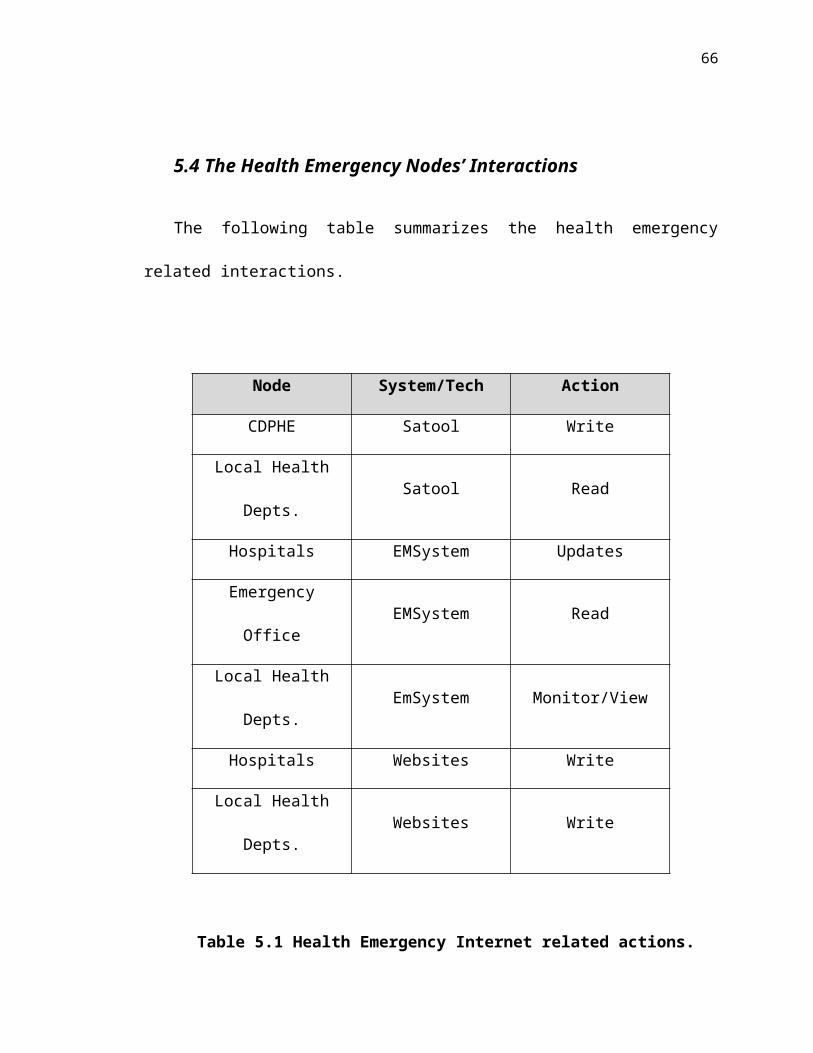
71
Kansas 6California 6Iowa 5Tenassee 4Canada 3Virginia 3Texas 3Arizona 3Georgia 2Alabama 2Utah 1Florida 1North Carolina 1New york 1
A.3 Local Health Departments’ Websites’ Hosting Party
Local Health DepartmentsHosting
FrequencyCommercial 63City and County of Denver 1Denver Health and Hospital Authority 1Colorado Government TechnologyServices 5NorthEast Colorado Health Department 1County of Lake 2San Juan County 1Universities 2
A.4 Hospitals’ Websites’ Hosting Party
Hospitals Hosting Frequency
Community Health Systems 3
72
Denver Health and Hospital Authority 1CITY AND COUNTY OF DENVER 2Headquarters, USAISC 1MEDSEEK 4Departments of Veterans Affairs 3Health South Corporation 1Colorado Government TechnologyServices 3MEMORIAL HEALTH SYSTEM 1MERCY MEDICAL 1Universities 1CARETECH SOLUTIONS 1
73
Appendix B:
Downloading and Installing Google Earth 5.1
B.1 Download Google Earth from http://earth.google.com/download-earth-advanced.html
B.2 Install Google Earth
74
B.3 Start the Google Earth from the Start menu
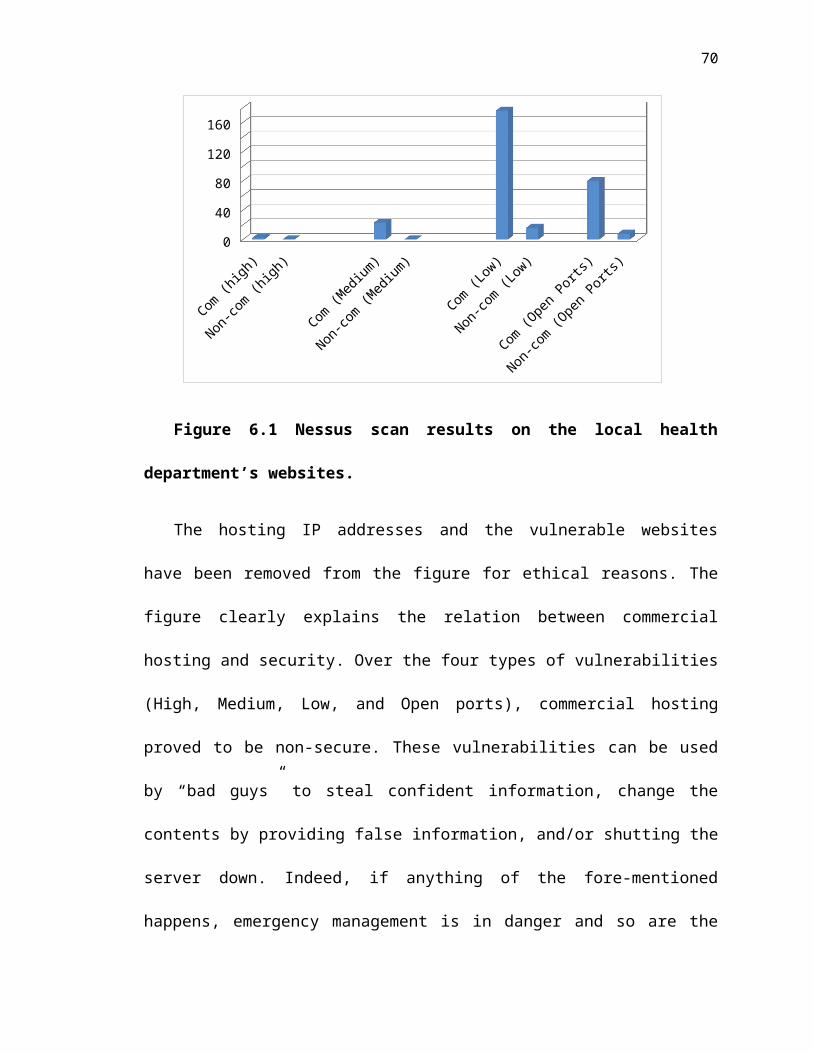
75
B.4 Open the kml and kmz files into your working space
B.5 Creating a Tour in Google Earth First, create the points and lines that your tour will contain.
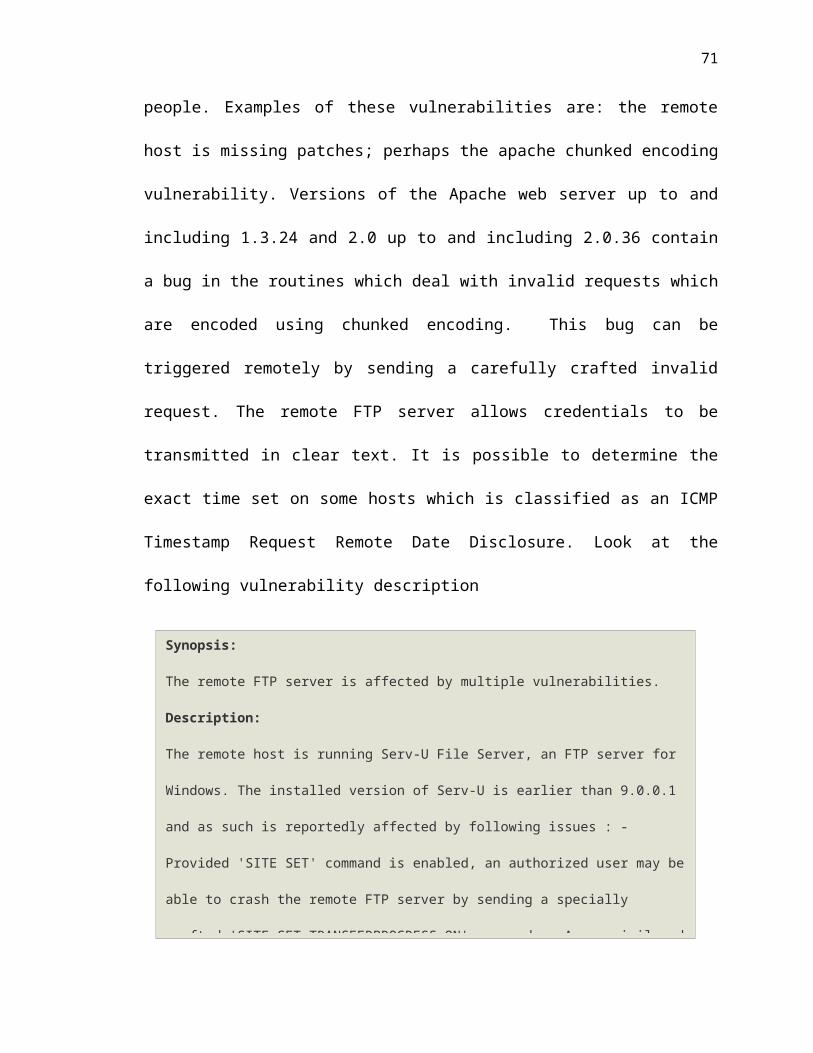
76
Then press the Tour button,
Then press the start button,
Now, click on the points and lines in the sequence you want them to be presented on the tour. When you finish, press the start button again..
77
Appendix C:
Downloading and Installing Nessus
C.1 Subscribe to a Plugin Feed to be able to use Nessus http://www.nessus.org/register/
C.2 Download Nessus http:// www.nessus.org/download/nessus_download.php
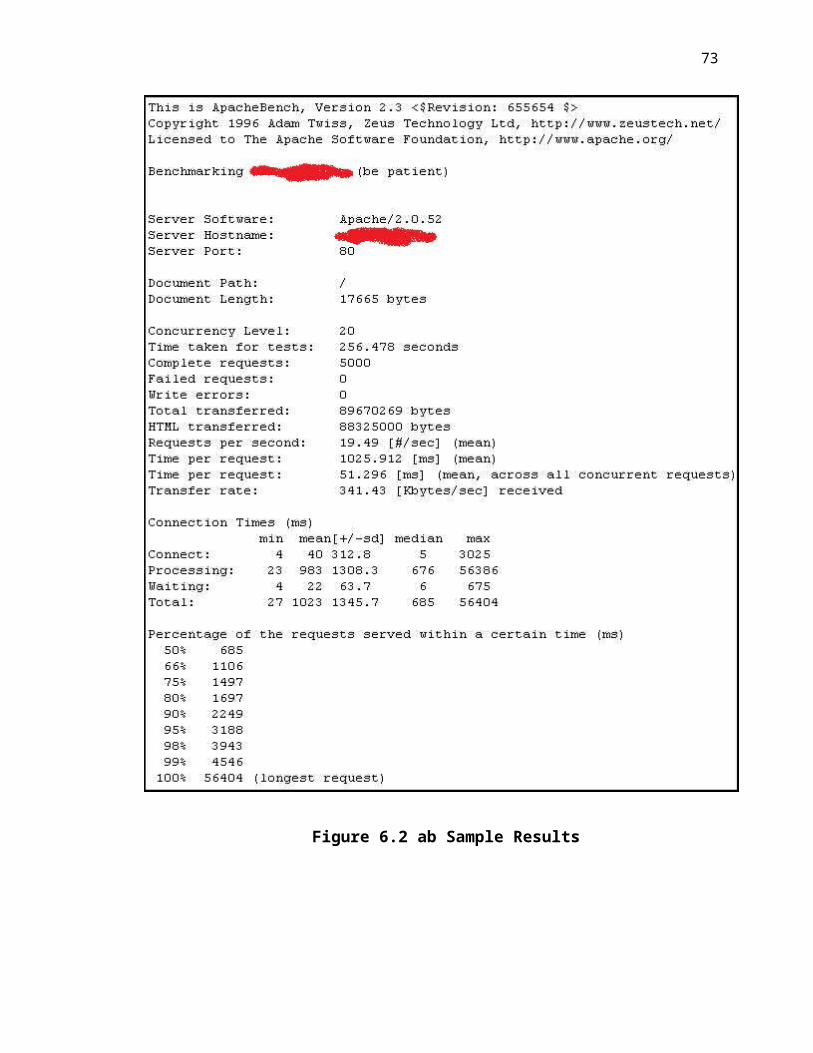
78
C.3 Star the Nessus Server
C.4 Start Nessus Web Application
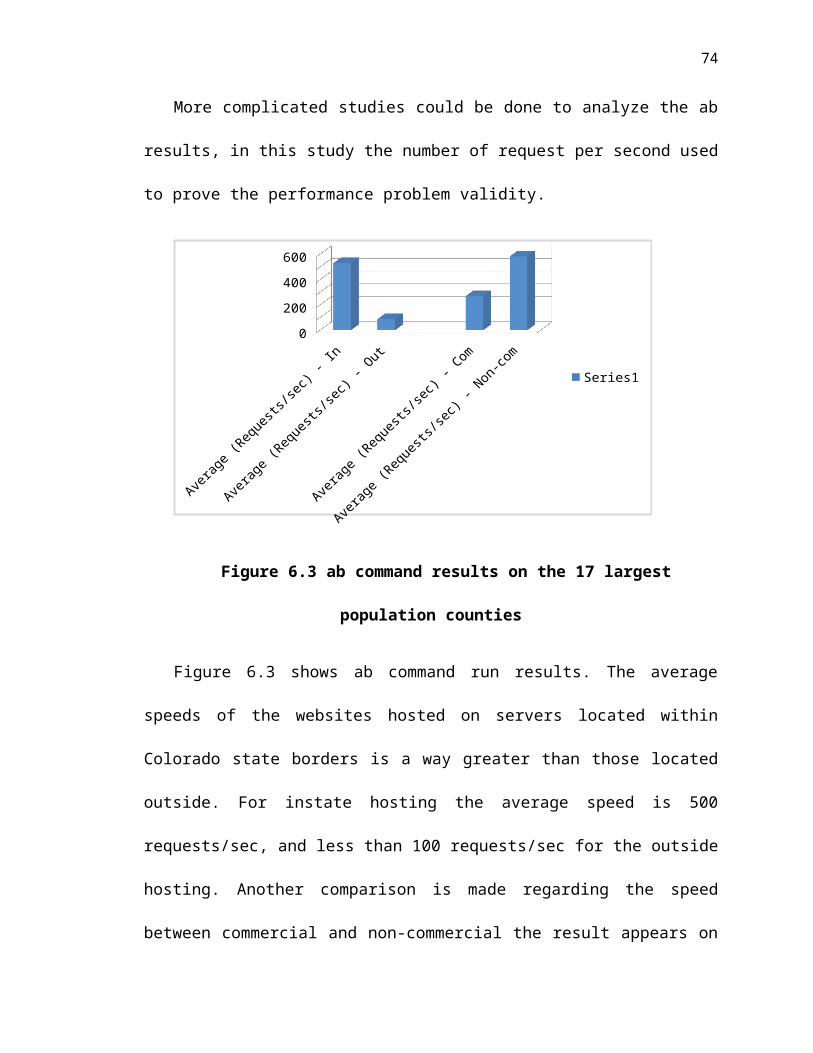
79
C.5 Explore NessusTo explore Nessus, go over the top menu taps from right to left. Manage users first,
then create a policy, launch a scan by providing IP addresses each per line or provide a text file that contains the entire target IP addresses
C.6 Nessus during the scan
80
C.7 Short Report
81
Appendix D:
Downloading and Installing Protégé
D.1 Download Protégé 3.4.4 (this version support Owl AND RDF) from http:// protege.stanford.edu/download/protege/3.4/installanywhere/
D.2 after you finish the download and install, start the program and hit open, then select AFAO.pprj

82
D.3 Explore the top five tabs
Appendix E:
83
Network Simulator 3.6
E.1. to Download Network Simulator 3.6 follow the steps in http:// www.nsnam.org/docs/tutorial.html#Downloading-ns_002d3
E.2 Run the Thesis NS-3 CodeCopy the NS3Code.cc file into the ns-3.6/ scratch folder, then compile with ./waf command, then run using ./waf –run,
Then you should see this,
E.3 NS-3 OutputThe ns-3 code will produce two kinds of output: pcap files and flowmon (xml) file.
84
The pcap files can be opened using WireShark.
Whereas the xml file can be opened with any text editor (e.g. gedit for linux, TextPad for windows). The xml file reports the flow information.
E.4 NS-3 Code
85
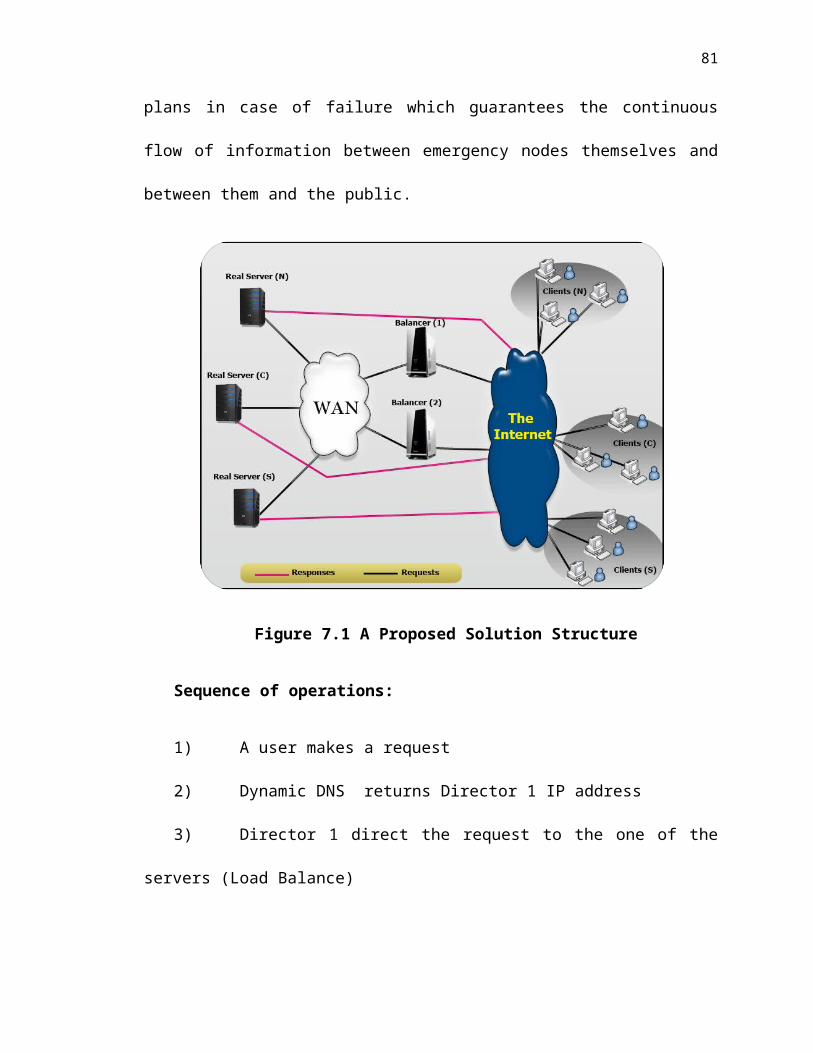
86
87
88
89
90
91
92
93
94
95
96