Embed Size (px)
Citation preview
CST Brands, Inc. Investor Update
September 2015

Safe Harbor Statements Forward-Looking Statements Statements contained in this presentation that state the Company’s or management’s expectations or predictions of the future are forward-looking statements are intended to be covered by the safe harbor provisions of the Securities Act of 1933, as amended, and the Securities Exchange Act of 1934, as amended. The words “believe,” “expect,” “should,” “intends,” “estimates,” and other similar expressions identify forward-looking statements. It is important to note that actual results could differ materially from those projected in such forward-looking statements. For more information concerning factors that could cause actual results to differ from those expressed or forecasted, see CST filings with the Securities and Exchange Commission (“SEC”), including the Risk Factors in our most recently filed Annual Reports on Form 10-K as filed with the SEC and available on CST Brand’s website at www.cstbrands.com. If any of these risks or uncertainties materialize, or if our underlying assumptions prove to be incorrect, actual results may vary significantly from what we projected. Any forward-looking statement you see or hear during this presentation reflects our current views as of the date of this presentation with respect to future events. We assume no obligation to publicly update or revise these forward-looking statements for any reason, whether as a result of new information, future events, or otherwise. Non-GAAP Financial Measures To supplement our consolidated and combined financial statements prepared in accordance with accounting principles generally accepted in the United States (“GAAP”) and to better reflect period-over-period comparisons, we use non-GAAP financial measures that either exclude or include amounts that are not normally excluded or included in the most directly comparable measure, calculated and presented in accordance with GAAP. Non-GAAP financial measures do not replace and are not superior to the presentation of GAAP financial results, but are provided to improve overall understanding of our current financial performance and our prospects for the future. We believe the non-GAAP financial results provide useful information to both management and investors regarding certain additional financial and business trends relating to financial condition and operating results. In addition, management uses these measures, along with GAAP information, for reviewing financial results and evaluating our historical operating performance. The non-GAAP adjustments for all periods presented are based upon information and assumptions available as of the date of this presentation. The non-GAAP information is not prepared in accordance with GAAP and may not be comparable to non-GAAP information used by other companies. Information regarding the non-GAAP financial measure referenced in this presentation, including the reconciliation to the nearest GAAP measure can be found in our financial results press releases, available on our web sites: www.cstbrands.com.
1
1
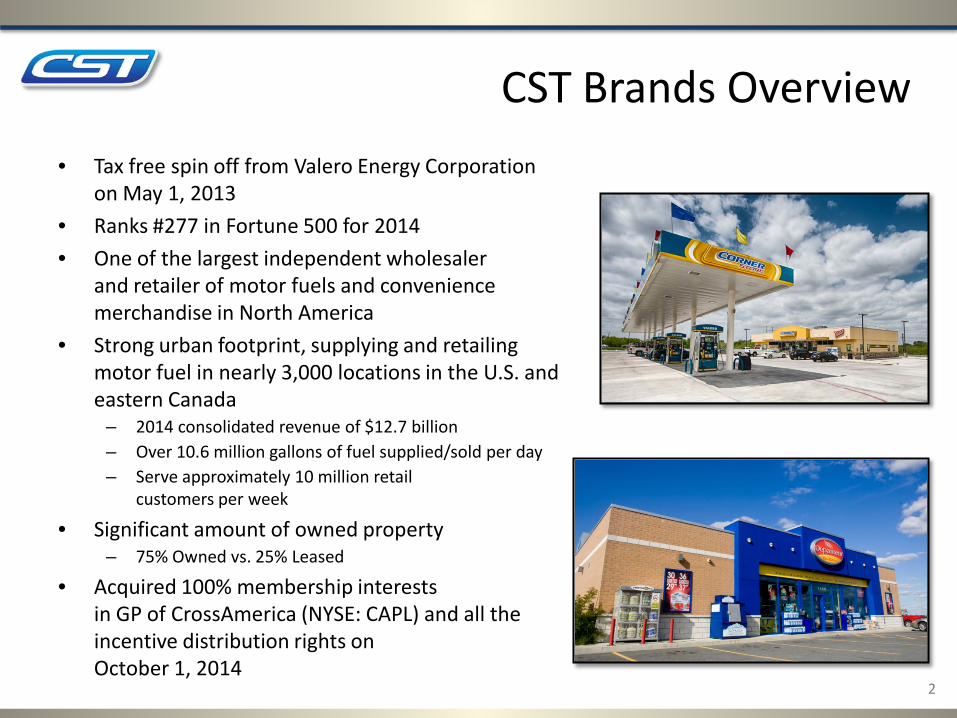
CST Brands Overview • Tax free spin off from Valero Energy Corporation
on May 1, 2013 • Ranks #277 in Fortune 500 for 2014 • One of the largest independent wholesaler
and retailer of motor fuels and convenience merchandise in North America
• Strong urban footprint, supplying and retailing motor fuel in nearly 3,000 locations in the U.S. and eastern Canada
– 2014 consolidated revenue of $12.7 billion – Over 10.6 million gallons of fuel supplied/sold per day – Serve approximately 10 million retail
customers per week
• Significant amount of owned property – 75% Owned vs. 25% Leased
• Acquired 100% membership interests in GP of CrossAmerica (NYSE: CAPL) and all the incentive distribution rights on October 1, 2014
2
2
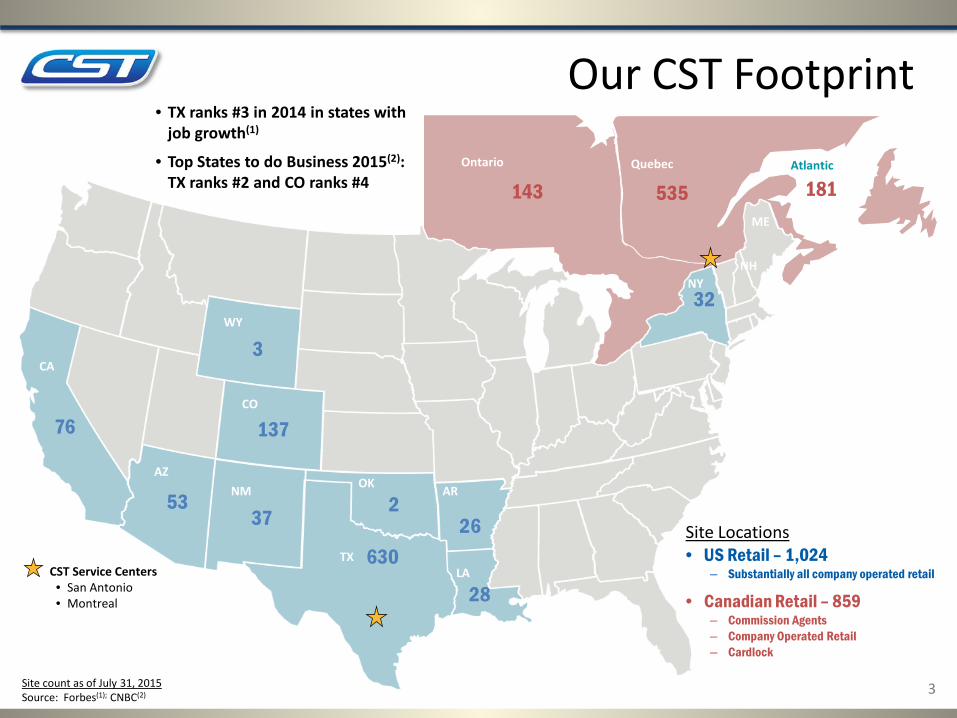
• TX ranks #3 in 2014 in states with job growth(1)
• Top States to do Business 2015(2): TX ranks #2 and CO ranks #4
Our CST Footprint
Site Locations
• US Retail – 1,024 – Substantially all company operated retail
• Canadian Retail – 859
– Commission Agents – Company Operated Retail – Cardlock
CO
76
AZ NM OK
TX
AR
LA
WY
Site count as of July 31, 2015 Source: Forbes(1); CNBC(2)
CST Service Centers • San Antonio • Montreal
Ontario Quebec Atlantic
CA
53 37
137
3
630
2 26
28
143 535 181
NY 32
NH
ME
3
4
4
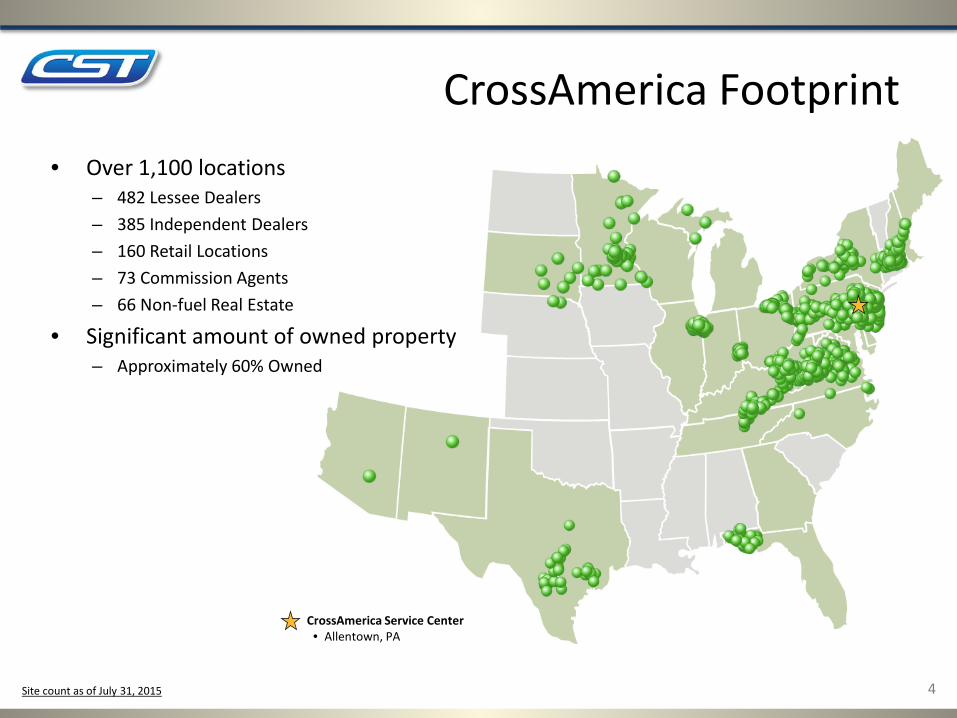
CrossAmerica Footprint • Over 1,100 locations
– 482 Lessee Dealers – 385 Independent Dealers – 160 Retail Locations – 73 Commission Agents – 66 Non-fuel Real Estate
• Significant amount of owned property – Approximately 60% Owned
CrossAmerica Service Center • Allentown, PA
Site count as of July 31, 2015
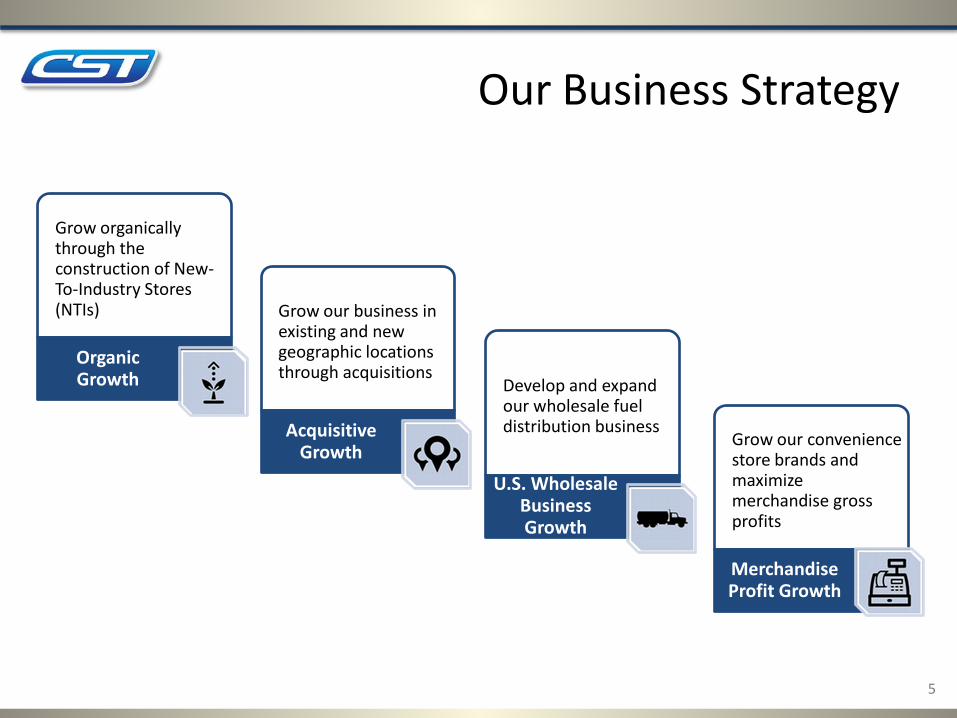
• Grow organically through the construction of New- To-Industry Stores (NTIs)
Organic Growth
• Grow our business in existing and new geographic locations through acquisitions
Acquisitive Growth
• Develop and expand our wholesale fuel distribution business
U.S. Wholesale Business Growth
• Grow our convenience store brands and maximize merchandise gross profits
Merchandise Profit Growth
Our Business Strategy
5
5
6

2009 2010 2011 2012 2013 2014 2015* Totals Canada R&R 2 3 5 2 2 3 3 20 Canada NTI 3 2 3 5 7 10 11 41 U.S. R&R 0 1 1 2 4 3 3 14 U.S. NTI 4 7 6 11 15 28 38 109
Organic Growth
• MLP capital helps fund high-return growth
• U.S. NTIs constructed 2008-2013 (matured NTIs) – 48 stores
• Total U.S. & Canada 2015 CAPEX Guidance of $350 - $400 million – $90 - $110 million of sustaining CAPEX, which includes R&R growth
• Matured NTIs are generating EBITDA ROI ≈ 15%
• U.S. NTIs constructed 2014-2015* – 66 stores
CST New-To-Industry (NTI) and Raze and Rebuild (R&R) Growth
7
* 2015 NTIs reflect the mid-point of current guidance, 35-40 stores in US and 10-12 stores in Canada 7

Funding of Organic Growth Dropdown Transactions with CrossAmerica
Transaction #1 January 2015
5% interest in CST Fuel Supply
$50.4 M in CrossAmerica units* $142.0 M in Cash + $119.5 M in CrossAmerica units* $261.5 M in Total Value
Transaction #2 July 2015
12.5% interest in CST Fuel Supply
Sale/Leaseback of Real Property for 29 NTI Stores
&
8 *Unit value was based on the 20 day VWAP unit price before the public announcement of the transaction
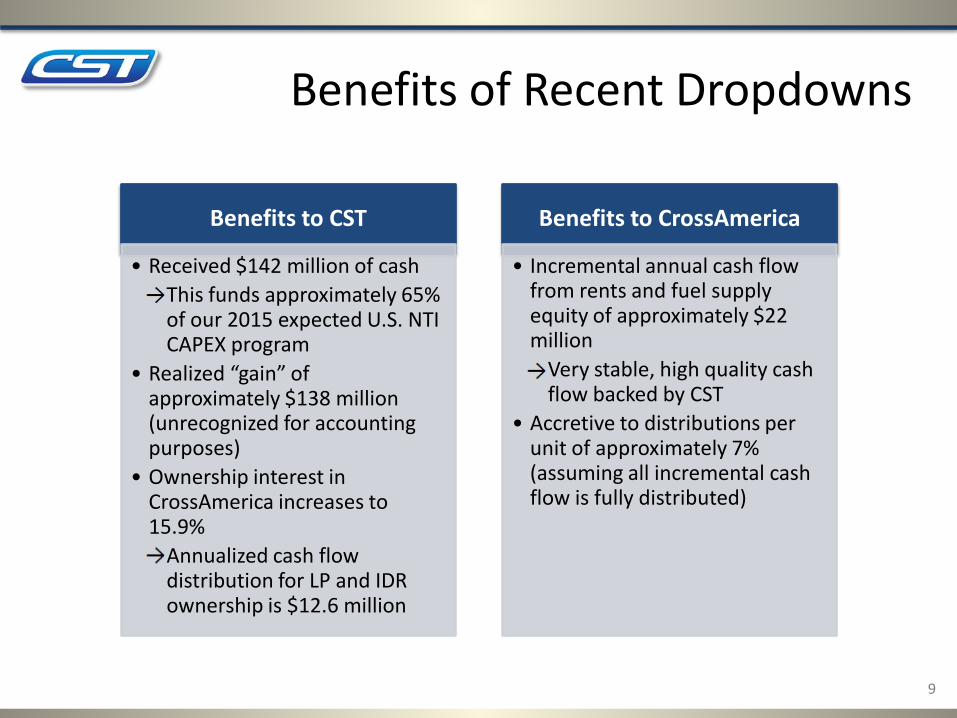
Benefits of Recent Dropdowns
Benefits to CST
• Received $142 million of cash • This funds approximately 65%
of our 2015 expected U.S. NTI CAPEX program
• Realized “gain” of approximately $138 million (unrecognized for accounting purposes)
• Ownership interest in CrossAmerica increases to 15.9% • Annualized cash flow
distribution for LP and IDR ownership is $12.6 million
Benefits to CrossAmerica
• Incremental annual cash flow from rents and fuel supply equity of approximately $22 million • Very stable, high quality cash
flow backed by CST • Accretive to distributions per
unit of approximately 7% (assuming all incremental cash flow is fully distributed)
9
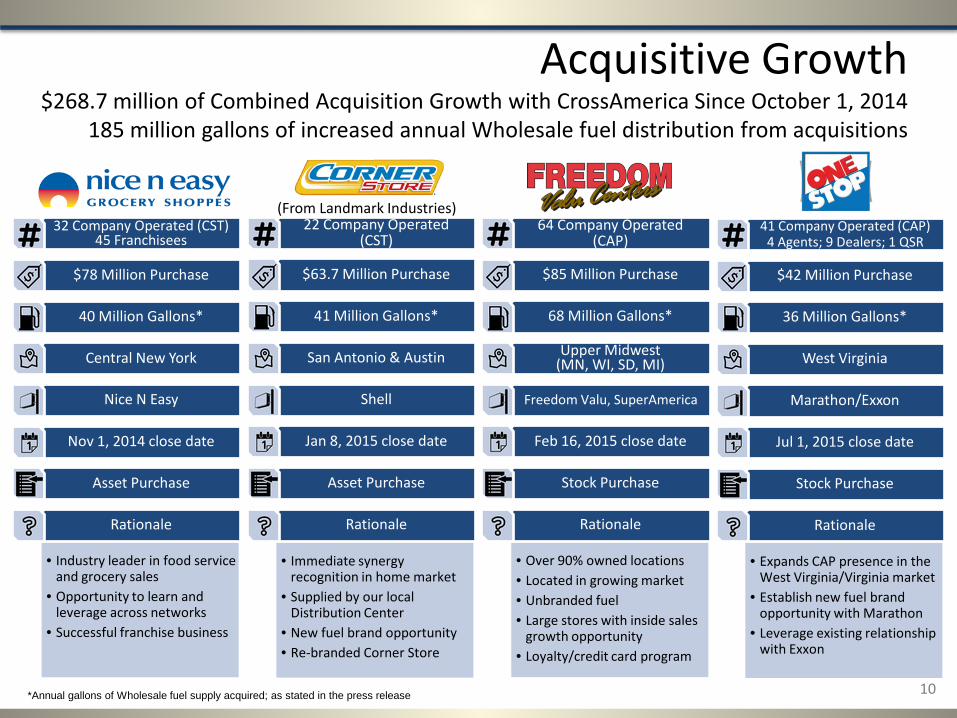
Acquisitive Growth $268.7 million of Combined Acquisition Growth with CrossAmerica Since October 1, 2014
185 million gallons of increased annual Wholesale fuel distribution from acquisitions
10
• Immediate synergy recognition in home market
• Supplied by our local Distribution Center
• New fuel brand opportunity • Re-branded Corner Store
22 Company Operated (CST)
$63.7 Million Purchase
41 Million Gallons*
San Antonio & Austin
Shell
Jan 8, 2015 close date
Asset Purchase
Rationale
(From Landmark Industries)
• Industry leader in food service and grocery sales
• Opportunity to learn and leverage across networks
• Successful franchise business
32 Company Operated (CST) 45 Franchisees
$78 Million Purchase
40 Million Gallons*
Central New York
Nice N Easy
Nov 1, 2014 close date
Asset Purchase
Rationale
• Expands CAP presence in the West Virginia/Virginia market
• Establish new fuel brand opportunity with Marathon
• Leverage existing relationship with Exxon
41 Company Operated (CAP) 4 Agents; 9 Dealers; 1 QSR
$42 Million Purchase
36 Million Gallons*
West Virginia
Marathon/Exxon
Jul 1, 2015 close date
Stock Purchase
Rationale
• Over 90% owned locations • Located in growing market • Unbranded fuel • Large stores with inside sales
growth opportunity • Loyalty/credit card program
64 Company Operated (CAP)
$85 Million Purchase
68 Million Gallons*
Upper Midwest (MN, WI, SD, MI)
Freedom Valu, SuperAmerica
Feb 16, 2015 close date
Stock Purchase
Rationale
*Annual gallons of Wholesale fuel supply acquired; as stated in the press release
11
11
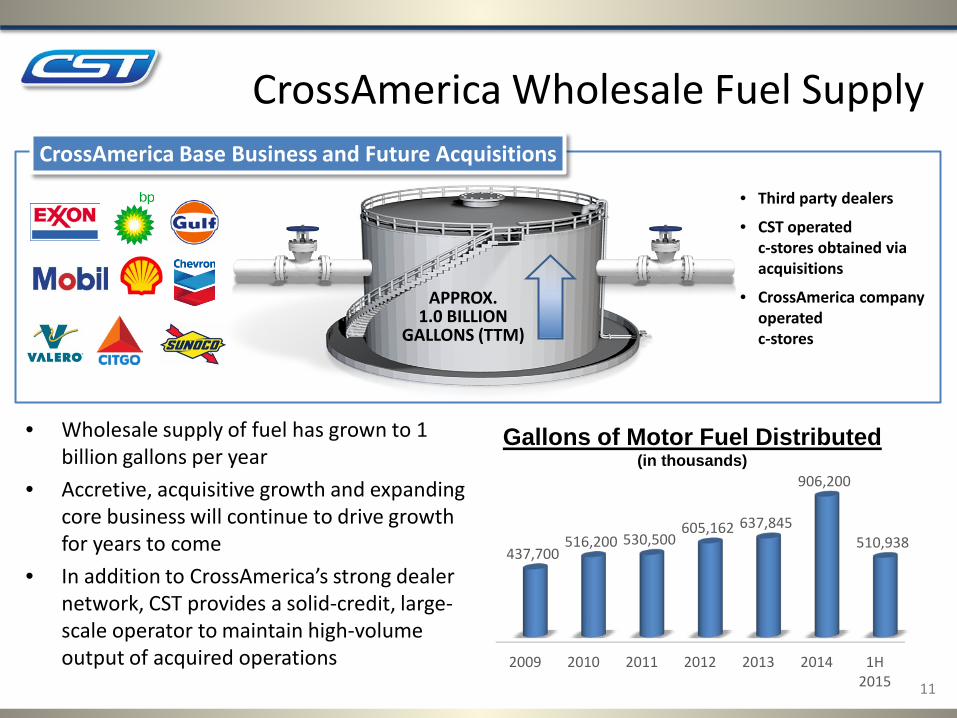
CrossAmerica Wholesale Fuel Supply
APPROX. 1.0 BILLION
GALLONS (TTM)
• Third party dealers
• CST operated c-stores obtained via
acquisitions
• CrossAmerica company operated
c-stores
CrossAmerica Base Business and Future Acquisitions
• Wholesale supply of fuel has grown to 1 billion gallons per year
• Accretive, acquisitive growth and expanding core business will continue to drive growth for years to come
• In addition to CrossAmerica’s strong dealer network, CST provides a solid-credit, large-scale operator to maintain high-volume output of acquired operations
Gallons of Motor Fuel Distributed (in thousands)
2009 2010 2011 2012 2013 2014 1H 2015
437,700 516,200 530,500
605,162 637,845
906,200
510,938
12
12
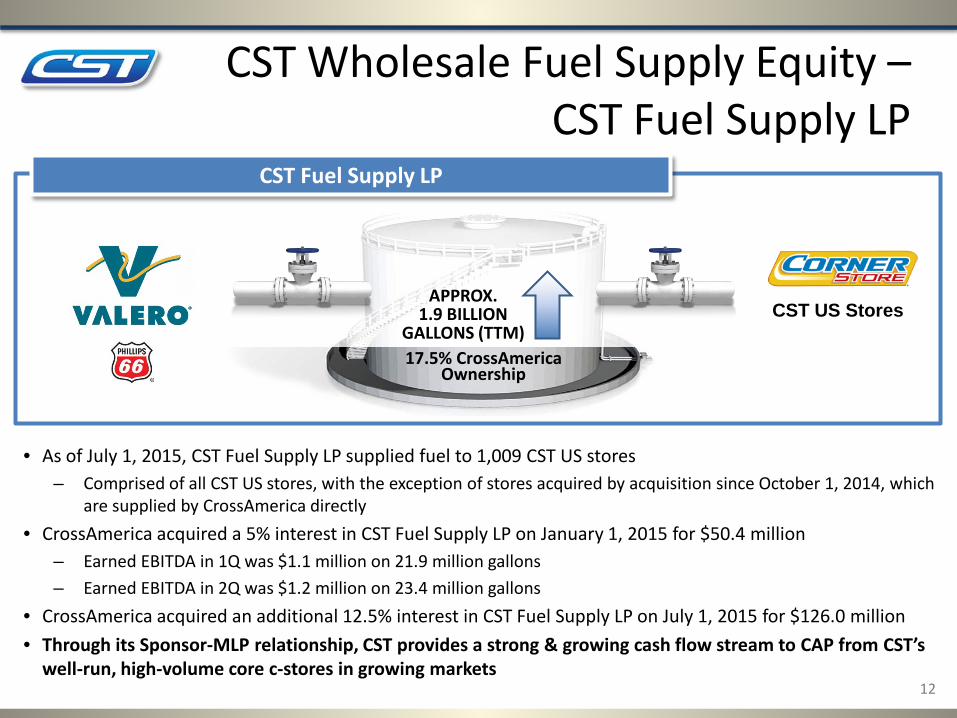
CST Wholesale Fuel Supply Equity – CST Fuel Supply LP
CST US Stores
17.5% CrossAmerica Ownership
CST Fuel Supply LP
APPROX. 1.9 BILLION
GALLONS (TTM)
• As of July 1, 2015, CST Fuel Supply LP supplied fuel to 1,009 CST US stores – Comprised of all CST US stores, with the exception of stores acquired by acquisition since October 1, 2014, which
are supplied by CrossAmerica directly
• CrossAmerica acquired a 5% interest in CST Fuel Supply LP on January 1, 2015 for $50.4 million – Earned EBITDA in 1Q was $1.1 million on 21.9 million gallons – Earned EBITDA in 2Q was $1.2 million on 23.4 million gallons
• CrossAmerica acquired an additional 12.5% interest in CST Fuel Supply LP on July 1, 2015 for $126.0 million • Through its Sponsor-MLP relationship, CST provides a strong & growing cash flow stream to CAP from CST’s
well-run, high-volume core c-stores in growing markets

Financial Metrics – CST
5,059 5,083 4,997 4,901 5,105
$0.131 $0.147 $0.139
$0.201
$0.132
2011 2012 2013 2014 1H 2015
Fuel Volume Fuel Margin
U.S. Fuel Volume and CPG Margin (net)
Note: Fuel margins are net of credit card fees, and prior years are adjusted for commercial agreements.
(Gallons per store per day)
13
3,320 3,340 3,298 3,230 3,147
$0.263 $0.233 $0.238 $0.240 $0.222
2011 2012 2013 2014 1H 2015
Fuel Volume Fuel Margin
Canada Fuel Volume and CPG Margin (net)
Note: Fuel margins are net of credit card fees, prior years are adjusted for commercial agreements, include Cardlock motor fuel sales, and have been adjusted to remove the effects of LIFO.
(Gallons per store per day)
13

14
14
Merchandise Margin Improvement Strategy
1. Expand food service penetration 2. Continue to develop our private label
packaged goods offering 3. Leverage logistics system to lower total cost of
goods 4. Capitalize our highly developed immediately
consumable business
Targeting merchandise gross profit margin improvements year over year by 50 basis points

Merchandise Profit Growth
• US merchandise sales per store are up 5% from 2012
• Sales per store are up despite lower fuel volume as we drive for fuel margin gross profit improvement
• Rolling out a grocery fill-in program
Grow inside sales by expanding offerings and driving traffic
• US merchandise gross profit is up 10% from 2012, despite lower store count
• Food sales growing at a faster rate than overall merchandise
• Expanding prepared food programs
• Testing Nice N Easy Made to Order food program
Focus on higher margin food category to expand merchandise gross profit
• Opened 3x larger new Corner Store Distribution Center in 1Q15
• Distribution Center enables private label, food service and perishable food growth
• Servicing 22 stores acquired from Landmark Industries
Improve distribution capabilities to support organic and acquisitive growth
15
15
16
16
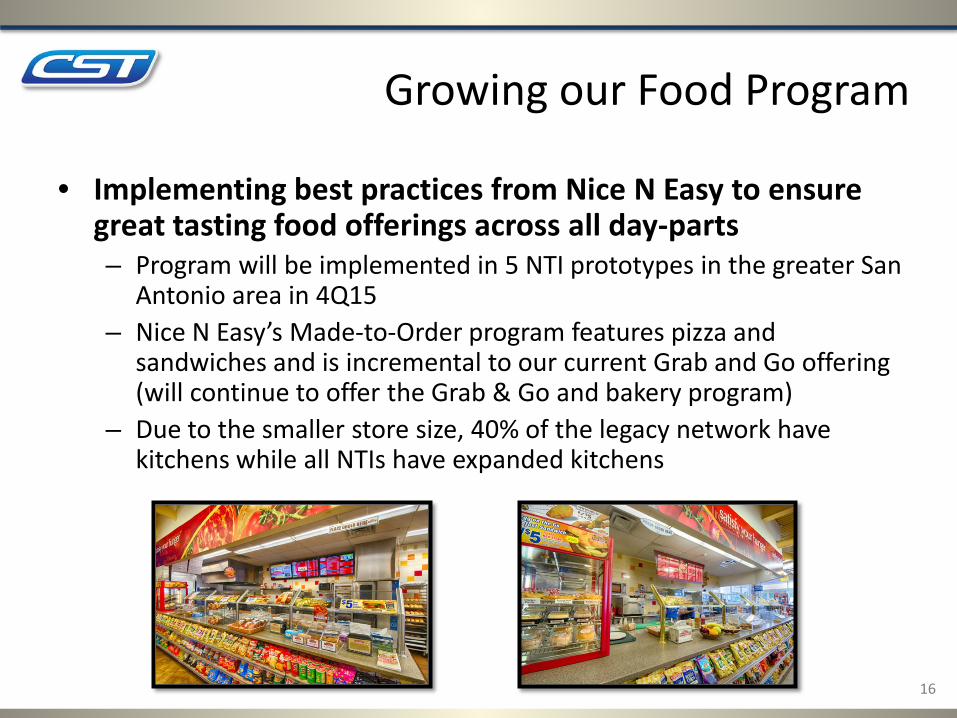
Growing our Food Program
• Implementing best practices from Nice N Easy to ensure great tasting food offerings across all day-parts – Program will be implemented in 5 NTI prototypes in the greater San
Antonio area in 4Q15 – Nice N Easy’s Made-to-Order program features pizza and
sandwiches and is incremental to our current Grab and Go offering (will continue to offer the Grab & Go and bakery program)
– Due to the smaller store size, 40% of the legacy network have kitchens while all NTIs have expanded kitchens

17
Food Offerings
17

18
18
Expanding Grocery Offerings
• Enhances large store product mix • Provides a fill-in alternative to grocery and drug channels • Implemented in 50 stores across our distribution center orbit • Opportunity to grow private label offering (200+ SKUs and
growing in U.S. and Canada)

Financial Metrics – CST U.S. Merchandise & Other Sales and Margin %
Note: Merchandise & Other Sales includes all non-fuel sales and are before credit card fees. Other Category Sales only include net revenue earned.
(Sales per store per day)
$3,510 $3,509 $3,533 $3,673 $4,076
32.6% 33.4% 33.5% 33.8%
2011 2012 2013 2014 1H 2015
Merch. & Other Sales Merch. & Other Gross Margin
19
$2,970 $2,922 $2,906 $2,910 $2,906
33.8% 33.7% 32.2% 31.8% 33.4%
2011 2012 2013 2014 1H 2015
Merch. & Other Sales Merch. & Other Gross Margin
Canada Merchandise & Other Sales and Margin %
Note: Merchandise & Other Sales includes all non-fuel sales in company operated retail locations, and are before credit card fees. Other Category Sales only include net revenue earned.
(Sales per store per day, CAD$)
33.5%
19
18%
30%
17%
12%
14%
9%
Alcohol Cigarette Beverage
Snacks/Gum/Candy Miscellaneous Food Service
Legacy Stores
U.S. Merchandise Category Sales
18%
20%
17% 12%
14%
19%
1H 2015
29%
28%
24%
5% 14%
ATM Lottery Car Wash Money Order Miscellaneous
U.S. Other Category Sales
19%
18%
48%
1% 14%
1H 2015
NTI Stores
Legacy Stores NTI Stores
Note: Other Category Sales only include net revenue earned.
20
20
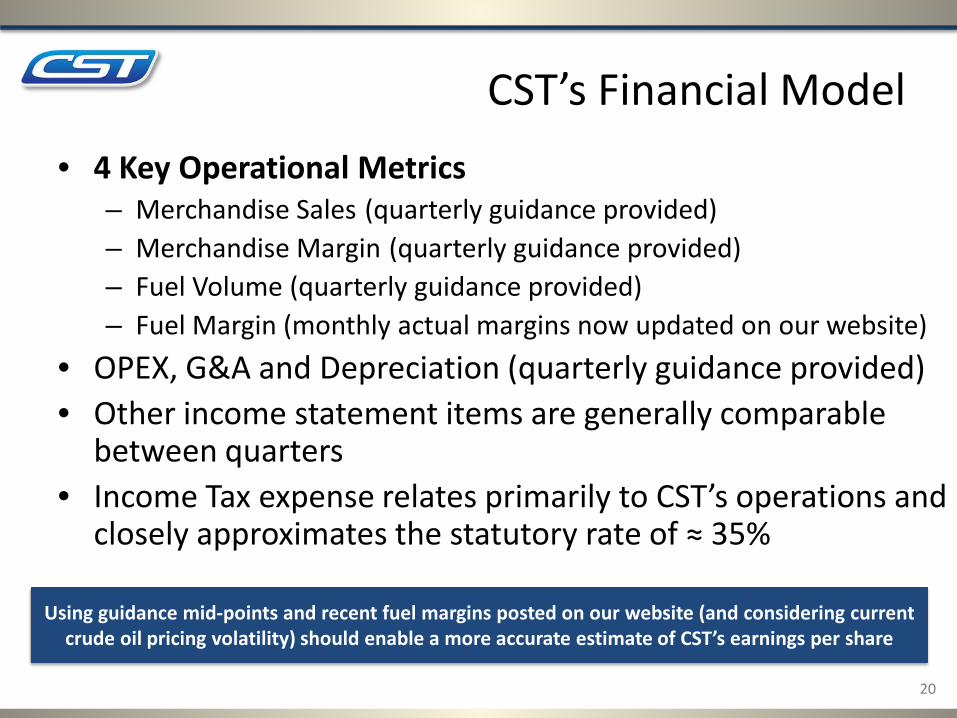
CST’s Financial Model • 4 Key Operational Metrics
– Merchandise Sales (quarterly guidance provided) – Merchandise Margin (quarterly guidance provided) – Fuel Volume (quarterly guidance provided) – Fuel Margin (monthly actual margins now updated on our website)
• OPEX, G&A and Depreciation (quarterly guidance provided) • Other income statement items are generally comparable
between quarters • Income Tax expense relates primarily to CST’s operations and
closely approximates the statutory rate of ≈ 35%
Using guidance mid-points and recent fuel margins posted on our website (and considering current crude oil pricing volatility) should enable a more accurate estimate of CST’s earnings per share
21
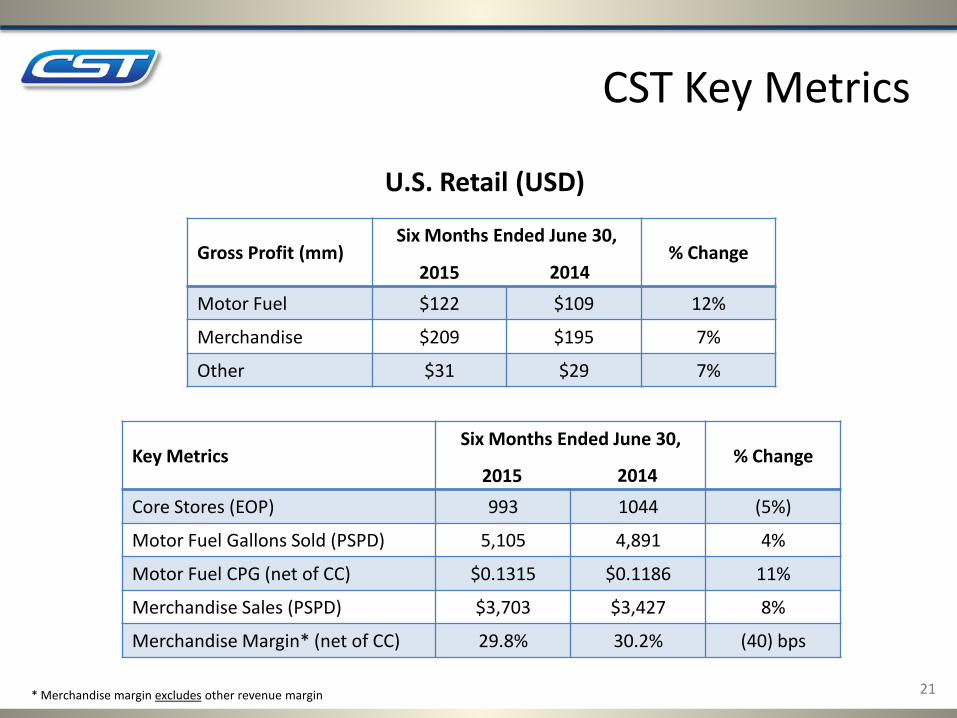
CST Key Metrics
Gross Profit (mm) Six Months Ended June 30,
% Change
Motor Fuel $122 $109 12%
Merchandise $209 $195 7%
Other $31 $29 7%
Key Metrics Six Months Ended June 30,
% Change
Core Stores (EOP) 993 1044 (5%)
Motor Fuel Gallons Sold (PSPD) 5,105 4,891 4%
Motor Fuel CPG (net of CC) $0.1315 $0.1186 11%
Merchandise Sales (PSPD) $3,703 $3,427 8%
Merchandise Margin* (net of CC) 29.8% 30.2% (40) bps
U.S. Retail (USD)
* Merchandise margin excludes other revenue margin 21
2015 2014
2015 2014

22
Key Metrics Six Months Ended June 30, % Change
in USD % Change
in CAD
Total Retail Stores (EOP) 859 850 1% 1%
Motor Fuel Gallons Sold (PSPD) 3,147 3,178 (1%) (1%)
Motor Fuel CPG (net of CC) $0.2220 $0.2280 (3%) 10%
Company Operated Stores (EOP) 292 279 5% 4.7%
Merchandise Sales (PSPD) $2,170 $2,386 (9%) 3%
Merchandise Margin* (net of CC) 27.0% 28.1% (110) bps (110) bps
Gross Profit (mm) Six Months Ended June 30,
% Change
in USD % Change
in CAD
Motor Fuel $109 $111 (2%) 11%
Merchandise* $31 $33 (6%) 5%
Other $44 $48 (8%) 4%
Canadian Retail (USD)
* Merchandise margin excludes other revenue margin 22
2015 2014
2015 2014
CST Key Metrics
23
23
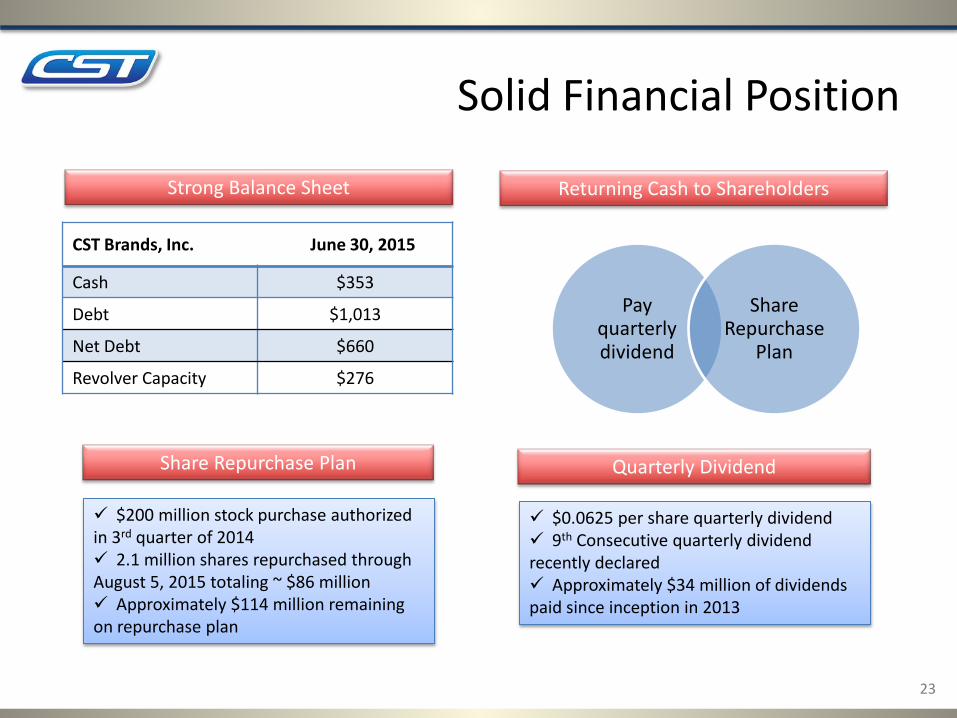
Solid Financial Position
CST Brands, Inc. June 30, 2015
Cash $353
Debt $1,013
Net Debt $660
Revolver Capacity $276
Strong Balance Sheet
Share Repurchase Plan
$200 million stock purchase authorized in 3rd quarter of 2014 2.1 million shares repurchased through August 5, 2015 totaling ~ $86 million Approximately $114 million remaining on repurchase plan
Returning Cash to Shareholders
Pay quarterly dividend
Share Repurchase
Plan
Quarterly Dividend
$0.0625 per share quarterly dividend 9th Consecutive quarterly dividend recently declared Approximately $34 million of dividends paid since inception in 2013
24
24
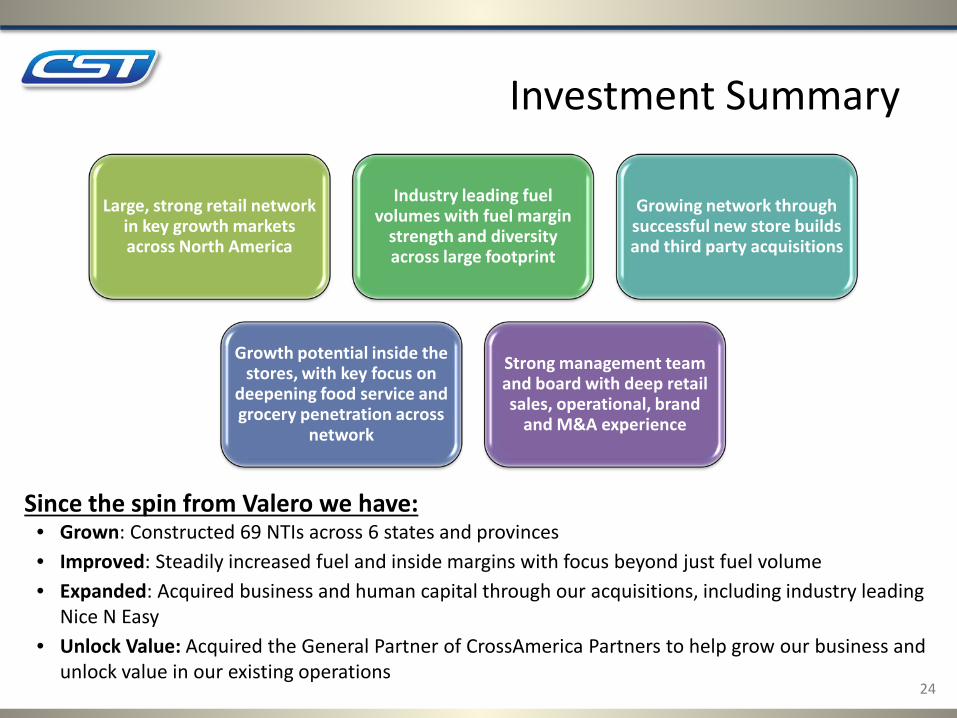
Investment Summary
Large, strong retail network in key growth markets across North America
Industry leading fuel volumes with fuel margin
strength and diversity across large footprint
Growing network through successful new store builds and third party acquisitions
Growth potential inside the stores, with key focus on
deepening food service and grocery penetration across
network
Strong management team and board with deep retail sales, operational, brand
and M&A experience
Since the spin from Valero we have: • Grown: Constructed 69 NTIs across 6 states and provinces • Improved: Steadily increased fuel and inside margins with focus beyond just fuel volume • Expanded: Acquired business and human capital through our acquisitions, including industry leading
Nice N Easy • Unlock Value: Acquired the General Partner of CrossAmerica Partners to help grow our business and
unlock value in our existing operations
Appendix
25
25

CST/CrossAmerica Relationship on October 1, 2014
26
CST Brands, Inc. NYSE: CST
CrossAmerica Canadian Retail U.S. Retail
CrossAmerica Partners LP NYSE: CAPL
Public Unitholders Joseph V. Topper & Affiliates
Operating Subsidiaries
CST
100% Ownership
Interest
100% Ownership
Interest
100% Ownership
Interest 100%
Ownership Interest
100% Ownership
Interest 0% Economic
Interest
64% Limited Partner Interest
36% Limited Partner Interest
26

U.S. Retail
27
Fuel Suppliers
Merchandise Suppliers
Company Operated
Convenience Stores
Wholesale fuel
Business
CrossAmerica owns 17.5% of this business.
U.S. Retail
27
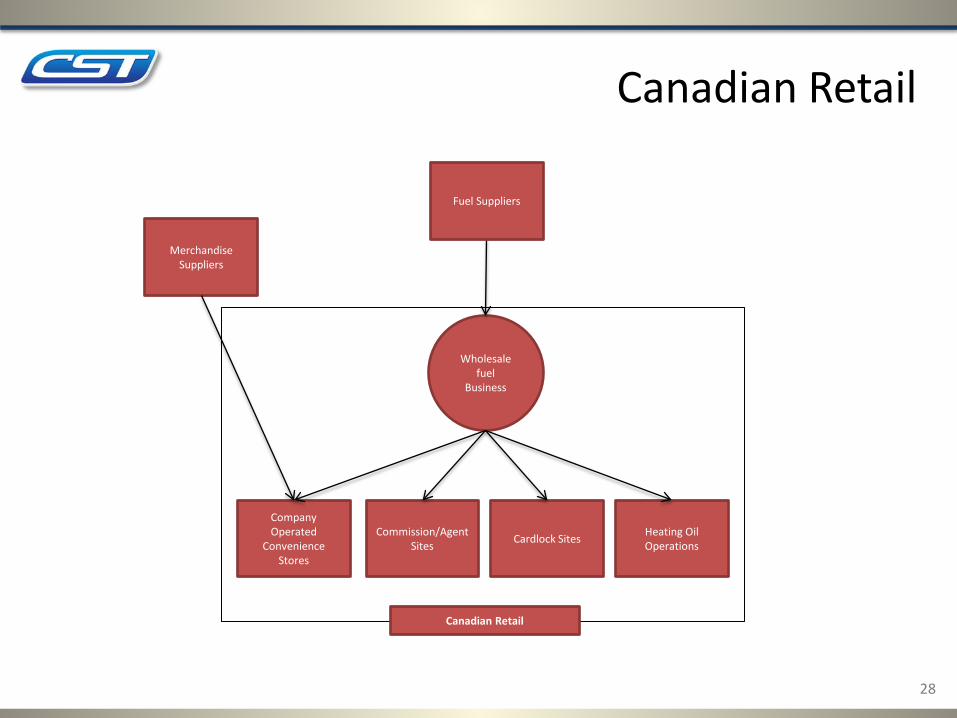
Canadian Retail
28
Merchandise Suppliers
Company Operated
Convenience Stores
Wholesale fuel
Business
Canadian Retail
Fuel Suppliers
Commission/Agent Sites Cardlock Sites Heating Oil
Operations
28