Embed Size (px)
Citation preview

CSR REPORT 2014Environmental Data Book
CONTENTS01 Scope of Report02 Organizational Profile
JFE Group
03 Status of ISO 14001 Certification04 JFE Group’s Environmental Accounting / CO2 Emissions of the JFE Group05 JFE Group Recycling Businesses06 JFE Group’s Recycling Business List07 Priority Environmental Targets and Results
JFE Steel
09 Material Flow11 Input Materials / Output Products12 Recycled Resources / CO2 Emissions and Energy Consumption13 CO2 Emissions and Energy Consumption14 Disposed Substances
JFE Engineering
20 Input Materials / Output Products21 CO2 Emissions22 Disposed Substances / Management of Chemical Substances23 Waste Disposal in Each Section and Works
JFE Shoji Trade
25 Electricity Consumption and CO2 Emissions / Input Materials
26 Comparison with Environmental Reporting Guidelines 2012 (Ministry of the Environment, Japan)
JFE Holdings, Inc.
2-2-3 Uchisaiwaicho, Chiyoda-ku, Tokyo 100-0011, Japanwww.jfe-holdings.co.jp/en
Inquiries:Corporate Planning Department of JFE Holdings, Inc.Tel: +81-3-3597-4321E-mail: [email protected]
This book contains supplemental information and data relating to environmental measures for three JFE Group companies, as well as information and data relating to the JFE Group’s recycling business. Please read this book in conjunction with the “JFE Group CSR Report 2014” to gain a more comprehensive understanding of JFE’s environmental initiatives.

◦Scope of Report
Reporting PeriodFY2013 (April 1, 2013 to March 31, 2014)Data for the recycling business covers activities undertaken during the period up to August 31, 2014.
Organizations Covered1. JFE Holdings, Inc. and its operating companies:• JFE Steel Corporation• JFE Engineering Corporation• JFE Shoji Trade Corporation
2. The following items include data from “Major Domestic Group Companies Included in the Scope of Reporting” listed below.[ Environment ]• Status of ISO 14001 certification• CO2 emissions• Energy consumption (JFE Steel Group, JFE Engineering Group)• Electricity consumption (JFE Shoji Trade Group)
[ Society ]• Compliance training• Rate of lost-work time injuries and severity rate (JFE Shoji Trade Group)
Major Domestic and Overseas Group Companies Included in the Scope of ReportingJFE Steel GroupJFE Steel Corporation and 38 consolidated subsidiaries (Total: 39 companies)JFE Mineral Company, Ltd., Mizushima Ferroalloy Co., Ltd., JFE Material Co., Ltd., Chiba Riverment and Cement Corp., Mizushima Riverment Corp., JFE Precision Co., Ltd., JFE Plastic Resource Corporation, JFE Bars & Shapes Corp., JFE Metal Products & Engineering Inc., JFE Galvanizing & Coating Co., Ltd., JFE Container Co., Ltd., JFE Welded Pipe Manufacturing Co., Ltd., JFE Steel Pipe Co., Ltd., Galvatex Corp., Kawasaki Kokan Co., Ltd.*, JFE Pipe Fitting Mfg. Co., Ltd., JFE Tubic Corp.*, JFE Techno-wire Corp., River Steel Co., Ltd.*, JFE Kozai Corp., JFE Electrical Steel Co., Ltd., Daiwa Kohtai Co., Ltd.*, JFE Mechanical Co., Ltd., JFE Electrical & Control Systems, Inc.*, JFE Advantech Co., Ltd.*, JFE Civil Corp.*, JFE Sekkei Ltd.*, JFE Logistics Corp., JFE West Technology Corporation*, JFE Wing Corp.*, JFE Techno-Research Corp.*, JFE Systems, Inc.*, JFE Chemical Corp., JFE Life Corp., JFE East Japan GS Co., Ltd.*, JFE West Japan GS Co., Ltd.*, JFE Apple East Corp.*, JFE Apple West Corp.*Note: River Steel Co., Ltd., JFE Civil Corp. and JFE West Japan GS Co., Ltd. are not included in the scope of reporting for environmental data.* Excluded from the scope of regular reporting required by the Energy Saving Act.
JFE Engineering GroupJFE Engineering Corporation and 11 consolidated subsidiaries (Total: 12 companies)JFE Engineering Corporation, Asuka Soken Co., Ltd., Japan Pipeline Engineering Corporation, JFE Kankyo Corporation, JAPAN Recycling Corporation, Recycling Management Japan, Inc., JFE Urban Recycle Corporation, Kitanippon Industrial Co., Ltd., JFE Technos Corporation, Fuji Kako Co., Ltd., Tohoku Dock Tekko K.K., JFE Rail Link Co., Ltd.
JFE Shoji Trade Group[ Environment ]JFE Shoji Trade Corporation and 30 consolidated subsidiaries (steel processing companies) (Total: 31 companies)17 domestic subsidiariesJFE Shoji Osaka Tinplate Center Corporation, JFE Shoji Coil Center Corporation, JFE Shoji Kohnan Steel Center Co., Ltd., Aichi Kanzai Kogyo Corporation, Osaka Steel Corporation, Kyusyu-Tech Corporation, Kurashiki Steel Corporation, Shin Nihon Kogyo Corporation, Taisei Kogyo Corporation, Toyo Kinzoku Corporation, Tochigi Shearing Corporation, Naigai Steel Corporation, Nagano Can Corporation, Niigata Steel Corporation, Mizushima Steel Co., Mizushima Metal Products Corporation, Hokuriku Steel Co., Ltd.13 overseas subsidiariesDongguan JFE Shoji Steel Products Co., Ltd., Guangzhou JFE Shoji Steel Products Co., Ltd., Zhejiang JFE Shoji Steel Products Co., Ltd., Jiangsu JFE Shoji Steel Products Co., Ltd., JFE Shoji Steel Philippines, Inc., Central Metals (Thailand) Ltd., Steel Alliance Service Center Co., Ltd., JFE Shoji Steel Vietnam Co., Ltd., JFE Shoji Steel India Private Limited, JFE Shoji Steel Malaysia Sdn. Bhd., P.T. JFE Shoji Steel Indonesia, Vest Inc., JFE Shoji Steel de Mexico, S.A. de C.V.
[ Society ]JFE Shoji Trade Corporation and 78 consolidated subsidiaries (Total: 79 companies)39 domestic subsidiariesJFE Shoji Usuitakenzai Corporation, JFE Shoji Electronics Corporation, JFE Shoji Osaka Tinplate Center Corporation, JFE Shoji Coil Center Corporation, JFE Shoji Pipe & Fitting Trade Corporation, JFE Shoji Kohnan Steel Center Co., Ltd., JFE Shoji Service Corporation, JFE Shoji Machinery & Materials Corporation, JFE Shoji Jutaku Shizai Corporation, JFE Shoji Oil Co., Ltd., JFE Shoji Wire Trade Co., Ltd., JFE Shoji Zosen Kako Corporation, JFE Shoji Trade Steel Construction Materials Corporation, JFE Shoji Terre One Corporation, JFE Shoji Business Support, Inc., JFE Shoji Trade Matech Inc., J Tekken Construction Produce Corporation, Aichi Kanzai Kogyo Corporation, Osaka Steel Corporation, Kadota Kozai Corporation, Kadowaki Kozai Corporation, Kawasho Foods Corporation, Kyusyu-Tech Corporation, Kurashiki Steel Corporation, K&I Tubular Corporation, Shin Nihon Kogyo Corporation, Taisei Kogyo Corporation, Tohsen Corporation, Toyo Kinzoku Corporation, Tochigi Shearing Corporation, Naigai Steel Corporation, Nagano Can Corporation, Niigata Steel Corporation, Hokuriku Kogyo Co., Ltd., Hokuriku Steel Co., Ltd., Hoshi Kinzoku Corporation, Mizushima Steel Co., Mizushima Metal Products Corporation, Yashimanada Corporation39 overseas subsidiariesJFE Shoji Trade America Inc., JFE Shoji Trade Shanghai Co., Ltd., JFE Shoji Trade Beijing Co., Ltd., JFE Shoji Trade Guangzhou Co., Ltd., JFE Shoji Trade Hong Kong Ltd., JFE Shoji Trade Thailand Ltd., JFE Shoji Trade Korea Ltd., JFE Shoji Trade Philippines, Inc., JFE Shoji Trade Vietnam Co., Ltd., JFE Shoji Trade India Pvt. Ltd., JFE Shoji Trade Malaysia Sdn. Bhd., P.T. JFE Shoji Trade Indonesia, JFE Shoji Trade Australia Pty., Ltd., JFE Shoji Trade Do Brasil Ltda., Meridian Capital Limited, Dongguan JFE Shoji Steel Products Co., Ltd., Guangzhou JFE Shoji Steel Products Co., Ltd., Zhejiang JFE Shoji Steel Products Co., Ltd., Jiangsu JFE Shoji Steel Products Co., Ltd., JFE Shoji Steel Philippines, Inc., LM Corporation, Central Metals (Thailand) Ltd., Steel Alliance Service Center Co., Ltd., New Bangpoo Manufacturing Co., Ltd., JFE Shoji Steel Vietnam Co., Ltd., JFE Shoji Steel Malaysia Sdn. Bhd., P.T. JFE Shoji Steel Indonesia, JFE Shoji Steel India Private Limited, JFE Shoji Steel America Inc., Vest Inc., JFE Shoji Steel de Mexico, S.A. de C.V., Kawasho (Dalian) Ltd., Kawasho Foods (Thailand) Co., Ltd., Kawasho Foods (Gulf) FZE, Marushin Canneries (Malaysia) Sdn. Bhd., JFE Shoji Electronics Shanghai Corp., JFE Shoji Electronics Hong Kong Limited., JFE Shoji Electronics (Thailand) Limited, JFE Shoji Electronics Malaysia Sdn. Bhd.
JFE Group CSR REPORT 2014 Environmental Data Book01

Organizational Profile
JFE Steel Company Profile
JFE Steel Corporation
◦ Head office: 2-2-3 Uchisaiwaicho, Chiyoda-ku, Tokyo 100-0011◦ Tel: +81-3-3597-3111◦ Net sales (consolidated): 2,691.6 billion yen◦ Employees (consolidated): 42,481
East Japan Works (Chiba District)1 Kawasaki-cho, Chuo-ku, Chiba-shi, Chiba 260-0835Tel: +81-43-262-2024 Fax: +81-43-262-2967Main businessProduction of hot rolled sheets and strips, cold rolled sheets and strips, stainless steel sheets and strips, coated sheets, UOE pipes, iron powders and solvents.
Main Works
East Japan Works (Keihin District)1-1 Ohgishima, Kawasaki-ku, Kawasaki-shi, Kanagawa 210-0868Tel: +81-44-322-1111Main businessProduction of plates, hot rolled sheets, cold rolled sheets, galvanized steel sheets, high-performance steel sheets, seamless steel pipes and welded steel pipes.
Chita Works1-1 Kawasaki-cho, Handa-shi, Aichi 475-8611Tel (for general): +81-569-24-2101 Fax: +81-569-24-2022Main businessProduction of machine structural steel pipes, automotive steel pipes, material pipes, general structural steel pipes and steel pipes for plumbing.
West Japan Works (Kurashiki)1 Mizushima Kawasaki-dori, Kurashiki-shi, Okayama 721-8511Tel: +81-86-447-2020 (main) +81-86-447-2102 (visitor center reception desk) Fax: +81-86-447-2131Main businessProduction of hot rolled sheets, cold rolled sheets, coated sheets, electrical sheets, plates, sheet piles, H-shapes, rails, bars, wire rods and UOE pipes.
West Japan Works (Fukuyama District)1 Kokan-cho, Fukuyama-shi, Hiroshima 721-8510Tel: +81-84-945-3118 Fax: +81-84-945-3808Main businessProduction of hot rolled sheets, cold rolled sheets, coated sheets, electrical sheets, plates, sheet piles, H-shapes, rails, bars, wire rods and UOE pipes.
JFE Shoji Trade Company Profile
JFE Shoji Trade Corporation
◦ Tokyo head office: Otemachi Financial City North Tower, 1-9-5 Otemachi, Chiyoda-ku, Tokyo 100-8070◦ Tel: +81-3-5203-5053 Fax: +81-3-5203-5289◦ Osaka head office: Dojima Avanza, 1-6-20, Dojima, Kita-ku, Osaka 530-8318◦ Tel: +81-6-4795-7011 Fax: +81-6-4795-7400◦ Net sales: 1,781.3 billion yen ◦ Employees: 6,207
JFE Engineering Company Profile
JFE Engineering Corporation
◦ Tokyo head office: Marunouchi Trust Tower North 19F, 1-8-1 Marunouchi, Chiyoda-ku, Tokyo 100-0005◦ Tel: +81-3-6212-0800 (main) Fax: +81-3-6212-0802◦ Yokohama head office: 2-1, Suehiro-cho, Tsurumi-ku, Yokohama, Kanagawa 230-8611◦ Tel: +81-45-505-7435 (main) Fax: +81-45-505-8902 Tel: +81-45-505-8953 (PR)◦ Net sales: 284.1 billion yen◦ Employees: 7,366
Tsurumi Engineering and Manufacturing Center2-1 Suehiro-cho, Tsurumi-ku, Yokohama, Kanagawa 230-8611Tel: +81-45-505-7435 Fax: +81-45-505-8902Main businessProduction of engines, shield tunneling machines, conveyance machines, boilers and turbines, water facilities, iron manufacture facilities.
Main Works
Tsu Works1 Kumozu-kokan-cho, Tsu-shi, Mie 514-0393Tel: +81-59-246-2010 Fax: +81-59-246-2781Production of steel structures such as bridges, harbor structures and building steel frames.
JFE Group CSR REPORT 2014 Environmental Data Book 02

JFE Steel Corporation
All production sites of JFE Steel Corporation and the following 18 consolidated subsidiaries (Total: 19 companies)
JFE Mineral Company, Ltd.
Mizushima Ferroalloy Co., Ltd.
JFE Material Co., Ltd.
JFE Plastic Resource Corporation
JFE Bars & Shapes Corp.
JFE Metal Products & Engineering Inc.
JFE Galvanizing & Coating Co., Ltd.
JFE Container Co., Ltd.
JFE Welded Pipe Manufacturing Co., Ltd.
JFE Pipe Fitting Mfg. Co., Ltd.
River Steel Co., Ltd.
JFE Electrical Steel Co., Ltd.
Daiwa Kohtai Co.
JFE Mechanical Co., Ltd.
JFE Electrical & Control Systems, Inc.
JFE Logistics Corp.
JFE Techno-Research Corp.
JFE Chemical Corp.
JFE Engineering Corporation
All production sites of JFE Engineering Corporation and the following 3 consolidated subsidiaries (Total: 4 companies)
JFE Kankyo Corporation
Japan Recycling Corporation
Fuji Kako Co., Ltd.
JFE Shoji Trade Corporation
All domestic business offices of JFE Shoji Trade Corporation and the following 7 consolidated subsidiaries (Total: 8 companies)
Naigai Steel Corporation
JFE Shoji Kohnan Steel Center Co., Ltd.
JFE Shoji Coil Center Corporation
Mizushima Steel Co. (including Mizushima Metal Products Corporation)
Toyo Kinzoku Corporation
Taisei Kogyo Corporation
Hokuriku Steel Co., Ltd.
Status of ISO 14001 Certification
All JFE Steel and JFE Engineering production sites and JFE Shoji Trade domestic business offices have received certification. The status of certification for Group companies included in the scope of reporting are as follows.
List of ISO 14001 Certified Companies (includes certification limited to certain sites of a company)
JFE Group
JFE Group CSR REPORT 2014 Environmental Data Book03
▼ JF
E G
rou
p

JFE Group’s Environmental Accounting
● Environmental Accounting
Cumulative Investment in Energy Saving Cumulative Investment in Environmental Preservation Measures
1990 2000 2010 2011 2012 20130
300
200
100
400
500
(Billions of yen)
(FY)2009
443.5416.0 427.5 435.2
398.9
29.3
323.5
1973 1990 2000 2010 2011 2012 2013
(Billions of yen)
(FY)2009
603.9588.7580.4
455.1
22.6
383.5400
200
600
800
0
553.3 566.4
CO2 Emissions of the JFE Group
62.861.159.460.5
2010 2011 2012 20130
40
20
60
80
(Million tonnes)
(FY)2009
55.4
CO2 Emissions of JFE Group
CO2 Emission Factor for Purchased Electricity• JFE Steel uses the emission factor of the Japan Iron and Steel Federation’s Voluntary Action Plan. Note that values for FY2012 were used for FY2013.• JFE Engineering uses the unadjusted emission factors of each electric power company for each fi scal year.• JFE Steel Group companies, excluding JFE Steel, and JFE Shoji Trade Group companies use the CO2 equivalent of 0.000550 (t-CO2/kWh) for the FY2012 unadjusted
emission factors of each electric power company.
Breakdown of CO2 Emissions by Group (FY2013)
JFE Steel Group JFE Engineering Group JFE Shoji Trade Group
62,689,000 t-CO2 72,000 t-CO2 29,000 t-CO2
99.84% 0.11% 0.05%
Breakdown of Environmental Costs
Scope of calculation: R&D at JFE Steel Corporation and JFE Engineering Corporation
* Values are for a total of 79 companies including JFE Steel and its 35 major domestic subsidiaries, JFE Engineering and its 11 major domestic subsidiaries and JFE Shoji Trade and its 30 major domestic and overseas subsidiaries.
Main ItemsFY2012 FY2013
Investment (million yen)
Cost (million yen)
Investment (million yen)
Cost (million yen)
Management Monitoring and measurement of environmental impact, EMS-related expenses, environmental education 300 2,300 100 2,400
Global warming countermeasures Energy saving, efficient use of energy 7,600 37,500 8,400 39,200
Conservation of natural resources
Recycling industrial water, waste management 300 17,300 800 17,600
Other (including recycling and waste management of internally generated materials) 300 4,700 100 4,500
Environmental protection
Prevention of air pollution 6,400 29,600 12,300 33,600
Prevention of water pollution 900 9,300 1,900 9,900
Other (prevention of soil contamination, noise, vibrations and subsidence) 10 1,800 10 1,400
Other Charges, etc. — 1,300 — 1,400
R&D Technology development for protecting the environment, saving energy and preventing global warming 5,800 13,800 4,400 13,100
Social activities Support for nature conservation and forestation activities, information disclosure, exhibitions, public relations — 700 — 700
Total 21,600 118,300 28,000 123,800
JFE Group CSR REPORT 2014 Environmental Data Book 04
▼ JF
E G
rou
p
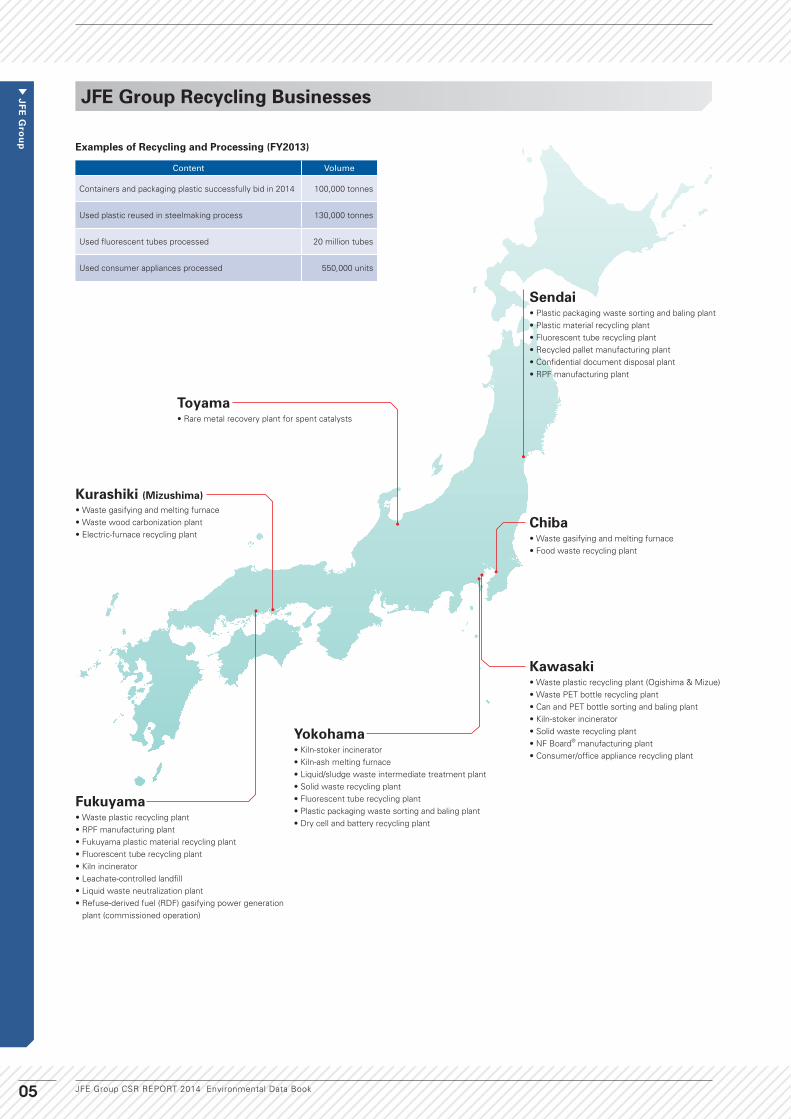
JFE Group Recycling Businesses
Examples of Recycling and Processing (FY2013)
Toyama• Rare metal recovery plant for spent catalysts
Kurashiki (Mizushima)• Waste gasifying and melting furnace• Waste wood carbonization plant• Electric-furnace recycling plant
Fukuyama• Waste plastic recycling plant• RPF manufacturing plant• Fukuyama plastic material recycling plant• Fluorescent tube recycling plant• Kiln incinerator• Leachate-controlled landfill• Liquid waste neutralization plant• Refuse-derived fuel (RDF) gasifying power generation
plant (commissioned operation)
Sendai• Plastic packaging waste sorting and baling plant• Plastic material recycling plant• Fluorescent tube recycling plant• Recycled pallet manufacturing plant• Confidential document disposal plant• RPF manufacturing plant
Yokohama• Kiln-stoker incinerator• Kiln-ash melting furnace• Liquid/sludge waste intermediate treatment plant• Solid waste recycling plant• Fluorescent tube recycling plant• Plastic packaging waste sorting and baling plant• Dry cell and battery recycling plant
Chiba• Waste gasifying and melting furnace• Food waste recycling plant
Kawasaki• Waste plastic recycling plant (Ogishima & Mizue)• Waste PET bottle recycling plant• Can and PET bottle sorting and baling plant• Kiln-stoker incinerator• Solid waste recycling plant• NF Board® manufacturing plant• Consumer/office appliance recycling plant
Content Volume
Containers and packaging plastic successfully bid in 2014 100,000 tonnes
Used plastic reused in steelmaking process 130,000 tonnes
Used fluorescent tubes processed 20 million tubes
Used consumer appliances processed 550,000 units
JFE Group CSR REPORT 2014 Environmental Data Book05
▼ JF
E G
rou
p

JFE Group’s Recycling Business List
JFE Group’s Recycling Business List
District Name of the Companies, Plants and Offices Facilities Address
Sendai
Shinko Recycle Corporation Head Office Plant
Rifu Plant
Plastic packaging waste sorting and baling plantPlastic material recycling plantFluorescent tube recycling plantRecycled pallet manufacturing plantConfidential document disposal plantRPF manufacturing plant
1-20-5 Minato, Miyagino-ku, Sendai-shi, MiyagiSame as aboveSame as aboveSame as aboveSame as above6-5-14 Shirakashi-dai, Rifu-cho, Miyagi
ChibaJapan Recycling Corporation Co., Ltd. Chiba Biogas Center Chiba Recycle Center
Waste gasifying and melting furnaceFood waste recycling plant
1 Kawasaki-cho, Chuo-ku, Chiba-shi, ChibaSame as above
Kawasaki
JFE Kankyo Corporation Ohgishima Raw Materials Plant Kawasaki PET Bottle Recycling Plant Kawasaki Can and PET Bottle Baling Plant Kawasaki Eco Clean (Incinerator)
Waste plastic recycling plantWaste PET bottle recycling plantCan and PET bottle sorting and bailing plantKiln-stoker type incineratorSolid waste recycling plant
10 Ohgishima, Kawasaki-ku, Kawasaki-shi, Kanagawa699-38 Mizue-cho, Kawasaki-ku, Kawasaki-shi, Kanagawa699-58 Mizue-cho, Kawasaki-ku, Kawasaki-shi, Kanagawa5-73 Ohgi-machi, Kawasaki-ku, Kawasaki-shi, Kanagawa, and othersSame as above
JFE Plastic Resource Corporation Mizue recycling plant NF Board® plant
Waste plastic recycling plantNF Board® manufacturing plant
679-23 Mizue-cho, Kawasaki-ku, Kawasaki-shi, Kanagawa, and others5-1 Mizue-cho, Kawasaki-ku, Kawasaki-shi, Kanagawa
JFE Urban Recycle Corporation Home appliance recycling plant Consumer appliance/OA recycling plant 6-1 Mizue-cho, Kawasaki-ku, Kawasaki-shi, Kanagawa
Yokohama
JFE Kankyo Corporation Yokohama Eco Clean (Incinerator)
Chemical Plant Yokohama Clean Resource Recycling Plant Fluorescent Lamp/Battery Recycling Plant Yokohama Plastics Recycling Plant Suehiro Plant
Kiln-stoker type incineratorKiln type ash melting furnaceLiquid/sludge waste intermediate treatment plantSolid waste recycling plantFluorescent tube recycling plantPlastic packaging waste sorting and baling plantDry cell and battery recycling plant
2-1 Suehiro-cho, Tsurumi-ku, Yokohama-shi, Kanagawa, and othersSame as above3-1 Benten-cho, Tsurumi-ku, Yokohama-shi, Kanagawa2-1-5 Suehiro-cho, Tsurumi-ku, Yokohama-shi, Kanagawa2-1-8 Suehiro-cho, Tsurumi-ku, Yokohama-shi, Kanagawa2-1-8 Suehiro-cho, Tsurumi-ku, Yokohama-shi, Kanagawa2-1-8 Suehiro-cho, Tsurumi-ku, Yokohama-shi, Kanagawa
JFE Kankyo Logitech Corporation Kanazawa Recycling Center Solid waste recycling plant 1-14-5 Fukuura, Kanazawa-ku, Yokohama-shi, Kanagawa
Kurashiki(Mizushima)
Mizushima Eco-Works Co., Ltd. Waste gasifying and melting furnace 1-14-5 Mizushimakawasaki-dori, Kurashiki-shi, Okayama
Recycling Management Japan, Inc. Okayama Wood Carbonization Facilities Waste wood carbonization plant 1-14-1 Mizushimakawasaki-dori, Kurashiki-shi, Okayama
JFE Bars & Shaps Corporation DC electric arc furnace Electric-furnace recycling plant 1-5-2 Mizushimakawasaki-dori, Kurashiki-shi, Okayama, and others
Fukuyama
JFE Plastic Resource Corporation Fukuyama recycling plant Waste plastic recycling plant 113 Minoki-cho, Fukuyama-shi, Hiroshima, and others
JFE Kankyo Corporation Fukuyama RPF Production Plant Fukuyama Plastic Material Recycling Plant Fukuyama Fluorescent Lamp Recycling Plant Fukuyama Incinerator
RPF manufacturing plantPlastic materials recycling plantFluorescent tube recycling plantKiln type incineratorLeachate controlled landfillLiquid waste neutralization plant
115-1 Minoki-cho, Fukuyama-shi, HiroshimaSame as aboveSame as above1 Kokan-cho, Fukuyama-shi, HiroshimaSame as aboveSame as above
Fukuyama Recycle Power CorporationRefuse-derived fuel (RDF) gasifying power generation plant (commissioned operation)
107-8 Minoki-cho, Fukuyama-shi, Hiroshima
Toyama JFE Material Co., Ltd. Rare metal recovery plant for spent catalysts 2-9-38 Shosei-machi, Imizu-shi, Toyama
JFE Group CSR REPORT 2014 Environmental Data Book 06
▼ JF
E G
rou
p

Main Environmental Targets and Results
Management
Global Warming Prevention
Pollution Prevention
Products and Services
Resource Recycling
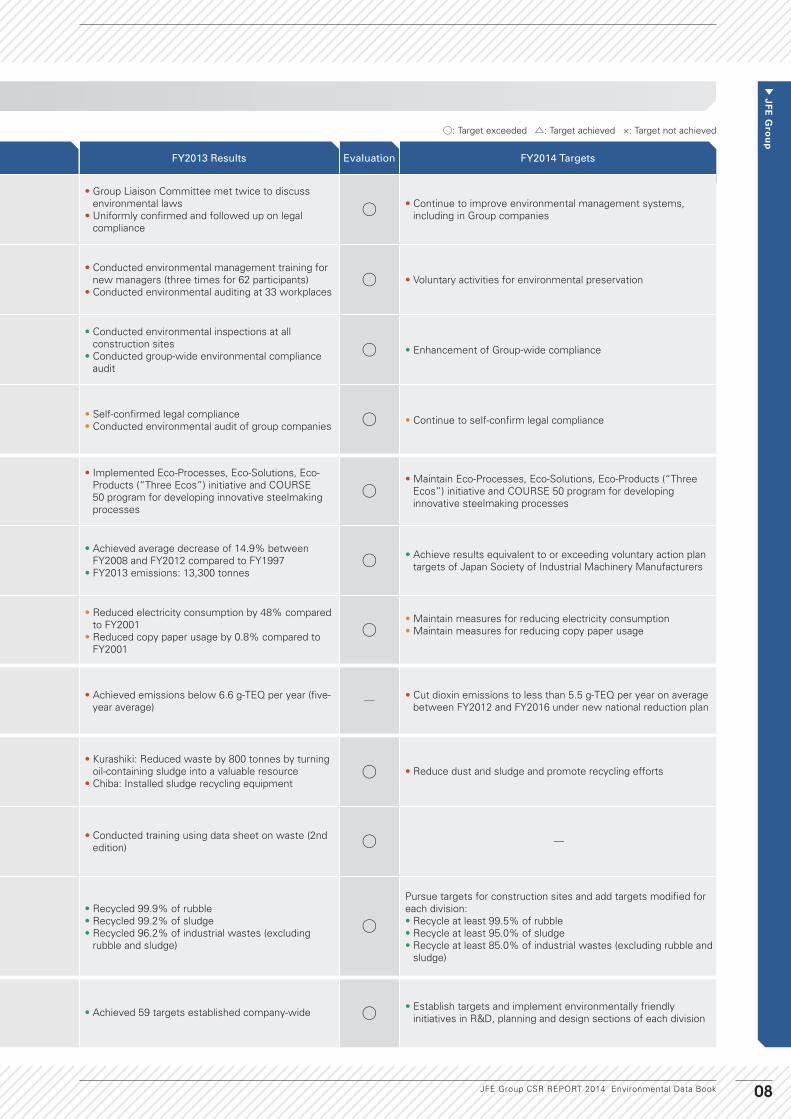
FY2013 Targets FY2013 Results Evaluation FY2014 Targets
JFE Steel
• Continue to improve environmental management systems, including in Group companies
• Group Liaison Committee met twice to discuss environmental laws
• Uniformly confirmed and followed up on legal compliance
○ • Continue to improve environmental management systems, including in Group companies
• Voluntary activities for environmental preservation• Conducted environmental management training for
new managers (three times for 62 participants)• Conducted environmental auditing at 33 workplaces
○ • Voluntary activities for environmental preservation
JFE Engineering • Enhancement of Group-wide compliance
• Conducted environmental inspections at all construction sites
• Conducted group-wide environmental compliance audit
○ • Enhancement of Group-wide compliance
JFE Shoji Trade • Enhancement of Group-wide compliance • Self-confirmed legal compliance• Conducted environmental audit of group companies ○ • Continue to self-confirm legal compliance
JFE Steel
• Following completion of Japan Iron and Steel Federation’s Voluntary Action Program, continue global-warming measures to help meet Low-Carbon Society Action Plan targets (set by Japan Iron and Steel Federation), including cutting CO2 emissions by five million tonnes in 2020 compared to business as usual
• Implemented Eco-Processes, Eco-Solutions, Eco-Products (“Three Ecos”) initiative and COURSE 50 program for developing innovative steelmaking processes
○• Maintain Eco-Processes, Eco-Solutions, Eco-Products (“Three
Ecos”) initiative and COURSE 50 program for developing innovative steelmaking processes
JFE Engineering • Achieve results equivalent to or exceeding voluntary action plan targets of Japan Society of Industrial Machinery Manufacturers
• Achieved average decrease of 14.9% between FY2008 and FY2012 compared to FY1997
• FY2013 emissions: 13,300 tonnes○ • Achieve results equivalent to or exceeding voluntary action plan
targets of Japan Society of Industrial Machinery Manufacturers
JFE Shoji Trade • Reduce electricity consumption• Reduce copy paper usage
• Reduced electricity consumption by 48% compared to FY2001
• Reduced copy paper usage by 0.8% compared to FY2001
○• Maintain measures for reducing electricity consumption• Maintain measures for reducing copy paper usage
JFE Steel • Cut dioxin emissions to less than 5.5 g-TEQ per year on average in FY2012 – FY2016 under new national reduction plan
• Achieved emissions below 6.6 g-TEQ per year (five-year average) ─ • Cut dioxin emissions to less than 5.5 g-TEQ per year on average
between FY2012 and FY2016 under new national reduction plan
JFE Steel
• Reduce dust and sludge and promote recycling• Kurashiki: Reduced waste by 800 tonnes by turning
oil-containing sludge into a valuable resource• Chiba: Installed sludge recycling equipment
○ • Reduce dust and sludge and promote recycling efforts
• Conduct waste-related education in response to revised data sheet on waste • Conducted training using data sheet on waste (2nd edition) ○ ─
JFE Engineering
At construction sites:• Recycle at least 99.5% of rubble• Recycle at least 95.0% of sludge• Recycle at least 85.0% of industrial wastes (excluding rubble and sludge)
• Recycled 99.9% of rubble• Recycled 99.2% of sludge• Recycled 96.2% of industrial wastes (excluding
rubble and sludge)
○
Pursue targets for construction sites and add targets modified for each division:• Recycle at least 99.5% of rubble• Recycle at least 95.0% of sludge• Recycle at least 85.0% of industrial wastes (excluding rubble and
sludge)
JFE Engineering • Establish targets and implement environmentally friendly initiatives in R&D, planning and design sections of each division • Achieved 59 targets established company-wide ○ • Establish targets and implement environmentally friendly
initiatives in R&D, planning and design sections of each division
JFE Group CSR REPORT 2014 Environmental Data Book07
▼ JF
E G
rou
p
Main Environmental Targets and Results
○: Target exceeded △: Target achieved ×: Target not achieved
FY2013 Targets FY2013 Results Evaluation FY2014 Targets
JFE Steel
• Continue to improve environmental management systems, including in Group companies
• Group Liaison Committee met twice to discuss environmental laws
• Uniformly confirmed and followed up on legal compliance
○ • Continue to improve environmental management systems, including in Group companies
• Voluntary activities for environmental preservation• Conducted environmental management training for
new managers (three times for 62 participants)• Conducted environmental auditing at 33 workplaces
○ • Voluntary activities for environmental preservation
JFE Engineering • Enhancement of Group-wide compliance
• Conducted environmental inspections at all construction sites
• Conducted group-wide environmental compliance audit
○ • Enhancement of Group-wide compliance
JFE Shoji Trade • Enhancement of Group-wide compliance • Self-confirmed legal compliance• Conducted environmental audit of group companies ○ • Continue to self-confirm legal compliance
JFE Steel
• Following completion of Japan Iron and Steel Federation’s Voluntary Action Program, continue global-warming measures to help meet Low-Carbon Society Action Plan targets (set by Japan Iron and Steel Federation), including cutting CO2 emissions by five million tonnes in 2020 compared to business as usual
• Implemented Eco-Processes, Eco-Solutions, Eco-Products (“Three Ecos”) initiative and COURSE 50 program for developing innovative steelmaking processes
○• Maintain Eco-Processes, Eco-Solutions, Eco-Products (“Three
Ecos”) initiative and COURSE 50 program for developing innovative steelmaking processes
JFE Engineering • Achieve results equivalent to or exceeding voluntary action plan targets of Japan Society of Industrial Machinery Manufacturers
• Achieved average decrease of 14.9% between FY2008 and FY2012 compared to FY1997
• FY2013 emissions: 13,300 tonnes○ • Achieve results equivalent to or exceeding voluntary action plan
targets of Japan Society of Industrial Machinery Manufacturers
JFE Shoji Trade • Reduce electricity consumption• Reduce copy paper usage
• Reduced electricity consumption by 48% compared to FY2001
• Reduced copy paper usage by 0.8% compared to FY2001
○• Maintain measures for reducing electricity consumption• Maintain measures for reducing copy paper usage
JFE Steel • Cut dioxin emissions to less than 5.5 g-TEQ per year on average in FY2012 – FY2016 under new national reduction plan
• Achieved emissions below 6.6 g-TEQ per year (five-year average) ─ • Cut dioxin emissions to less than 5.5 g-TEQ per year on average
between FY2012 and FY2016 under new national reduction plan
JFE Steel
• Reduce dust and sludge and promote recycling• Kurashiki: Reduced waste by 800 tonnes by turning
oil-containing sludge into a valuable resource• Chiba: Installed sludge recycling equipment
○ • Reduce dust and sludge and promote recycling efforts
• Conduct waste-related education in response to revised data sheet on waste • Conducted training using data sheet on waste (2nd edition) ○ ─
JFE Engineering
At construction sites:• Recycle at least 99.5% of rubble• Recycle at least 95.0% of sludge• Recycle at least 85.0% of industrial wastes (excluding rubble and sludge)
• Recycled 99.9% of rubble• Recycled 99.2% of sludge• Recycled 96.2% of industrial wastes (excluding
rubble and sludge)
○
Pursue targets for construction sites and add targets modified for each division:• Recycle at least 99.5% of rubble• Recycle at least 95.0% of sludge• Recycle at least 85.0% of industrial wastes (excluding rubble and
sludge)
JFE Engineering • Establish targets and implement environmentally friendly initiatives in R&D, planning and design sections of each division • Achieved 59 targets established company-wide ○ • Establish targets and implement environmentally friendly
initiatives in R&D, planning and design sections of each division
JFE Group CSR REPORT 2014 Environmental Data Book 08
▼ JF
E G
rou
p

Recycled materials◦Steel scrap
1 million tonnes
Blast furnace
BF gas
BOF and CC
BOF gas
I n p u t
Materials Flow
JFE Steel
JFE Group Recycling Processes
Coke oven and sintering plant
Coke oven gas
Purchased energy◦Electricity- and petroleum-
based energies
116 PJ
◦Energy (for transportation)・Gasoline・Light oil
Industrial water
208 million tonnes
Raw materials for steel production
80 million tonnes
◦Iron ore: 52 million tonnes◦Coal: 22 million tonnes◦Lime: 6 million tonnes
◦Waste plastics◦Waste PET bottles◦Used consumer
appliances◦Food waste◦Used batteries◦Dust, sludge, etc.
◦Steel scrap (basic oxygen furnace, or BOF)
CO2
59.3million tonnes** total energy and non-
energy emissions
Flue gas◦SOx
3.8 million m3
◦NOx
11.4 million m3
◦Soot and dust
Chemical substances◦Release
419 tonnes
◦Transfer
1,775 tonnes
Greenhouse gases emitted duringtransportation(domestic distribution)
◦CO2
348,000tonnes
Water recycled
93.8% 3,128 million tonnes
Recycled
30.1% 4.5 million tonnes
Byproduct disposal (landfill)
21,000 tonnes
JFE Group CSR REPORT 2014 Environmental Data Book09
▼ JF
E S
tee
l

6.2%
Total water consumption
3,336million tonnes
Byproducts
15.0million tonnes
Slag: 11.9 million tonnesDust: 2.3 million tonnesSludge: 600,000 tonnesOther: 200,000 tonnes
Reheat furnace Rolling Shipments
Recovered energy for recycling
◦Byproduct gas◦Waste heat recovery
steam◦Power generation by
blast furnace (BF) top-gas-pressure recovery turbine (TRT)
O u t p u t
Co
mm
un
ity, En
viron
men
t, and
So
ciety
Materials Flow
Wastewater and evaporation loss
208 million tonnes
Supplied
34.0%
Energy recycled
66.0%Energy supply
34.0%
◦Power◦Fuel gas◦Steam
Other products◦Chemicals◦Oxygen◦Nitrogen◦Hydrogen◦Argon
Steel products
28.7 million tonnes(crude steel base)
Marine & land civil engineering materials
10.5 million tonnes
◦Materials for cement◦Roadbed materials◦Port & harbor construction
materials◦Fertilizer
Recycled products◦NF Board®
◦PET flakes◦Palettes◦Recycled resin
Supplied
70.5%
Disposed
0.1%
JFE Group CSR REPORT 2014 Environmental Data Book 10
▼ JF
E S
tee
l

Input Materials
Materials for Steel Production Industrial Water
2009 2010 2011 2012 20130
40
20
60
80
100
(Million tonnes)
(FY)
80
52
226
44
225
42
215
42
225
37
215
6369 68 71
■ Iron ore ■ Coal ■ Lime
2009 2010 2011 2012 20130
150
100
50
200
250
(FY)
218 216 216 208230
(Million tonnes)
Purchased Energy (Electricity and Petroleum-based Energies)
2009 2010 2011 2012 20130
50
100
150
(PG)
(FY)
101113 115 114 116
Output Products
Byproducts
◦NF Board® ◦PET Flakes ◦Pallet ◦Recycled Resin
Other Products
◦Chemicals ◦Nitrogen ◦Argon ◦Oxygen ◦Hydrogen
Steel Products Energy Supply Rate for Recovered Energy
2009 2010 2011 2012 20130
20
10
30
40
(Million tonnes)
(FY)
25.828.8
26.9 28.0 28.7
2009 2010 2011 2012 20130
20
10
30
40
(%)
(FY)
33 34353335
Marine & Land Civil Engineering Materials (Usage from Byproducts)
2010 2011 2012 20130
10
5
15
20
0
40
20
60
80
(Million tonnes) (%)
(FY)2009
14.9 15.0 15.015.0
10.0 10.0 10.7 10.510.5
■ Utilization rate in the community■ Utilization volume in the community
● Generation volume of byproducts
14.7
68.0 67.170.5 71.2 70.5
Note: Values for past fiscal years have been recalculated retroactively for improved accuracy.
JFE Group CSR REPORT 2014 Environmental Data Book11
▼ JF
E S
tee
l

2010 2011 2012 20130
20
10
30
40
0
20
10
30
40
(Million tonnes) (%)
(FY)2009
14.9 15.0 15.015.0
3.9 4.5 4.7 4.54.4
■ Generation volume ■ On-premise recycling volume● On-premise recycling rate
14.7
30.031.7
30.0 30.127.4
Recycled Resources
2010 2011 2012 20130
5,000
4,000
3,000
2,000
1,000
0
20
40
60
80
100
(Million tonnes)
(FY)2009
93.4 93.8
3,1283,0743,1103,1102,925
93.4 93.592.7
(%)■ Recycling volume ● Recycling rate
Name of Company CO₂ Emissions
JFE Bars & Shapes Corp. 1,373,784Mizushima Ferroalloy Co., Ltd. 616,791JFE Chemical Corp. 615,410JFE Mineral Company, Ltd. 406,905JFE Galvanizing & Coating Co., Ltd. 94,914JFE Material Co., Ltd. 66,102JFE Pipe Fitting Mfg. Co., Ltd. 24,548JFE Plastic Resource Corporation 21,994JFE Logistics Corporation 17,074Galvatex Corp. 14,526Mizushima Riverment Corp. 11,763JFE Metal Products & Engineering Inc. 11,592JFE Container Co., Ltd. 11,384JFE Techno-Wire Corp. 10,559Chiba Riverment and Cement Corp. 10,094JFE Life Corp. 8,720JFE Precision Co., Ltd. 7,402JFE Welded Pipe Manufacturing Co., Ltd. 6,885JFE Mechanical Co., Ltd. 5,584JFE Steel Pipe Co., Ltd. 4,501JFE Electrical Steel Co., Ltd. 4,007JFE Kozai Corp. 3,67213 other companies (excluded from the scope of regular reporting required by the Energy Saving Act)
18,262
Total 3,366,474
Name of Company CO₂ Emissions
JFE Bars & Shapes Corp. 24,394,746JFE Chemical Corp. 11,889,321JFE Mineral Company, Ltd. 6,847,799Mizushima Ferroalloy Co., Ltd. 6,221,101JFE Galvanizing & Coating Co., Ltd. 1,951,970JFE Material Co., Ltd. 1,158,786JFE Pipe Fitting Mfg. Co., Ltd. 449,966JFE Plastic Resource Corporation 400,754Galvatex Corporation 282,948JFE Logistics Corp. 264,634JFE Container Co., Ltd. 215,762JFE Metal Products & Engineering Inc. 213,733JFE Techno-Wire Corp. 196,732Mizushima Riverment Corp. 185,150Chiba Riverment and Cement Corp. 179,800JFE Life Corp. 155,408JFE Precision Co., Ltd. 134,645JFE Welded Pipe Manufacturing Co., Ltd. 124,165JFE Mechanical Co., Ltd. 94,687JFE Steel Pipe Co., Ltd. 80,880JFE Electrical Steel Co., Ltd. 72,509JFE Kozai Corp. 66,03513 other companies (excluded from the scope of regular reporting required by the Energy Saving Act)
324,338
Total 55,905,872
2010 2011 2012 20130
20
60
40
80
(%)
(FY)2009
65 6667 6765
Recycled Water
CO2 Emissions of JFE Steel Group Subsidiaries (FY2013)
Energy Consumption of JFE Steel Group Subsidiaries (FY2013)(t-CO2) (GJ)
Byproducts
Recycling Rate for Recovered Energy
CO2 Emission Factor for Purchased Energy• JFE Steel uses the emission factor of the
Japan Iron and Steel Federation’s Voluntary Action Plan. Note that values for FY2012 were used for FY2013.
• With the exception of JFE Steel, companies use the CO2 equivalent of 0.000550 (t-CO2/kWh) for the FY2012 unadjusted emission factors of each electric power company.
Note: Values for past fiscal years have been recalculated retroactively for improved accuracy.
* The total does not add up due to rounding.
CO2 Emissions and Energy Consumption
● Status of JFE Steel Group
CO2 Emissions of JFE Steel Group
59.3
3.4
2010 2011 2012 20130
40
20
60
80
(Million t-CO2)
(FY)2009
3.1
52.3
3.4
57.0
3.2
56.1
3.3
57.7
62.760.4 59.3 61.0
■ JFE Steel ■ Others
55.4
* Values cover JFE Steel (energy-derived and non-energy-derived emissions) and 35 major domestic affiliates (energy-derived emissions).
JFE Group CSR REPORT 2014 Environmental Data Book 12
▼ JF
E S
tee
l

CO2 Emissions and Energy Consumption
● Status of JFE Steel
2009 2010 2011 2012 20130
20
10
30
40
(10,000 t-CO2)
(FY)
30
36 3533
35
Greenhouse Gas Emitted During Transportation
1990 2010 2011 2012 20130
100
50
150
200
(FY)2009
185194
175 171 170183
(10,000 t-CO2)
2009 2010 2011 2012 20130
40
20
60
80
(Million t-CO2)
(FY)
52.357.0 56.1 57.7 59.3
JFE Steel’s Estimated Non-energy-related CO2 Emissions Total CO2 Emissions (Energy-related and Non-energy-related)
1990 2009 2010 2011 201320120
40
20
60
80
100 2.5
2.0
1.5
1.0
0.5
0
(Million tonnes) (t-CO2/t-s)
(FY)
58.350.5
55.3 54.4 57.4
2.481.95 1.92 2.02
■ CO2 emissions ● Unit CO2 emissions
−19%
55.9
2.00
2.00
2009 2010 2011 2012 20130
400
200
600
800
0
26
23
29
32
(PJ) (GJ/t-s )
(FY)
591652 633 644 659
−19%
1990
670
28.4
22.9 22.7 23.5 23.0 23.0
■ Energy consumption ● Unit energy consumption
Energy-derived CO2 Emissions and Unit CO2 Emissions Energy Consumption and Unit Energy Consumption
TotalDeliveries
beyond500 km
Deliveriesbeyond500 km
Ship and rail45%
Truck55%
Truck28.6%
Ship and rail93.8%
Ship and rail71.4%
Truck6.2%
Changes in Unit CO2 Emissions and Crude Steel Production vs. FY1990
Changes in Unit Energy Consumption and Crude Steel Production vs. FY1990(%) (%)
2009 2010 2011 2012 2013
Unit Emissions −21 −22 −20 −21 −19
Crude Steel Production
10 22 14 19 22
2009 2010 2011 2012 2013
Unit Emissions −20 −20 −17 −19 −19
Crude Steel Production
10 22 14 19 22
Modal Shift Rate (FY2013)
Total Modal Shift Rate in Industry
Source: Ministry of Land, Infrastructure, Transport and Tourism
* Values for past fiscal years were recalculated retroactively in line with a change in the definition of electricity emission factors (based on the reception of electric power instead of transmission) in 2013.
* Calculations were based on the premise that the CO2 emission factor for FY2013 was the same as that for FY2012.
* Values for past fiscal years were recalculated retroactively in line with a change in the definition of energy coefficient for electricity (based on the reception of electric power instead of transmission) in 2013.
JFE Group CSR REPORT 2014 Environmental Data Book13
▼ JF
E S
tee
l

Disposed Substances
1973 1990 2010 2011 2012 20130
20
10
30
40
(Million Nm3)
(FY)2009
11.411.0 10.8 11.511.1
34.6
13.7
NOx Emissions
● Atmospheric Emissions
1973 1990 2010 2011 2012 20130
20
10
30
40
(FY)2009
3.83.5 3.7 3.73.56.0
36.8(Million Nm3)
SOx Emissions
●Discharge into Waterways
2010 2011 2012 20130
100
200
300
0
2.5
5.0
7.5
(Million tonnes)
(FY)2009
6.66.2
208216216218230
6.6 6.57.3
(%)■ Loss volume ● Loss rate
Wastewater and Evaporation Loss
1990 2010 2011 2012 20130
2
1
3
4
(tonnes/day)
(FY)2009
3.13.1 3.2 3.23.0
3.7
Changes in Chemical Oxygen Demand (COD)
● Byproducts Disposal
2009 2010 2011 2012 20130
4
2
6
8
0.2
0.1
0
0.3
0.4
(10,000 tonnes)
(FY)
3.8
0.3
3.3
2.3
2.9
2.1
0.1
0.20.20.2
(%)■ Disposal volume ● Disposal rate
Byproducts Disposal
● Management of Chemical Substances
2010 2011 2012 20130
1,000
2,000
3,000
(tonnes)
(FY)2009
1,431 1,403
2,0641.7751,755
483 514 476 419509
■ Amount released into atmosphere and public waterways■ Amount transferred
Release or Transfer of PRTR-registered Substances
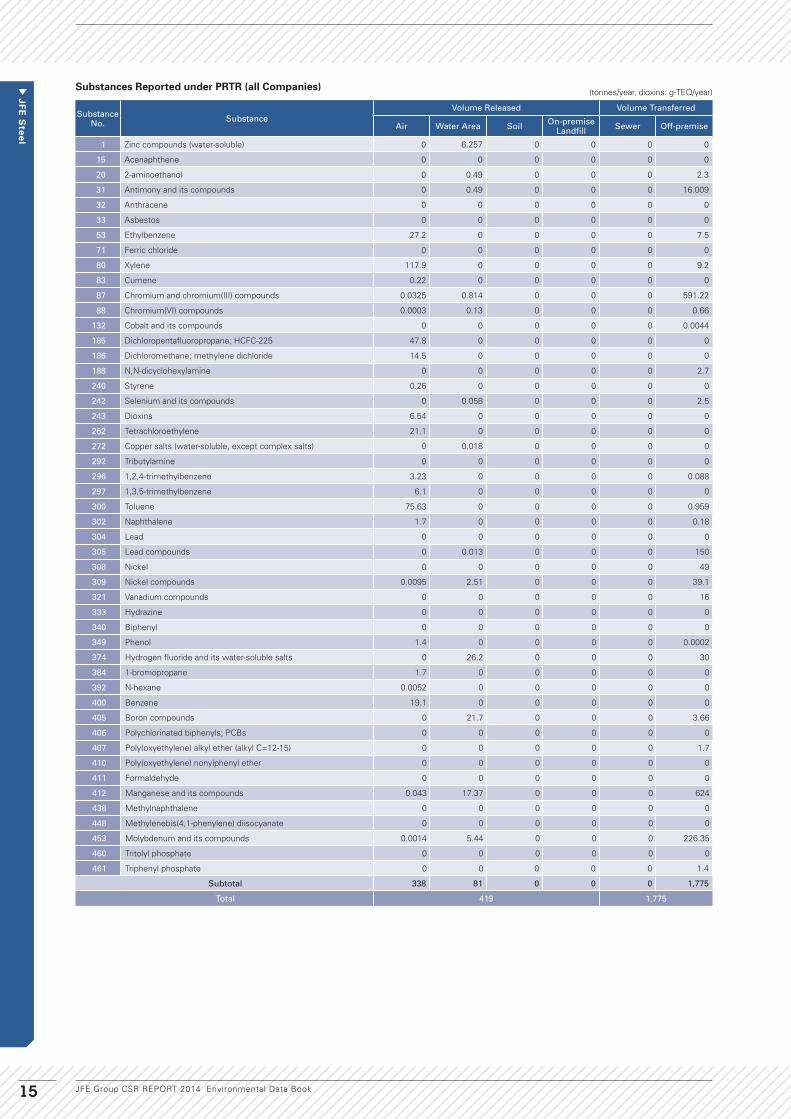
JFE Group CSR REPORT 2014 Environmental Data Book 14
▼ JF
E S
tee
l
SubstanceNo. Substance
Volume Released Volume Transferred
Air Water Area Soil On-premise Landfill Sewer Off-premise
1 Zinc compounds (water-soluble) 0 6.257 0 0 0 0
15 Acenaphthene 0 0 0 0 0 0
20 2-aminoethanol 0 0.49 0 0 0 2.3
31 Antimony and its compounds 0 0.49 0 0 0 16.009
32 Anthracene 0 0 0 0 0 0
33 Asbestos 0 0 0 0 0 0
53 Ethylbenzene 27.2 0 0 0 0 7.5
71 Ferric chloride 0 0 0 0 0 0
80 Xylene 117.9 0 0 0 0 9.2
83 Cumene 0.22 0 0 0 0 0
87 Chromium and chromium(III) compounds 0.0325 0.814 0 0 0 591.22
88 Chromium(VI) compounds 0.0003 0.13 0 0 0 0.66
132 Cobalt and its compounds 0 0 0 0 0 0.0044
185 Dichloropentafluoropropane; HCFC-225 47.8 0 0 0 0 0
186 Dichloromethane; methylene dichloride 14.5 0 0 0 0 0
188 N,N-dicyclohexylamine 0 0 0 0 0 2.7
240 Styrene 0.26 0 0 0 0 0
242 Selenium and its compounds 0 0.058 0 0 0 2.5
243 Dioxins 6.54 0 0 0 0 0
262 Tetrachloroethylene 21.1 0 0 0 0 0
272 Copper salts (water-soluble, except complex salts) 0 0.018 0 0 0 0
292 Tributylamine 0 0 0 0 0 0
296 1,2,4-trimethylbenzene 3.23 0 0 0 0 0.088
297 1,3,5-trimethylbenzene 6.1 0 0 0 0 0
300 Toluene 75.63 0 0 0 0 0.959
302 Naphthalene 1.7 0 0 0 0 0.18
304 Lead 0 0 0 0 0 0
305 Lead compounds 0 0.013 0 0 0 150
308 Nickel 0 0 0 0 0 49
309 Nickel compounds 0.0095 2.51 0 0 0 39.1
321 Vanadium compounds 0 0 0 0 0 16
333 Hydrazine 0 0 0 0 0 0
340 Biphenyl 0 0 0 0 0 0
349 Phenol 1.4 0 0 0 0 0.0002
374 Hydrogen fluoride and its water-soluble salts 0 26.2 0 0 0 30
384 1-bromopropane 1.7 0 0 0 0 0
392 N-hexane 0.0052 0 0 0 0 0
400 Benzene 19.1 0 0 0 0 0
405 Boron compounds 0 21.7 0 0 0 3.66
406 Polychlorinated biphenyls; PCBs 0 0 0 0 0 0
407 Poly(oxyethylene) alkyl ether (alkyl C=12-15) 0 0 0 0 0 1.7
410 Poly(oxyethylene) nonylphenyl ether 0 0 0 0 0 0
411 Formaldehyde 0 0 0 0 0 0
412 Manganese and its compounds 0.043 17.37 0 0 0 624
438 Methylnaphthalene 0 0 0 0 0 0
448 Methylenebis(4,1-phenylene) diisocyanate 0 0 0 0 0 0
453 Molybdenum and its compounds 0.0014 5.44 0 0 0 226.35
460 Tritolyl phosphate 0 0 0 0 0 0
461 Triphenyl phosphate 0 0 0 0 0 1.4
Subtotal 338 81 0 0 0 1,775
Total 419 1,775
JFE Group CSR REPORT 2014 Environmental Data Book15
▼ JF
E S
tee
l
Substances Reported under PRTR (all Companies) (tonnes/year, dioxins: g-TEQ/year)
SubstanceNo. Substance
Volume Released Volume Transferred
Air Water Area Soil On-premise Landfill Sewer Off-premise
1 Zinc compounds (water-soluble) 0 0.14 0 0 0 0
20 2-aminoethanol 0 0.49 0 0 0 0
31 Antimony and its compounds 0 0 0 0 0 0
53 Ethylbenzene 0.8 0 0 0 0 0
71 Ferric chloride 0 0 0 0 0 0
80 Xylene 1.7 0 0 0 0 0
87 Chromium and chromium(III) compounds 0.0046 0.73 0 0 0 530
88 Chromium(VI) compounds 0 0.13 0 0 0 0
132 Cobalt and its compounds 0 0 0 0 0 0
185 Dichloropentafluoropropane; HCFC-225 46 0 0 0 0 0
243 Dioxins 0.14 0 0 0 0 0
272 Copper salts (water-soluble, except complex salts) 0 0.018 0 0 0 0
297 1,3,5-trimethylbenzene 0 0 0 0 0 0
300 Toluene 0.53 0 0 0 0 0
308 Nickel 0 0 0 0 0 49
309 Nickel compounds 0.0022 1.7 0 0 0 0
321 Vanadium compounds 0 0 0 0 0 0
333 Hydrazine 0 0 0 0 0 0
349 Phenol 0 0 0 0 0 0
374 Hydrogen fluoride and its water-soluble salts 0 19 0 0 0 30
400 Benzene 1.3 0 0 0 0 0
405 Boron compounds 0 3.2 0 0 0 0.56
410 Poly(oxyethylene) nonylphenyl ether 0 0 0 0 0 0
412 Manganese and its compounds 0.01 0.32 0 0 0 130
453 Molybdenum and its compounds 0 2.5 0 0 0 4.8
Subtotal 50 28 0 0 0 744
Total 78 744
SubstanceNo. Substance
Volume Released Volume Transferred
Air Water Area Soil On-premise Landfill Sewer Off-premise
87 Chromium and chromium(III) compounds 0 0 0 0 0 0
Subtotal 0 0 0 0 0 0
Total 0 0
(tonnes/year, dioxins: g-TEQ/year)Substances Reported under PRTR (East Japan Works) Nishinomiya District
JFE Group CSR REPORT 2014 Environmental Data Book 16
▼ JF
E S
tee
l
(tonnes/year, dioxins: g-TEQ/year)Substances Reported under PRTR (East Japan Works) Chiba District

SubstanceNo. Substance
Volume Released Volume Transferred
Air Water Area Soil On-premise Landfill Sewer Off-premise
20 2-aminoethanol 0 0 0 0 0 2.3
53 Ethylbenzene 2.1 0 0 0 0 1.3
80 Xylene 8.1 0 0 0 0 2.5
87 Chromium and chromium(III) compounds 0.018 0 0 0 0 11
88 Chromium(VI) compounds 0.0003 0 0 0 0 0.47
243 Dioxins 1.7 0 0 0 0 0
262 Tetrachloroethylene 0 0 0 0 0 0
297 1,3,5-trimethylbenzene 0 0 0 0 0 0
300 Toluene 8 0 0 0 0 0.9
308 Nickel 0 0 0 0 0 0
309 Nickel compounds 0.0023 0 0 0 0 2.9
333 Hydrazine 0 0 0 0 0 0
349 Phenol 1.4 0 0 0 0 0.0002
400 Benzene 5 0 0 0 0 0
405 Boron compounds 0 3.3 0 0 0 0
407 Poly(oxyethylene) alkyl ether (alkyl C=12-15) 0 0 0 0 0 1.7
412 Manganese and its compounds 0.01 0.53 0 0 0 210
453 Molybdenum and its compounds 0.0014 0.85 0 0 0 220
460 Tritolyl phosphate 0 0 0 0 0 0
461 Triphenyl phosphate 0 0 0 0 0 1.4
Subtotal 25 5 0 0 0 452
Total 30 452
JFE Group CSR REPORT 2014 Environmental Data Book17
▼ JF
E S
tee
l
(tonnes/year, dioxins: g-TEQ/year)Substances Reported under PRTR (Keihin District)

SubstanceNo. Substance
Volume Released Volume Transferred
Air Water Area Soil On-premise Landfill Sewer Off-premise
1 Zinc compounds (water-soluble) 0 2.3 0 0 0 0
20 2-aminoethanol 0 0 0 0 0 0
31 Antimony and its compounds 0 0.1 0 0 0 0.009
53 Ethylbenzene 4.4 0 0 0 0 0
71 Ferric chloride 0 0 0 0 0 0
80 Xylene 7.6 0 0 0 0 0
87 Chromium and chromium(III) compounds 0.0099 0 0 0 0 26
88 Chromium(VI) compounds 0 0 0 0 0 0.19
132 Cobalt and its compounds 0 0 0 0 0 0
185 Dichloropentafluoropropane; HCFC-225 1.8 0 0 0 0 0
186 Dichloromethane; methylene dichloride 2.5 0 0 0 0 0
242 Selenium and its compounds 0 0.058 0 0 0 2.5
243 Dioxins 1.4 0 0 0 0 0
258 1,3,5,7-tetraazatricyclo[3.3.1.13.7]decane; hexamethylenetetramine 0 0 0 0 0 0
262 Tetrachloroethylene 2.1 0 0 0 0 0
292 Tributylamine 0 0 0 0 0 0
296 1,2,4-trimethylbenzene 1.5 0 0 0 0 0
300 Toluene 30 0 0 0 0 0
302 Naphthalene 0 0 0 0 0 0
305 Lead 0 0 0 0 0 0
308 Lead compounds 0 0 0 0 0 0
309 Nickel 0.005 0 0 0 0 8.2
400 Nickel compounds 3 0 0 0 0 0
405 Benzene 0 9.2 0 0 0 1.5
406 Polychlorinated biphenyls; PCBs 0 0 0 0 0 0
410 Poly(oxyethylene) nonylphenyl ether 0 0 0 0 0 0
411 Formaldehyde 0 0 0 0 0 0
412 Manganese and its compounds 0.023 8.5 0 0 0 140
453 Molybdenum and its compounds 0 1.2 0 0 0 1.4
460 Tritolyl phosphate 0 0 0 0 0 0
Subtotal 53 21 0 0 0 180
Total 74 180
SubstanceNo. Substance
Volume Released Volume Transferred
Air Water Area Soil On-premise Landfill Sewer Off-premise
80 Xylene 1.5 0 0 0 0 0
300 Toluene 2.9 0 0 0 0 0
Subtotal 4 0 0 0 0 0
Total 4 0
Substances Reported under PRTR (West Japan Works) Konan District (tonnes/year, dioxins: g-TEQ/year)
JFE Group CSR REPORT 2014 Environmental Data Book 18
▼ JF
E S
tee
l
Substances Reported under PRTR (West Japan Works) Kurashiki District (tonnes/year, dioxins: g-TEQ/year)

JFE Group CSR REPORT 2014 Environmental Data Book19
▼ JF
E S
tee
l
Substances Reported under PRTR (Fukuyama District)
SubstanceNo. Substance
Volume Released Volume Transferred
Air Water Area Soil On-premise Landfill Sewer Off-premise
1 Zinc compounds (water-soluble) 0 3.8 0 0 0 0
15 Acenaphthene 0 0 0 0 0 0
20 2-aminoethanol 0 0 0 0 0 0
31 Antimony and its compounds 0 0.39 0 0 0 16
32 Anthracene 0 0 0 0 0 0
53 Ethylbenzene 12 0 0 0 0 6.2
71 Ferric chloride 0 0 0 0 0 0
80 Xylene 46 0 0 0 0 6.7
87 Chromium and chromium(III) compounds 0 0 0 0 0 24
88 Chromium(VI) compounds 0 0 0 0 0 0
104 Chlorodifluoromethane; HCFC-22 0 0 0 0 0 0
132 Cobalt and its compounds 0 0 0 0 0 0.0044
186 Dichloromethane; methylene dichloride 12 0 0 0 0 0
240 Styrene 0.26 0 0 0 0 0
243 Dioxins 3.3 0 0 0 0 0
262 Tetrachloroethylene 19 0 0 0 0 0
296 1,2,4-trimethylbenzene 1.6 0 0 0 0 0.088
300 Toluene 26 0 0 0 0 0.059
302 Naphthalene 1.7 0 0 0 0 0.18
305 Lead compounds 0 0.013 0 0 0 150
308 Nickel 0 0 0 0 0 0
309 Nickel compounds 0 0.81 0 0 0 23
321 Vanadium compounds 0 0 0 0 0 16
340 Biphenyl 0 0 0 0 0 0
374 Hydrogen fluoride and its water-soluble salts 0 7.2 0 0 0 0
400 Benzene 9.8 0 0 0 0 0
405 Boron compounds 0 2.2 0 0 0 1.6
411 Formaldehyde 0 0 0 0 0 0
412 Manganese and its compounds 0 7.9 0 0 0 120
438 Methylnaphthalene 0 0 0 0 0 0
453 Molybdenum and its compounds 0 0.63 0 0 0 0
460 Tritolyl phosphate 0 0 0 0 0 0
461 Triphenyl phosphate 0 0 0 0 0 0
Subtotal 128 23 0 0 0 364
Total 151 364
(tonnes/year, dioxins: g-TEQ/year)
SubstanceNo. Substance
Volume Released Volume Transferred
Air Water Area Soil On-premise Landfill Sewer Off-premise
1 Zinc compounds (water-soluble) 0 0.017 0 0 0 0
53 Ethylbenzene 7.9 0 0 0 0 0
80 Xylene 53 0 0 0 0 0
83 Cumene 0.22 0 0 0 0 0
87 Chromium and chromium(III) compounds 0 0.084 0 0 0 0.22
188 N,N-dicyclohexylamine 0 0 0 0 0 2.7
296 1,2,4-trimethylbenzene 0.13 0 0 0 0 0
297 1,3,5-trimethylbenzene 6.1 0 0 0 0 0
300 Toluene 8.2 0 0 0 0 0
305 Lead compounds 0 0 0 0 0 0
308 Nickel 0 0 0 0 0 0
309 Nickel compounds 0 0 0 0 0 5
384 1-bromopropane 1.7 0 0 0 0 0
392 N-hexane 0.0052 0 0 0 0 0
405 Boron compounds 0 3.8 0 0 0 0
412 Manganese and its compounds 0 0.12 0 0 0 24
448 Methylenebis(4,1-phenylene) diisocyanate 0 0 0 0 0 0
453 Molybdenum and its compounds 0 0.26 0 0 0 0.15
Subtotal 77 4 0 0 0 32
Total 81 32
Substances Reported under PRTR (Chita Works) (tonnes/year, dioxins: g-TEQ/year)

Input Materials
Raw Materials
2009 2010 2011 2012 20130
60
40
20
80
(1,000 tonnes)
(FY)
63.5 63.5
46.1 46.1
55.5
Electricity
2009 2010 2011 2012 20130
20,000
10,000
30,000
40,000
(MWh)
(FY)
33,781 33,93231,380
26,046
18,274
Output Products
Products
2009 2010 2011 2012 20130
40
20
60
80
(1,000 tonnes)
(FY)
60.152.6
38.7 40.2
56.1
Water
2009 2010 2011 2012 20130
80
40
120
160
(1,000 tonnes)
(FY)
141.1 140.4
117.1
85.8
152.7
Heavy Oil, Kerosene, Light Oil and Gasoline
2009 2010 2011 2012 20130
200
400
600
(kl)
(FY)
491.1524.9
457.7
549.6
373.9
JFE Engineering
JFE Group CSR REPORT 2014 Environmental Data Book 20
▼ JF
E E
ng
ine
erin
g

CO2 Emissions
● Status on Non-consolidated Basis
CO2 Emissions (JFE Engineering Head Offi ce and Works)
1990 1997 20092008 2010 2011 2012 ’08−’12Average
20130
10
5
15
20
(1,000 t-CO2)
(FY)
16.818.8
16.316.814.7
15.8 16.4 16.0
13.3−29%
−14.9%
● Status as a Group
CO2 Emissions of JFE Engineering Group
72.174.172.970.977.1
2010 2011 2012 20130
60
30
90
(1,000 t-CO2)
(FY)2009
13.3 Head offices, works 3.9 Branch offices
18.5
27.1
9.3
JapanRecycle
JFE Kankyo
JFEEngineering
Other
(GJ)
Name of Company Emissions
Japan Recycling Corporation 27,095.3
JFE Kankyo Corporation 18,451.1
JFE Engineering Corporation 17,161.1
Fuji Kako Co., Ltd. 2,675.3
Recycling Management Japan, Inc. 1,583.6
JFE Urban Recycle Corporation 1,416.5
Tohoku Dock Tekko K.K. 1,174.5
Kitanippon Industrial Co., Ltd. 930.6
Asukasoken Co., Ltd. 747.0
Japan Pipeline Engineering Corporation 682.5
JFE Technos Corporation 100.4
Total 72,017.9
Name of Company Energy Use
JFE Kankyo Corporation 3,549,541
JFE Engineering Corporation 3,236,510
Japan Recycling Corporation 507,454
Japan Pipeline Engineering Corporation 394,407
Fuji Kako Co., Ltd. 68,770
Recycling Management Japan, Inc. 52,993
JFE Technos Corporation 51,283
JFE Urban Recycle Corporation 37,744
Asukasoken Co., Ltd. 23,621
Kitanippon Industrial Co., Ltd. 20,265
Tohoku Dock Tekko K.K. 19,169
Total 7,961,757
CO2 Emissions of JFE Engineering Group Companies (FY2013)
Energy Consumption of JFE Engineering Group Companies (FY2013)
(t-CO2)
CO2 emission factor for purchased electricity: unadjusted emission factors of each electric power company for each fiscal year.
Note: The graph shows energy-derived CO2 emissions for JFE Engineering and 11 major domestic affiliates.
JFE Group CSR REPORT 2014 Environmental Data Book21
▼ JF
E E
ng
ine
erin
g
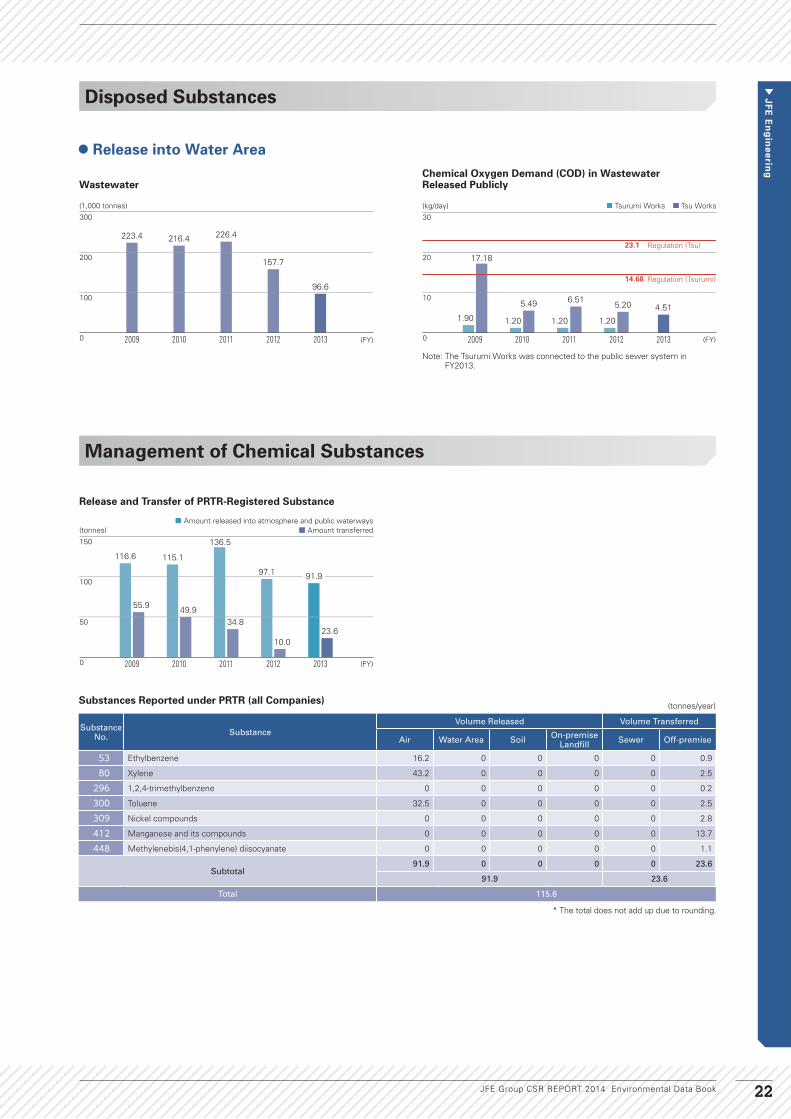
Disposed Substances
● Release into Water Area
WastewaterChemical Oxygen Demand (COD) in Wastewater Released Publicly
Note: The Tsurumi Works was connected to the public sewer system in FY2013.
2009 2010 2011 2012 20130
100
200
300
(1,000 tonnes)
(FY)
223.4 216.4 226.4
157.7
96.6
Management of Chemical Substances
Release and Transfer of PRTR-Registered Substance
2010 2011 2012 20130
50
100
150
(tonnes)
(FY)2009
55.9 49.9
10.023.6
34.8
116.6 115.1
97.1
136.5
■ Amount released into atmosphere and public waterways■ Amount transferred
91.9
2010 2011 2012 20130
10
20
30
(kg/day)
(FY)2009
17.18
5.49 5.20 4.516.51
1.90 1.20 1.201.20
■ Tsurumi Works ■ Tsu Works
Regulation (Tsurumi)
Regulation (Tsu)
14.68
23.1
JFE Group CSR REPORT 2014 Environmental Data Book 22
▼ JF
E E
ng
ine
erin
g
* The total does not add up due to rounding.
SubstanceNo. Substance
Volume Released Volume Transferred
Air Water Area Soil On-premise Landfill Sewer Off-premise
53 Ethylbenzene 16.2 0 0 0 0 0.9
80 Xylene 43.2 0 0 0 0 2.5
296 1,2,4-trimethylbenzene 0 0 0 0 0 0.2
300 Toluene 32.5 0 0 0 0 2.5
309 Nickel compounds 0 0 0 0 0 2.8
412 Manganese and its compounds 0 0 0 0 0 13.7
448 Methylenebis(4,1-phenylene) diisocyanate 0 0 0 0 0 1.1
Subtotal91.9 0 0 0 0 23.6
91.9 23.6
Total 115.6
Substances Reported under PRTR (all Companies) (tonnes/year)

Tsurumi Works Tsu Works
Waste Disposal in Each Section and Works
● Offices
2010 2011 2012 20130
100
200
400
300
500
(tonnes)
(FY)2009
421.6
323.6288.7 311.5
■ Generation volume■ Final disposal volume
281.9
5.2 3.5 3.3 3.2 3.5
2010 2011 2012 20130
20
40
80
60
100
(tonnes)
(FY)2009
83.2
4.6 4.9 4.0 4.7 4.4
63.8
90.1
67.164.8
■ Generation volume■ Final disposal volume
(%)
2009 2010 2011 2012 2013
Recycling rate (target)
97.0 98.0 98.0 98.0 98.0
Recycling rate (result)
98.7 98.8 98.8 98.8 98.8
(%)
2009 2010 2011 2012 2013
Recycling rate (target)
82.0 83.0 90.0 91.0 92.0
Recycling rate (result)
85.8 84.9 90.0 92.1 88.1
JFE Group CSR REPORT 2014 Environmental Data Book23
▼ JF
E E
ng
ine
erin
g
SubstanceNo. Substance
Volume Released Volume Transferred
Air Water Area Soil On-premise Landfill Sewer Off-premise
53 Ethylbenzene 1.0 0 0 0 0 0.1
80 Xylene 4.0 0 0 0 0 0.4
300 Toluene 18.0 0 0 0 0 1.7
448 Methylenebis(4,1-phenylene) diisocyanate 0 0 0 0 0 1.1
Subtotal23.0 0 0 0 0 3.3
23.0 3.3
Total 26.3
Substances Reported under PRTR (Tsurumi Works) (tonnes/year)
* The total does not add up due to rounding.
SubstanceNo. Substance
Volume Released Volume Transferred
Air Water Area Soil On-premise Landfill Sewer Off-premise
53 Ethylbenzene 15.2 0 0 0 0 0.8
80 Xylene 39.2 0 0 0 0 2.1
296 1,2,4-trimethylbenzene 0.0 0 0 0 0 0.2
300 Toluene 14.5 0 0 0 0 0.8
309 Nickel compounds 0 0 0 0 0 2.8
412 Manganese and its compounds 0 0 0 0 0 13.7
Subtotal68.9 0 0 0 0 20.3
68.9 20.3
Total 89.3
Substances Reported under PRTR (Tsu Works) (tonnes/year)

Tsurumi Works Tsu Works
● Plants
2010 2011 2012 20130
100
200
400
300
500
(tonnes)
(FY)2009
379.2358.2
327.7
427.3
157.9
116.1 118.3
162.0
109.3
381.8
■ Generation volume■ Final disposal volume
2010 2011 2012 20130
100
200
400
500
300
600
(tonnes)
(FY)2009
557.4
359.6
459.9449.0
339.0
191.3
262.9237.2 255.7
470.5
■ Generation volume■ Final disposal volume
(%)
2009 2010 2011 2012 2013
Recycling rate (target)
52.0 54.0 54.0 55.0 56.0
Recycling rate (result)
47.4 53.0 60.8 41.4 53.6
(%)
2009 2010 2011 2012 2013
Recycling rate (target)
29.0 25.0 31.0 29.0 30.0
Recycling rate (result)
22.2 30.2 25.5 32.0 30.1
● Construction Sites
Rubble SludgeIndustrial Wastes, Excluding Rubble and Sludge
2010 2011 2012 20130
500
20,000
60,000
40,000
80,000
(tonnes)
(FY)2009
63,178.0
70,595.964,596.6
72,168.376,807.9
16.6103.7
344.4
25.0 40.8
■ Generation volume■ Final disposal volume
2010 2011 2012 20130
(tonnes)
(FY)2009
15,090.9
18,397.5
7,916.4
23,302.121,986.9
13,648.3
502.3 944204.2 181.3
10,000
5,000
20,000
15,000
25,000
■ Generation volume■ Final disposal volume
2010 2011 2012 20130
4,000
2,000
8,000
6,000
10,000
(tonnes)
(FY)2009
5,411.3
6,530.1
8,824.0
6,099.1
700.71,030.1 1,023.5 974.9
319.6
7,722.5
■ Generation volume■ Final disposal volume
(%)
2009 2010 2011 2012 2013
Recycling rate (target)
99.5 99.5 99.5 99.5 99.5
Recycling rate (result)
100 99.9 99.6 100 99.9
(%)
2009 2010 2011 2012 2013
Recycling rate (target)
75.0 75.0 95.0 95.0 95.0
Recycling rate (result)
14.1 97.1 95.6 97.4 99.2
(%)
2009 2010 2011 2012 2013
Recycling rate (target)
74.0 80.0 85.0 85.0 85.0
Recycling rate (result)
86.2 83.0 82.9 87.1 96.2
JFE Group CSR REPORT 2014 Environmental Data Book 24
▼ JF
E E
ng
ine
erin
g

2009 2010 2011 2012 20130
1,000
500
1,500
2,500
2,000
(1,000 kW)
(FY)
1,848 1,8551,635
1,3121,060
2001
2,031
32597288
350592
288
33399
920
293
34280
1,127
314
32985
1,292
402
243
94
1,118
321
32584
■ Tokyo ■ Osaka ■ Nagoya ■ Branch offices
Electricity Consumption and CO2 Emissions
Electric Power Consumption by JFE Shoji Trade
Input Materials
2009 2010 2011 2012 20130
4,000
2,000
6,000
8,000
(Boxes)
(FY)
6,293 6,390 6,1575,394 5,527
2001
5,570
3,152
560
1,586
229
3,159
710
1,299226
3,922
699
1,300236
4,156
680
1,289265
4,051
712
623184
4,049
786
1,193265
■ Tokyo ■ Osaka ■ Nagoya ■ Branch offices
Paper Used by JFE Shoji Trade (Copier Papers)
China11.5
Japan10.7
Asia3.8
North and Central America2.7
Total:28,700 t-CO₂
CO2 Emissions of JFE Shoji Trade Group
JFE Shoji Trade
Note: The graph shows CO2 emissions from the electric power consumption of 30 companies including JFE Shoji Trade and major domestic consolidated subsidiaries (steel processing companies).
CO2 emission factor for purchased energy: CO2 equivalent of 0.000550 (t-CO2/kWh) for the FY2012 unadjusted emission factors of each electric power company.
JFE Group CSR REPORT 2014 Environmental Data Book25
▼ JF
E S
ho
ji Trad
e

Comparison with Environmental Reporting Guidelines 2012 (Ministry of the Environment, Japan)
Report Parameters and Summary
ItemCSR Report Environmental Data
Book PagesPages Content JFE Steel JFE Engineering JFE Shoji Trade1. Report Profile(1) Report boundary and reporting period 1 Editorial Policy ○ ○ ○ 1(2) Organizations coverage ratio and reporting period difference 1 Editorial Policy ○ ○ ○ —
(3) Reporting policies1 Editorial Policy ○ ○ ○ —60–62 GRI Content Index ○ ○ ○ —
(4) Policies for selecting a type of report1 Editorial Policy ○ ○ ○ —Back cover Contact information ○ ○ ○ —
2. Chairman’s statement/CEO’s statement 3–4 Message from the CEO ○ ○ ○ —3. Summary(1) Overview of environmentally focused management 5–6 JFE in Society ○ ○ ○ 2(2) Overview of KPI trends — — —(3) Summary of activities to address an individual environmental issue 29–30 Main Environmental Targets and Results ○ ○ ○ 7–84. Material Balance
31–32 Materials Flow ○ ○ 9–10
Information and Indicators on How Environmentally Focused Management Including Environmental Management is Working
ItemCSR Report Environmental Data
Book PagesPages Content JFE Steel JFE Engineering JFE Shoji Trade1. Environmental Policies, Visions and Business Strategies
(1) Environmental policies2 Standards of Business Conduct ○ ○ ○ —25 Environmental Philosophy and Policy ○ ○ ○ —
(2) Material issues, visions and business strategies3–4 Message from the CEO ○ ○ ○ —28 Environmental Risks and Opportunities ○ ○ ○ —
2. Organizational Systems and Governance(1) Organizational systems for environmentally focused
management25–26 Environmental Management ○ ○ ○ 364 Third Party Comments ○ ○ ○ —
(2) Environmental risk management system 25–26 Environmental Management ○ ○ ○ —
(3) Compliance with environmental regulations26 Environmental Auditing ○ ○ ○ —38–39 Protecting the Environment ○ ○ —
3. Responsiveness of Stakeholder Issues
(1) Responsiveness to stakeholder issues25 Environmental Philosophy and Strategies ○ ○ ○ —28 Environmental Risks and Opportunities ○ ○ ○ —
(2) Philanthropy related to the environment35–36 Initiatives by the Japanese Steel Industry ○ —45 Environment-related Communication with Society ○ ○ ○ —
4. Environmental Initiatives in the Value Chain
(1) Strategies and environmental policies in the value chain28 Value Chain Initiatives ○ ○ ○ —28 Environmental Risks and Opportunities ○ ○ ○ —34 CO2 Reduction in Value Chain ○ ○ 13
(2) Green purchasing and procurement 28 Value Chain Initiatives ○ ○ ○ —
(3) Products and services designed for mitigating environmental impacts
10–12 Reducing Environmental Loads with the World’s Most Innovative Technology ○ ○ ○ —34 CO2 Reduction in Value Chain ○ 1340–41 Resource Recycling ○ ○ ○ 5–642–44 Eco-Friendly Products and Technologies ○ ○ ○ —
(4) New environmental technologies and research and development
7–12 Reducing Environmental Loads with the World’s Most Innovative Technology ○ ○ ○ —27 Environmental Accounting ○ ○ 435–36 Initiatives by the Japanese Steel Industry ○ —42–44 Eco-Friendly Products and Technologies ○ ○ ○ —
(5) Environmentally sound transportation9 Reducing Environmental Loads with the World’s Most Innovative Technology ○ —34 CO2 Reduction in the Value Chain ○ 13
(6) Resource exploitations and real estate development/investment with less environmental impacts — — —
(7) Waste management and recycling29–30 Main Environmental Targets and Results ○ ○ ○ 7–841 Resource Recycling ○ ○ ○ 12, 14, 23–24
Information and Indicators on Environmental Impacts of Business Activities and Environmental Initiatives Undertaken to Mitigate Them
ItemCSR Report Environmental Data
Book PagesPages Content JFE Steel JFE Engineering JFE Shoji Trade1. Resources Used and Energy Consumption
(1) Total energy consumption and initiatives to reduce it
7–9 Reducing Environmental Loads with the World’s Most Innovative Technology ○ ○ —29–30 Main Environmental Targets and Results ○ ○ ○ 7–831–32 Materials Flow ○ ○ 9–10, 2033–34 Energy Savings and CO2 Reduction in Steelmaking ○ 11–1337 CO2 Emissions ○ 25
(2) Total materials used and initiatives to reduce them7–8 Reducing Environmental Loads with the World’s Most Innovative Technology ○ ○ —29–30 Main Environmental Targets and Results ○ 7–831–32 Materials Flow ○ ○ 9–10, 11, 20
(3) Water withdrawal and initiatives to reduce it31–32 Materials Flow ○ ○ 9–10, 11, 2038 Cyclic Use of Water ○ 12
2. Recycled input resources (within the organizational boundary)
7–8 Reducing Environmental Loads with the World’s Most Innovative Technology ○ ○ —29–30 Main Environmental Targets and Results ○ ○ ○ 7–831–32 Materials Flow ○ 9–1238 Cyclic Use of Water ○ 1241 Resource Recycling ○ ○ ○ 5–6
3. Products and Services and Environmental Impacts Arising from Production(1) Total products manufactured or goods sold 31–32 Materials Flow ○ ○ 9–10, 11, 20
(2) Greenhouse gas emissions and initiatives to reduce them
7–9 Reducing Environmental Loads with the World’s Most Innovative Technology ○ ○ —29–30 Main Environmental Targets and Results ○ ○ ○ 7–831–32 Materials Flow ○ ○ 9–1033–37 Global Warming Prevention ○ ○ ○ 4, 12–13, 21, 25
(3) Total water discharge and initiatives to reduce it31–32 Materials Flow ○ ○ 7–838–39 Efficient Use of Water and Prevention of Contamination ○ 11–12, 14, 22
(4) Effluents and nuisance, and initiatives to reduce them7 Reducing Environmental Loads with the World’s Most Innovative Technology ○ ○ —31–32 Materials Flow ○ ○ 7–838 Controlling Air Emissions ○ ○ 14
(5) Release and transfer of chemical substances and initiatives to reduce them
31–32 Materials Flow ○ ○ 7–839 Management of Chemical Substances ○ 14–19, 22–23
(6) Total weight of waste generated, waste disposed by land filling or incineration and initiatives to reduce them
8, 11–12 Reducing Environmental Loads with the World’s Most Innovative Technology ○ ○ —29–30 Main Environmental Targets and Results ○ ○ 7–831–32 Materials Flow ○ ○ 9–10, 11–12, 1440–41 Resource Recycling ○ ○ ○ 5–6, 23–24
(7) Significant spills of hazardous substances and measures taken for preventing them 39 Management of Chemical Substances ○ ○ —
4. Conservation of Biological Diversity and the Sustainable Use of its Components12 Reducing Environmental Loads with the World’s Most Innovative Technology ○ —42 Eco-Friendly Products and Technologies ○ —45 Disclosure and Exchange of Information ○ ○ —
Information and Indicators on the Economic and Social Contexts of Environmentally Focused Management
ItemCSR Report Environmental Data
Book PagesPages Content JFE Steel JFE Engineering JFE Shoji Trade1. Economic Contexts of Environmentally Focused Management
(1) Economic contexts in an enterprise27 Environmental Accounting ○ ○ 428 Environmental Risks and Opportunities ○ ○ ○ —
(2) Economic contexts in society 28 Environmental Risks and Opportunities ○ ○ ○ —
2. Social contexts of environmentally focused management13–16 Harnessing Human Diversity as an Organizational Strength ○ ○ ○ —17–23 Management ○ ○ ○ —46–58 Contributing to Society’s Development ○ ○ ○ —
Miscellaneous Contents to Be Disclosed
ItemCSR Report Environmental Data
Book PagesPages Content JFE Steel JFE Engineering JFE Shoji Trade1. Events after the Reporting Period(1) Events after the reporting period — —(2) Extraordinary events — —2. Assurance and Other Measures to Enhance Reliability of Environmental Information
— —
JFE Group CSR REPORT 2014 Environmental Data Book 26

CSR REPORT 2014Environmental Data Book
CONTENTS01 Scope of Report02 Organizational Profile
JFE Group
03 Status of ISO 14001 Certification04 JFE Group’s Environmental Accounting / CO2 Emissions of the JFE Group05 JFE Group Recycling Businesses06 JFE Group’s Recycling Business List07 Priority Environmental Targets and Results
JFE Steel
09 Material Flow11 Input Materials / Output Products12 Recycled Resources / CO2 Emissions and Energy Consumption13 CO2 Emissions and Energy Consumption14 Disposed Substances
JFE Engineering
20 Input Materials / Output Products21 CO2 Emissions22 Disposed Substances / Management of Chemical Substances23 Waste Disposal in Each Section and Works
JFE Shoji Trade
25 Electricity Consumption and CO2 Emissions / Input Materials
26 Comparison with Environmental Reporting Guidelines 2012 (Ministry of the Environment, Japan)
JFE Holdings, Inc.
2-2-3 Uchisaiwaicho, Chiyoda-ku, Tokyo 100-0011, Japanwww.jfe-holdings.co.jp/en
Inquiries:Corporate Planning Department of JFE Holdings, Inc.Tel: +81-3-3597-4321E-mail: [email protected]
This book contains supplemental information and data relating to environmental measures for three JFE Group companies, as well as information and data relating to the JFE Group’s recycling business. Please read this book in conjunction with the “JFE Group CSR Report 2014” to gain a more comprehensive understanding of JFE’s environmental initiatives.