Embed Size (px)
DESCRIPTION
jurnal akuntansi manajemen
Citation preview
Does Corporate Social Responsibility
Influence Firm Performance of Indian
Companies?Supriti MishraDamodar Suar
ABSTRACT. This study examines whether corporate
social responsibility (CSR) towards primary stakeholders
influences the financial and the non-financial perfor-
mance (NFP) of Indian firms. Perceptual data on CSR
and NFP were collected from 150 senior-level Indian
managers including CEOs through questionnaire survey.
Hard data on financial performance (FP) of the companies
were obtained from secondary sources. A questionnaire
for assessing CSR was developed with respect to six
stakeholder groups – employees, customers, investors,
community, natural environment, and suppliers. A
composite measure of CSR was obtained by aggregating
the six dimensions. Findings indicate that stock-listed
firms show responsible business practices and better FP
than the non-stock-listed firms. Controlling confounding
effects of stock-listing, ownership, and firm size, a
favorable perception of managers towards CSR is found
to be associated with increase in FP and NFP of firms.
Such findings hold good when CSR is assessed for the six
stakeholder groups in aggregate and for each stakeholder
group in segregate. Findings suggest that responsible
business practices towards primary stakeholders can be
profitable and beneficial to Indian firms.
KEY WORDS: corporate social responsibility, financial
performance, non-financial performance
Introduction
The relation between corporate social responsibility
(CSR) and firm performance has evoked much
interest among researchers. While some studies
reveal a positive relation between the two constructs
(Graves and Waddock, 1994; Griffin and Mahon,
1997; McGuire et al., 1988; Waddock and Graves,
1997), some others indicate a negative relation
(Bromiley and Marcus, 1989; Wright and Ferris,
1997), and still others (Aupperle et al., 1985; Teoh
et al., 1999) establish no relation between the two
constructs. Though a positive relation between CSR
and firm performance has prevailed in many studies
(Margolis and Walsh, 2003; Orlitzky et al., 2003),
results still remain inconclusive (Margolis and Walsh,
2003; Vogel, 2005). Such inconclusiveness creates
ground for further investigation.
Corporate social responsibility is predominantly
considered as a western phenomenon due to strong
institutions, standards, and appeal systems which are
weak in developing countries of Asia (Chapple and
Moon, 2005). Such weak standards pose considerable
challenge to firms for practicing CSR in developing
countries of Asia including India. Though extensive
research on CSR influencing firm performance has
been carried out in developed countries (Belal, 2001),
there is a dearth of such studies in India. Current
research on CSR in India is mostly limited to self-
reported questionnaire surveys on CSR (Khan and
Atkinson, 1987; Krishna, 1992), nature and charac-
teristics of CSR in India (Arora and Puranik, 2004;
Sood and Arora, 2006), and policies and practices of
multi-national corporations (MNCs) towards CSR in
India (CREM, 2004) without linking it with firm
performance. This study intends to fill that gap. It
replicates and extends the past findings (Tsang and
Kwan, 1999) on CSR and firm performance of
western counties. It is intended to be carried out in a
different country, in a different time period, in dif-
ferent industries, and using different measures. Such
replications are warranted to establish the external
validity of results and to rebuild the confidence of
researchers and practitioners on earlier findings.
Operationalization of CSR has often been a
source of debate. Researchers have used various
Journal of Business Ethics (2010) 95:571–601 � Springer 2010DOI 10.1007/s10551-010-0441-1
proxy measures to assess CSR (Aupperle et al., 1985;
Cochran and Wood, 1984; Fomburn and Shanley,
1990; McGuire et al., 1988). After introduction of
the stakeholder concept (Freeman, 1984), reconfig-
uration of CSR from stakeholders’ perspective has
given a new direction to the evaluation of CSR
(Clarkson, 1995). Single-dimensional measures of
CSR have been replaced by multi-dimensional
measures of CSR that include various stakeholder
issues. However, studies using the stakeholders’
perspective often aggregate the dimensions of CSR
towards various stakeholders to one composite index
while examining its relation with firm performance
(Cochran and Wood, 1984; Ruf et al., 2001;
Waddock and Graves, 1997). Such aggregation has
facilitated inter-firm comparison on the level of
CSR displayed by firms. However, such aggregation
has the risk of ‘masking individual dimensions’
of CSR related to specific stakeholder groups
(Galbreath, 2006). With aggregation, a firm’s high
level of CSR may be driven by favorable CSR
policies and practices towards a few stakeholders
leaving the issue of other stakeholders fully or par-
tially unattended. Analyzing the influence of such
skewed measures of CSR on firm performance may
not reflect a true relation between the two con-
structs. This necessitates examining the influence of
individual dimensions of CSR on firm performance.
Only few studies have examined the relation
between individual CSR dimensions and firm per-
formance (Berman et al., 1999; Graafland and van de
Ven, 2006). This study examines the influence of
individual as well as aggregate CSR dimensions on
firm performance.
Past research has mostly used financial perfor-
mance (FP) measures to assess firm performance.
However, due to the historical nature and rigidity of
most of the financial measures, assessment of non-
financial performance (NFP) along with FP is nee-
ded to evaluate firm performance (Govindarajan and
Gupta, 1985; Ittner and Larcker, 1998). Because
CSR leads to many intangible benefits for the
company such as corporate reputation and image
(Schwaiger, 2004), increased employee motivation
(Epstein and Roy, 2001), improved brand image
(Heal, 2005) and the like, NFP that assesses intan-
gible benefits/assets is likely to be influenced by
CSR. While the influence of CSR on FP is a widely
researched area (Zahra and LaTour, 1987), its
influence on NFP is a sparsely investigated topic.
This study examines the influence of CSR on both
FP and NFP of Indian companies.
Conceptual background and hypotheses
development
CSR in India
Asian firms often lag behind their Western coun-
terparts on CSR practices (KPMG, 2005). However,
advent of liberalization and globalization, entry of
MNCs in Asian markets, rising consumer expecta-
tions towards business, and emergence of pressure
groups have made the case of CSR stronger in Asian
countries including India. But Indian companies
mostly focus their CSR activities on community
development (PiC, 2004). Philanthropic orientation
of Indian businessmen has its roots in history. In the
early nineteenth century India, CSR was mainly
found in the form of philanthropic contributions by
Gujrati and Parsi merchant communities, who pro-
vided funds for building schools, pilgrim rest houses,
places of worship like temples, distributing relief
items during disasters, and helping the poor.
A 20-country public opinion survey finds that
India is the last in the level of CSR demanded from
companies in any country (Environics International,
2001). A lack of provable link between CSR and
firm performance often discourages companies from
engaging in CSR (British Council et al., 2002).
Obstacles to CSR are found to be ad hoc approach by
the top management towards CSR, lack of con-
sensus on priorities within the firm, and problems
related to measurement and evaluation of CSR
activities (Krishna, 1992). Unclear policies, bureau-
cracy, poor monitoring, complicated tax systems,
and poor infrastructure are a few more hindering
factors (CSM, 2001). However, there is a growing
feeling among the Indians that business organiza-
tions must play a wider role in the society besides
providing quality products at reasonable rates,
making their operations environmentally sound,
adhering to high labor standards, and reducing hu-
man rights abuses at the work place (Kumar et al.,
2001). Consequently, Indian companies have started
changing their outlook towards CSR by look-
ing beyond passive philanthropy. Companies are
572 Supriti Mishra and Damodar Suar
considering CSR for improved brand image and
stronger ties with the local community (British
Council et al., 2002; PiC, 2004).
CSR from stakeholders’ perspective
The approach of business organizations to CSR has
transcended from merely displaying social concerns
to being sensitive and alert to the constituents in the
internal and external business environment. These
constituents, known as stakeholders, are potent for-
ces to accelerate or decelerate a firm’s performance.
With globalization of national boundaries and
information technology revolution, companies are
under tight scrutiny from multiple stakeholders
including regulators, investors, customers, pressure
groups, and the public at large. Corporate scandals
are making big news leading to crumbling of well-
settled business empires. Recent sub-prime crisis in
the US and the subsequent crashing of stock indices
of companies across the globe is a case in point.
When stakeholders loose confidence in a firm’s
performance, the firm loses its critical support
structure and customer base (Lee, 2008). Customers
stop buying products or go for legal suits, share-
holders sell their stocks, employees do not perform,
and environmental advocates sue (Wood, 1991), all
of which directly affect firm performance. This
warrants pursuing meaningful and long-term rela-
tions with stakeholders.
A firm’s survival and success depends on the ability
of its managers to create sufficient wealth and satis-
faction for its primary stakeholders (Clarkson, 1995).
Primary stakeholders of a firm include employees,
shareholders, customers, suppliers, communities, and
natural environment. If any of the primary stake-
holder groups withdraws its support to the firm, the
firm’s operation is adversely affected (Clarkson,
1995). Firms that establish relationship with primary
stakeholders beyond market transactions gain com-
petitive advantage (Barney and Hansen, 1994;
Fomburn and Shanley, 1990). Effective management
of key stakeholders acts as a value driver by leveraging
performance and reducing stakeholder-inflicted
costs. Lower employee turnover reduces hiring and
training costs, loyal suppliers reduce quality certifi-
cation costs, supportive communities reduce legal
and public relations overhead, and stable shareholders
reduce stock market volatility (McVea and Freeman,
2005). In order to achieve sustainability in business,
firms must identify key stakeholders affecting the
firm, identify their needs, and design organizational
policies and practices to cater to them. Accordingly,
we define CSR towards a particular stakeholder
group as a firm’s policies, processes, and practices
towards that stakeholder group. The study recognizes
primary stakeholders as key stakeholders and defines
CSR from their perspective.
Measurement of CSR
Past studies on CSR have often been criticized for
using inappropriate measures of CSR. Researchers
have used various proxy measures to assess CSR: (a)
one-dimensional surrogate measures such as repu-
tation ranking of companies on pollution control
performance (Chen and Metcalf, 1980; Freedman
and Jaggi, 1982), (b) Moskowitz’s social responsi-
bility ratings (Cochran and Wood, 1984; Mosko-
witz, 1972), and (c) Fortune corporate reputation
index (Fomburn and Shanley, 1990; McGuire et al.,
1988). These measures have been criticized for
their inability to incorporate stakeholders’ issues
(Aupperle et al., 1985; Ullman, 1985). To overcome
such inadequacies, recent studies (Ruf et al., 2001;
Waddock and Graves, 1997) use CSR data devel-
oped by various agencies that evaluate CSR from
stakeholders’ perspective such as the KLD database
of Kinder, Lydenberg, Domini & Co., Inc. (Kinder
et al., 2005).
Voluntary standards such as ISO 14000, OHSAS
18000, Social Accountability (SA) 8000 (SAI, 2001),
United Nations’ global compact, and Global
Reporting Initiative guidelines (GRI, 2002) outline
a wide range of responsible business practices related
to stakeholder issues such as environment, occupa-
tional health and safety, labor, human rights, cor-
ruption, etc. In recent years, an increasing number of
companies are making CSR disclosures as per these
standards. Nearly 90% of Fortune 500 firms make
CSR disclosures in their annual reports (Boli and
Hartsuiker, 2001). However, Indian companies lag
behind their global counterparts in terms of CSR
disclosure. A recent survey of 27 companies by
KPMG finds that only 25% of the companies are
signatories to GRI guidelines, 8% mention about
573CSR and Firm Performance
their social expenditures, and 25% file CSR reports
(Handique, 2008). There is no systematic CSR
database of companies in India. There are two
widely used secondary database on Indian compa-
nies, Prowess database of Centre for Monitoring
Indian Economies (CMIE) (Prowess, 2005) and
India Business Insight Database (IBID) of Infor-
matics India Limited (2003). The former gives access
to corporate governance reports and the latter
includes newspaper articles on corporate activities
including CSR initiatives. Number of mandatory
standards included in the Indian Companies Act,
1956, the Securities and Exchange Board of India
(SEBI) guidelines, various pollution prevention acts,
and the like give dispersed ideas about the respon-
sibilities of Indian companies to different stake-
holders. In this context, this study develops a
comprehensive measure of CSR towards each pri-
mary stakeholder group incorporating corresponding
social, ethical, legal, and economic issues derived
from local and global standards.
Firm performance
Griffin and Mahon (1997) have reviewed 51 studies
on CSR–firm performance relationship and found
that as many as 80 different types of FP measures
have been used. Firm size, return on assets (ROA),
return on equity, asset age, and return on sales are
the frequently used FP measures. Particularly, ROA
is consistently claimed to be an authentic measure of
FP (Berman et al., 1999; McGuire et al., 1988).
Unlike other accounting measures such as return on
equity or return on sales, ROA is not affected by the
differential degree of leverage present in firms. Be-
cause ROA is positively correlated with the stock
price, a higher ROA implies higher value creation
for shareholders. Moreover, in asset-heavy firms
such as the manufacturing firms, ROA is a better
indicator of firm performance.
Financial performance measures are lag indicators
and capture historical performance arising from
mostly tangible assets (Ong, 2003). They often fail to
properly record performance from intangible assets
such as customer relationships, employee satisfaction,
innovation, investment in research and development,
and the like that have become significant sources of
competitive advantage for firms in recent times (Lev,
2000). In contrast, NFP measures focus on a firm’s
long-term success factors such as research and
development, customer satisfaction, internal business
process efficiency, innovation, and employee satis-
faction, and capture performance improvements
from intangible assets (Kaplan and Norton, 2001).
Investments in intangible assets such as research and
development are expensed immediately instead of
getting capitalized in the traditional accounting sys-
tem. Such treatment of intangible assets depresses the
profit in the current year though benefits from such
investments accrue to the firm over a long period of
time. By accounting for such performance improve-
ments, NFP measures provide indirect indicators of
firm performance. Because of their focus on conse-
quences rather than causes of performance, NFP
measures are considered as ‘lead indicators’ (Ittner
and Larcker, 2000). FP measures are objective in
nature whereas NFP measures are subjective in nat-
ure that includes managers’ perception of firm per-
formance on market share, employee health and
safety, investment in research and development, and
others. Perceptual data on NFP from senior managers
correlate with hard data on FP from secondary
sources (Venkatraman and Ramanujam, 1987) sug-
gesting their complementarity. Hence, FP measures
along with NFP measures are used to assess firm
performance holistically (Govindarajan and Gupta,
1985; Ittner and Larcker, 1998).
CSR and firm performance
The relations between CSR and FP are mostly
inconclusive, but positive relations between the two
have been reported in most of the studies (Margolis
and Walsh, 2003) suggesting an instrumental orien-
tation of CSR initiatives. An instrumental orienta-
tion towards CSR suggests the alignment of the
social goal with the business goal where CSR is
considered as a strategic tool to promote the eco-
nomic objective of the firm. Managers foresee sig-
nificant value additions in firm performance due to
strengthened stakeholder relations. Management
theorists argue that by improving CSR towards
stakeholders, firm performance is augmented
(Waddock and Graves, 1997).
574 Supriti Mishra and Damodar Suar
The influence of stakeholder-oriented CSR on
firm performance can be understood with the help
of three theories: (a) consumer inference making, (b)
signaling theory, and (c) social identity theory.
‘Consumer inference making’ theory suggests that if
a consumer knows that the manufacturer of the
product is a responsible firm, s/he can infer posi-
tively about the product (Brown and Dacin, 1997).
Such inferences induce consumer goodwill (Brown
and Dacin, 1997; Handelman and Arnold, 1999) that
influences purchase intention (Gildea, 1994; Owen
and Scherer, 1993). ‘Signaling’ theory (Boulding and
Kirmani, 1993; Kirmani, 1997) suggests that in situ-
ations where there is information asymmetry
between buyers and sellers, consumers look for
information/signals that distinguish companies per-
forming well on attributes of interest compared to
companies performing poorly. Signals such as war-
ranties (Boulding and Kirmani, 1993) indicating
reliability and higher quality of products enable
consumers to decide between companies. Con-
sumers associate higher product quality with proac-
tive corporate citizenship (Maignan and Ferrell,
2001) and potential job-seekers value CSR record of
companies as a signal for organizational attractiveness
(Greening and Turban, 2000; Turban and Greening,
1997). ‘Social identity’ theory emphasizes that one’s
self-concept is influenced by membership in differ-
ent social organizations, including the company for
which an individual works (Ashforth and Mael,
1989; Dutton et al., 1994). Employees’ self-image is
influenced by the image and reputation of their
employers, consumers identify themselves with
organizations or brands involved in discretionary
citizenship (Aaker, 1994; Belk, 1988), and institu-
tional investors like to be associated with socially
responsible firms (Graves and Waddock, 1994; Teoh
and Shiu, 1990). Such bonds of identification
encourage positive evaluations of a firm’s products,
and reap value addition through customer loyalty,
advocacy, positive words-of-mouth, and resilience
to negative brand information (Hoeffler and Keller,
2002; Sen et al., 2006).
Alternatively, irresponsible behavior by firms
agitates stakeholders. They often react by boycotting
the company (Hayes and Pereira, 1990), reducing
consumption of the company’s products (Sen and
Bhattacharya, 2001), initiating legal action against
the company (Greeno and Robinson, 1992), and/or
spreading bad words-of-mouth about irresponsible
business practices (Clair et al., 1995). Boycotting of
Nike products due to human rights’ abuse and unsafe
working conditions at suppliers’ locations in Asia
(Herbert, 1996), or sharp reaction from environ-
mentalists and consumers to the pesticide content in
Pepsi and Coca-Cola beverages in India (Financial
Express, 2006) are few such instances. While
improved stakeholder relations have the potential to
improve a firm’s reputation and performance,
strained relations have the risk of adversely affecting
a firm’s performance. Hence, we propose:
H1: The favorable CSR towards stakeholders will
positively impact the firms’ FP and NFP.
Because we have considered CSR towards six
groups of stakeholders, let us examine the relation-
ship between CSR towards each stakeholder group
and firm performance.
CSR towards employees and firm performance
Proactive policies and practices towards employees
reflect a company’s intention to address the interests
of its employees and satisfy their needs. Policies and
practices towards union relations, employees’ par-
ticipation in decision making, remuneration policy,
working conditions, and elimination of forced/child
labor, portray a firm’s CSR towards employees. By
adhering to such standards, firms can satisfy employ-
ees, enhance their job performance, and improve FP
and NFP. The Energy Research Institute’s report
mentions that Indian stakeholders including work-
ers, company executives, and general public feel that
Indian companies should adhere to higher labor
standards and reduce human rights abuses at the
workplace (Kumar et al., 2001). Working conditions
that respect human dignity, equality, and social
protection result in a productive workplace (Som-
avia, 2000). Social responsibility of a company is a
reputation factor and is an attractive force for
potential and current employees (Turban and
Greening, 1997). Ethical reputation contributes to
job satisfaction and lower employee turnover by
evoking positive reactions from employees’ families
and friends (Riordan et al., 1997). Because satisfied
employees have higher morale and job motivation,
they will work more effectively and efficiently
(Berman et al., 1999) and contribute to higher levels
575CSR and Firm Performance
of organizational effectiveness (Koys, 2001). Past
studies establish that better human resource man-
agement practices such as training and development
of employees, their participation in problem solving,
progressive remuneration policies, and grievance
procedures reduce employee turnover, increases
their productivity and FP (Huselid, 1995; Youndt
et al., 1996). A better CSR towards employees
which includes wider issues compared to human
resource management issues also improves a firm’s
FP (Berman et al., 1999). Hence,
H1.1: The favorable CSR towards employees will
positively impact the firms’ FP and NFP.
CSR towards customers and firm performance
Positive customer perception about product quality
and safety leads to increased sales or decreased costs
associated with stakeholder relationships (Waddock
and Graves, 1997). Higher product safety and quality
improves the bottom line (Berman et al., 1999). In
product retailing, market reactions are found to
be negative for socially irresponsible companies
(Bromiley and Marcus, 1989; Davidson and Worell,
1988). When customers are dissatisfied with a
product or its associated services, investors appre-
hend that negative customer reactions in the form of
decreased patronage, lawsuits, or both, will directly
affect the bottom line (Berman et al., 1999). Event
studies establish that market value of a company
decreases when corporate irresponsibility and illegal
behavior is observed (Frooman, 1997). The news of
pesticide content in Pepsi and Coca-Cola beverages
in India reduced the sales of both companies by 60%
(Financial Express, 2006). Continuous deterioration
in quality directly affects firm performance (Landon
and Smith, 1997). Hence, companies need to be
careful about factors such as ethical advertising
standards, customer health and safety during product
use, company-wide quality programs for providing
better products at right prices and the like. Company
policies and practices to address such issues give a
positive signal about a company’s responsible atti-
tude towards its customers and can improve firm
performance. Hence,
H1.2: The favorable CSR towards customers will
positively impact the firms’ FP and NFP.
CSR towards investors and firm performance
Firms can strengthen their investor relations by
adopting proper governance standards. After the
corporate governance debacles in 1990s such as that
of Enron in the US, the stock market crisis in India,
and falling corporate governance standards across
the globe, a lot of importance is being given to
governance codes and laws for protecting the
interests of shareholders and investors. These codes
stress the need for transparency in financial and
non-financial disclosures, adoption of internation-
ally compatible accounting standards, appropriate
board processes and information systems, and
compliance with legal and regulatory requirements.
CSR towards investors examine firm policies and
practices towards such issues including shareholders’
participation in decision making, auditors’ inde-
pendence, and policies towards insider trading.
Evidence suggests that adoption of better corporate
governance standards increases firm performance.
Investors show willingness to pay a premium for the
stocks of well-governed companies compared to
poor-governed companies (Coombes and Watson,
2000). Companies with the highest rankings in
good governance practices also have the highest FP
(Business Week, 2002). Positive relations are found
between corporate governance and stock price
performance and financial ratios in emerging mar-
kets (CLSA, 2000). Companies ranked in the top
quarter of corporate governance yield a better
average return on capital employed compared to
companies ranked in the bottom half (CLSA, 2000).
Companies that comply with the Cadbury Com-
mittee recommendations in the UK experience
better performance as compared to the non-
complying firms (Dahya and McConnell, 2007).
Past research on the influence of corporate gover-
nance indicators such as board size on firm per-
formance has yielded both positive (Dalton et al.,
1998) and negative outcomes (Alshimmiri, 2004).
However, in the Indian context, studies suggest that
properly designed mandatory corporate governance
reforms increase share prices (Black and Khanna,
2007). Market value of Indian companies such as
Infosys that follows stricter governance and disclo-
sure standards increased as high as 2000 times while
that of poor governed firms declined as low as 95%
during 1995–2000 (Nemkumar, 2000). Hence,
576 Supriti Mishra and Damodar Suar
H1.3: The favorable CSR towards investors will
positively impact the firms’ FP and NFP.
CSR towards community and firm performance
Typical involvement of business with the commu-
nity is seen in areas of education, health, and income
generation. CSR towards community is seen in
terms of philanthropic giving, public–private part-
nerships, community relationships, and participation
in social and economic development issues. Of late,
companies are pursuing meaningful partnerships
with non-governmental organizations (NGOs) to
empower the local community. Endeavors by Indian
companies such as Kishan Kendras1 by Tata group,
e-Choupals and KisanIndia.com by ITC, Shubh Labh2
services by Mahindra, and Kisan Kendra by Ralli
empower rural Indian farmers (Singh and Bhagat,
2004). Initiatives by MNCs such as Microsoft’s
partnership with an NGO, Pratham, to promote
quality primary education in rural India (Brugmann
and Prahalad, 2007) or Hewlett Packard’s living lab
experiment with women self-help groups in rural
Andhra Pradesh (India) to provide them sustainable
livelihoods (Dunn and Yamashita, 2003) are few
more examples. When firms focus their social
actions on communities in and around their area of
operation, they reap the benefits of a socially
responsible image among their employees and the
local community (Husted, 2003). Partnership of Life
Insurance Corporation of India with micro-credit
federations in the rural Andhra Pradesh, besides
improving its penetration of the rural market and
expanding the customer base, has also increased its
gross margin by 27% (Brugmann and Prahalad,
2007). Indian Market Research Bureau finds that
after Hindustan Lever Limited, a fast moving con-
sumer goods company, launched an initiative called
‘Project Shakti’ for creating livelihood of rural
women in India, the consumption of its products
increased in the range 15–20% (Sood and Arora,
2006). Though past evidence suggests a negative
relation between CSR towards the community and
firm performance (Berman et al., 1999), it is also
observed that investments in community develop-
ment activities help a firm to obtain competitive
advantages through tax savings, decreased regulatory
burden, and improvements in the quality of local
labor (Waddock and Graves, 1997). Hence,
H1.4: The favorable CSR towards community will
positively impact the firms’ FP and NFP.
CSR towards environment and firm performance
Recent years have seen mounting global pressure for
enactment and adoption of stricter legislations per-
taining to environment protection in and around the
globe. Companies are taking proactive initiatives for
emission reduction in anticipation of future policy,
and societal and competitive developments with
respect to environment. With increasing importance
of environmental friendly products, processes, and
services, firms are realizing the importance of adopt-
ing environmental standards for their sustainability in
the long run. This has facilitated development of
green resources and capabilities and compliance with
international standards such as ISO 14000, OHSAS
18000, and environmental legislations. Environ-
mental performance is enhanced by improvements in
three aspects – (a) product technologies such as use of
recycled raw materials and other resource saving
programs, (b) process technologies such as use of
efficient production systems and end-of-pipe con-
trols, and (c) management systems such as workers’
training programs and environmental audit. Global
standards on CSR towards environment endorse
these aspects. Research on environmental proactivity
has not been conclusive (Christman, 2000). But
studies link environmental commitment with en-
hanced profitability, particularly in high growth
industries (Russo and Fouts, 1997). Evidence suggests
proactive environment management enhances firm’s
market value (Klassen and Mc Laughlin, 1996), rep-
utation, and FP (Alvarez et al., 2001; Miles and Co-
vin, 2000). The impact of firms’ proactive
environmental practices on market share, profitabil-
ity, and return on investment is better in environ-
mentally conscious companies compared to not-so-
conscious companies (Ahmed et al., 1998). Hence,
H1.5: The favorable CSR towards environment will
positively impact the firms’ FP and NFP.
CSR towards suppliers and firm performance
Influence of suppliers has become crucial in recent
years as companies have started focusing more
on their core competencies, outsourcing other
577CSR and Firm Performance
functions to suppliers (Prahalad and Hamel, 1990).
Recent years have seen growing importance of
suppliers’ issues such as health and safety, environ-
mental impact, community involvement, and the
payment of living wages to employees at both out-
sourced plant locations and home locations of sup-
pliers. Standards on CSR towards suppliers
incorporate such issues besides including issues such
as ethical procurement of raw materials by suppliers,
and elimination of child labor and human rights’
violation at suppliers’ locations. By ensuring adher-
ence of CSR standards by suppliers, a firm sends
strong signals about its commitment towards CSR,
which improves its image and performance. Viola-
tion of CSR standards by suppliers adversely affects a
firm’s performance. Banning of Indian carpet-mak-
ing firms by international buyers for their use of
child labor in carpet making is a case in point.
International buyers prefer Rugmark certification
which ensures that a firm has not used child labor.
Such preferences improve firm performance. Hence,
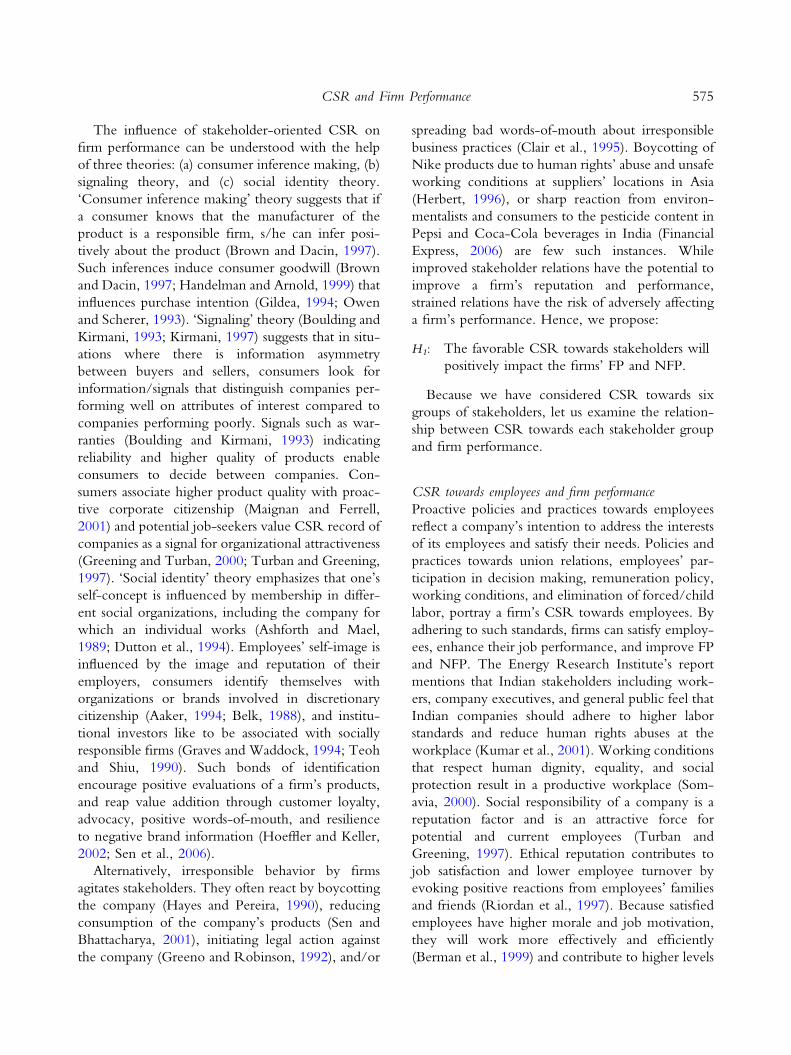
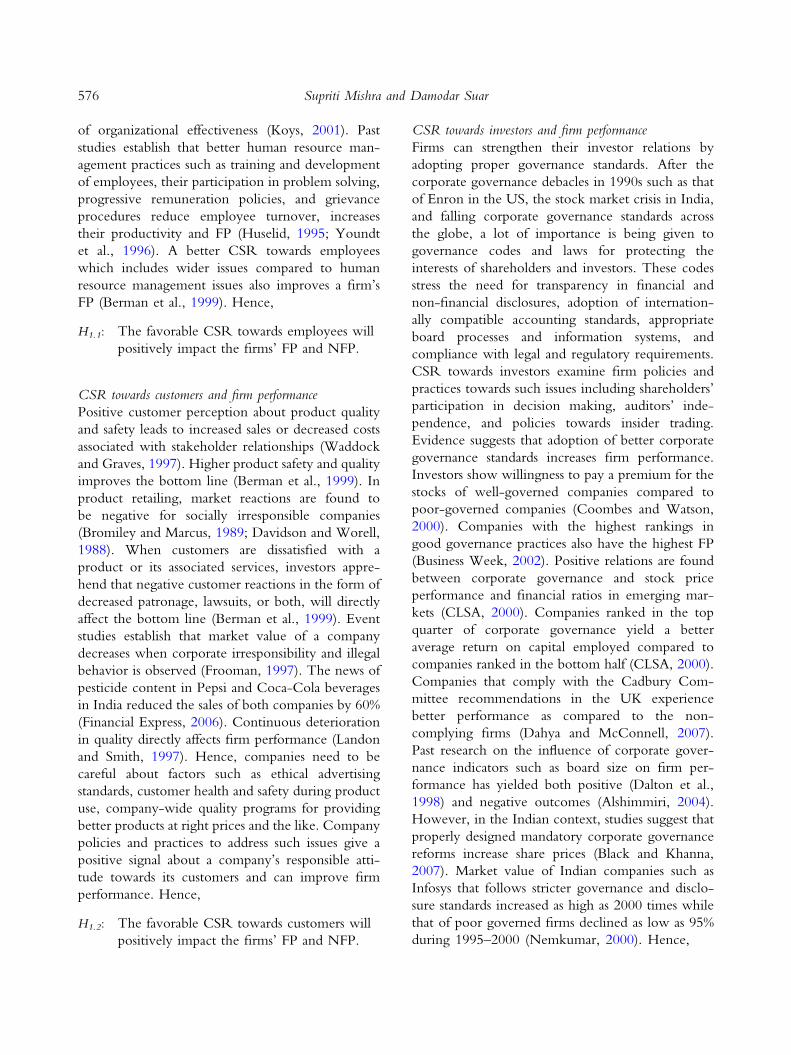
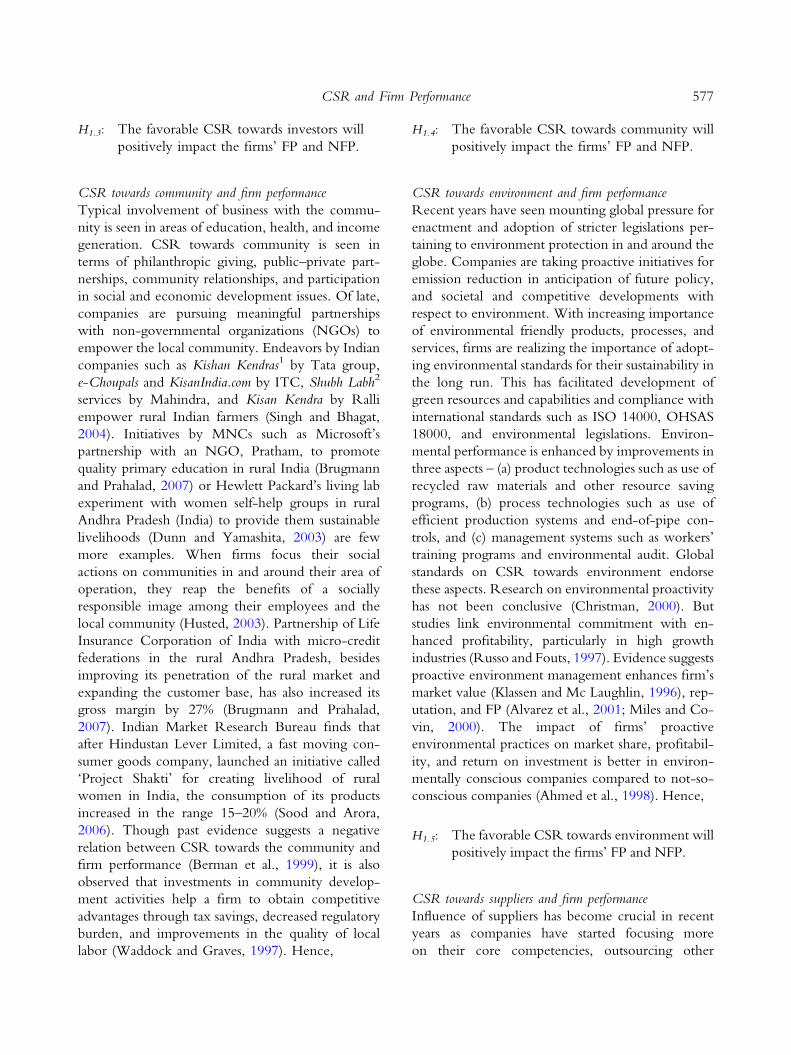
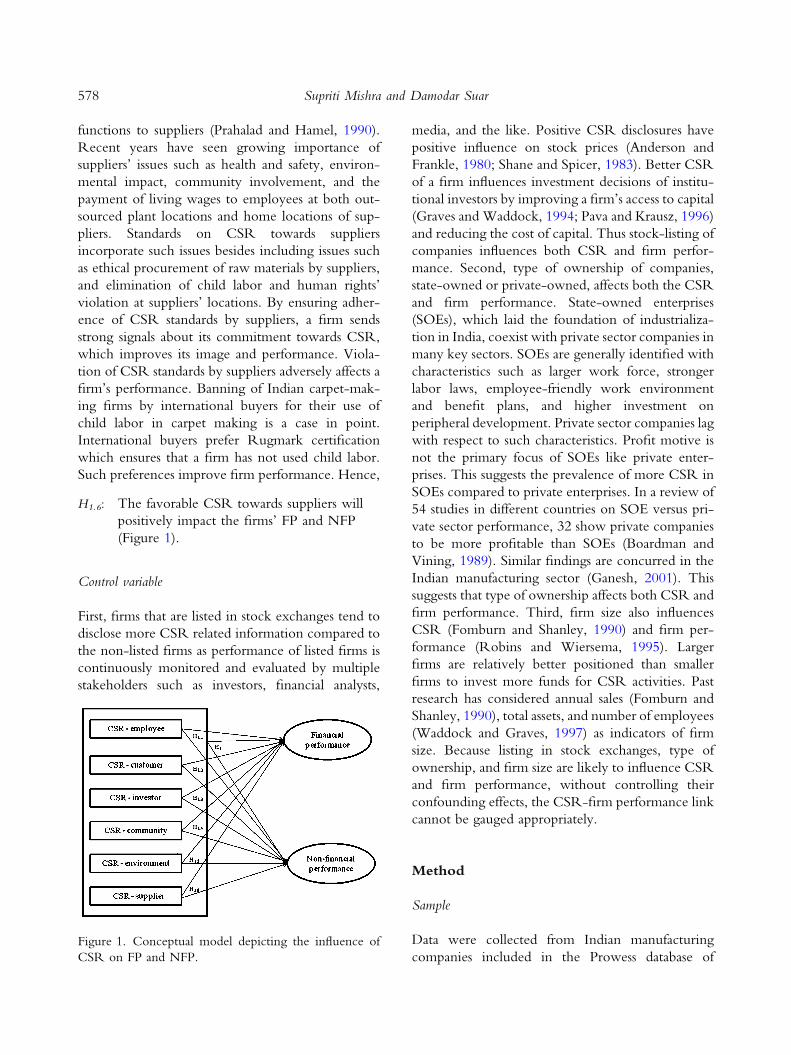
H1.6: The favorable CSR towards suppliers will
positively impact the firms’ FP and NFP
(Figure 1).
Control variable
First, firms that are listed in stock exchanges tend to
disclose more CSR related information compared to
the non-listed firms as performance of listed firms is
continuously monitored and evaluated by multiple
stakeholders such as investors, financial analysts,
media, and the like. Positive CSR disclosures have
positive influence on stock prices (Anderson and
Frankle, 1980; Shane and Spicer, 1983). Better CSR
of a firm influences investment decisions of institu-
tional investors by improving a firm’s access to capital
(Graves and Waddock, 1994; Pava and Krausz, 1996)
and reducing the cost of capital. Thus stock-listing of
companies influences both CSR and firm perfor-
mance. Second, type of ownership of companies,
state-owned or private-owned, affects both the CSR
and firm performance. State-owned enterprises
(SOEs), which laid the foundation of industrializa-
tion in India, coexist with private sector companies in
many key sectors. SOEs are generally identified with
characteristics such as larger work force, stronger
labor laws, employee-friendly work environment
and benefit plans, and higher investment on
peripheral development. Private sector companies lag
with respect to such characteristics. Profit motive is
not the primary focus of SOEs like private enter-
prises. This suggests the prevalence of more CSR in
SOEs compared to private enterprises. In a review of
54 studies in different countries on SOE versus pri-
vate sector performance, 32 show private companies
to be more profitable than SOEs (Boardman and
Vining, 1989). Similar findings are concurred in the
Indian manufacturing sector (Ganesh, 2001). This
suggests that type of ownership affects both CSR and
firm performance. Third, firm size also influences
CSR (Fomburn and Shanley, 1990) and firm per-
formance (Robins and Wiersema, 1995). Larger
firms are relatively better positioned than smaller
firms to invest more funds for CSR activities. Past
research has considered annual sales (Fomburn and
Shanley, 1990), total assets, and number of employees
(Waddock and Graves, 1997) as indicators of firm
size. Because listing in stock exchanges, type of
ownership, and firm size are likely to influence CSR
and firm performance, without controlling their
confounding effects, the CSR-firm performance link
cannot be gauged appropriately.
Method
Sample
Data were collected from Indian manufacturing
companies included in the Prowess database ofFigure 1. Conceptual model depicting the influence of
CSR on FP and NFP.
578 Supriti Mishra and Damodar Suar
CMIE, the largest database of Indian companies.
Three criteria were set for inclusion of companies in
the sample: (a) minimum capital investment of
250 million (Indian rupees), (b) a minimum number
of 100 employees in the firm, and (c) a minimum of
5 years of manufacturing operation. Such criteria
excluded small firms and start-up units from the
sample. As per the Prowess database (Prowess,
2005), there are 2932 manufacturing companies in
India with a minimum capital investment of 250
million (Indian rupees). Out of these, 85 companies
are SOEs and the rest are private sector enterprises.
Fifteen hundred companies (51% of the total num-
ber of companies in Prowess) were randomly
selected from the database representing 18 categories
of manufacturing industries. Out of the selected
companies, 150 companies responded to the ques-
tionnaire survey and the response rate was 10%. Out
of the 150 respondent companies, 31 were SOEs and
119 were private sector enterprises, and 101 were
listed in Indian stock exchanges (Bombay Stock
Exchange and National Stock Exchange), and 49
were not listed in any stock exchange. As CSR
decisions are mainly taken by the top management in
firms, CEOs and in their absence senior executives
such as vice-presidents, directors, senior general
managers, or general managers participated in the
survey. Data were collected from industrial belts of
eight major cities situated in six states out of 35 states
and union territories representing India.
A web-enabled version of the questionnaire was
developed and sent through e-mail to 900 companies
which had e-mail ids. After three reminders over a
period of 2 months, only 23 (2.5%) CEOs returned
the filled-in questionnaires through e-mail. Ques-
tionnaires were sent to another 600 companies
by post which did not have any e-mail id. Though
return envelopes along with postage were attached
with the questionnaire, only 10 companies returned
the filled-in questionnaires within a period of
4 months. Finally, out of the non-responding com-
panies, 400 companies were directly contacted by the
researcher at their corporate head offices in the north,
south, and east zones of India. Prior communication
was made to companies through e-mail or telephone,
and appointments were fixed with the top executives.
In the first meeting with the senior executives, the
researcher left the questionnaire with them after
explaining the objective of the survey. Because the
questionnaire covered a wide range of issues con-
cerning different departments such as the human
resource department (employees), marketing depart-
ment (customers), purchase department (suppliers),
and the like, the executives took time to fill up the
data in consultation with the concerned departments.
After a period of 2 weeks, respondents were con-
tacted to return the filled-in questionnaires. From the
400 companies, filled-in questionnaires were pro-
cured from 117 companies. All in all, 150 (23 + 10 +
117) questionnaires were obtained.
Demographic details of executives were collected
as part of the questionnaire survey. Data on age,
years of service, education, and monthly salary of
CEOs and top-level executives (M age = 49.53,
SD = 7.13; M years of service = 13.79, SD =
10.19; M years of formal study = 18.74, SD = 2.22)
were obtained through questionnaire surveys.
Among the respondents, 92% had at least one pro-
fessional qualification like engineering or manage-
ment degree. Average monthly gross salary of
respondents in various industries varied from as low
as 35,000 (Indian rupees) to as high as 1,257,261
(Indian rupees). Respondents were male members in
146 of the 150 firms indicating the low representa-
tion of women in the top management. The sam-
ple companies had a minimum number of 105
employees and a maximum number of 446,721
employees. The public sector companies had aver-
age employee strength of 22,026 within a range
265–446,721. The average employee strength in
private sector companies was 2227 within a range
105–40,000. The average employee strength in the
18 categories of industries was within a range 270–
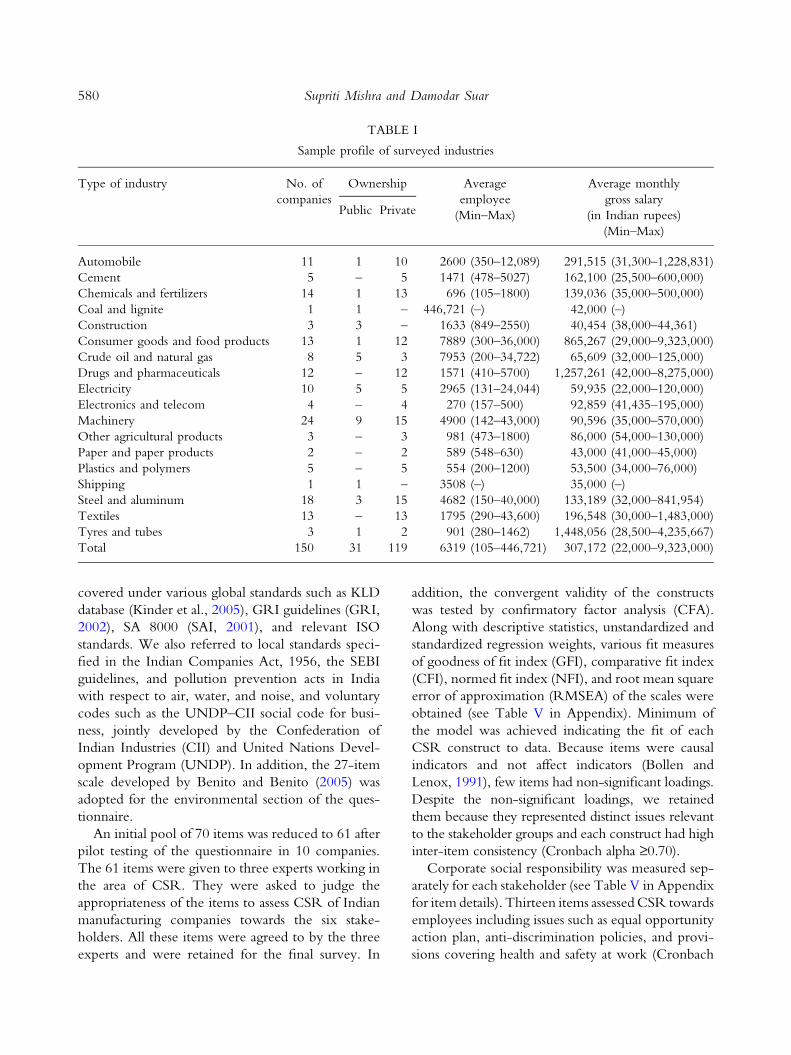
7953. The sample profile of the 18 categories of
industries is summarized in Table I.
Measures
Besides socio-demographic variables of the respon-
dents, data on CSR towards different stakeholders
along with NFP were procured through question-
naire. Respondents were assured complete ano-
nymity of their responses.
CSR
Items for assessing CSR towards six stakeholder
groups were developed after examining the issues
579CSR and Firm Performance
covered under various global standards such as KLD
database (Kinder et al., 2005), GRI guidelines (GRI,
2002), SA 8000 (SAI, 2001), and relevant ISO
standards. We also referred to local standards speci-
fied in the Indian Companies Act, 1956, the SEBI
guidelines, and pollution prevention acts in India
with respect to air, water, and noise, and voluntary
codes such as the UNDP–CII social code for busi-
ness, jointly developed by the Confederation of
Indian Industries (CII) and United Nations Devel-
opment Program (UNDP). In addition, the 27-item
scale developed by Benito and Benito (2005) was
adopted for the environmental section of the ques-
tionnaire.
An initial pool of 70 items was reduced to 61 after
pilot testing of the questionnaire in 10 companies.
The 61 items were given to three experts working in
the area of CSR. They were asked to judge the
appropriateness of the items to assess CSR of Indian
manufacturing companies towards the six stake-
holders. All these items were agreed to by the three
experts and were retained for the final survey. In
addition, the convergent validity of the constructs
was tested by confirmatory factor analysis (CFA).
Along with descriptive statistics, unstandardized and
standardized regression weights, various fit measures
of goodness of fit index (GFI), comparative fit index
(CFI), normed fit index (NFI), and root mean square
error of approximation (RMSEA) of the scales were
obtained (see Table V in Appendix). Minimum of
the model was achieved indicating the fit of each
CSR construct to data. Because items were causal
indicators and not affect indicators (Bollen and
Lenox, 1991), few items had non-significant loadings.
Despite the non-significant loadings, we retained
them because they represented distinct issues relevant
to the stakeholder groups and each construct had high
inter-item consistency (Cronbach alpha ‡0.70).
Corporate social responsibility was measured sep-
arately for each stakeholder (see Table V in Appendix
for item details). Thirteen items assessed CSR towards
employees including issues such as equal opportunity
action plan, anti-discrimination policies, and provi-
sions covering health and safety at work (Cronbach
TABLE I
Sample profile of surveyed industries
Type of industry No. of
companies
Ownership Average
employee
(Min–Max)
Average monthly
gross salary
(in Indian rupees)
(Min–Max)
Public Private
Automobile 11 1 10 2600 (350–12,089) 291,515 (31,300–1,228,831)
Cement 5 – 5 1471 (478–5027) 162,100 (25,500–600,000)
Chemicals and fertilizers 14 1 13 696 (105–1800) 139,036 (35,000–500,000)
Coal and lignite 1 1 – 446,721 (–) 42,000 (–)
Construction 3 3 – 1633 (849–2550) 40,454 (38,000–44,361)
Consumer goods and food products 13 1 12 7889 (300–36,000) 865,267 (29,000–9,323,000)
Crude oil and natural gas 8 5 3 7953 (200–34,722) 65,609 (32,000–125,000)
Drugs and pharmaceuticals 12 – 12 1571 (410–5700) 1,257,261 (42,000–8,275,000)
Electricity 10 5 5 2965 (131–24,044) 59,935 (22,000–120,000)
Electronics and telecom 4 – 4 270 (157–500) 92,859 (41,435–195,000)
Machinery 24 9 15 4900 (142–43,000) 90,596 (35,000–570,000)
Other agricultural products 3 – 3 981 (473–1800) 86,000 (54,000–130,000)
Paper and paper products 2 – 2 589 (548–630) 43,000 (41,000–45,000)
Plastics and polymers 5 – 5 554 (200–1200) 53,500 (34,000–76,000)
Shipping 1 1 – 3508 (–) 35,000 (–)
Steel and aluminum 18 3 15 4682 (150–40,000) 133,189 (32,000–841,954)
Textiles 13 – 13 1795 (290–43,600) 196,548 (30,000–1,483,000)
Tyres and tubes 3 1 2 901 (280–1462) 1,448,056 (28,500–4,235,667)
Total 150 31 119 6319 (105–446,721) 307,172 (22,000–9,323,000)
580 Supriti Mishra and Damodar Suar
alpha = 0.74). Seven items examined CSR towards
customers covering issues such as commitment to
provide quality products and services, pricing prod-
ucts as per quality, and voluntary codes for advertising
(Cronbach alpha = 0.70). Seven items evaluated
CSR towards investors including issues such as
investor grievance handling policies, rules to
strengthen auditor’s independence, and policies
towards prohibiting insider trading (Cronbach
alpha = 0.72). CSR towards community was evalu-
ated with 12 items comprising issues such as
supporting third party social and sustainable devel-
opment initiatives, and community partnerships
(Cronbach alpha = 0.78). Issues such as systems for
measuring environmental performance, end-of-pipe
controls, and environmental training for managers
were included in the 17 items assessing CSR towards
natural environment (Cronbach alpha = 0.91). CSR
towards suppliers was evaluated on five items
(Cronbach alpha = 0.76) including issues such as
safety and environmental aspects, and policies on the
restrictions of sweat shop/human rights’ violation at
suppliers’ locations. Each respondent was asked to
endorse the degree of compliance of the firm with
respect to the issues mentioned in the questionnaire.
Response descriptions against each item were given
on a five-point scale – ’it is not in the company code’
(=1), ‘it is in the company code but not implemented’
(=2), ‘it is in the company code but partially imple-
mented’ (=3), ‘it is in the company code and sub-
stantially implemented’ (=4), and ‘it is in the company
code and fully implemented’ (=5). The summative
score on all items of CSR towards a particular
stakeholder group was divided by the number of
items to keep that value within the range of the scale.
Aggregation of CSR in the past research has been
done by (a) adding various dimensions (Moore,
2001), and (b) assigning weights to the various
dimensions on the basis of expert panel ratings
(Waddock and Graves, 1997). In order to assess
whether all the dimensions of CSR could be added
to one aggregate variable, CFA was carried out on
the scores of six dimensions of CSR. The relative
chi-square value (v2/df = 3.54) of the one-factor
model was not below the recommended cut-off
criterion of 3. However, the other fit measures –
GFI (=0.92), CFI (=0.96), and NFI (=0.94) – were
above the recommended cut-off criterion of 0.90
(Bollen, 1989) suggesting the fit of the model.
Moreover, the response descriptions against each
item of CSR measures were on a uniform five-point
scale. Therefore, the scores on six segregated mea-
sures of CSR were averaged to specify the aggregate
CSR. The inter-item alpha reliability of all the 61
items was high (Cronbach alpha = 0.88).
Firm performance
FP. In order to control industry influences, FP was
assessed using industry-adjusted ROA. Industry-
adjusted ROA was obtained by subtracting average
industry ROA of each industry category from the
ROA of each firm in the corresponding industry
category (Agle et al., 1999; Fowler and Schmidt,
1988). Data on ROA for each of 150 firms and each
of 18 categories of industries were collected from the
CMIE-Prowess database for 3 years from 2003–
2004 to 2005–2006. ROA of companies, whose data
were not available in the database, was calculated
from the balance sheets of companies available in
annual reports for the above 3 years as the ratio of
operating income to total assets [ROA = {Net
operating income 9 (1 - tax rate)}/Average operat-
ing assets] (Copeland et al., 2000). A 3-year average
of firm-level and industry-level ROAs was obtained
to eliminate possible biases that may result from a
single-year figure.
NFP. A 12-item scale developed by Govindarajan
(1984) and modified by Hoque (2004) was considered
to assess the NFP. The 12 items in the modified ver-
sion are: (1) sales growth rate, (2) market share, (3)
operating profits, (4) workplace relations, (5) cash
flow from operations, (6) return on investment, (7)
new product development, (8) market development,
(9) research and development, (10) cost reduction
programs, (11) personnel development, and (12)
employee health and safety. Senior managers were
requested to indicate the relative position of their
companies with respect to the industry average on
each item. Response descriptions against each item
were given on a five-point scale – ‘well below average’
(=1), ‘below average’ (=2), ‘average’ (=3), ‘above
average’ (=4), ‘well above average’ (=5). NFP on all
items were obtained for 3 years from 2003–2004 to
2005–2006. The annual average value of NFP
[(NFP2003–2004 + NFP2004–2005 + NFP2005–2006)/3]
for each of the 12 items was calculated. On such
average, items had high inter-item consistency
581CSR and Firm Performance
(Cronbach alpha = 0.89). The annual average value
of NFP on 12 items was further averaged by dividing it
with the number of items to keep the value within the
range of the scale. High average score indexed high
NFP.
Control variable
Listing in stock exchanges, type of ownership, and
firm size were the control variables. Data on stock-
listing status, ownership type, and annual sales were
obtained from the CMIE-Prowess database. Data on
number of employees were obtained from the
respondents. Stock-listing status and ownership type
were coded as dummy variables (non-listed = 0,
listed = 1; public = 0, private = 1). Two indicators
of firm size were considered for the study, (a) number
of employees (as on 31 March, 2006) and (b) average
sales (average of 3 years’ net sales from 2003–2004 to
2005–2006), which were continuous variables. From
the data of annual sales for 3 years, the average annual
sales figure was considered for analysis.
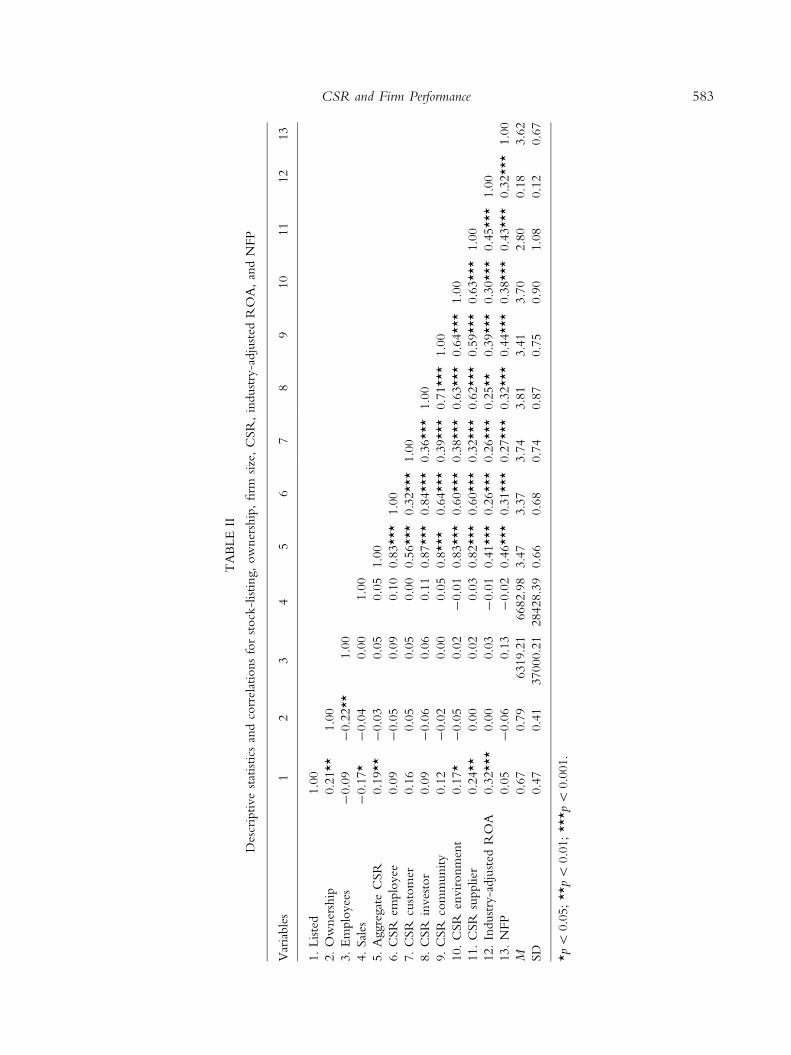
Results
Descriptive statistics and Pearson correlation among
the studied variables are presented (Table II). Posi-
tive correlations were found between stock-listing
status and aggregate CSR indicating that listed
companies showed a higher CSR. Positive correla-
tions between stock-listing status and FP implied
that listed companies performed better than non-
listed companies. However, stock-listing status did
not relate to NFP. Similarly, the other two control
variables, type of ownership, and the firm size did
not relate to FP and NFP. Correlation results
showed that FP and NFP of the companies were
related indicating a higher FP also implied a higher
NFP. The correlation between CSR and firm per-
formance indicated that a more favorable aggregate
CSR towards all the six stakeholders – employees,
customers, investors, community, environment, and
suppliers – resulted in a higher industry-adjusted
ROA and NFP of the firms. A favorable CSR
towards each of the six stakeholders also enhanced
the FP and NFP of firms.
The correlation between two variables incorpo-
rates bidirectional relations that are unreserved in
regression analysis. To examine the influence of
control variables, aggregate CSR, and segregate
CSR on FP and NFP of firms, hierarchical regres-
sion analyses were carried out.
In the regression analysis for FP, three control
variables were entered in the first step (Table III). In
congruence with the correlation results, of the three
control variables, only stock-listing status of com-
panies positively influenced FP suggesting that the
listed firms were financially better of than the non-
listed firms. In the second step of the regression
analysis, partialing out the influence of control
variables, an increase in aggregate and segregate
CSR enhanced the FP of firms.
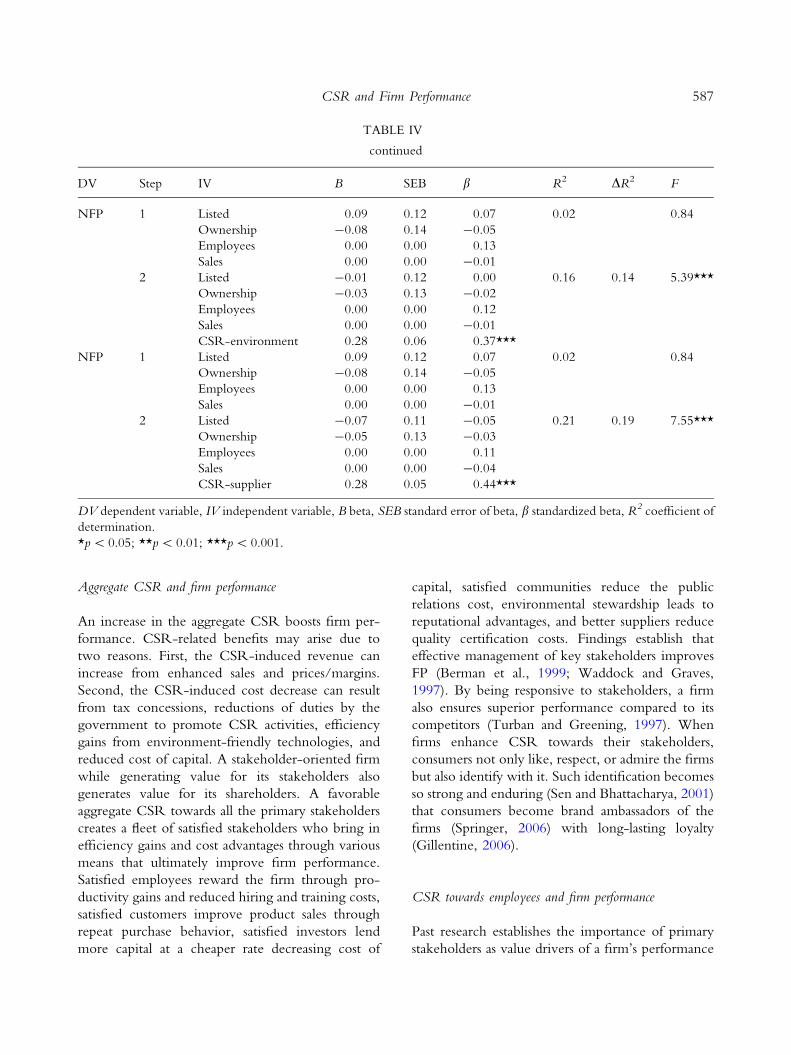
In the hierarchical regression analysis for NFP,
similar to the results of correlation analysis, none of
the control variables influenced NFP in the first step
(Table IV). But in the second step of the regression
analysis, both aggregate and segregate CSR posi-
tively influenced the NFP.
Results supported the main hypothesis (H1) and
its components (H1.1–H1.6). Both aggregate and
segregate CSR predicting FP and NFP were sig-
nificant suggesting that the socially responsible
business yielded higher performance of manufac-
turing firms.
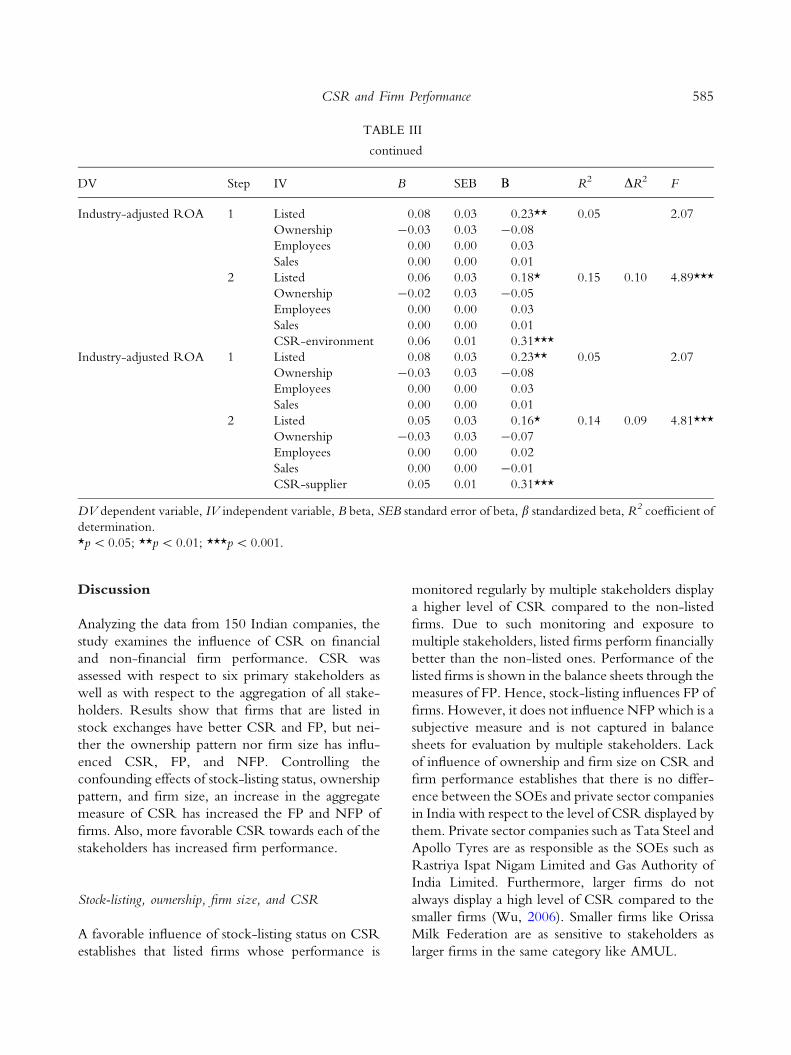
Controlling the confounding effects, aggregate
CSR predicted 12% variance of industry-adjusted
ROA (Table III) and 20% variance of NFP
(Table IV). The segregate measures of CSR, incor-
porating the CSR towards six stakeholder groups,
explained from as low as 3% to as high as 14% var-
iance of the industry-adjusted ROA and from as low
as 7% to as high as 19% variance of NFP. First, such
findings suggested that listed firms had better CSR
and FP than non-listed ones. Second, controlling the
confounding effects, both the aggregate and segre-
gate measures of CSR predicted FP and NFP of
firms but CSR influenced the NFP of firms more
potently compared to FP of firms. Third, the non-
explained variance of FP and NFP suggested that
there were other potent explanatory variables be-
yond the aggregate and segregate measures of CSR
and the relations between the explanatory variables
and the criterion were not linearly robust.
582 Supriti Mishra and Damodar Suar
TA
BLE
II
Des
crip
tive
stat
istics
and
corr
elat
ions
for
stock
-listing,
ow
ner
ship
,firm
size
,C
SR
,in
dust
ry-a
dju
sted
RO
A,
and
NFP
Var
iable
s1
23
45
67
89
10
11
12
13
1.
Liste
d1.0
0
2.
Ow
ner
ship
0.2
1**
1.0
0
3.
Em
plo
yee
s-
0.0
9-
0.2
2**
1.0
0
4.
Sal
es-
0.1
7*
-0.0
40.0
01.0
0
5.
Aggre
gat
eC
SR
0.1
9**
-0.0
30.0
50.0
51.0
0
6.
CSR
emplo
yee
0.0
9-
0.0
50.0
90.1
00.8
3***
1.0
0
7.
CSR
cust
om
er0.1
60.0
50.0
50.0
00.5
6***
0.3
2***
1.0
0
8.
CSR
inves
tor
0.0
9-
0.0
60.0
60.1
10.8
7***
0.8
4***
0.3
6***
1.0
0
9.
CSR
com
munity
0.1
2-
0.0
20.0
00.0
50.8
***
0.6
4***
0.3
9***
0.7
1***
1.0
0
10.
CSR
envir
onm
ent
0.1
7*
-0.0
50.0
2-
0.0
10.8
3***
0.6
0***
0.3
8***
0.6
3***
0.6
4***
1.0
0
11.
CSR
supplier
0.2
4**
0.0
00.0
20.0
30.8
2***
0.6
0***
0.3
2***
0.6
2***
0.5
9***
0.6
3***
1.0
0
12.
Indust
ry-a
dju
sted
RO
A0.3
2***
0.0
00.0
3-
0.0
10.4
1***
0.2
6***
0.2
6***
0.2
5**
0.3
9***
0.3
0***
0.4
5***
1.0
0
13.
NFP
0.0
5-
0.0
60.1
3-
0.0
20.4
6***
0.3
1***
0.2
7***
0.3
2***
0.4
4***
0.3
8***
0.4
3***
0.3
2***
1.0
0
M0.6
70.7
96319.2
16682.9
83.4
73.3
73.7
43.8
13.4
13.7
02.8
00.1
83.6
2
SD
0.4
70.4
137000.2
128428.3
90.6
60.6
80.7
40.8
70.7
50.9
01.0
80.1
20.6
7
*p
<0.0
5;
**p
<0.0
1;
***p
<0.0
01.
583CSR and Firm Performance
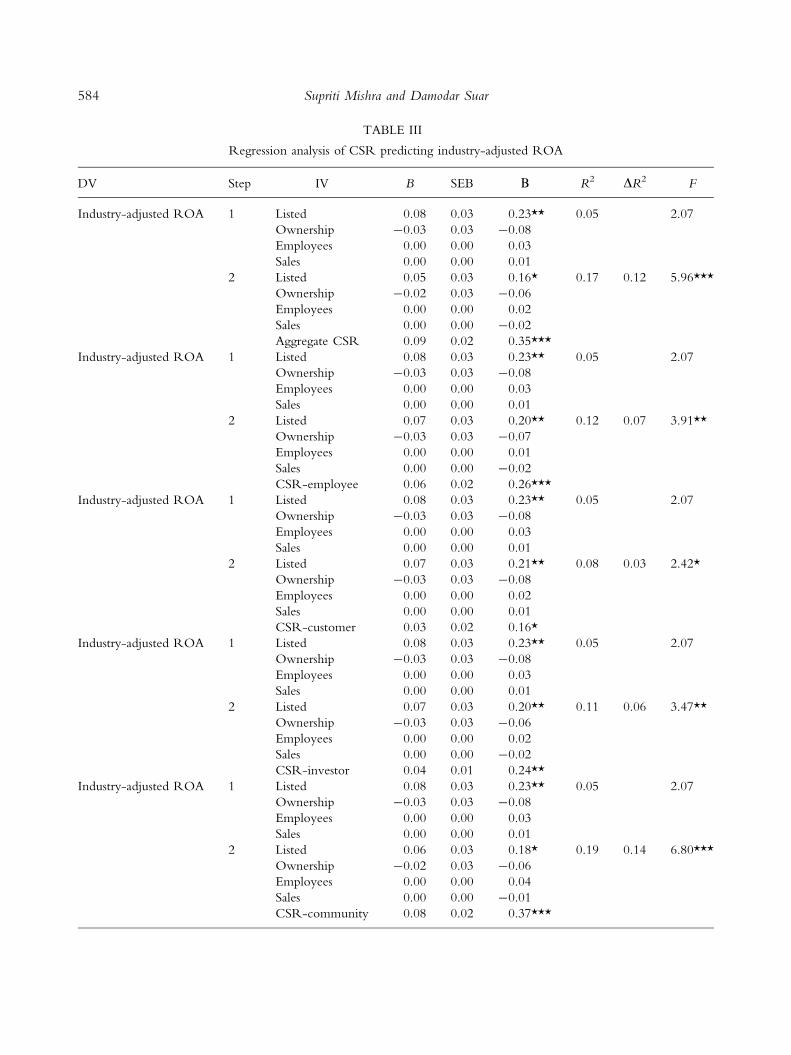
TABLE III
Regression analysis of CSR predicting industry-adjusted ROA
DV Step IV B SEB B R2 DR2 F
Industry-adjusted ROA 1 Listed 0.08 0.03 0.23** 0.05 2.07
Ownership -0.03 0.03 -0.08
Employees 0.00 0.00 0.03
Sales 0.00 0.00 0.01
2 Listed 0.05 0.03 0.16* 0.17 0.12 5.96***
Ownership -0.02 0.03 -0.06
Employees 0.00 0.00 0.02
Sales 0.00 0.00 -0.02
Aggregate CSR 0.09 0.02 0.35***
Industry-adjusted ROA 1 Listed 0.08 0.03 0.23** 0.05 2.07
Ownership -0.03 0.03 -0.08
Employees 0.00 0.00 0.03
Sales 0.00 0.00 0.01
2 Listed 0.07 0.03 0.20** 0.12 0.07 3.91**
Ownership -0.03 0.03 -0.07
Employees 0.00 0.00 0.01
Sales 0.00 0.00 -0.02
CSR-employee 0.06 0.02 0.26***
Industry-adjusted ROA 1 Listed 0.08 0.03 0.23** 0.05 2.07
Ownership -0.03 0.03 -0.08
Employees 0.00 0.00 0.03
Sales 0.00 0.00 0.01
2 Listed 0.07 0.03 0.21** 0.08 0.03 2.42*
Ownership -0.03 0.03 -0.08
Employees 0.00 0.00 0.02
Sales 0.00 0.00 0.01
CSR-customer 0.03 0.02 0.16*
Industry-adjusted ROA 1 Listed 0.08 0.03 0.23** 0.05 2.07
Ownership -0.03 0.03 -0.08
Employees 0.00 0.00 0.03
Sales 0.00 0.00 0.01
2 Listed 0.07 0.03 0.20** 0.11 0.06 3.47**
Ownership -0.03 0.03 -0.06
Employees 0.00 0.00 0.02
Sales 0.00 0.00 -0.02
CSR-investor 0.04 0.01 0.24**
Industry-adjusted ROA 1 Listed 0.08 0.03 0.23** 0.05 2.07
Ownership -0.03 0.03 -0.08
Employees 0.00 0.00 0.03
Sales 0.00 0.00 0.01
2 Listed 0.06 0.03 0.18* 0.19 0.14 6.80***
Ownership -0.02 0.03 -0.06
Employees 0.00 0.00 0.04
Sales 0.00 0.00 -0.01
CSR-community 0.08 0.02 0.37***
584 Supriti Mishra and Damodar Suar
Discussion
Analyzing the data from 150 Indian companies, the
study examines the influence of CSR on financial
and non-financial firm performance. CSR was
assessed with respect to six primary stakeholders as
well as with respect to the aggregation of all stake-
holders. Results show that firms that are listed in
stock exchanges have better CSR and FP, but nei-
ther the ownership pattern nor firm size has influ-
enced CSR, FP, and NFP. Controlling the
confounding effects of stock-listing status, ownership
pattern, and firm size, an increase in the aggregate
measure of CSR has increased the FP and NFP of
firms. Also, more favorable CSR towards each of the
stakeholders has increased firm performance.
Stock-listing, ownership, firm size, and CSR
A favorable influence of stock-listing status on CSR
establishes that listed firms whose performance is
monitored regularly by multiple stakeholders display
a higher level of CSR compared to the non-listed
firms. Due to such monitoring and exposure to
multiple stakeholders, listed firms perform financially
better than the non-listed ones. Performance of the
listed firms is shown in the balance sheets through the
measures of FP. Hence, stock-listing influences FP of
firms. However, it does not influence NFP which is a
subjective measure and is not captured in balance
sheets for evaluation by multiple stakeholders. Lack
of influence of ownership and firm size on CSR and
firm performance establishes that there is no differ-
ence between the SOEs and private sector companies
in India with respect to the level of CSR displayed by
them. Private sector companies such as Tata Steel and
Apollo Tyres are as responsible as the SOEs such as
Rastriya Ispat Nigam Limited and Gas Authority of
India Limited. Furthermore, larger firms do not
always display a high level of CSR compared to the
smaller firms (Wu, 2006). Smaller firms like Orissa
Milk Federation are as sensitive to stakeholders as
larger firms in the same category like AMUL.
TABLE III
continued
DV Step IV B SEB B R2 DR2 F
Industry-adjusted ROA 1 Listed 0.08 0.03 0.23** 0.05 2.07
Ownership -0.03 0.03 -0.08
Employees 0.00 0.00 0.03
Sales 0.00 0.00 0.01
2 Listed 0.06 0.03 0.18* 0.15 0.10 4.89***
Ownership -0.02 0.03 -0.05
Employees 0.00 0.00 0.03
Sales 0.00 0.00 0.01
CSR-environment 0.06 0.01 0.31***
Industry-adjusted ROA 1 Listed 0.08 0.03 0.23** 0.05 2.07
Ownership -0.03 0.03 -0.08
Employees 0.00 0.00 0.03
Sales 0.00 0.00 0.01
2 Listed 0.05 0.03 0.16* 0.14 0.09 4.81***
Ownership -0.03 0.03 -0.07
Employees 0.00 0.00 0.02
Sales 0.00 0.00 -0.01
CSR-supplier 0.05 0.01 0.31***
DV dependent variable, IV independent variable, B beta, SEB standard error of beta, b standardized beta, R2 coefficient of
determination.
*p < 0.05; **p < 0.01; ***p < 0.001.
585CSR and Firm Performance
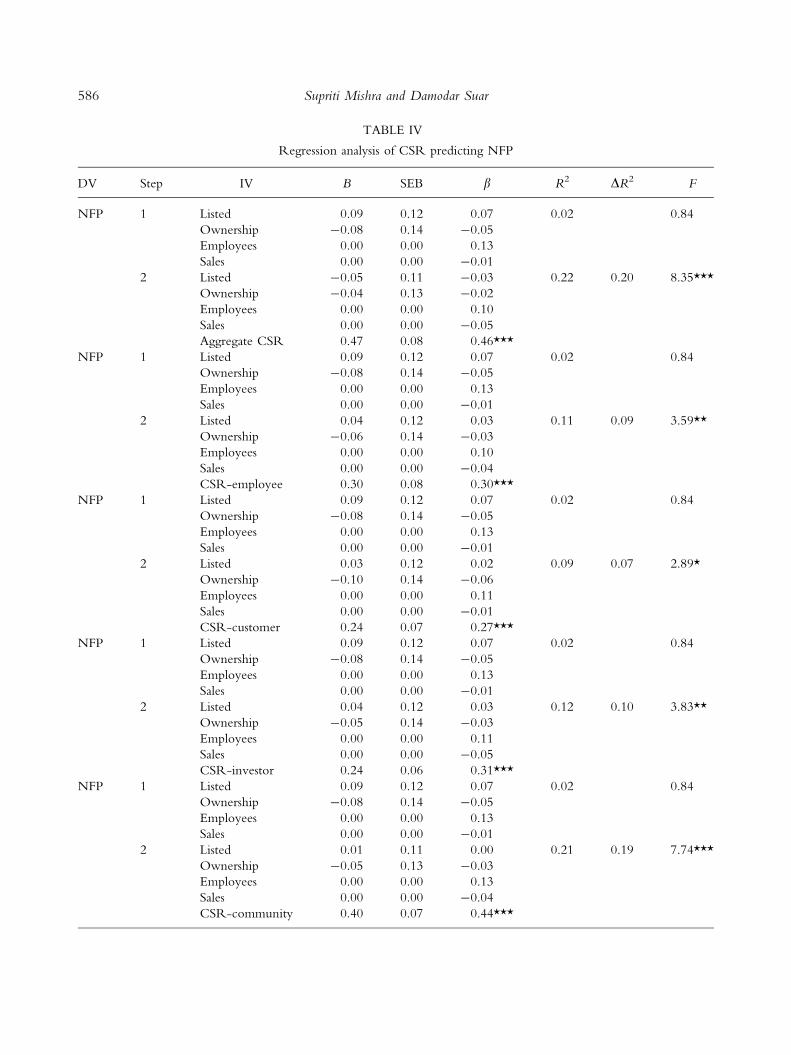
TABLE IV
Regression analysis of CSR predicting NFP
DV Step IV B SEB b R2 DR2 F
NFP 1 Listed 0.09 0.12 0.07 0.02 0.84
Ownership -0.08 0.14 -0.05
Employees 0.00 0.00 0.13
Sales 0.00 0.00 -0.01
2 Listed -0.05 0.11 -0.03 0.22 0.20 8.35***
Ownership -0.04 0.13 -0.02
Employees 0.00 0.00 0.10
Sales 0.00 0.00 -0.05
Aggregate CSR 0.47 0.08 0.46***
NFP 1 Listed 0.09 0.12 0.07 0.02 0.84
Ownership -0.08 0.14 -0.05
Employees 0.00 0.00 0.13
Sales 0.00 0.00 -0.01
2 Listed 0.04 0.12 0.03 0.11 0.09 3.59**
Ownership -0.06 0.14 -0.03
Employees 0.00 0.00 0.10
Sales 0.00 0.00 -0.04
CSR-employee 0.30 0.08 0.30***
NFP 1 Listed 0.09 0.12 0.07 0.02 0.84
Ownership -0.08 0.14 -0.05
Employees 0.00 0.00 0.13
Sales 0.00 0.00 -0.01
2 Listed 0.03 0.12 0.02 0.09 0.07 2.89*
Ownership -0.10 0.14 -0.06
Employees 0.00 0.00 0.11
Sales 0.00 0.00 -0.01
CSR-customer 0.24 0.07 0.27***
NFP 1 Listed 0.09 0.12 0.07 0.02 0.84
Ownership -0.08 0.14 -0.05
Employees 0.00 0.00 0.13
Sales 0.00 0.00 -0.01
2 Listed 0.04 0.12 0.03 0.12 0.10 3.83**
Ownership -0.05 0.14 -0.03
Employees 0.00 0.00 0.11
Sales 0.00 0.00 -0.05
CSR-investor 0.24 0.06 0.31***
NFP 1 Listed 0.09 0.12 0.07 0.02 0.84
Ownership -0.08 0.14 -0.05
Employees 0.00 0.00 0.13
Sales 0.00 0.00 -0.01
2 Listed 0.01 0.11 0.00 0.21 0.19 7.74***
Ownership -0.05 0.13 -0.03
Employees 0.00 0.00 0.13
Sales 0.00 0.00 -0.04
CSR-community 0.40 0.07 0.44***
586 Supriti Mishra and Damodar Suar
Aggregate CSR and firm performance
An increase in the aggregate CSR boosts firm per-
formance. CSR-related benefits may arise due to
two reasons. First, the CSR-induced revenue can
increase from enhanced sales and prices/margins.
Second, the CSR-induced cost decrease can result
from tax concessions, reductions of duties by the
government to promote CSR activities, efficiency
gains from environment-friendly technologies, and
reduced cost of capital. A stakeholder-oriented firm
while generating value for its stakeholders also
generates value for its shareholders. A favorable
aggregate CSR towards all the primary stakeholders
creates a fleet of satisfied stakeholders who bring in
efficiency gains and cost advantages through various
means that ultimately improve firm performance.
Satisfied employees reward the firm through pro-
ductivity gains and reduced hiring and training costs,
satisfied customers improve product sales through
repeat purchase behavior, satisfied investors lend
more capital at a cheaper rate decreasing cost of
capital, satisfied communities reduce the public
relations cost, environmental stewardship leads to
reputational advantages, and better suppliers reduce
quality certification costs. Findings establish that
effective management of key stakeholders improves
FP (Berman et al., 1999; Waddock and Graves,
1997). By being responsive to stakeholders, a firm
also ensures superior performance compared to its
competitors (Turban and Greening, 1997). When
firms enhance CSR towards their stakeholders,
consumers not only like, respect, or admire the firms
but also identify with it. Such identification becomes
so strong and enduring (Sen and Bhattacharya, 2001)
that consumers become brand ambassadors of the
firms (Springer, 2006) with long-lasting loyalty
(Gillentine, 2006).
CSR towards employees and firm performance
Past research establishes the importance of primary
stakeholders as value drivers of a firm’s performance
TABLE IV
continued
DV Step IV B SEB b R2 DR2 F
NFP 1 Listed 0.09 0.12 0.07 0.02 0.84
Ownership -0.08 0.14 -0.05
Employees 0.00 0.00 0.13
Sales 0.00 0.00 -0.01
2 Listed -0.01 0.12 0.00 0.16 0.14 5.39***
Ownership -0.03 0.13 -0.02
Employees 0.00 0.00 0.12
Sales 0.00 0.00 -0.01
CSR-environment 0.28 0.06 0.37***
NFP 1 Listed 0.09 0.12 0.07 0.02 0.84
Ownership -0.08 0.14 -0.05
Employees 0.00 0.00 0.13
Sales 0.00 0.00 -0.01
2 Listed -0.07 0.11 -0.05 0.21 0.19 7.55***
Ownership -0.05 0.13 -0.03
Employees 0.00 0.00 0.11
Sales 0.00 0.00 -0.04
CSR-supplier 0.28 0.05 0.44***
DV dependent variable, IV independent variable, B beta, SEB standard error of beta, b standardized beta, R2 coefficient of
determination.
*p < 0.05; **p < 0.01; ***p < 0.001.
587CSR and Firm Performance
(Barney and Hansen, 1994; Clarkson, 1995; Fom-
burn and Shanley, 1990). A direct link between
CSR towards employees and firm performance
substantiates previous findings (Berman et al., 1999).
Higher CSR towards employees in terms of
employee-sensitive policies and practices by firms en-
hances employee productivity, reduces absenteeism,
and facilitates recruitment and retention of better
quality employees (Turban and Greening, 1997).
Attention on progressive human resource manage-
ment practices, including training and development of
employees, their participation in problem solving,
progressive remuneration policies, and grievance
handling reduces the attrition rate, increases employee
productivity and FP (Huselid, 1995; Youndt et al.,
1996). Lower attrition rates lead to lesser personnel
hiring costs that ultimately improve firm performance.
Corroborating past findings (Leff, 2004), the study
finds that concern for employees is a part of core
activities of Indian companies that improves firm
performance. Indian companies have successfully
integrated various CSR issues related to employees
such as workplace safety and benefit plans into the
companies’ functions that ultimately reward them by
enhancing their profitability and competitive position.
Better corporate consciousness on these issues and
positive influence of CSR towards employees on firm
performance may be attributed to the presence of
empowered trade unions and strong labor laws in
India, particularly in case of manufacturing companies.
CSR towards customers and firm performance
A favorable CSR towards customers enhances firm
profitability and NFP. This is congruent with previ-
ous findings that firms gain by adding socially
responsible elements to products (Berman et al., 1999;
Bromiley and Marcus, 1989; Davidson and Worell,
1988). Ceteris paribus, customers are more likely to
buy from companies that engage in CSR activities
that they find appropriate and personally relevant
(Brown and Dacin, 1997; Sen et al., 2006). Cus-
tomers reward companies that produce reliable and
better quality products, and adhere to safety standards
which improve FP (Berman et al., 1999; Graafland
and van de Ven, 2006). Company policies and prac-
tices towards issues such as ethical advertising and
pricing or providing products to the economic dis-
advantaged induce a ‘feel good factor’ among the
customers. They feel happy and proud to be identified
with such companies. Such identification (Sen and
Bhattacharya, 2001) elicits repeat purchase behavior
and ushers in competitive advantage for the firm.
Alternatively, customers boycott companies who
mislead them. An independent survey by GMI Poll
(2005) finds that Nestle is one of the most widely
boycotted companies in the world for its unethical
promotion of baby foods and infant formulas. Com-
panies such as Nestle India, Johnson and Johnson, and
Wockhardt that sell baby foods are being prosecuted
in India for giving misleading and scientifically
incorrect information on infant feeding in their
advertisements and promotion materials (Gupta,
2005). Boycotting of a company’s products and agi-
tations and legal actions against the company jeopar-
dize its image and adversely affect firm performance
(Berman et al., 1999; Financial Express, 2006).
CSR towards investors and firm performance
Past research has established that better governance
standards of companies lead to enhanced profitability
(Black and Khanna, 2007; Business Week, 2002).
Better corporate governance practices by firms have
favorable impact on FP indicators such as economic
value added and market value added (Coles et al.,
2001). Commitment of the management towards
strong controls emphasizing ethical and social respon-
sible behavior improves profitability (Verschoor,
1998) and acts as a source of competitive advantage
for firms. Stakeholders have increased confidence on
such firms. Investors pay a premium to buy the stocks
of well-governed firms (Coombes and Watson,
2000). They even become willing to provide further
capital to such firms at a lower rate of interest which
reduces the cost of capital. Such factors enhance firm
value and performance. Indian companies have to
comply with various mandatory governance stan-
dards laid down in the Clause 49 of the Listing
Agreements, 2005 which is implemented by SEBI.
Companies that fail to comply with the standards
have the risk of getting delisted from Indian stock
exchanges. This has made many Indian companies
proactive in adopting corporate governance stan-
dards. Moreover, success of companies such as Infosys
due to adoption of better corporate governance
588 Supriti Mishra and Damodar Suar
standards has motivated many other Indian firms to
display similar practices and reap benefits of good
governance (CLSA, 2000).
CSR towards community and firm performance
Qualitative research on CSR using case studies
establishes a favorable relation between community
initiatives of firms and improved firm performance
(Brugmann and Prahalad, 2007; Rockefeller, 2003)
though empirical research (Berman et al., 1999) does
not find a significant relation between the two
constructs. Findings of this study corroborate the
findings of the qualitative research. A recent survey
on business–community relations in India shows that
85% of the surveyed firms agree that they have a
responsibility to the surrounding community and are
committed towards their cause (Mahajan, 2004). A
socially responsible image of companies among the
local community improves the brand and loyalty of
consumers. Consumers reward good corporate citi-
zens through greater and sustained patronage (Luo
and Bhattacharya, 2006). Positive CSR of compa-
nies enhances overall product evaluation by con-
sumers (Brown and Dacin, 1997). Consumers pay
attention to the CSR records of the companies,
encompassing mainly their community initiatives,
while purchasing (Gildea, 1994; Owen and Scherer,
1993). Good corporate citizens can also reduce costs
through indirect benefits such as tax advantages,
improved quality of local labor, and fewer lawsuits
from employees and environmentalists (Ullman,
1985; Waddock and Graves, 1997). Section 80G of
the Income Tax Act in India grants tax benefits to
Indian companies that invest on community devel-
opment projects. Investment in such projects in
association with the local government and NGOs
improves the firm’s image while reducing its
expenses on tax payments. The firm faces less resis-
tance from the local community and the govern-
ment while pursuing its activities. The Tata group,
which is well known as the most respected corporate
citizen in India, provides the cheapest car in the
world to the burgeoning cash-starving middle-
income Indian families through its ‘Nano’ project.
This project has received support from local gov-
ernments and community in many Indian states due
to the company’s reputation of corporate citizenship.
CSR towards environment and firm performance
A favorable CSR towards environment increasing
FP and NFP of firms supports past findings (Ahmed
et al., 1998; Alvarez et al., 2001). Environmentally
compatible products, processes and management
systems enhance profitability either through revenue
gains or through cost savings. Revenues increase
as consumers prefer products of environmen-
tally proactive companies (Owen and Scherer, 1993;
Rosewicz, 1990). Investment in environmental
management systems reduces costs arising from
environmental crisis, wastages of raw materials,
and inefficient production processes (Allen, 1992;
Schmidheiny, 1992). Market values of firms signif-
icantly increase when they adopt environmentally
proactive stands or receive environmental awards
(Klassen and Mc Laughlin, 1996). Adoption of
superior environmental standards not only prepares
firms to handle stricter regulations in the future but
also positions them ahead of competitors (Barrett,
1992). Mainly four factors can be attributed to
the environmental proactivity of Indian companies.
First, there is a separate ministry under the Indian
government, the ministry of environment and for-
est, which monitors and enforces environmental
quality standards through pollution control boards.
Companies are required to adhere to mandatory
standards specified in over 180 enactments related to
environmental and industrial pollution such as the
Forest (Conservation) Act, 1981, the Air (Preven-
tion and Control of Pollution) Act, 1986, and the
Environment (Prevention) Act, 1986. Second, since
1994, environmental management plans have been
made mandatory for setting up new business units,
and expansion or modernization of existing units.
Third, past industrial disasters like the ‘Bhopal Gas
tragedy’ in 1984 have raised environmental con-
sciousness of Indian companies. Fourth, adoption of
voluntary environmental standards has become a
prerequisite to compete in the global market. Such
factors have prompted Indian companies to include
environmental management practices as a part of
their core activities (Leff, 2004). Among the 150
studied firms, 92% have clearance from pollution
control boards, which is mandatory. In addition,
43% have adopted ISO 14000 and 15% have
adopted OHSAS 18000. Such proactivity enhances
firm performance.
589CSR and Firm Performance
CSR towards suppliers and firm performance
The demand for social audit by international buyers
and multi-national business associates from devel-
oped countries has made it necessary for companies
in emerging markets like India to ensure responsible
and ethical practices at suppliers’ locations. By
ensuring ethical practices at suppliers’ locations,
companies increase their competitiveness and image
in the global market that improves firm performance.
The findings of the study concur that favorable CSR
towards suppliers can be a definite source of com-
petitive advantage and bring higher returns.
Limitations
There are certain limitations of the study that must
be acknowledged. First, the data on CSR and NFP
are perceptual in nature. Respondents might have
overemphasized the positive aspects of CSR as well
as NFP of their firms and understated corresponding
negative aspects. Notwithstanding the limitations,
a priori model is assumed for the items measuring
each construct of CSR and ascertained applying
CFA that arrests the common method variance sta-
tistically. Moreover, because the data on FP and
CSR are collected from two different sources,
common method variance in the results is also
arrested procedurally (Podsakoff et al., 2003). Sec-
ond, the data are collected from 18 categories of
industries. Issues faced by each category being
unique and different from one another, an aggregate
analysis across multiple categories of industries might
have missed industry-specific issues (Griffin and
Mahon, 1997). However, CSR issues included in
the study are generic in nature. For example,
product quality and price, safety standards in the
work place, community partnership, or stronger
governance standards represent responsible business
practices across industries. Third, the proposed CSR
measure may be a narrow conceptualization of CSR
as it assesses a firm’s social policies and practices
towards primary stakeholders. The measure can be
strengthened by incorporating actionable outcomes.
For example, items like policies and practices to-
wards ‘training and development of women and
minorities’ or ‘sexual harassment prohibition’ can be
matched with corresponding actionable outcomes
about the actual number of training programs pro-
vided to women and minorities or the redressal of
actual number of sexual harassment cases. Lastly,
because data are collected from only 18 categories of
manufacturing industries in India, caution must be
exercised in generalizing the findings.
Implications and future research direction
Corporate social responsibility (policy, program, or
process) is ‘strategic’ when it yields substantial busi-
ness-related benefits to the firm (Burke and Logsdon,
1996). This approach towards CSR has been criti-
cized by researchers for a lack of intrinsic and moral
grounding (Margolis and Walsh, 2003; Vogel, 2005).
They argue that such an approach reduces CSR to a
marketing instrument (Maignan and Ferrell, 2001)
and turns stakeholders as ‘means’ to the ‘ends’ of
maximizing shareholder wealth (Goodpaster, 1998).
This research adds a ‘stakeholder-sense’ to the
‘business-sense’ of CSR. By designing stakeholder-
sensitive policies, firms cater to a wide range of issues
relevant to stakeholders. Many issues included in the
proposed CSR framework do not have a direct link
with profitability. For example, indicators such as
ethical advertising, diversity, policies towards insider
trading, or policies to eliminate human rights’ abuses
at the work place and supplier locations do not have
any direct financial implications. Rather these factors
bring ethical issues into the CSR discussion. In this
sense, this study addresses the concern about lack of
ethical dimensions in CSR research. By bringing
stakeholder-sensitive and ethical issues into the CSR
framework, it advocates such an approach can be
beneficial for both the firm and its stakeholders, and
lead to a win-win situation for both.
This study contributes to the empirical literature
of CSR in three ways. First, when the study was
carried out in 2005, no systematic database on CSR
was available for evaluating Indian companies from
the stakeholders’ perspective. Though there are few
recent attempts to rate CSR activities of Indian
companies, like the Karmayog CSR rating (India-
PRwire.com, 2007), an objective assessment of CSR
like that done by KLD in the US is still not found in
India. We have developed and validated an instru-
ment to assess CSR from the stakeholders’ per-
spective in the Indian context that can be used in
590 Supriti Mishra and Damodar Suar
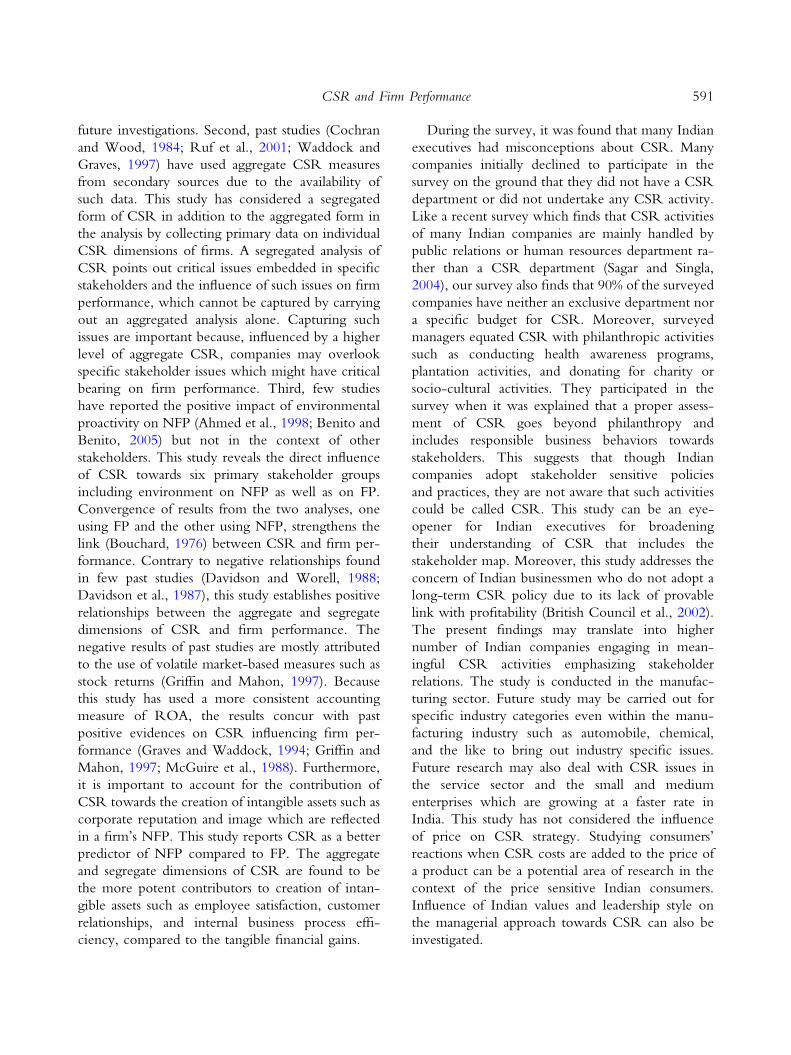
future investigations. Second, past studies (Cochran
and Wood, 1984; Ruf et al., 2001; Waddock and
Graves, 1997) have used aggregate CSR measures
from secondary sources due to the availability of
such data. This study has considered a segregated
form of CSR in addition to the aggregated form in
the analysis by collecting primary data on individual
CSR dimensions of firms. A segregated analysis of
CSR points out critical issues embedded in specific
stakeholders and the influence of such issues on firm
performance, which cannot be captured by carrying
out an aggregated analysis alone. Capturing such
issues are important because, influenced by a higher
level of aggregate CSR, companies may overlook
specific stakeholder issues which might have critical
bearing on firm performance. Third, few studies
have reported the positive impact of environmental
proactivity on NFP (Ahmed et al., 1998; Benito and
Benito, 2005) but not in the context of other
stakeholders. This study reveals the direct influence
of CSR towards six primary stakeholder groups
including environment on NFP as well as on FP.
Convergence of results from the two analyses, one
using FP and the other using NFP, strengthens the
link (Bouchard, 1976) between CSR and firm per-
formance. Contrary to negative relationships found
in few past studies (Davidson and Worell, 1988;
Davidson et al., 1987), this study establishes positive
relationships between the aggregate and segregate
dimensions of CSR and firm performance. The
negative results of past studies are mostly attributed
to the use of volatile market-based measures such as
stock returns (Griffin and Mahon, 1997). Because
this study has used a more consistent accounting
measure of ROA, the results concur with past
positive evidences on CSR influencing firm per-
formance (Graves and Waddock, 1994; Griffin and
Mahon, 1997; McGuire et al., 1988). Furthermore,
it is important to account for the contribution of
CSR towards the creation of intangible assets such as
corporate reputation and image which are reflected
in a firm’s NFP. This study reports CSR as a better
predictor of NFP compared to FP. The aggregate
and segregate dimensions of CSR are found to be
the more potent contributors to creation of intan-
gible assets such as employee satisfaction, customer
relationships, and internal business process effi-
ciency, compared to the tangible financial gains.
During the survey, it was found that many Indian
executives had misconceptions about CSR. Many
companies initially declined to participate in the
survey on the ground that they did not have a CSR
department or did not undertake any CSR activity.
Like a recent survey which finds that CSR activities
of many Indian companies are mainly handled by
public relations or human resources department ra-
ther than a CSR department (Sagar and Singla,
2004), our survey also finds that 90% of the surveyed
companies have neither an exclusive department nor
a specific budget for CSR. Moreover, surveyed
managers equated CSR with philanthropic activities
such as conducting health awareness programs,
plantation activities, and donating for charity or
socio-cultural activities. They participated in the
survey when it was explained that a proper assess-
ment of CSR goes beyond philanthropy and
includes responsible business behaviors towards
stakeholders. This suggests that though Indian
companies adopt stakeholder sensitive policies
and practices, they are not aware that such activities
could be called CSR. This study can be an eye-
opener for Indian executives for broadening
their understanding of CSR that includes the
stakeholder map. Moreover, this study addresses the
concern of Indian businessmen who do not adopt a
long-term CSR policy due to its lack of provable
link with profitability (British Council et al., 2002).
The present findings may translate into higher
number of Indian companies engaging in mean-
ingful CSR activities emphasizing stakeholder
relations. The study is conducted in the manufac-
turing sector. Future study may be carried out for
specific industry categories even within the manu-
facturing industry such as automobile, chemical,
and the like to bring out industry specific issues.
Future research may also deal with CSR issues in
the service sector and the small and medium
enterprises which are growing at a faster rate in
India. This study has not considered the influence
of price on CSR strategy. Studying consumers’
reactions when CSR costs are added to the price of
a product can be a potential area of research in the
context of the price sensitive Indian consumers.
Influence of Indian values and leadership style on
the managerial approach towards CSR can also be
investigated.
591CSR and Firm Performance
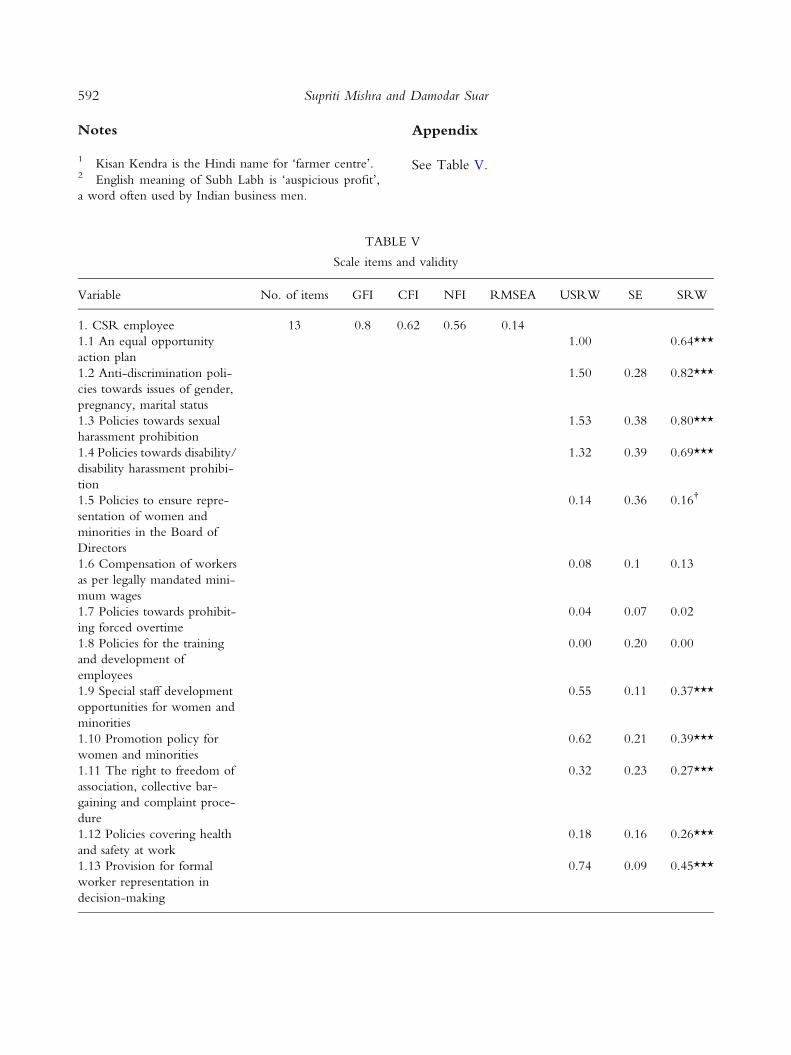
Notes
1 Kisan Kendra is the Hindi name for ‘farmer centre’.2 English meaning of Subh Labh is ‘auspicious profit’,
a word often used by Indian business men.
TABLE V
Scale items and validity
Variable No. of items GFI CFI NFI RMSEA USRW SE SRW
1. CSR employee 13 0.8 0.62 0.56 0.14
1.1 An equal opportunity
action plan
1.00 0.64***
1.2 Anti-discrimination poli-
cies towards issues of gender,
pregnancy, marital status
1.50 0.28 0.82***
1.3 Policies towards sexual
harassment prohibition
1.53 0.38 0.80***
1.4 Policies towards disability/
disability harassment prohibi-
tion
1.32 0.39 0.69***
1.5 Policies to ensure repre-
sentation of women and
minorities in the Board of
Directors
0.14 0.36 0.16�
1.6 Compensation of workers
as per legally mandated mini-
mum wages
0.08 0.1 0.13
1.7 Policies towards prohibit-
ing forced overtime
0.04 0.07 0.02
1.8 Policies for the training
and development of
employees
0.00 0.20 0.00
1.9 Special staff development
opportunities for women and
minorities
0.55 0.11 0.37***
1.10 Promotion policy for
women and minorities
0.62 0.21 0.39***
1.11 The right to freedom of
association, collective bar-
gaining and complaint proce-
dure
0.32 0.23 0.27***
1.12 Policies covering health
and safety at work
0.18 0.16 0.26***
1.13 Provision for formal
worker representation in
decision-making
0.74 0.09 0.45***
Appendix
See Table V.
592 Supriti Mishra and Damodar Suar
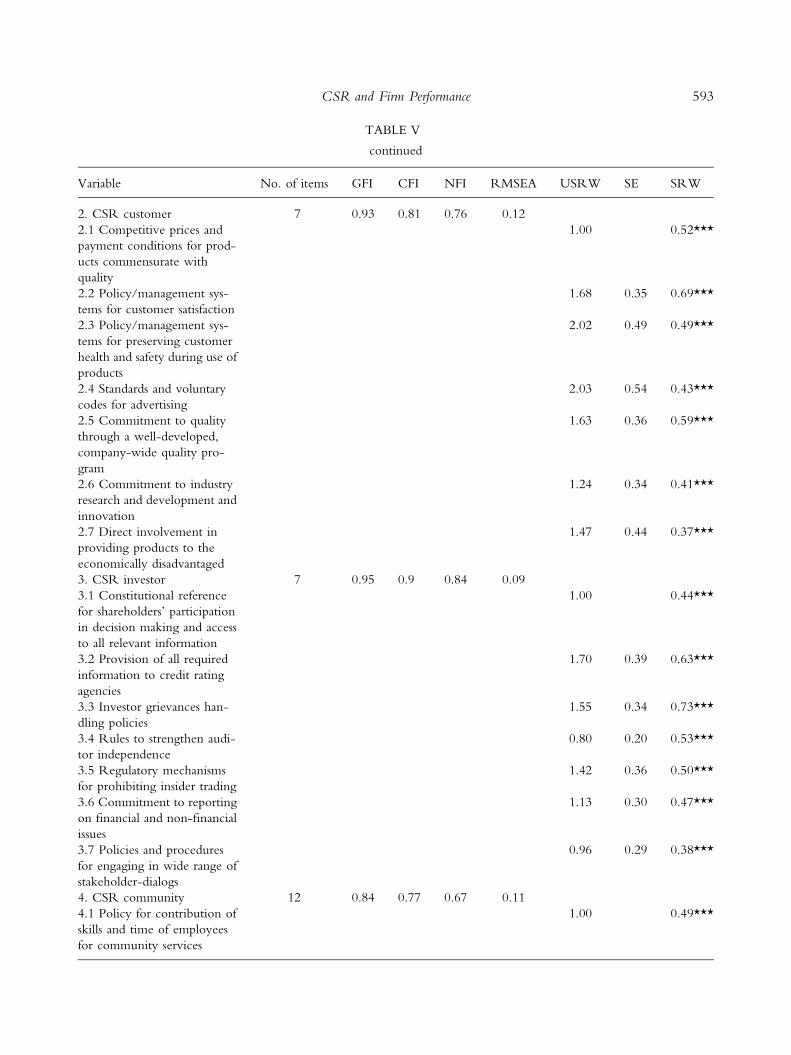
TABLE V
continued
Variable No. of items GFI CFI NFI RMSEA USRW SE SRW
2. CSR customer 7 0.93 0.81 0.76 0.12
2.1 Competitive prices and
payment conditions for prod-
ucts commensurate with
quality
1.00 0.52***
2.2 Policy/management sys-
tems for customer satisfaction
1.68 0.35 0.69***
2.3 Policy/management sys-
tems for preserving customer
health and safety during use of
products
2.02 0.49 0.49***
2.4 Standards and voluntary
codes for advertising
2.03 0.54 0.43***
2.5 Commitment to quality
through a well-developed,
company-wide quality pro-
gram
1.63 0.36 0.59***
2.6 Commitment to industry
research and development and
innovation
1.24 0.34 0.41***
2.7 Direct involvement in
providing products to the
economically disadvantaged
1.47 0.44 0.37***
3. CSR investor 7 0.95 0.9 0.84 0.09
3.1 Constitutional reference
for shareholders’ participation
in decision making and access
to all relevant information
1.00 0.44***
3.2 Provision of all required
information to credit rating
agencies
1.70 0.39 0.63***
3.3 Investor grievances han-
dling policies
1.55 0.34 0.73***
3.4 Rules to strengthen audi-
tor independence
0.80 0.20 0.53***
3.5 Regulatory mechanisms
for prohibiting insider trading
1.42 0.36 0.50***
3.6 Commitment to reporting
on financial and non-financial
issues
1.13 0.30 0.47***
3.7 Policies and procedures
for engaging in wide range of
stakeholder-dialogs
0.96 0.29 0.38***
4. CSR community 12 0.84 0.77 0.67 0.11
4.1 Policy for contribution of
skills and time of employees
for community services
1.00 0.49***
593CSR and Firm Performance
TABLE V
continued
Variable No. of items GFI CFI NFI RMSEA USRW SE SRW
4.2 Observes, both directly
and indirectly, all relevant
local laws and regulations
0.28 0.07 0.43***
4.3 Helps community
through charitable donations,
and educational and cultural
contributions
0.95 0.18 0.64***
4.4 Supports for third party
social and sustainable devel-
opment related initiatives
1.35 0.25 0.68***
4.5 Supports educational pro-
grams for the promotion of
corporate citizenship
1.62 0.29 0.75***
4.6 Supports public policies
and practices to promote
human development and
democracy
1.25 0.25 0.60***
4.7 Pursues partnerships with
community organizations,
government agencies and
other industry groups dedi-
cated to social causes
1.48 0.26 0.77***
4.8 Prohibits child labor, and
violation of human rights
0.22 0.08 0.27**
4.9 Makes timely payment of
taxes
0.13 0.10 0.11
4.10 Policy for dealing with a
country that systematically
violates human rights
0.65 0.20 0.31**
4.11 Policy for social
accountability or sustainable
reporting
1.05 0.24 0.47***
4.12 Code of conduct with
regard to bribery, gift receipts
and corruption
0.10 0.21 0.05
5. CSR environment 17 0.66 0.66 0.61 0.16
5.1 Explicit definition of
environmental policy and
long term environmental
plans
1.00 0.13 0.69***
5.2 Well defined environment
responsibilities
1.02 0.13 0.70***
5.3 Systems for measuring and
assessing environmental
performance
0.92 0.13 0.60***
594 Supriti Mishra and Damodar Suar
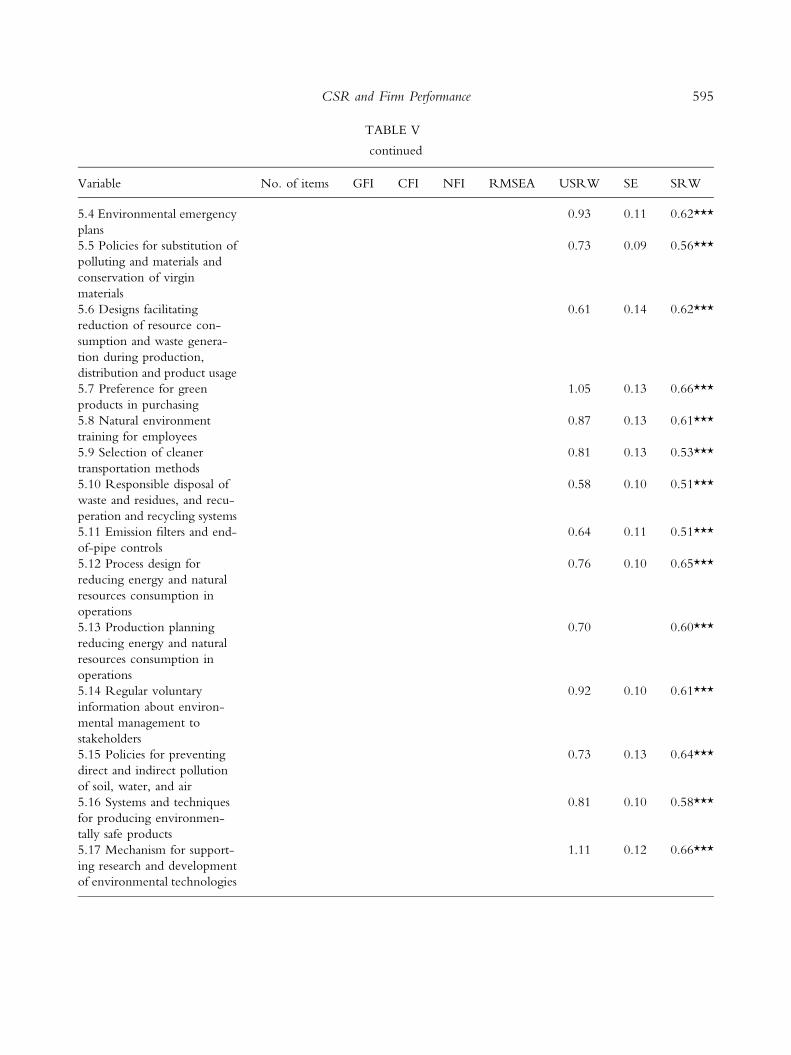
TABLE V
continued
Variable No. of items GFI CFI NFI RMSEA USRW SE SRW
5.4 Environmental emergency
plans
0.93 0.11 0.62***
5.5 Policies for substitution of
polluting and materials and
conservation of virgin
materials
0.73 0.09 0.56***
5.6 Designs facilitating
reduction of resource con-
sumption and waste genera-
tion during production,
distribution and product usage
0.61 0.14 0.62***
5.7 Preference for green
products in purchasing
1.05 0.13 0.66***
5.8 Natural environment
training for employees
0.87 0.13 0.61***
5.9 Selection of cleaner
transportation methods
0.81 0.13 0.53***
5.10 Responsible disposal of
waste and residues, and recu-
peration and recycling systems
0.58 0.10 0.51***
5.11 Emission filters and end-
of-pipe controls
0.64 0.11 0.51***
5.12 Process design for
reducing energy and natural
resources consumption in
operations
0.76 0.10 0.65***
5.13 Production planning
reducing energy and natural
resources consumption in
operations
0.70 0.60***
5.14 Regular voluntary
information about environ-
mental management to
stakeholders
0.92 0.10 0.61***
5.15 Policies for preventing
direct and indirect pollution
of soil, water, and air
0.73 0.13 0.64***
5.16 Systems and techniques
for producing environmen-
tally safe products
0.81 0.10 0.58***
5.17 Mechanism for support-
ing research and development
of environmental technologies
1.11 0.12 0.66***
595CSR and Firm Performance
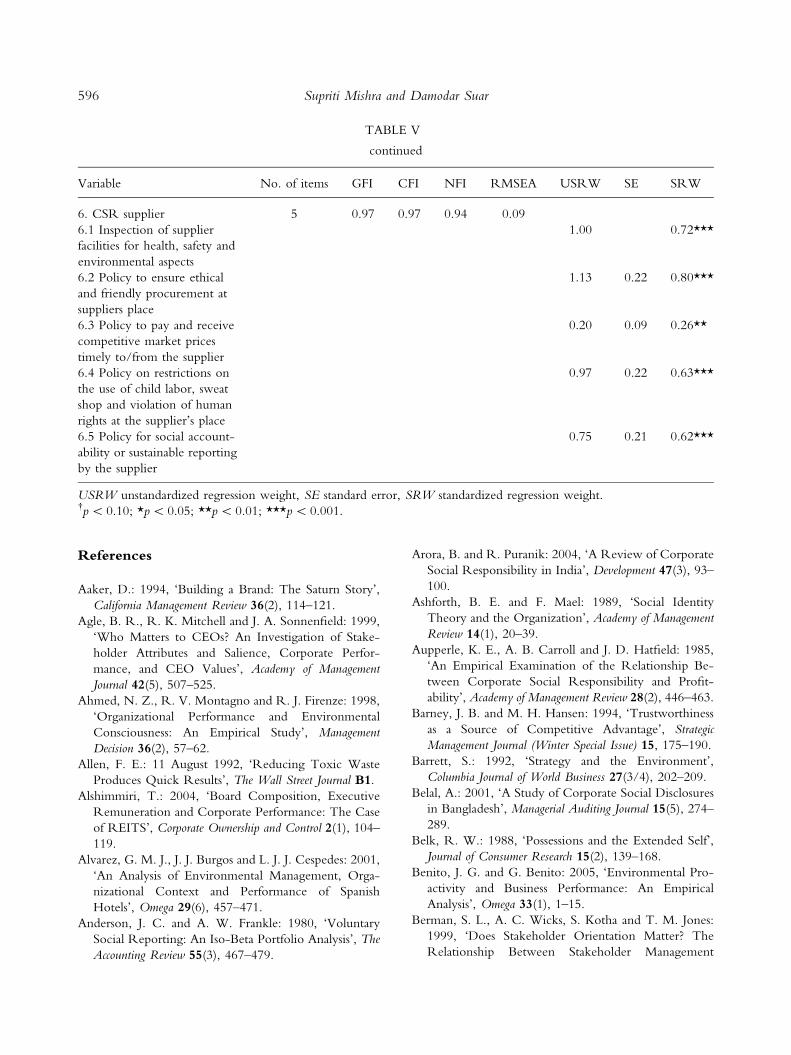
References
Aaker, D.: 1994, ‘Building a Brand: The Saturn Story’,
California Management Review 36(2), 114–121.
Agle, B. R., R. K. Mitchell and J. A. Sonnenfield: 1999,
‘Who Matters to CEOs? An Investigation of Stake-
holder Attributes and Salience, Corporate Perfor-
mance, and CEO Values’, Academy of Management
Journal 42(5), 507–525.
Ahmed, N. Z., R. V. Montagno and R. J. Firenze: 1998,
‘Organizational Performance and Environmental
Consciousness: An Empirical Study’, Management
Decision 36(2), 57–62.
Allen, F. E.: 11 August 1992, ‘Reducing Toxic Waste
Produces Quick Results’, The Wall Street Journal B1.
Alshimmiri, T.: 2004, ‘Board Composition, Executive
Remuneration and Corporate Performance: The Case
of REITS’, Corporate Ownership and Control 2(1), 104–
119.
Alvarez, G. M. J., J. J. Burgos and L. J. J. Cespedes: 2001,
‘An Analysis of Environmental Management, Orga-
nizational Context and Performance of Spanish
Hotels’, Omega 29(6), 457–471.
Anderson, J. C. and A. W. Frankle: 1980, ‘Voluntary
Social Reporting: An Iso-Beta Portfolio Analysis’, The
Accounting Review 55(3), 467–479.
Arora, B. and R. Puranik: 2004, ‘A Review of Corporate
Social Responsibility in India’, Development 47(3), 93–
100.
Ashforth, B. E. and F. Mael: 1989, ‘Social Identity
Theory and the Organization’, Academy of Management
Review 14(1), 20–39.
Aupperle, K. E., A. B. Carroll and J. D. Hatfield: 1985,
‘An Empirical Examination of the Relationship Be-
tween Corporate Social Responsibility and Profit-
ability’, Academy of Management Review 28(2), 446–463.
Barney, J. B. and M. H. Hansen: 1994, ‘Trustworthiness
as a Source of Competitive Advantage’, Strategic
Management Journal (Winter Special Issue) 15, 175–190.
Barrett, S.: 1992, ‘Strategy and the Environment’,
Columbia Journal of World Business 27(3/4), 202–209.
Belal, A.: 2001, ‘A Study of Corporate Social Disclosures
in Bangladesh’, Managerial Auditing Journal 15(5), 274–
289.
Belk, R. W.: 1988, ‘Possessions and the Extended Self’,
Journal of Consumer Research 15(2), 139–168.
Benito, J. G. and G. Benito: 2005, ‘Environmental Pro-
activity and Business Performance: An Empirical
Analysis’, Omega 33(1), 1–15.
Berman, S. L., A. C. Wicks, S. Kotha and T. M. Jones:
1999, ‘Does Stakeholder Orientation Matter? The
Relationship Between Stakeholder Management
TABLE V
continued
Variable No. of items GFI CFI NFI RMSEA USRW SE SRW
6. CSR supplier 5 0.97 0.97 0.94 0.09
6.1 Inspection of supplier
facilities for health, safety and
environmental aspects
1.00 0.72***
6.2 Policy to ensure ethical
and friendly procurement at
suppliers place
1.13 0.22 0.80***
6.3 Policy to pay and receive
competitive market prices
timely to/from the supplier
0.20 0.09 0.26**
6.4 Policy on restrictions on
the use of child labor, sweat
shop and violation of human
rights at the supplier’s place
0.97 0.22 0.63***
6.5 Policy for social account-
ability or sustainable reporting
by the supplier
0.75 0.21 0.62***
USRW unstandardized regression weight, SE standard error, SRW standardized regression weight.�p < 0.10; *p < 0.05; **p < 0.01; ***p < 0.001.
596 Supriti Mishra and Damodar Suar
Models and Firm Financial Performance’, Academy of
Management Journal 42(5), 488–506.
Black, B. S. and V. S. Khanna: 2007, ‘Can Corporate
Governance Reforms Increase Firms’ Market Values?
Evidence from India’, Journal of Empirical Legal Studies
4(4), 749–796.
Boardman, A. E. and A. R. Vining: 1989, ‘Ownership
and Performance in Competitive Environments’,
Journal of Law and Economics 32(1), 1–33.
Boli, J. and D. Hartsuiker: 2001, ‘World Culture and
Transnational Corporations: Sketch of a Project’,
Paper Presented at the International Conference on
Effects of and Responses to Globalization, Istanbul.
Bollen, K. A.: 1989, Structural Equations with Latent Vari-
ables (John Wiley & Sons, New York).
Bollen, K. and R. Lenox: 1991, ‘Conventional Wisdom
on Measurement: A Structural Equation Perspective’,
Psychological Bulletin 110(2), 305–314.
Bouchard, T. J. Jr.: 1976, ‘Unobtrusive Measures: An
Inventory of Uses’, Sociological Methods and Research
4(3), 267–300.
Boulding, W. and M. A. Kirmani: 1993, ‘A Consumer
Side Experimental Examination of Signaling Theory:
Do Consumers Perceive Warranties as Signals of
Quality?’, Journal of Consumer Research 20(1), 111–128.
British Council, UNDP, CII and Pricewaterhouse
Coopers: 2002, ‘Corporate Social Responsibility Sur-
vey’, A Survey by British Council, UNDP, CII and
Pricewaterhouse Coopers, India.
Bromiley, P. and A. Marcus: 1989, ‘The Deterrent to
Dubious Corporate Behavior: Profitability, Probabil-
ity, and Safety Recalls’, Strategic Management Journal
10(3), 233–250.
Brown, T. J. and P. A. Dacin: 1997, ‘The Company and
the Product: Corporate Associations and Consumer
Product Responses’, Journal of Marketing 61(1), 68–85.
Brugmann, J. and C. K. Prahalad: 2007, ‘Co-Creating
Business’s New Social Compact’, Harvard Business
Review 85(2), 80–90.
Burke, L. and J. M. Logsdon: 1996, ‘How Corporate
Social Responsibility Pays Off’, Long Range Planning
29(4), 495–502.
Business Week: Oct 2002, ‘Best and Worst Boards Survey:
How Corporate Scandals are Sparking a Revolution in
Governance’, http://www.businessweek.com/magazine/
content/02_40/b3802001.htm. Accessed 16 May 2006.
Chapple, W. and J. Moon: 2005, ‘Corporate Social
Responsibility in Asia: A Seven-Country Study of
CSR Web Site Reporting’, Business & Society 44(4),
415–441.
Chen, K. H. and R. W. Metcalf: 1980, ‘The Relationship
Between Pollution Control Records and Financial
Indicators Revisited’, The Accounting Review 55(1),
168–177.
Christman, P.: 2000, ‘Effects of ‘‘Best Practices’’ of
Environmental Management on Cost Advantage: The
Role of Complementary Assets’, Academy of Manage-
ment Journal 43(4), 663–680.
Clair, J. A., J. Milliman and I. I. Mitroff: 1995, ‘Clash or
Cooperation? Understanding Environmental Organi-
zations and Their Relationships to Business’, in J. E.
Post (ed.) and D. Collins and M. Starik (Vol. eds.),
Research in Corporate Social Performance and Policy: Sus-
taining the Natural Environment – Empirical Studies on the
Interface Between Nature and Organizations (JAI Press,
Greenwich, CT), Supplement 1, pp. 163–193.
Clarkson, M. B. E.: 1995, ‘A Shareholder Framework for
Analyzing and Evaluating Corporate Social Perfor-
mance’, Academy of Management Review 20(1), 571–610.
CLSA (Credit Lyonnais Securities Asia): October 2000,
‘Report on Corporate Governance: Emerging Markets
Equities Research’, http://web.management.mcgill.
ca/Art.Durnev/clsa_2000.pdf. Accessed 5 January 2009.
Cochran, P. and R. Wood: 1984, ‘Corporate Social
Responsibility and the Financial Performance’, Acad-
emy of Management Journal 27(1), 42–56.
Coles, J. W., V. B. McWilliams and N. Sen: 2001, ‘An
Examination of the Relationship of Governance
Mechanisms to Performance’, Journal of Management
27(1), 23–50.
Coombes, P. and M. Watson: 2000, ‘Three Surveys on
Corporate Governance’, McKinsey Quarterly 4, 74–77.
Copeland, T., T. Koller and J. Murrin: 2000, Valuation:
Measuring and Managing the Value of Companies (John
Wiley & Sons, Inc, New York).
CREM (Consultancy, Research for Environmental
Management): 2004, Corporate Social Responsibility in
India, Policy and Practices of Dutch Companies (CREM,
Amsterdam).
CSM (Centre for Social Markets): 2001, ‘Corporate
Social Responsibility: Perceptions of Indian Business’,
A Report by CSM, Calcutta, India, www.csmworld.
org/public/pdf/social_respons.pdf. Accessed 18 Janu-
ary 2005.
Dahya, J. and J. J. McConnell: 2007, ‘Board Composi-
tion, Corporate Performance, and the Cadbury
Committee Recommendation’, Journal of Financial and
Quantitative Analysis 42(3), 535–564.
Dalton, D. R., C. M. Daily, A. E. Ellstrand and J. L.
Johnson: 1998, ‘Number of Directors and Financial
Performance: A Meta-Analysis’, Academy of Manage-
ment Journal 42(6), 674–686.
Davidson, W. N., P. R. Chandy and M. Cross: 1987,
‘Large Losses, Risk Management and Stock Returns in
597CSR and Firm Performance
the Airline Industry’, Journal of Risk and Insurance 55(1),
162–172.
Davidson, W. N. and D. L. Worell: 1988, ‘The Impact of
Announcements of Corporate Illegalities on Share-
holder Returns’, Academy of Management Journal 31(1),
195–200.
Dunn, D. and K. Yamashita: 2003, ‘A Changed World,
Microcapitalism and the Mega-Corporation’, Harvard
Business Review 81(8), 46–54.
Dutton, J. E., J. M. Dukerich and C. V. Harquail: 1994,
‘Organizational Images and Member Identification’,
Administrative Science Quarterly 39(2), 239–263.
Environics International: 2001, eFlash Report: CSR Index
(Environics International, Toronto).
Epstein, M. J. and M. J. Roy: 2001, ‘Sustainability in Action:
Identifying and Measuring the Key Performance Driv-
ers’, Long Range Planning 34(5), 585–604.
Financial Express: December 19 2006, ‘New Norms to
Gauge Toxins in Colas Soon’, p. 1.
Fomburn, C. and M. Shanley: 1990, ‘What’s in a Name?
Reputation Building and Corporate Strategy’, Academy
of Management Journal 33(2), 233–258.
Fowler, K. L. and D. R. Schmidt: 1988, ‘Tender Offers,
Acquisitions, and Subsequent Performance in Manu-
facturing Firms’, Academy of Management Journal 31(4),
962–974.
Freedman, N. and B. Jaggi: 1982, ‘Pollution Disclosures,
Pollution Performance, and Economic Performance’,
Omega 10(2), 167–176.
Freeman, R. E.: 1984, Strategic Management: A Stakeholder
Approach (Pitman Publishing, Boston, MA).
Frooman, J.: 1997, ‘Socially Irresponsible and Ille-
gal Behavior and Shareholder Wealth: A Meta-
Analysis of Event Studies’, Business & Society 36(3),
221–249.
Galbreath, J.: 2006, ‘Does Primary Stakeholder Man-
agement Positively Affect the Bottom Line? Some
Evidence from Australia’, Management Decision 44(8),
1106–1121.
Ganesh, G.: February 15 2001, ‘PSUs vs. Private Compa-
nies: The Reality Check’, Business Line, Internet edition,
http://www.hinduonnet.com/businessline/2001/02/
15/stories/041546mn.htm. Accessed 23 December
2008.
Gildea, R. L.: 1994, ‘Consumer Survey Confirms Cor-
porate Social Action Affects Buying Decisions’, Public
Relations Quarterly 39(4), 20–22.
Gillentine, A.: February 17 2006, ‘Timberland to Provide
‘‘Nutritional Label’’ for All Shoes’, The Colorado
Springs Business Journal, http://www.allbusiness.com/
north-america/united-states-colorado/1034748-1.
html. Accessed 15 November 2007.
GMI Poll: 2005, More than a Third of all Consumers Boycott
at Least One Brand (GMI, USA), http://www.gmi-
mr.com.
Goodpaster, K.: 1998, ‘Business Ethics’, in G. L. Cooper
and C. Argyris (eds.), The Concise Blackwell Encyclopedia
of Management (Blackwell, Oxford), pp. 56–60.
Govindarajan, V.: 1984, ‘Appropriateness of Accounting
Data in Performance Evaluation: An Examination of
Environmental Uncertainty as an Intervening Vari-
able’, Accounting, Organizations and Society 9(2), 125–
135.
Govindarajan, V. and A. K. Gupta: 1985, ‘Linking
Control Systems to Business Unit Strategy: Impact on
Performance’, Accounting, Organizations, and Society
10(1), 51–66.
Graafland, J. and B. W. van de Ven: 2006, ‘Strategic and
Moral Motivation for Corporate Social Responsibility’,
Journal of Corporate Citizenship 22(Summer), 111–123.
Graves, S. and S. Waddock: 1994, ‘Institutional Owners
and Corporate Social Performance’, Academy of Man-
agement Journal 37(4), 1034–1046.
Greening, D. W. and D. B. Turban: 2000, ‘Corporate
Social Performance as a Competitive Advantage in
Attracting a Quality Workforce’, Business & Society
39(3), 254–280.
Greeno, J. L. and S. N. Robinson: 1992, ‘Rethinking
Corporate Environmental Management’, Columbia
Journal of World Business 27(3–4), 222–232.
GRI (Global Reporting Initiatives): 2002, Sustainability
Reporting Guidelines, Global Reporting Initiatives (GRI,
Amsterdam), http://www.globalreporting.org.
Griffin, J. J. and J. F. Mahon: 1997, ‘The Corporate
Social Performance and Corporate Financial Perfor-
mance Debate’, Business & Society 36(1), 5–31.
Gupta, A.: 2005, A Report on Effectiveness of the Breaseeding
Promotion Network of India (BPNI) Activities on Infant
Feeding Policies and Practices in India, http://www.
bpni.org/cgi/effect.asp. Accessed 16 April 2005.
Handelman, J. M. and S. J. Arnold: 1999, ‘The Role of
Marketing Actions with a Social Dimension: Appeals
to the Institutional Environment’, Journal of Marketing
63(3), 33–48.
Handique, M.: 2008, ‘Companies Focus More on Social
Responsibility Projects in Villages’, livemint.com: The
Wall Street Journal, http://www.livemint.com/2008/
03/11000146/Companies-focus-more-on-social.html.
Accessed on 04 February 2009.
Hayes, A. S. and J. Pereira: September 20 1990, ‘Facing a
Boycott, Many Companies Bend’, Wall Street Journal,
pp. 1, 24.
Heal, G.: 2005, ‘Corporate Social Responsibility: An
Economic and Financial Framework’, The Geneva
598 Supriti Mishra and Damodar Suar
Papers on Risk and Insurance – Issues and Practice 30(3),
387–409.
Herbert, B.: 1996, ‘Nike’s Pyramid Scheme’, New York
Times, June 10, A.17–A.23.
Hoeffler, S. and K. L. Keller: 2002, ‘Building Brand
Equity Through Corporate Societal Marketing’, Jour-
nal of Public Policy and Marketing 21(1), 78–89.
Hoque, Z.: 2004, ‘A Contingency Model of the Associ-
ation Between Strategy, Environmental Uncertainty
and Performance Measurement: Impact on Firm Per-
formance’, International Business Review 13(4), 485–
502.
Huselid, M.: 1995, ‘The Impact of Human Resource
Management Practices on Turnover, Productivity and
Corporate Financial Performance’, Academy of Man-
agement Journal 38(3), 635–672.
Husted, B. W.: 2003, ‘Governance Choices for Corpo-
rate Social Responsibility: To Contribute, Collaborate
or Internalize?’, Long Range Planning 36(5), 481–498.
IndiaPRwire.com: 2007, ‘Announcing Karmayog CSR
Ratings of India’s Top 500 Companies’, http://www.
indiaprwire.com/pressrelease/other/200712156225.
htm. Accessed 10 December 2008.
Informatics (India) Limited: 2003, India Business Insight
Database (Informatics (India) Limited, India), http://
ibid.informindia.co.in/bsearch.asp.
Ittner, C. D. and D. F. Larcker: 1998, ‘Innovations in
Performance Measurement: Trends and Research
Implications’, Journal of Management Accounting Research
10(1), 205–238.
Ittner, C. D. and D. F. Larcker: 2000, ‘Non-Financial
Performance Measures: What Works and What Does
Not’, Knowledge@Wharton at http://knowledgewharton.
upenn.edu/article.cfm?articleid=279. Accessed 10
December 2008.
Kaplan, R. S. and D. P. Norton: 2001, ‘Transforming the
Balanced Scorecard from Performance Measurement
to Strategic Management: Part 1’, Accounting Horizon
15(1), 87–104.
Khan, A. F. and A. Atkinson: 1987, ‘Managerial Attitudes
to Social Responsibility: A Comparative Study in India
and Britain’, Journal of Business Ethics 6(6), 419–432.
Kinder, P., S. Lydenberg and B. Cohen: 2005, ‘Socrates:
The Corporate Social Ratings Monitor’, http://www.
kld.com/research/socrates/indicators.html. Accessed 12
April 2005.
Kirmani, A.: 1997, ‘Advertising Repetition as a Signal of
Quality: If It’s Advertised So Much, Something Must
Be Wrong’, Journal of Advertising 26(3), 77–90.
Klassen, R. D. and C. P. Mc Laughlin: 1996, ‘The Impact
of Environmental Management on Firm Performance’,
Management Science 42(8), 1199–1214.
Koys, D. J.: 2001, ‘The Effects of Employee Satisfaction,
Organizational Citizenship Behavior, and Turnover
on Organizational Effectiveness: A Unit-Level, Lon-
gitudinal Study’, Personnel Psychology 54(1), 101–114.
KPMG: 2005, KPMG International Survey of Corporate
Responsibility Reporting 2005 (KPMG Global Sustain-
ability Services: Amsterdam), http://www.kpmg.org.
Krishna, C. G.: 1992, Corporate Social Responsibility in
India (Mittal Publications, New Delhi).
Kumar, R., D. F. Murphy and V. Balsari: 2001, Altered
Images: The 2001 State of Corporate Responsibility in
India Poll. Understanding and Encouraging Corporate
Responsibility in South Asia – Update 1 (Tata Energy
Research Institute, New Delhi).
Landon, S. and C. E. Smith: 1997, ‘The Use of Quality and
Reputation Indicators by Consumers: The Case of Bor-
deaux Wine’, Journal of Consumer Policy 20(3), 285–297.
Lee, M. P.: 2008, ‘A Review of the Theories of Cor-
porate Social Responsibility: Its Evolutionary Path and
the Road Ahead’, International Journal of Management
Reviews 10(1), 53–73.
Leff, E.: 2004, Community Development Vehicles Adopted by
Corporates: An Exploration (Asia Pacific Philanthropy
Consortium, Centre for Advancement of Philanthropy
and Partner-in-Change, New Delhi).
Lev, B.: 2000, ‘Knowledge Management: Fad or Need?’,
Research Technology Management 43(5), 9–10.
Luo, X. and C. B. Bhattacharya: 2006, ‘Corporate Social
Responsibility, Customer Satisfaction and Market
Value’, Journal of Marketing 70(4), 1–18.
Mahajan, A.: 2004, ‘Enhancing Business Community
Relations: The Role of Volunteers in Promoting
Global Corporate Citizenship’, National Research
Report, New Delhi.
Maignan, I. and O. C. Ferrell: 2001, ‘Corporate Citi-
zenship as a Marketing Instrument – Concepts, Evi-
dence and Research Directions’, European Journal of
Marketing 35(3/4), 457–484.
Margolis, J. D. and J. P. Walsh: 2003, ‘Misery Loves
Companies: Rethinking Social Initiatives by Business’,
Administrative Science Quarterly 48(2), 268–305.
McGuire, J. B., A. Sundgren and T. Schneeweis: 1988,
‘Corporate Social Responsibility and Firm Financial
Performance’, Academy of Management Journal 31(4),
854–872.
McVea, J. F. and R. E. Freeman: 2005, ‘A Names-and-
Faces Approach to Stakeholder Management’, Journal
of Management Enquiry 14(1), 57–69.
Miles, M. P. and J. G. Covin: 2000, ‘Environmental
Marketing: A Source of Reputational, Competitive,
and Financial Advantage’, Journal of Business Ethics
23(3), 299–311.
599CSR and Firm Performance
Moore, G.: 2001, ‘Corporate Social and Financial Per-
formance: An Investigation in the U.K. Supermarket
Industry’, Journal of Business Ethics 34(3/4), 299–315.
Moskowitz, M.: 1972, ‘Choosing Socially Responsible
Stocks’, Business and Society 1(Spring), 71–75.
Nemkumar, H.: 2000, ‘India: A Research Head’s Per-
spective’, Report on Corporate Governance: Emerging
Markets Equities Research, http://web.management.
mcgill.ca/Art.Durnev/clsa_2000.pdf. Accessed 5 Jan-
uary 2009, pp. 60–61.
Ong, L. K.: 2003, Does Adding Non-Financial Value Drivers
to a Summary Financial Measure Improve the Learning and
Performance of Managers? (University of South Califor-
nia, Los Angeles).
Orlitzky, M., F. L. Schmidt and S. L. Rynes: 2003,
‘Corporate Social and Financial Performance: A Meta-
Analysis’, Organization Studies 24(3), 403–411.
Owen, C. L. and R. F. Scherer: 1993, ‘Social Respon-
sibility and Market Share’, Review of Business 15(1),
11–17.
Pava, M. L. and J. Krausz: 1996, ‘The Association
Between Corporate Social Responsibility and Finan-
cial Performance – The Paradox of Social Cost’, Journal
of Business Ethics 15(3), 321–357.
PiC (Partners in Change): 2004, Third Report on Corporate
Involvement in Social Development in India (PiC, New
Delhi).
Podsakoff, P. M., S. B. MacKenzie and N. P. Podsakoff:
2003, ‘Common Method Biases in Behavioural
Research: A Critical Review of the Literature and
Recommended Remedies’, Journal of Applied Psychol-
ogy 88(5), 879–903.
Prahalad, C. K. and G. Hamel: 1990, ‘The Core Com-
petence of the Corporation’, Harvard Business Review
68(3), 79–91.
Prowess: 2005, Prowess Version 2.5 (CMIE, New Delhi),
www.cmie.com.
Riordan, C. M., R. D. Gatewood and J. B. Bill: 1997,
‘Corporate Image: Employee Reactions and Implica-
tions for Managing Corporate Social Performance’,
Journal of Business Ethics 16(4), 401–412.
Robins, J. and M. Wiersema: 1995, ‘A Resource-Based
Approach to the Multi-Business Firm: Empirical
Analysis of Portfolio Interrelationships and Corporate
Financial’, Strategic Management Journal 16(4), 277–299.
Rockefeller, R. C.: 2003, ‘Turn Public Problems into
Private Account’, Harvard Business Review 81(8), 129–
137.
Rosewicz, B.: April 20 1990, ‘Americans are Willing to
Sacrifice to Reduce Pollution, They Say’, The Wall
Street Journal (New York), p. Al.
Ruf, B. M., K. Muralidhar, R. M. Brown, J. J. Janney
and K. Paul: 2001, ‘An Empirical Investigation of the
Relationship Between Change in Corporate Social
Performance and Financial Performance: A Stake-
holder Theory Perspective’, Journal of Business Ethics
32(2), 143–156.
Russo, M. V. and P. A. Fouts: 1997, ‘A Resource Based
Perspective on Corporate Environmental Performance
and Profitability’, Academy of Management Journal 40(3),
534–559.
Sagar, P. and A. Singla: 2004, ‘Trust and Corporate Social
Responsibility: Lessons from India’, Journal of Com-
munication Management 8(3), 282–290.
SAI (Social Accountability International): 2001, Social
Accountability 8000 (SAI, New York).
Schmidheiny, S.: 1992, Changing Course: A Global Busi-
ness Perspective on Development and the Environment (MIT
Press, Cambridge, MA).
Schwaiger, M.: 2004, ‘Components and Parameters of
Corporate Reputation – An Empirical Study’, Schma-
lenbach Business Review 56(1), 46–71.
Sen, S. and C. B. Bhattacharya: 2001, ‘Does Doing Good
Always Lead to Doing Better? Consumer Reactions to
Corporate Social Responsibility’, Journal of Marketing
Research 38(2), 225–243.
Sen, S., C. B. Bhattacharya and D. Korschun: 2006, ‘The
Role of Corporate Social Responsibility in Strength-
ening Multiple Stakeholder Relationships: A Field
Experiment’, Journal of the Academy of Marketing Science
34(2), 158–166.
Shane, P. and B. Spicer: 1983, ‘Market Response to
Environmental Information Produced Outside the
Firm’, Accounting Review 58(July), 521–538.
Singh, R. and K. Bhagat: 2004, ‘Corporate Initiatives in
Indian Agriculture’, Indian Management 43(2), 72–79.
Somavia, J.: 2000, ‘Business. Its Direct Stake in Putting
Human Needs First’, UN Chronicle 37(2), 42.
Sood, A. and B. Arora: 2006, ‘The Political Economy of
Corporate Responsibility in India’, Technology,
Business and Society (18), United Nations Research
Institute for Social Development (UNRISD) Program
Paper, Geneva.
Springer, J.: 2006, ‘Whole Foods Posts 22% Sales
Growth’, Supermarket News 54(7), 8.
Teoh, H. Y. and G. Y. Shiu: 1990, ‘Attitudes Towards
Corporate Social Responsibility and Perceived
Importance of Social Responsibility Information
Characteristics in a Decision Context’, Journal of
Business Ethics 9(1), 71–77.
Teoh, S. H., I. Welch and C. P. Wazzan: 1999, ‘The
Effect of Socially Activist Investment Policies on the
Financial Markets: Evidence from the South African
Boycott’, Journal of Business 72(1), 35–89.
Tsang, E. W. K. and K. Kwan: 1999, ‘Replication and
Theory Development in Organizational Science: A
600 Supriti Mishra and Damodar Suar
Critical Realist Perspective’, Academy of Management
Review 24(4), 759–780.
Turban, D. B. and D. W. Greening: 1997, ‘Corporate
Social Performance and Organizational Attractiveness
to Prospective Employees’, Academy of Management
Journal 40(3), 658–763.
Ullman, A. A.: 1985, ‘Data in Search of a Theory: A
Critical Examination of the Relationships Among
Social Performance, Social Disclosure, and Economic
Performance of U.S. Firms’, Academy of Management
Review 10(3), 540–557.
Venkatraman, N. and V. Ramanujam: 1987, ‘Measure-
ment of Business Economic Performance: An Exami-
nation of Method Convergence’, Journal of Management
13(1), 109–122.
Verschoor, C. C.: 1998, ‘A Study of the Link Between a
Corporation’s Financial Performance and Its Com-
mitment to Ethics’, Journal of Business Ethics 17(13),
1509–1516.
Vogel, D.: 2005, The Market for Virtue: The Potential and
Limits of Corporate Social Responsibility (Brookings
Institution Press, Washington, DC).
Waddock, S. A. and S. B. Graves: 1997, ‘The Corporate
Social Performance – Financial Performance Link’,
Strategic Management Journal 18(4), 303–320.
Wood, D. J.: 1991, ‘Corporate Social Performance
Revisited’, Academy of Management Review 16(4), 691–
718.
Wright, P. and S. Ferris: 1997, ‘Agency Conflict and
Corporate Strategy: The Effect of Divestment on
Corporate Value’, Strategic Management Journal 18(1),
77–83.
Wu, M. L.: 2006, ‘Corporate Social Performance, Cor-
porate Financial Performance, and Firm Size: A Meta-
Analysis’, Journal of American Academy of Business 8(1),
163–171.
Youndt, M., S. Snell, J. Dean and D. Lepak: 1996,
‘Human Resource Management Manufacturing
Strategy and Firm Performance’, Academy of Manage-
ment Journal 39(4), 836–866.
Zahra, S. A. and M. S. Latour: 1987, ‘Corporate Social
Responsibility and Organizational Effectiveness: A
Multivariate Approach’, Journal of Business Ethics 6(6),
459–467.
Indian Institute of Technology Kharagpur,
Kharagpur, India
E-mail: [email protected]
601CSR and Firm Performance