Embed Size (px)
Citation preview

Intangible Capital
IC, 2016 – 12(5): 1529-1590 – Online ISSN: 1697-9818 – Print ISSN: 2014-3214
http://dx.doi.org/10.3926/ic.721
CSR and technology companies: A study on its implementation,
integration and effects on the competitiveness of companies
Juan Andres Bernal-Conesa1 , Carmen de Nieves-Nieto1 , Antonio-Juan Briones-Peñalver2
1Centro Universitario de la Defensa de San Javier. Departamento de Ciencias Económicas y Jurídicas. Universidad
Politécnica de Cartagena(UPCT) (Spain)
2Facultad de Ciencias de la Empresa. Dpto. de Economía de la Empresa. Universidad Politécnica de Cartagena
(UPCT) (Spain)
[email protected], [email protected], [email protected]
Received September, 2016
Accepted October, 2016
Versión en español
Abstract
Purpose: In this paper, a structural equation model is presented in order to explain the
motivations of implementing Corporate Social Responsibility (CSR) in Spanish technology
companies and its linkage with others standardized management systems before CSR
implementation. It also examines whether CSR influences the competitiveness of these
companies.
Design/methodology: The study was conducted in companies located in Spanish Science and
Technology Parks. For this study, a survey was sent and structural equation model was used.
Findings: Model results show that there is a positive, direct and statistically significant
relationship between the motivations, previous management systems, implementation of CSR
and the real integration of CSR in the organization.
-1529-

Intangible Capital – http://dx.doi.org/10.3926/ic.721
Research limitations/implications: Limitations are determined by the technique used for the
proposed model: structural equations, which assume linearity of the relationship between latent
variables.
Practical implications: Companies can use the results of this study as a foot hold to enhance
the integration of CSR based on previous management systems and take advantage of synergies
between them, since the integration of CSR has a direct relationship with the competitiveness
of the company.
Originality/value: The link between the motivations of CSR, CSR actions and their
integration in technology companies are reliably and empirically demonstrated.
Keywords: Corporate Social Responsibility, Motivation, Technology companies, Integration, Structure
equation modelling
Jel Codes: M14
1. Introduction
If something characterizes the business environment in recent years has been the acute suffering
economic crisis, which cannot be attributed merely to a change in the economic cycle but also to the
absence of values and ethical principles in the functioning of organizations (Melé, Argandoña, Runde
& Sánchez, 2011). Therefore, a solution for this crisis may be from social innovations (Goldsmith,
2010) and Corporate Social Responsibility (CSR) is considered an innovation in business management
and as such can reach their full strategic value and even there are organizations which believe that CSR
protects against the negative effects of the economic crisis (Janssen, Sen & Bhattacharya, 2015). In this
context, the classic study of CSR have expanded the scope of the economic crisis (Pérez & del Bosque,
2012) and their effective management can help organizations minimize the negative impacts of the
recession.
Moreover, organizations are constantly adapting to economic changes with the intention to have a
better chance of survival in the market. A key factor for this is innovation (Bernardo, 2014).
Damanpour and Gopalakrishnan (2001) define it as "the adoption of an idea or a new behavior in the
organization". CSR contributes to and encourages innovation in three ways:
-1530-

Intangible Capital – http://dx.doi.org/10.3926/ic.721
• innovation resulting from dialogue with various stakeholders both internal and external to the
company,
• identifying new business opportunities arising from social demands and environmental
products and more efficient processes or new forms of business aimed at the socalled base of
the pyramid, formed by people with less resources (Prahalad & Ramaswamy, 2004) and
• creating better places and ways of working that encourage innovation and creativity, such as
those based on greater employee participation and confidence in them (Benito Hernandez &
Esteban Sanchez, 2012).
Therefore, companies should adopt formalized CSR practices and thus establish the procedures and
tools that are aligned with their corporate strategy (Bocquet, Le Bas, Mothe & Poussing, 2013). So
much so that there are studies that suggest that CSR has a significant positive contribution to national
competitiveness and even levels of quality of life (Boulouta & Pitelis, 2014). In other words, it is
expected that innovation will increase when the company is responsible and that increased innovation
translates into greater competitive success, enhancing the effect itself already exercised CSR in the
competitiveness of the company (Vázquez & Sánchez, 2013). As suggest Vilanova, Lozano and Arenas
(2009) whether CSR is integrated into business processes generates innovative practices and therefore
improved competitiveness and further this integration can be facilitated by standardized management
processes previously implanted.
CSR has become an increasingly important factor for competitiveness perceived by enterprises
(Turyakira, Venter & Smith, 2014). Competitiveness is a multidimensional concept that refers how
create sustainable competitive advantage which can be used both nationally, and at the companies level
(Vilanova et al., 2009). Hence, the effect of CSR on competitive success (obtaining positive results for
the company in terms of market positioning and ranging beyond the financial sphere) (Vázquez &
Sánchez, 2013) is higher in sectors with high competitiveness (such as the technology sector)and
following a proactive (versus reactive) strategy (Marín Rubio & De Maya, 2012), in which CSR is a
competitive advantage, while it is lower in uncompetitive sectors, where companies continue
traditionally differentiating offering advantages brand, price, quality and distribution (Rives & Bañón,
2008).
Currently, there is a growing number of Spanish companies that believe they should contribute to
sustainable development through the planning operations in order to promote economic growth and
increasing its productivity and competitiveness while ensuring the protection of the environment and
-1531-
Intangible Capital – http://dx.doi.org/10.3926/ic.721
promoting social responsibility, and thus fulfilling the general interests (Prado-Lorenzo, Gallego-
Álvarez, García-Sánchez & Rodriguez-Dominguez, 2008) of the society, since investment in CSR
initiatives can be a source of competitive advantage (Apospori, Zografos & Magrizos, 2012) and a way
to improve the economic performance of companies (Hur, Kim & Woo, 2014).
Being aware of these conditions, the aims of this article are:
• investigating the motivations of technology companies for taking part in CSR initiatives and
implement policies and activities within it - CSR practices that create innovations in processes
(Benito Hernandez & Esteban Sanchez, 2012) - integrating them into the management system
itself of any organization and
• analyzing the enabling factors of implementation and integration of CSR within the
organization and
• the direct influence of the integration of CSR in the competitiveness of the technological
company.
2. Review of the literature
Academically, CSR is often used as a comprehensive term to describe a variety of issues relating to the
responsibilities of business (Hillenbrand, Money & Ghobadian, 2013). Waddock (2004), for example,
defines CSR as defines CR as “the degree of (ir)responsibility manifested in a company’s strategies and
operating practices as they impact stakeholders and the natural environment day-to-day”. However,
there is no universally accepted definition of CSR (Dahlsrud, 2008), although it can be stated that CSR
CSR is not only about strict compliance of existing legal obligations, but also voluntary integration in
the governance and management, strategy, policies and procedures, social, labour-related and
environmental concerns and respect for human rights arising from the relationship and transparent
dialogue with its stakeholders, and taking responsibility for the consequences and impacts resulting
from the actions of an organization (Mendoza, De Nieves & Briones, 2010).
On the other hand, much of the literature on CSR has focused on the impact of CSR on the level of
enterprises competitiveness (Boulouta & Pitelis, 2014), for both large and small firms and in different
sectors (Battaglia, Testa, Bianchi, Iraldo & Frey, 2014; Vidales & Ortiz, 2014). Nonetheless, any studies
-1532-

Intangible Capital – http://dx.doi.org/10.3926/ic.721
had been founded on technology companies competitiveness, so in the following sections a review will
take place and the hypothesis of this article will be proposed.
2.1. CSR and Spanish technology sector
In the scientific literature there are an important number of studies on CSR both in large companies
(Melé, Debeljuh & Arruda, 2006), and small ones (eg. Baumann-Pauly, Wickert, Spence & Scherer,
2013; Vázquez-Carrasco & López-Pérez, 2013; Herrera, Larrán & Martínez-Martínez, 2013) in different
sectors eg. financial (Pérez Ruiz & Rodriguez del Bosque, 2012) and Banks (Alcaraz & Rodenas, 2013).;
Martínez-Campillo, Head-García & Marbella-Sánchez, 2013), energy (Moseñe, Burritt, Sanagustín,
Moneva & Tingey-Holyoak, 2013) and Public Administration (Bernal Conesa, De Nieves Nieto &
Briones Peñalver, 2014; García-Sanchez Frias-Aceituno & Rodriguez-Dominguez, 2013) and even one
that refers to technology companies (Guadamillas-Gómez, Donate-Manzanares & Skerlavaj, 2010); the
possible motivations to adopt CSR (Prado-Lorenzo et al., 2008; Graafland & Schouten, 2012), and its
integration with other management systems in the company (Bernardo, 2014; Von Ahsen, 2014; Castka
& Balzarova, 2008). However, no studies have been found on CSR, their motivations and integration
technology companies, which are a constant source of innovation, not only in processes but also
products. Therefore, information about technology sector is scarce because the motivations of CSR
and its integration have not been sufficiently studied. Thus, it is estimated interesting depth study of it
in Spanish technology companies, since previous research has shown that organizations with a strategic
focus on innovation committed to improve their internal organizational capacities to become more
competitive in a global environment (Suñe, Bravo, Mundet & Herrera, 2012). In fact to promote
product and process innovations, companies must adopt formalized CSR practices as this has a positive
contribution to the competitiveness (Boulouta & Pitelis, 2014).
Four remarkable ways established in the scientific literature whereby CSR can create competitive
advantages (Hockerts, 2015). These are:
• risk reduction,
• the efficiency gains,
• social reputation and
• the creation of new markets.
-1533-

Intangible Capital – http://dx.doi.org/10.3926/ic.721
Several authors (Perrini, Russo & Tencati, 2007; Spence, 2007) have identified the sector as one of the
elements affecting the organizational culture in adopting and integrating CSR practices in the strategic
plans of organizations. For example, Perrini et al. (2007) found that companies in the sector of
Information and Communications Technology (ICT) were more likely to monitor and report on the
behaviour of their CSR, while manufacturing firms were more interested in motivating employees
through voluntary activities in the community.
A study developed by Lorenzo, Sánchez and Álvarez (2009) states that the fact of belonging to the
technology and telecommunications sector has a positive but not significant effect in the dissemination
of CSR actions.
In certain technology sectors product development periods are extremely long and businesses often
have negative results during the first years of life, put forward higher financing difficulties. In these
cases, the financial indicators are not effective in assessing the potential of companies, being more
appropriate intangible assets and knowledge - based (Quintana García, Benavides Velasco, & Guzman
Parra, 2013).
Among these intangible assets we can find the CSR (Lindgreen, Antioco, Palmer & Heesch, 2009)
which, as some studies have shown, has a positive relationship with the financial benefits (Hammann,
Habisch & Pechlaner, 2009).
In addition, the activity of a company has a high social impact when it operates in ICT (Luna Sotorrío
& Fernández Sánchez, 2010).
That is why we will investigate and analyze the situation of the Spanish technology companies against
CSR, taking as a starting point located in Spanish Scientific and Technological Parks because in them
there is a greater presence of high-tech companies (Vásquez-Urriago, Barge-Gil & Rico, 2012).
Companies located in technology parks show a greater effort in innovation (Vásquez-Urriago, Barge-
Gil, Rico & Paraskevopoulou, 2014) and a significantly higher level of cooperation shown in the case
of these companies (Vásquez-Urriago et al., 2012).
“Science park” concept was originated in the late 1950s in the American university context (Jimenez-
Zarco, Cerdan-Chiscano & Torrent-Sellens, 2013). The success of technology parks such as Silicon
Valley in California and Cambridge in the UK has influenced to replicate the model in other countries
(Ratinho & Henriques, 2010).
-1534-

Intangible Capital – http://dx.doi.org/10.3926/ic.721
In Spain, first parks emerged in the mid-1980s, following a strategy of attracting high - tech companies
(Jimenez-Zarco et al., 2013) with the aim of contributing to economic and business growth at the local
or regional level.
In 1988 the Spanish Science and Technology Parks Association (APTE) was created with the goal of
making science and technology in key parts of Spanish innovation parks system. APTE takes care of
contacting the scientific world inside and outside the parks with the business parks for the creation and
transfer of knowledge, by setting regional innovation systems (Jimenez-Zarco et al., 2013) that is why
Spain is an interesting case in science parks unlike other established in the United States or United
Kingdom (Vásquez-Urriago et al., 2014).
Currently there are 68 science and technology parks associated to APTE and welcome them home
businesses, nature and different interests: academic spin-offs Technological Base (EBT), Knowledge
Based Companies (EBC) and start-ups (Jimenez-Zarco et al., 2013).
Albahari, Catalano and Landoni (2013) show how some parks contribute significantly to regional
development, economic and social terms, since they favor the development of a specialized and
innovative industry, and create the seed for the creation of an industrial cluster.
Technology parks have in common the creation of technology companies and attract companies
already established in order to promote regional development through a technological approach and the
creation of employment and welfare (Ratinho & Henriques, 2010; Jimenez-Zarco et al., 2013), so the
technology parks would be directly related to two of the three dimensions of CSR (economic and
social) and generate a network of cooperation between technology companies, which can increase the
capacity of general knowledge and positively expand relations with own agents of business, if we add
the adoption of CSR policies, will allow greater flexibility and opportunities to address social problems
with innovative products or services, increasing the ability to attract, retain and motivate staff and
access to new knowledge and information, so companies could increase their performance and
competitiveness (Benito Hernandez & Esteban Sanchez, 2012).
Being located in a technology park has positive effects on product innovation and increases the odds of
being innovative between 10% and 20%, and increases sales due to new products about 32% (Vásquez-
Urriago et al., 2014).
-1535-

Intangible Capital – http://dx.doi.org/10.3926/ic.721
In addition, companies located in parks are smaller on average, have higher export orientation, belong
to a group of companies more often, are larger share of ups and have less frequent decrease in
turnover by sale or closure of the company (Vásquez-Urriago et al., 2012).
2.2. Motivations of CSR and integration
Despite the difficulty of providing a definition of CSR (Dahlsrud, 2008), general idea extracted from all
of them is that CSR means that companies must conduct the business by way of proving consideration
to a wider social environment with the purpose of serving constructively the society needs.
2.2.1. Motivations for the implementation of CSR
The motivations for the implementation of CSR have been studied generally (Graafland & Schouten,
2012) in different countries (Prado-Lorenzo et al., 2008; Prajogo, Tang & Lai, 2012) and sectors, finding
two different types of primary motivations: external or extrinsic to the organization, where the financial
or economic nature to can be pointed in its relation benefit (Graafland & Schouten, 2012) and internal
or intrinsic to the organization, which not only have to do with benefit of the organization but also
with the staff values and beliefs that belong to organizations (Graafland & Schouten, 2012).
2.2.2. Integration of CSR in the organization
Referring to the integration of CSR in business literature reveals that very few companies have it
integrated effectively (Bernardo, Casadesus, Karapetrovic & Heras, 2012; Karapetrovic & Casadesús,
2009), despite the benefits of such integration (Bernardo, Simon, Tarí & Molina-Azorín, 2015; Simon,
Karapetrovic & Casadesús, 2012).
Therefore, the present study is based on the existence of different motivations for CSR, but also trying
to detect which are these for technology companies, if there are "enablers" for their integration and if
through this integration of CSR could contribute significantly to the competitiveness of the company.
-1536-
Intangible Capital – http://dx.doi.org/10.3926/ic.721
3. Conceptual model and hypotheses
Based on the previous sections and analyzing the previous work cited therein concerning the existence
of different motivations to adopt a CSR strategy in companies and their influence on it, this section try
to focus which are these motivations for CSR in Spanish technology companies and once they have
been detected how they could facilitate a proactive CSR strategy, proposing the following research
hypotheses:
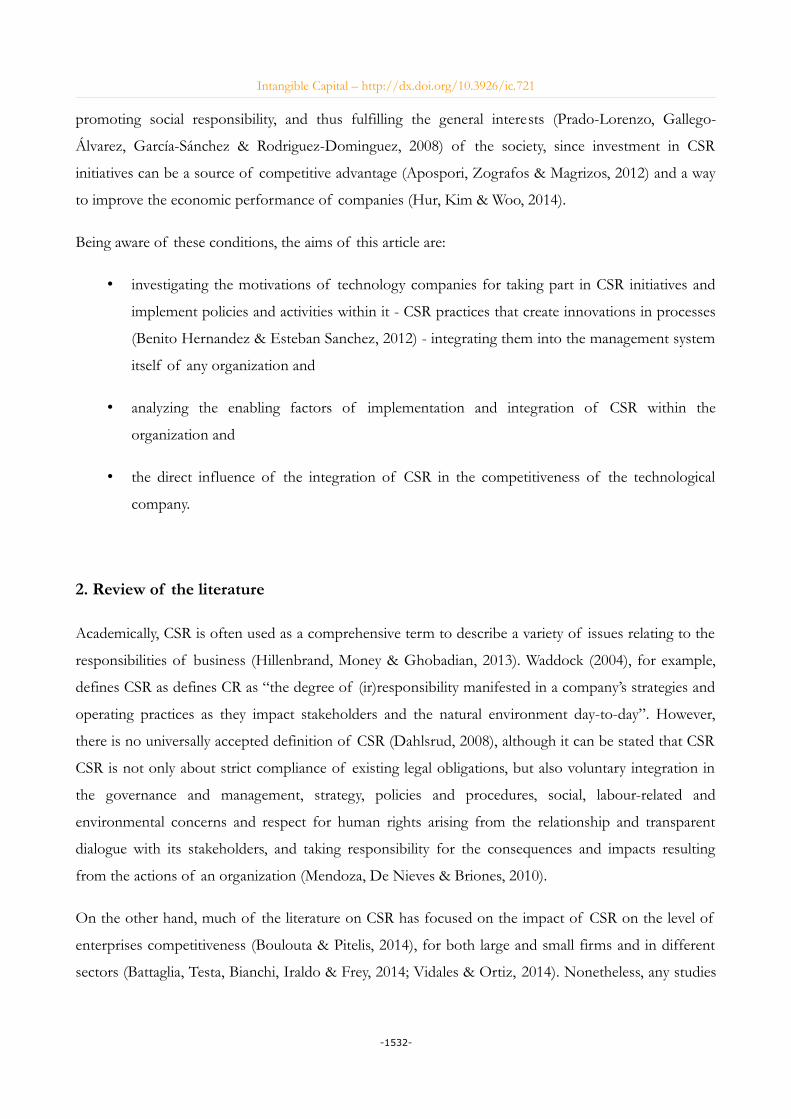
H1: There are different motivations for adopting CSR measures in order to facilitate the definitive implementation
of CSR in the technology company.
H2: (a) the existence of standardized management systems (MS) -as Quality (Q), Environment (EMS) and /
or Occupational Safety and Health (OSH) - prior to the adoption ofCSR measures facilitate the implementation
of CSR and (b) help to their integration in the organization.
H3: The CSR integration into the company will be affected directly and positively by the ease of implementation
of CSR measures.
H4: The CSR integration in the strategy of the organization has a positive influence on the competitiveness of the
technology company.
These assumptions are summarized in the conceptual model reflected in Figure 1.
Figure 1. Conceptual model of hypothesis
-1537-

Intangible Capital – http://dx.doi.org/10.3926/ic.721
4. Methodology
There are a variety of methods for aggregating existing data in the social sciences (Rodríguez Gutiérrez,
Fuentes García & Sanchez Canizares, 2013). However, these are not generally applied in the field of
CSR research. One of the most widely used methods is the factorial analysis, based mainly in works
whose study is based on surveys (Rodríguez Gutiérrez et al., 2013).
To collect data, a total of 489 invitations were sent by email to access a direct link to the questionnaire.
Finally, 98 companies completed the questionnaire, representing a response rate of 20, 04%. In the case
of surveys using web tools including a link to access the survey, the response rate is around 30%
(Arevalo, Aravind, Ayuso & Roca, 2013) although there are empirical studies with a rate of valid
response between 10% and 20% (Ramos, Manzanares & Gomez, 2014; Chow & Chen, 2012; Homburg
& Stebel, 2009).
For this study a specific questionnaire was designed, using the Likert scale 1-5 (1 "strongly disagree"
and 5 "strongly agree"), because a large number of questions refer to issues that cannot be quantified
with a specific value (e.g. implement CSR measures to increase employee motivation). Overall, the
questionnaire included questions about the motivations of CSR implementation, integration with other
management systems, ease of integration, adopting a CSR strategy and stakeholder for the
organization, in line with other studies (Vázquez & Sánchez, 2013; Prajogo et al., 2012; De Godos
Díez, Fernandez Gago, Head & García, 2012; Law & Gunasekaran, 2012; Díez & Gago, 2011).
To carry out the analysis, a structural equation model (SEM) has been used. The structural equation
models are statistical procedures that allow to measure the functional hypothesis, predictive and causal,
these being essential multivariate statistical tools for understanding many elements of research and
conduct basic or applied research in the behavioral sciences, management, health and social (Bagozzi &
Yi, 2011).
In structural equation modeling as Vasquez and Sanchez (2013) suggest, more complex relationships
(with direct and indirect effects) while working with latent variables (not directly observable and must
be measured by indicators) are assumed. This is the difference with classical multivariate regression
models.
For the constructs formation has been used the following indicators, based on the literature (Battaglia
et al, 2014; Gallardo-Vazquez & Sanchez-Hernandez, 2014; Turyakira et al., 2014; Asif, Searcy, Zutshi
& Fisscher, 2013; Asif, Searcy, Zutshi & Ahmad, 2011; Lee, Park & Lee, 2013):
-1538-

Intangible Capital – http://dx.doi.org/10.3926/ic.721
Motivations
Internal
MO 1 Improve working conditions of my workers M O2 Reduce absenteeism MO 3 Increase employee motivation MO 4 Improve training and employee training MO 5 Improve the effectiveness and control of operations MO6 Building synergy between management systems
External
MO7 Law compliance
MO8 Comply with indications of stakeholders: customers, shareholders, environmental groups.
MO9 Improve relations with the community where the organization is established MO10 Safeguard the rights of consumers MO11 Reduce customer claimsMO12 Protecting the environment MO13 Encouraging sustainable development MO14 Improve the image of the company by match similar competitor actionsMO15 Be approved as provider of public bodiesMO16 Be approved as provider of private bodiesMO17 Reduce sanctions from public bodiesMO18 Get aid or subsidies from public bodies
MO19 Meet requirements of third parties(e.g. administration, financial institutions, etc).
Implantation Im1 Prior knowledge about implementation difficulties
Im2 Advantages to have a standardized management system (e.g.processes standardization, staff training)
Im3 Internal and external audit processes are known before certification
Im4 Different systems requirements are known, (e.g. legal compliance, management review, audits, indicators ...)
Im5 Synergies between systems are arising (e.g. sharing resources, common documentation, etc.)
Integration Int1 Resources sharedInt2 Documented procedures SharedInt3 Requirements sharedInt4 Management manual is unifiedInt5 Staff sharedPrevious Management Systems SGP1 There is an only system management department SGP2 Workers are aware management systems and apply them daily without difficulties
SGP3 Certified systems are themselves the management system of the organization therefore the certificate is not a matter of image
Competitiveness COM1 Increased sales are achieved COM2 Saving cost COM3 Improving access to finance COM4 Revenue grownCOM5 Improved company image or brand COM6 Access to new markets or customers COM7 Competitive advantages are obtainedCOM8 ROI is improvedCOM9 Customer satisfaction is improvedCOM10 Collaborations are obtained with other organizations COM11 Profitability is increasedCOM12 Increasing financial returnsCOM13 Absenteeism is recucedCOM14 Increase of employee satisfactionCOM15 Reducing labor unrest due to social affairsCOM16 Reconciling work and family life is providedCOM17 Employee participation in decision - making processes
-1539-

Intangible Capital – http://dx.doi.org/10.3926/ic.721
Competitiveness COM18 Increase investment in human resources, eg with training activities, career plan...
COM19 Increases equal opportunities at work, eg employment of disabled people, promoting women to leadership positions
COM20 Reducing the number of accidentsCOM21 Improves occupational health and safetyCOM22 The external image of the organization is improved COM23 The internal image of the organization is improvedCOM24 Employee motivation is favoredCOM25 Leadership is demonstrated in the communityCOM26 Improve relationships with the community COM27 Cultural and sports activities in the community sponsor COM28 It participates in other public actions positively COM29 Consumer rights are emphasized
Table 1. Indicators. Note: Indicators in bold they are those who were validated in this study for the
different scales of constructs
The structural equation models include two levels of analysis (the measurement model and the
structural model) (Hair Jr., Sarstedt, Hopkins & Kuppelwieser, 2014). Measurement model determines
the relationships between the latent variables (constructs) and their indicators. Structural model
examines the relationship between constructs (Chen & Chang, 2011), which includes determining
whether the structural relationships are significant and meaningful, and testing hypotheses. Sum up,
structural model is similar to performing a regression but with explanatory power (Vázquez & Sánchez,
2013) analysis, studying the direct and indirect effects set of constructs.
4.1. Statistical analysis
The technique chosen within SEM is known as Partial Least Squares (PLS), for different reasons
because:
• PLS-SEM has been broadly used in prior IT research (Wang, Chen & Benitez-Amado, 2015
technology; Chen & Chang, 2011; Pavlou & El Sawy, 2006);
• the use of PLS is recommended when the theoretical knowledge of a topic is scarce (Hair Jr.
et al., 2014) as is the case (RSC and technology companies) and also PLS-SEM is more
appropriate for causal applications and theory buildings (Roldán & Sánchez-Franco, 2012;
Henseler et al., 2014) although it can also be used for confirming all these theories
(confirmatory analysis) through the goodness of fit of the global structural model (Dijkstra &
Henseler, 2015),
-1540-

Intangible Capital – http://dx.doi.org/10.3926/ic.721
• PLS can estimate models with reflective and formative indicators without problem of
identification (Vinzi, Chin, Henseler & Wang, 2010) because PLS path modeling works with
weighted composites rather than factors (Gefen, Rigdon & Straub, 2011);
• PLS can be estimated models with small samples, in fact, the PLS modeling algorithms tend to
get results with high levels of statistical power (Reinartz, Haenlein & Henseler, 2009), even
when the sample size is very modest (Rigdon, 2014). Thus, and following Henseler et al.
(2014) used PLS as a remarkable statistical tool for management and research organizations.
The software used was SmartPLS 2.0 M3, developed by Ringle, Wende and Will in 2005. Since
SmartPLS is an estimation model and SEM analysis, uses the estimation process in two steps, evaluating
the model measurement and structural model (Hair Jr. et al., 2014). First, the measurement model
where the relationship between the indicators and the construct is determined (Roldán & Sánchez-
Franco, 2012). Secondly, the estimation of the structural model, where relationships are evaluated
between different constructs. The following criteria facilitate this assessment: path coefficients (β) and
their significance levels (t-student), coefficient of determination (R2) andcross-validated redundancy
(Q2) (Hair Jr. et al., 2014).
This sequence ensures that we have the indicators suitable for the constructs before trying to reach
conclusions about the relationships included in the model internal or structural (Roldán & Sánchez-
Franco, 2012).
4.1.1. Analysis of the measurement model
The measurement model defines the latent variables that the model will use, and assigns manifest
variables to each. The assessment of the measurement model for reflective indicators in PLS is based
on individual item reliability, construct reliability, convergent validity (Fornell & Larcker, 1981;
Tenenhaus, Vinzi, Chatelin & Lauro, 2005) and discriminant validity (Hair, Sarstedt, Ringle & Mena,
2012).
Individual item reliability is assessed by analyzing the standardized loadings (λ), or simple correlations
of the indicators with their respective latent variable (Hair Jr. et al., 2014).Individual item reliability is
considered adequate when an item has a factor loading (λ) that is greater than 0.707 on its respective
construct (Carmines & Zeller, 1979).In this study, all reflective indicators have loadings above 0.710
(boldface numbers in Table 2).
-1541-

Intangible Capital – http://dx.doi.org/10.3926/ic.721
Indicator motivations Implantation Integration Previous MS competitivenessMO7 0.786 0.403 0.215 0.230 0.144MO11 0.712 0.225 0.321 0.292 0.208MO14 0.732 0.382 0.346 0.336 0.155MO15 0.822 0.279 0.325 0.251 0.343MO16 0.848 0.352 0.345 0.339 0.304MO17 0.831 0.251 0.280 0.251 0.186MO19 0.867 0.349 0.364 0.256 0.398Im1 0.350 0.811 0.563 0.542 0.318Im2 0.258 0.710 0.409 0.397 0.119Im3 0.301 0.898 0.602 0.565 0.293Im4 0.434 0.930 0.704 0.603 0.326Im5 0.399 0.897 0.710 0.499 0.330Int1 0.353 0.632 0.901 0.653 0.381Int2 0.411 0.721 0.932 0.682 0.364Int3 0.362 0.698 0.902 0.663 0.288Int4 0.398 0.642 0.923 0.715 0.252Int5 0.188 0.448 0.765 0.640 0.387SGP1 0.332 0.480 0.742 0.892 0.465SGP2 0.366 0.534 0.637 0.879 0.413SGP3 0.249 0.640 0.654 0.917 0.344COM6 0.346 0.344 0.411 0.425 0.813COM7 0.242 0.274 0.207 0.287 0.837COM8 0.344 0.246 0.208 0.274 0.794COM11 0.246 0.202 0.257 0.325 0.816COM12 0.250 0.218 0.302 0.372 0.744COM13 0.395 0.256 0.252 0.344 0.798COM14 0.150 0.241 0.270 0.397 0.880COM15 0.231 0.315 0.375 0.510 0.858COM16 0.142 0.423 0.380 0.498 0.774COM17 0.206 0.361 0.453 0.525 0.841COM18 0.270 0.335 0.253 0.315 0.882COM20 0.292 0.268 0.277 0.272 0.841COM21 0.341 0.268 0.254 0.238 0.835COM23 0.154 0.078 0.138 0.269 0.752COM24 0.179 0.233 0.259 0.250 0.882COM25 0.274 0.096 0.302 0.317 0.783
Table 2. Loadings and cross-loadings for the measurement model
In the measurement models with reflective indicators, construct reliabilityis usually assessed using
composite reliability(c) (Hair Jr. et al., 2014) and Cronbach´s α (Castro & Roldan, 2013).
Following the guidelines proposed by Nunnally and Bernstein (1994) which suggest a value of 0.7 as a
benchmark for reliability modest applicable in the early stages of research. In this research, the five
constructs are analyzed high internal consistency as recommended levels are exceeded, as for the
composite reliability even the most restrictive threshold is exceeded proposed Nunnally and Bernstein
(1994) 0.8 (see Table 3).
-1542-

Intangible Capital – http://dx.doi.org/10.3926/ic.721
To assess convergent validity, we examine the average variance extracted (AVE). AVE values should be
higher than 0.50 (Fornell & Larcker, 1981) which means that 50 per cent -or more- of variance of
indicators should be accounted for the construct (Hair Jr. et al., 2014).
Discriminant validity indicates the extent to which a given construct differs from other constructs. In
other words, the construct measures what really intended. Discriminant validity was analyzed by two
methods (Gefen & Straub, 2005). On one hand Fornell and Larcker (1981) suggest the use of the
average variance shared between a construct and its measures (AVE). This method provides that the
construct must be formed with more variance than any other indicators construct.
To put this idea into operation the AVE square root of each construct should be greater than its
correlations with any other construct in the assessment. This condition is satisfied by all constructs in
relation to their other variables (see Table 3).
On the other hand, the second approach suggests that each item should load more highly on its
assigned construct than others, as occurs in the Table 2. This method is often considered less restrictive
than the previous (Henseler, Ringle & Sinkovics, 2009).
rc a AVE Competitiveness Implantation Integration Motivations Previous MSCompetitiveness 0.971 0.968 0.675 0.822Implantation 0.930 0.905 0.728 0.335 0.853Integration 0.948 0.931 0.786 0.376 0.713 0.887Motivations 0.926 0.907 0.643 0.308 0.415 0.390 0.802Previous MS 0.925 0.878 0.804 0.453 0.616 0.756 0.350 0.896
Table 3. Composite Reliability (rc), coefficients of convergent and discriminant validity
4.1.2. Analysis of the structural model
Once the reliability and validity of the measurement model are established, several steps need to be
taken to assess the hypothetical relationships within the structural model (Hair Jr. et al., 2014), which
assesses the weight and magnitude relations between different constructs.
The assessment of the model’s quality is based on its ability to predict endogenous constructs. The
following criteria facilitate this assessment: path coefficients β and their significance levels (t-student),
coefficient of determination (R2) and cross-validated redundancy (Q2) (Roldán & Sánchez-Franco,
2012).
-1543-
Intangible Capital – http://dx.doi.org/10.3926/ic.721
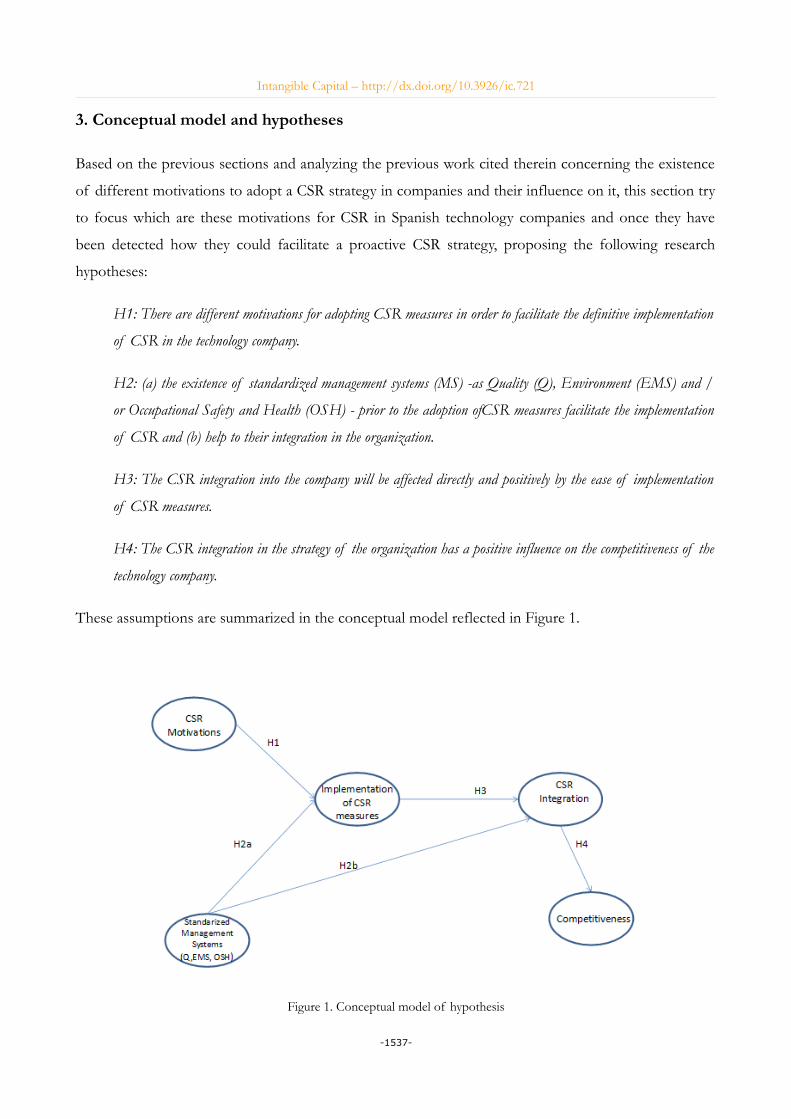
First, we tested the significance of all the paths from the structural model. Standardized path
coefficients allow to analyze the degree of accomplishment the hypotheses. In this regard, Chin (1998)
proposed that the analysis should provide standardized path coefficients exceeding values greater than
0.2 and ideally 0.3 so whether β<0.2 there is no causality and the hypothesis is rejected (Ramírez-
Correa, 2014).
According to Hair et al. (2012) one was used bootstrapping (5,000 resamples) to generate statistical t-
Student and its standard error, which allowed us to evaluate the statistical significance of the
coefficients path (Castro & Roldan, 2013) and the hypotheses, as shown in Table 4.
Hypothesis β StandardError t- Student accepted
H1 Motivations - > Implementation 0.227 0,087 2,587 YES ** H2a Pre. MS -> Implementation 0.536 0,100 5,342 YES *** H2b Pre. MS -> Integration 0.511 0.116 4,404 YES *** H3 Implementation -> Integration 0.398 0,113 3,507 YES *** H4 Integration -> Competitiveness 0.376 0.114 3,290 YES *** Note: t (0.05, 4999) = 1.645158499, t (4999 0.01.) = 2.327094067, t (0.001, 4999) = 3.091863446* P <0.05.**P <0.01.*** P <0.001.ns. No significant based on t (4999), one-tailed test.
Table 4. Contrast hypotheses
Second, the explained variance is analyzed. The goodness of a model is determined by the strength of
each structural relationship and analyzed using the value of R2 for each dependent construct.
According to Falk and Miller (1992), these values should be greater than 0.1 to consider that the model
has sufficient predictive ability. The R2 is a measure of the model’s predictive accuracy (Hair et al.,
2014) and therefore R2 values measure the construct variance explained by the model (Serrano-Cinca,
Fuertes Callén & Gutiérrez Nieto,‐ ‐ 2007) with values 0.75, 0.50 and 0.25, respectively, describe
substantial, moderate, or weak levels of predictive accuracy (Hair Jr et al, 2014; Henseler et al, 2009), as
shown in Figure 2, all R2 are between 0.1 and 0.75, so have a predictive ability in varying degrees.
Finally, a Stone-Giesser´s test or Cross-validated redundancy index (Q2) was used to assess the
predictive relevance of the endogenous constructs with a reflective measurement model (Wang et al,
2015; Roldán & Sánchez-Franco, 2012). Therefore, it means for assessing the structural model’s
predictive relevance (Hair Jr. et al., 2014). The cross-validated redundancy index (Q 2) is used for
endogenous reflective constructs (Castro & Roldán, 2013). A Q2 greater than 0 implies that the model
-1544-

Intangible Capital – http://dx.doi.org/10.3926/ic.721
has predictive relevance, whereas a Q2 less than 0 suggests that is lacking in the model (Hair Jr. et al.,
2014). In our case all Q2 obtained have positive sign and are greater than 0, as seen in Figure 2.
Figure 2. Testing Hypothesis
5. Results and discussion
The results obtained confirm the relationships established in the research model and the structural
model has satisfactory predictive relevance for the three dependent variables: the implementation of
CSR and the actual integration of CSR in the organization and competitiveness of the company, being
able therefore affirm that all the hypotheses are accepted.
Nevertheless, hypothesis model does not reflect all existing relationships, so in the following table
(Table 5) all results (direct and indirect) are reflected. In this table, the relationship between the
previous systems management and competitiveness are shown. This relationship is significant, however
relations 5 and 6 and 7 have β lower than 0.2 and therefore they are not considered.
-1545-

Intangible Capital – http://dx.doi.org/10.3926/ic.721
Relations β StandardError T-Student Level
significantH1 Motivations -> Implementation 0.227 0.087 2,587 ** H2a Pre MS -> Implementation 0.536 0,100 5,342 *** H2b Pre MS -> Integration 0.51 1 0.116 4,404 *** H3 Implementation -> Integration 0.398 0.113 3,507 ***
H4 Integration -> Competitiveness Perceived
0.376 0.114 3,290 ***
5 Implementation -> Competitiveness 0.149 0.0672 2.2304 *
6 Motivations -> Competitiveness Perceived 0.034 0.0237 1.4364 ns
7 Motivations -> Integration 0.090 0.0453 1.9979 * 8 SG Pre -> Competitiveness Perceived 0.272 0.0917 2.9742 ** Note: t (0.05, 4999) = 1.645158499, t (4999 0.01.) = 2.327094067, t (0.001, 4999) = 3.091863446 * P <0.05. ** P <0.01. *** P <0.001. Ns. No significant based on t (4999), a test-cola
Table 5. Total effects (direct and indirect)
Although the H1 hypothesis confirms that there are reasons for implementing CSR in technology
companies, they are only the external type in contrast by Graafland and Schouten (2012). Moreover, a
lack of correlation with respect to some observables (e.g.MO1, MO2, MO3, MO5) was found, in spite
of being considered components fundamental strategies CSR by some scholars (Marín et al., 2012). So,
these issues do not seem important for companies operating in the technology industry in line with
other studies (Battaglia et al., 2014). This circumstance is apparently linked to the fact the most
common size of the analyzed companies are micro and small enterprises as the indicators are not
among the validated are those related to workers. Therefore, it would open here a possible line of
research between CSR and human factor in field of technology companies.
In regard to Previous Management System (H2), the results confirm what other authors suggested. So,
these systems are facilitators of the integration of CSR and have positive indirect effects (Battaglia et
al., 2014) and significant on competitiveness (see Table 5).
Once CSR are adopted into organization, CSR could be used to reinforce the corporate strategy, as
suggested Isaksson, Kiessling and Harvey (2014) since one occurs real integration (H3) and significant,
so that CSR is part of a strategic intangible in line with other studies (Bocquet et al., 2013) that
contribute to innovation and competitiveness of the enterprise technology.
On the other hand, the relationship between CSR and perceived competitiveness from technological
company is confirmed in the H4 hypothesis raised in line with other studies (Hockerts, 2015). In fact,
there are certain factors (e.g. COM6, COM7, COM8, COM13, COM14, COM15, COM21, COM24
and COM25) that contribute to this relationship as suggested Hockerts (2015) and Turyakira et al.
-1546-
Intangible Capital – http://dx.doi.org/10.3926/ic.721
(2014). The opposite of what would be expected from these studies (Turyakira et al., 2014) other
factors do not contribute to the competitiveness of the technology company (e.g. COM26 and
COM27), among them the COM3 "Improving access to finance", contrary to what was stated by
Quintana García et al., (2013) and established by Battaglia et al. (2014). Therefore would need to
establish a line future research that will lead to study the effect of CSR performance and financial -
economic as suggested by some authors (Boulouta & Pitelis, 2014; Pamiés & Jimenez, 2011; Van
Beurden & Gössling, 2008).
6. Conclusions
In the present study, the aim has been to examine the motivations of implementing CSR in technology
companies, its implementation and integration and its effect on the competitiveness of these
enterprises through the application of a predictive model and an analysis statistical since the study the
role of technology companies in environmental management, sustainability and CSR is still in its early
stages initial (Wang et al., 2015).
Through the study, it is intended to cover the detected gap on the motivations in technology companies
to implement CSR measures, because although there are previous studies of motivations for CSR,
integration and results in Spanish companies, such as made from a regional point of view (Gallardo-
Vázquez & Sanchez-Hernandez, 2014; Vintró, Fortuny, Sanmiquel, Freijo & Edo, 2012) or by analyzing
a single aspect of that relationship (Prado-Lorenzo et al., 2008). Thus, the absence of previous
empirical studies to analyze the motivations of CSR in the technology sector in Spain, its integration
into the company and its impact on competitiveness, justified his conduct and considered coming to
add an investigator supplement to studies linking CSR and its integration into business, because this
relationship is not studied with a direct effect only, but found out an indirect relationship through of
previous management systems as variable partial mediation on competitiveness.
This study proposes a model that explains the measures CSR in technology companies and its influence
on the competitiveness of these companies. The model reveals that the construct (Integration of CSR)
has one significant influence on competitiveness. To demonstrate this latter have raised a number of
hypotheses through constructs or latent variables, which are not directly observable and have assumed
that relations between them are complex. The model has been estimated by SEM technique has been
tested using a sample of Spanish technology companies.
-1547-
Intangible Capital – http://dx.doi.org/10.3926/ic.721
The results show that the motivations (in this case, external), management systems previously adopted
by enterprises and the implementation of means of CSR are interrelated, so that the previous
management systems and the implementation of measures CSR mediate significantly on the effect of
real integration of CSR in the organization and this in turn has a direct effect on competitiveness
perceived. Consequently, the results have implications both theoretical and practical.
So, the validated model can help entrepreneurs technological and managers understand why they
should pay attention to CSR issues and what is expected of them and their efforts towards
environmental and social development of their organization, beyond pure development economic.
From a practical standpoint technology companies can use the results of this study as a fulcrum to
promote the integration of CSR into their corporate strategy through concrete measures RSC as the
training of their workers, sustainable knowledge and communication with stakeholders and others and
take advantage of synergies in the management created between management systems and the RSC, as
the integration of CSR in technology companies, as has been shown, has a direct relationship with
competitiveness in line with other studies (De Vries, Terwel, Ellemers & Daamen, 2015; Gallardo-
Vazquez & Sanchez-Hernandez, 2014; Swanson & Zhang, 2012).
Despite the contributions of this study, it also has some limitations. First, while the fact that the sample
is restricted to companies in Spain could be seen as a lack of generalizability of the results, it is also
true that our results are consistent with the literature and the results of previous studies from no
Spanish samples (e.g. Turyakira et al., 2014; Hur et al., 2014) which clearly supports the validity of our
results beyond the Spanish borders. In addition, this study has an associative modeling approach, since
it will be directed towards the prediction of causality. While causality ensures the ability to control
events, the association (prediction) only allows a limited degree of control (Falk & Miller, 1992).
Secondly, another limitation is determined by the technique used for the proposed model: structural
equation, which assumes a linearity of the relationship between the latent variables (Castro & Roldan,
2013).
Thirdly, technology companies are dynamic organizations that change over time. Consequently, future
research should measure the constructs analyzed over several time periods, taking into account the
dynamics to configure the different dimensions of CSR.
However, given the limitations noted above, the work has to be seen as a pioneer, as it represents a
starting point for aspects of CSR in any technology company and covers the gap detected in the
-1548-

Intangible Capital – http://dx.doi.org/10.3926/ic.721
literature. Therefore, as future research is proposed to test a structural model to analyze the causal
relationship between the orientation of technological companies towards CSR and performance
economic. The results of this model indicate whether the CSR strategy, or to a significant extent,
explain the competitive success and its relationship to performance. If so, it would be an interesting
strategy for technology companies that develop determine:
• the strategic intent of CSR;
• participate in CSR for a specific benefit;
• addressing CSR as an investment in intangible assets;
• focus on a specific category of stakeholders (e.g. customers, employees, suppliers, etc.);
• to decide how to communicate CSR initiatives; and
• design and manage the process of decision making of CSR.
References
Albahari, A., Catalano, G., & Landoni, P. (2013). Evaluation of national science park systems: A
theoretical framework and its application to the Italian and Spanish systems. Technology Analysis &
Strategic Management, 25(5), 599-614. https:/doi.org/10.1080/09537325.2013.785508
Alcaraz, A.S., & Rodenas, S.P. (2013). The Spanish Banks in face of the Corporate Social Responsibility
Standards: Previous analysis of the financial crisis. Review of Business Management, 15(49), 562-581.
https:/doi.org/10.7819/rbgn.v15i49.1386
Apospori, E., Zografos, K.G., & Magrizos, S. (2012). SME corporate social responsibility and
competitiveness: A literature review. International Journal of Technology Management, 58(1/2), 10-31.
https:/doi.org/10.1504/IJTM.2012.045786
Arevalo, J.A., Aravind, D., Ayuso, S., & Roca, M. (2013). The Global Compact: an analysis of the
motivations of adoption in the Spanish context. Business Ethics: A European Review, 22(1), 1-15.
https:/doi.org/10.1111/beer.12005
Asif, M., Searcy, C., Zutshi, A., & Ahmad, N. (2011). An integrated management systems approach to
corporate sustainability. European Business Review, 23(4), 353-367.
https:/doi.org/10.1108/09555341111145744
-1549-

Intangible Capital – http://dx.doi.org/10.3926/ic.721
Asif, M., Searcy, C., Zutshi, A., & Fisscher, O.A.M. (2013). An integrated management systems
approach to corporate social responsibility. Journal of Cleaner Production, 56, 7-17.
https:/doi.org/10.1016/j.jclepro.2011.10.034
Bagozzi, R.P., & Yi, Y. (2011). Specification, evaluation, and interpretation of structural equation
models. Journal of the Academy of Marketing Science, 40(1), 8-34. https:/doi.org/10.1007/s11747-011-0278-x
Battaglia, M., Testa, F., Bianchi, L., Iraldo, F., & Frey, M. (2014). Corporate Social Responsibility and
Competitiveness within SMEs of the Fashion Industry: Evidence from Italy and France.
Sustainability, 6(2), 872-893. https:/doi.org/10.3390/su6020872
Baumann-Pauly, D., Wickert, C., Spence, L.J., & Scherer, A.G. (2013). Organizing Corporate Social
Responsibility in Small and Large Firms: Size Matters. Journal of Business Ethics, 115(4), 693-705.
https:/doi.org/10.1007/s10551-013-1827-7
Benito Hernández, S., & Esteban Sánchez, P. (2012). La influencia de las políticas de responsabilidad
social y la pertenencia a redes de cooperación en el capital relacional y estructural de las
microempresas. Investigaciones Europeas de Dirección y Economía de la Empresa, 18(2), 166-176.
https:/doi.org/10.1016/S1135-2523(12)70007-2
Bernal Conesa, J.A., De Nieves Nieto, C., & Briones Peñalver, A.J. (2014). Implantación de la
Responsabilidad Social en la Administración Pública: El caso de las Fuerzas Armadas Españolas.
Revista de Responsabilidad Social de la Empresa, 18(III), 101-124.
Bernardo, M. (2014). Integration of management systems as an innovation: a proposal for a new
model. Journal of Cleaner Production, 82, 132-142. https:/doi.org/10.1016/j.jclepro.2014.06.089
Bernardo, M., Casadesus, M., Karapetrovic, S., & Heras, I. (2012). Integration of standardized
management systems: Does the implementation order matter?. International Journal of Operations &
Production Management, 32(3), 291-307. https:/doi.org/10.1108/01443571211212583
Bernardo, M., Simon, A., Tarí, J.J., & Molina-Azorín, J.F. (2015). Benefits of Management Systems
integration: A literature review. Journal of Cleaner Production. Retrieved February 17, 2015, from:
http://www.sciencedirect.com/science/article/pii/S0959652615000803 https:/doi.org/10.1016/j.jclepro.2015.01.075
Bocquet, R., Le Bas, C., Mothe, C., & Poussing, N. (2013). Are firms with different CSR profiles equally
innovative? Empirical analysis with survey data. European Management Journal, 31(6), 642-654.
https:/doi.org/10.1016/j.emj.2012.07.001
-1550-

Intangible Capital – http://dx.doi.org/10.3926/ic.721
Boulouta, I., & Pitelis, C.N. (2014). Who Needs CSR? The Impact of Corporate Social Responsibility
on National Competitiveness. Journal of Business Ethics, 119(3), 349-364. https:/doi.org/10.1007/s10551-
013-1633-2
Carmines, E.G., & Zeller, R.A. (1979). Reliability and Validity Assessment. Newbury Park, CA: Sage
Publications. https:/doi.org/10.4135/9781412985642
Castka, P., & Balzarova, M.A. (2008). Adoption of social responsibility through the expansion of
existing management systems. Industrial Management & Data Systems, 108(3-4), 297-309.
https:/doi.org/10.1108/02635570810858732
Castro, I., & Roldán, J.L. (2013). A mediation model between dimensions of social capital. International
Business Review, 22(6), 1034-1050. https:/doi.org/10.1016/j.ibusrev.2013.02.004
Chen, Y.-S., & Chang, C.-H. (2011). Utilize structural equation modeling (SEM) to explore the
influence of corporate environmental ethics: The mediation effect of green human capital. Quality
& Quantity, 47(1), 79-95. https:/doi.org/10.1007/s11135-011-9504-3
Chin, W.W. (1998). Commentary: Issues and opinion on structural equation modeling. JSTOR.
Retrieved April 13, 2015, from: http://www.jstor.org/stable/249674
Chow, W. S., & Chen, Y. (2012). Corporate Sustainable Development: Testing a New Scale Based on the
Mainland Chinese Context. Journal of Business Ethics, 105(4), 519-533. https:/doi.org/10.1007/s10551-011-
0983-x
Dahlsrud, A. (2008). How corporate social responsibility is defined: An analysis of 37 definitions.
Corporate Social Responsibility and Environmental Management, 15(1), 1-13. https:/doi.org/10.1002/csr.132
Damanpour, F., & Gopalakrishnan, S. (2001). The dynamics of the adoption of product and process
innovations in organizations. Journal of Management Studies, 38(1), 45-65. https:/doi.org/10.1111/1467-
6486.00227
De Godos Díez, J.L., Fernández Gago, R., & Cabeza García, L. (2012). Propiedad y control en la puesta
en práctica de la RSC. Cuadernos de Economía y Dirección de la Empresa, 15(1), 1-11.
https:/doi.org/10.1016/j.cede.2011.06.002
De Vries, G., Terwel, B.W., Ellemers, N., & Daamen, D.D.L. (2015). Sustainability or Profitability? How
Communicated Motives for Environmental Policy Affect Public Perceptions of Corporate
Greenwashing. Corporate Social Responsibility and Environmental Management, 22(3), 142-154.
https:/doi.org/10.1002/csr.1327
-1551-
Intangible Capital – http://dx.doi.org/10.3926/ic.721
Díez, J.L.G., & Gago, R.F. (2011). ¿Cómo se percibe la dirección socialmente responsable por parte de
los altos directivos de empresas en España?. Universia Business Review, (29), 32-49.
Dijkstra, T.K., & Henseler, J. (2015). Consistent and asymptotically normal PLS estimators for linear
structural equations. Computational Statistics & Data Analysis, 81, 10-23.
https:/doi.org/10.1016/j.csda.2014.07.008
Falk, R.F., & Miller, N.B. (1992). A Primer for Soft Modeling (1st edition.). Akron, Ohio: Univ of Akron
Pr.
Fornell, C., & Larcker, D. (1981). Evaluating Structural Equation Models with Unobservable Variables
and Measurement Error. Journal of Marketing Research, 18(1), 39-50. https:/doi.org/10.2307/3151312
Gallardo-Vázquez, D., & Sanchez-Hernandez, M.I. (2014). Measuring Corporate Social Responsibility
for competitive success at a regional level. Journal of Cleaner Production, 72, 14-22.
https:/doi.org/10.1016/j.jclepro.2014.02.051
García-Sánchez, I.-M., Frías-Aceituno, J.-V., & Rodríguez-Domínguez, L. (2013). Determinants of
corporate social disclosure in Spanish local governments. Journal of Cleaner Production, 39, 60-72.
https:/doi.org/10.1016/j.jclepro.2012.08.037
Gefen, D., Rigdon, E.E., & Straub, D. (2011). An Update and Extension to SEM Guidelines for
Administrative and Social Science Research. Mis Quarterly, 35(2), III-XIV.
Gefen, D., & Straub, D. (2005). A practical guide to factorial validity using PLS-Graph: Tutorial and
annotated example. Communications of the Association for Information systems, 16(1), 5.
Goldsmith, S. (2010). The Power of Social Innovation: How Civic Entrepreneurs Ignite Community Networks for
Good. San Francisco, CA: John Wiley & Sons.
Graafland, J., & Schouten, C.M.-V. Der D. (2012). Motives for Corporate Social Responsibility. De
Economist, 160(4), 377-396. https:/doi.org/10.1007/s10645-012-9198-5
Guadamillas-Gómez, F.J., Donate-Manzanares, M., & Skerlavaj, M. (2010). The integration of
corporate social responsibility into the strategy of technology-intensive firms: A case study. Zbornik
radova Ekonomskog fakulteta u Rijeci: \vcasopis za ekonomsku teoriju i praksu, 28(1), 9-34.
Hair, J. F., Sarstedt, M., Ringle, C.M., & Mena, J.A. (2012). An assessment of the use of partial least
squares structural equation modeling in marketing research. Journal of the Academy of Marketing Science,
40(3), 414-433. https:/doi.org/10.1007/s11747-011-0261-6
-1552-

Intangible Capital – http://dx.doi.org/10.3926/ic.721
Hair Jr, J.F., Sarstedt, M., Hopkins, L., & Kuppelwieser, V.G. (2014). Partial least squares structural
equation modeling (PLS-SEM): An emerging tool in business research. European Business Review,
26(2), 106-121. https:/doi.org/10.1108/EBR-10-2013-0128
Hammann, E.-M., Habisch, A., & Pechlaner, H. (2009). Values that create value: socially responsible
business practices in SMEs - empirical evidence from German companies. Business Ethics: A
European Review, 18(1), 37-51. https:/doi.org/10.1111/j.1467-8608.2009.01547.x
Henseler, J., Dijkstra, T.K., Sarstedt, M., Ringle, C.M., Diamantopoulos, A., Straub, D. W. et al. (2014).
Common Beliefs and Reality About PLS: Comments on Ronnkko and Evermann (2013).
Organizational Research Methods, 17(2), 182-209. https:/doi.org/10.1177/1094428114526928
Henseler, J., Ringle, C.M., & Sinkovics, R.R. (2009). The use of partial least squares path modeling in
international marketing. New Challenges to International Marketing, Advances in International
Marketing, 1-0(20), 277-319. Emerald Group Publishing Limited. Retrieved April 9, 2015, from:
http://www.emeraldinsight.com/doi/abs/10.1108/S1474-7979(2009)0000020014
Herrera, J., Larrán, M., & Martínez-Martínez, D. (2013). Relación entre responsabilidad social y
performance en las pequeñas y medianas empresas: Revisión bibliográfica. Cuadernos de Gestión, 13(2),
39-65. https:/doi.org/10.5295/cdg.120360jh
Hillenbrand, C., Money, K., & Ghobadian, A. (2013). Unpacking the Mechanism by which Corporate
Responsibility Impacts Stakeholder Relationships. British Journal of Management, 24(1), 127-146.
https:/doi.org/10.1111/j.1467-8551.2011.00794.x
Hockerts, K. (2015). A Cognitive Perspective on the Business Case for Corporate Sustainability: A
Cognitive Perspective of the Business Case. Business Strategy and the Environment, 24(2), 102-122.
https:/doi.org/10.1002/bse.1813
Homburg, C., & Stebel, P. (2009). Determinants of contract terms for professional services. Management
Accounting Research, 20(2), 129-145. https:/doi.org/10.1016/j.mar.2008.10.001
Hur, W.-M., Kim, H., & Woo, J. (2014). How CSR Leads to Corporate Brand Equity: Mediating
Mechanisms of Corporate Brand Credibility and Reputation. Journal of Business Ethics, 125(1), 75-86.
https:/doi.org/10.1007/s10551-013-1910-0
Isaksson, L., Kiessling, T., & Harvey, M. (2014). Corporate social responsibility: Why bother?.
Organizational Dynamics, 43(1), 64-72. https:/doi.org/10.1016/j.orgdyn.2013.10.008
-1553-

Intangible Capital – http://dx.doi.org/10.3926/ic.721
Janssen, C., Sen, S., & Bhattacharya, C. (2015). Corporate crises in the age of corporate social
responsibility. Business Horizons, Emerging Issues In Crisis Management, 58(2), 183-192.
https:/doi.org/10.1016/j.bushor.2014.11.002
Jimenez-Zarco, A.I., Cerdan-Chiscano, M., & Torrent-Sellens, J. (2013). Challenges and Opportunities
in the Management of Science Parks: design of a tool based on the analysis of resident companies.
Review of Business Management. Retrieved February 10, 2014, from;
http://apps.webofknowledge.com/InboundService.do?
SID=P26vG5IkeT12mbD3PbS&product=WOS&UT=000327498300003&SrcApp=CR&DestFail=http%3A%2F
%2Fwww.webofknowledge.com&Init=Yes&action=retrieve&Func=Frame&customersID=PCS&IsProductCode=Yes&
mode=FullRecord https:/doi.org/10.7819/rbgn.v15i48.1503
Karapetrovic, S., & Casadesús, M. (2009). Implementing environmental with other standardized
management systems: Scope, sequence, time and integration. Journal of Cleaner Production, 17(5),
533-540. https:/doi.org/10.1016/j.jclepro.2008.09.006
Law, K.M.Y., & Gunasekaran, A. (2012). Sustainability development in high-tech manufacturing firms
in Hong Kong: Motivators and readiness. International Journal of Production Economics, 137(1), 116-125.
https:/doi.org/10.1016/j.ijpe.2012.01.022
Lee, E.M., Park, S.-Y., & Lee, H.J. (2013). Employee perception of CSR activities: Its antecedents and
consequences. Journal of Business Research, 66(10), 1716-1724. https:/doi.org/10.1016/j.jbusres.2012.11.008
Lindgreen, A., Antioco, M., Palmer, R., & Van Heesch, T. (2009). High-tech, innovative products:
identifying and meeting business customers’ value needs. Journal of Business & Industrial Marketing ,
24(3/4), 182-197. https:/doi.org/10.1108/08858620910939732
Lorenzo, J.M.P., Sánchez, I.M.G., & Álvarez, I.G. (2009). Características del consejo de administración e
información en materia de responsabilidad social corporativa. Revista española de financiación y
contabilidad, (141), 107-135. https:/doi.org/10.1080/02102412.2009.10779664
Luna Sotorrío, L., & Fernández Sánchez, J.L. (2010). Corporate social reporting for different audiences:
the case of multinational corporations in Spain. Corporate Social Responsibility and Environmental
Management, 17(5), 272-283. https:/doi.org/10.1002/csr.215
Marín, L., Rubio, A., & De Maya, S.R. (2012). Competitiveness as a Strategic Outcome of Corporate
Social Responsibility: Competitiveness and CSR. Corporate Social Responsibility and Environmental
Management, 19(6), 364-376. https:/doi.org/10.1002/csr.1288
-1554-
Intangible Capital – http://dx.doi.org/10.3926/ic.721
Martínez-Campillo, A., Cabeza-García, L., & Marbella-Sánchez, F. (2013). Responsabilidad social
corporativa y resultado financiero: Evidencia sobre la doble dirección de la causalidad en el sector de
las Cajas de Ahorros. Cuadernos de Economía y Dirección de la Empresa, 16(1), 54-68.
https:/doi.org/10.1016/j.cede.2012.04.005
Melé, D., Argandoña, A., & Sanchez-Runde, C. (2011). Facing the Crisis: Toward a New Humanistic
Synthesis for Business. Journal of Business Ethics, 99(1), 1-4. https:/doi.org/10.1007/s10551-011-0743-y
Melé, D., Debeljuh, P., & Arruda, M.C. (2006). Corporate Ethical Policies in Large Corporations in
Argentina, Brazil and Spain. Journal of Business Ethics, 63(1), 21-38. https:/doi.org/10.1007/s10551-005-
7100-y
Mendoza, S., De Nieves, C., & Briones, A.J. (2010). Capacidades Empresariales en Responsabilidad
Social y Cooperación en los Agronegocios de la Región de Murcia.
Moseñe, J.A., Burritt, R.L., Sanagustín, M.V., Moneva, J.M., & Tingey-Holyoak, J. (2013).
Environmental reporting in the Spanish wind energy sector: An institutional view. Journal of Cleaner
Production, 40, 199-211. https:/doi.org/10.1016/j.jclepro.2012.08.023
Nunnally, J.C., & Bernstein, I.H. (1994). Psychometric Theory (3rd edition.). New York: McGraw-Hill.
Pamiés, D.S., & Jiménez, J.A. (2011). La naturaleza de la relación entre la responsabilidad social de la
empresa (RSE) y el resultado financiero. Revista europea de dirección y economía de la empresa, 20(4),
161-176.
Pavlou, P.A., & El Sawy, O.A. (2006). From IT Leveraging Competence to Competitive Advantage in
Turbulent Environments: The Case of New Product Development. Information Systems Research,
17(3), 198-227. https:/doi.org/10.1287/isre.1060.0094
Pérez, A., & Del Bosque, I.R. (2012). Measuring CSR Image: Three Studies to Develop and to Validate
a Reliable Measurement Tool. Journal of Business Ethics, 118(2), 265-286. https:/doi.org/10.1007/s10551-
012-1588-8
Pérez Ruiz, A., & Rodríguez Del Bosque, I. (2012). La imagen de Responsabilidad Social Corporativa
en un contexto de crisis económica: El caso del sector financiero en España. Universia Business Review,
33, 14-29.
Perrini, F., Russo, A., & Tencati, A. (2007). CSR Strategies of SMEs and Large Firms. Evidence from
Italy. Journal of Business Ethics, 74(3), 285-300. https:/doi.org/10.1007/s10551-006-9235-x
-1555-
Intangible Capital – http://dx.doi.org/10.3926/ic.721
Prado-Lorenzo, J.-M., Gallego-Álvarez, I., García-Sánchez, I.-M., & Rodríguez-Domínguez, L. (2008).
Social responsibility in Spain: Practices and motivations in firms. Management Decision, 46(8),
1247-1271. https:/doi.org/10.1108/00251740810901417
Prahalad, C.K. & Ramaswamy, V. (2004). Co creating unique value with customers. ‐ Strategy &
Leadership, 32(3), 4-9. https:/doi.org/10.1108/10878570410699249
Prajogo, D., Tang, A.K.Y., & Lai, K. (2012). Do firms get what they want from ISO 14001 adoption?:
An Australian perspective. Journal of Cleaner Production, 33, 117-126.
https:/doi.org/10.1016/j.jclepro.2012.04.019
Quintana García, C., Benavides Velasco, C.A., & Guzmán Parra, V.F. (2013). Capacidades de
investigación y directivas: señales informativas en la salida a bolsa de las empresas de base
tecnológica. Cuadernos de Economía y Dirección de la Empresa, 16(4), 270-280.
https:/doi.org/10.1016/j.cede.2013.06.005
Ramírez-Correa, P. (2014). Uso de internet móvil en Chile: Explorando los antecedentes de su
aceptación a nivel individual. Ingeniare. Revista chilena de ingeniería, 22(4), 560-566.
https:/doi.org/10.4067/S0718-33052014000400011
Ramos, M.I.G., Manzanares, M.J.D., & Gómez, F.G. (2014). El efecto del papel mediador de la
reputación corporativa en la relación entre la rsc y los resultados económicos. Revista de Estudios
Empresariales. Segunda Época, (1). Retrieved March 12, 2015, from:
http://revistaselectronicas.ujaen.es/index.php/REE/article/view/1378
Ratinho, T., & Henriques, E. (2010). The role of science parks and business incubators in converging
countries: Evidence from Portugal. Technovation, 30(4), 278-290.
https:/doi.org/10.1016/j.technovation.2009.09.002
Reinartz, W., Haenlein, M., & Henseler, J. (2009). An empirical comparison of the efficacy of
covariance-based and variance-based SEM. International Journal of Research in Marketing , 26(4),
332-344. https:/doi.org/10.1016/j.ijresmar.2009.08.001
Rigdon, E.E. (2014). Rethinking Partial Least Squares Path Modeling: Breaking Chains and Forging
Ahead. Long Range Planning, Rethinking Partial Least Squares Path Modeling: Looking Back and Moving
Forward, 47(3), 161-167. https:/doi.org/10.1016/j.lrp.2014.02.003
Rives, L.M., & Bañón, A.R. (2008). La responsabilidad social corporativa como determinante del éxito
competitivo: Un análisis empírico. Revista europea de dirección y economía de la empresa, 17(3), 27-42.
-1556-

Intangible Capital – http://dx.doi.org/10.3926/ic.721
Rodríguez Gutiérrez, P., Fuentes García, F.J., & Sánchez Cañizares, S. (2013). Revelación de
información sobre clientes, comunidad, empleados y medio ambiente en las entidades financieras
españolas a través de las memorias de responsabilidad social corporativa (2007-2010). Investigaciones
Europeas de Dirección y Economía de la Empresa, 19(3), 180-187. https:/doi.org/10.1016/j.iedee.2012.12.002
Roldán, J.L., & Sánchez-Franco, M.J. (2012). Variance-Based Structural Equation Modeling: Guidelines
for Using Partial Least Squares. Research methodologies, innovations and philosophies in software systems
engineering and information systems, 193-221. https:/doi.org/10.4018/978-1-4666-0179-6.ch010
Serrano Cinca, C., Fuertes Callén, Y., & Gutiérrez Nieto, B. (2007). Online reporting by banks: A‐ ‐ ‐
structural modelling approach. Online Information Review, 31(3), 310-332.
https:/doi.org/10.1108/14684520710764096
Simon, A., Karapetrovic, S., & Casadesús, M. (2012). Difficulties and benefits of integrated
management systems. Industrial Management & Data Systems, 112(5), 828-846.
https:/doi.org/10.1108/02635571211232406
Spence, L.J. (2007). CSR and Small Business in a European Policy Context: The Five “C”s of CSR and
Small Business Research Agenda 2007. Business and Society Review, 112(4), 533-552.
https:/doi.org/10.1111/j.1467-8594.2007.00308.x
Suñe, A., Bravo, E., Mundet, J., & Herrera, L. (2012). Buenas prácticas de innovación: Un estudio
exploratorio de empresas tecnológicas en el sector audiovisual español. Investigaciones Europeas de
Dirección y Economía de la Empresa, 18(2), 139-147. https:/doi.org/10.1016/S1135-2523(12)70004-7
Swanson, L.A., & Zhang, D.D. (2012). Perspectives on corporate responsibility and sustainable
development. Management of Environmental Quality: An International Journal, 23(6), 630-639.
https:/doi.org/10.1108/14777831211262918
Tenenhaus, M., Vinzi, V.E., Chatelin, Y.M., & Lauro, C. (2005). PLS path modeling. Computational
Statistics & Data Analysis, 48(1), 159-205. https:/doi.org/10.1016/j.csda.2004.03.005
Turyakira, P., Venter, E., & Smith, E. (2014). The impact of corporate social responsibility factors on
the competitiveness of small and medium-sized enterprises. South African Journal of Economic and
Management Sciences, 17(2), 157-172.
Van Beurden, P., & Gössling, T. (2008). The Worth of Values - A Literature Review on the Relation
Between Corporate Social and Financial Performance. Journal of Business Ethics, 82(2), 407-424.
https:/doi.org/10.1007/s10551-008-9894-x
-1557-

Intangible Capital – http://dx.doi.org/10.3926/ic.721
Vásquez-Urriago, Á.R., Barge-Gil, A., & Rico, A.M. (2012). Los parques científicos y tecnológicos
españoles, impulsores de la cooperación en innovación. ICE: Revista de Economía, 869, 99-114.
Vásquez-Urriago, Á.R., Barge-Gil, A., Rico, A.M., & Paraskevopoulou, E. (2014). The impact of
science and technology parks on firms’ product innovation: empirical evidence from Spain. Journal
of Evolutionary Economics, 24, 835-873. https:/doi.org/10.1007/s00191-013-0337-1
Vázquez, D.G., & Sánchez, M.I. (2013). Análisis de la incidencia de la responsabilidad social empresarial
en el éxito competitivo de las microempresas y el papel de la innovación. Universia Business Review, 38,
14-31.
Vázquez-Carrasco, R., & López-Pérez, M.E. (2013). Small & medium-sized enterprises and Corporate
Social Responsibility: A systematic review of the literature. Quality & Quantity, 47(6), 3205-3218.
https:/doi.org/10.1007/s11135-012-9713-4
Vidales, K.B.V., & Ortiz, D.A.A. (2014). Responsabilidad social de las empresas agrícolas y
agroindustriales aguacateras de Uruapan, Michoacán, y sus implicaciones en la competitividad.
Contaduría y Administración, 59(4), 223-251. https:/doi.org/10.1016/S0186-1042(14)70161-5
Vilanova, M., Lozano, J.M., & Arenas, D. (2009). Exploring the Nature of the Relationship Between
CSR and Competitiveness. Journal of Business Ethics, 87(S1), 57-69. https:/doi.org/10.1007/s10551-008-
9812-2
Vintró, C., Fortuny, J., Sanmiquel, L., Freijo, M., & Edo, J. (2012). Is corporate social responsibility
possible in the mining sector? Evidence from Catalan companies. Resources Policy, 37(1), 118-125.
https:/doi.org/10.1016/j.resourpol.2011.10.003
Vinzi, V.E., Chin, W.W., Henseler, J., & Wang, H. (2010). Handbook of Partial Least Squares: Concepts,
Methods and Applications. Springer Science & Business Media. Berlin: Springer.
Von Ahsen, A. (2014). The Integration of Quality, Environmental and Health and Safety Management
by Car Manufacturers – a Long-Term Empirical Study. Business Strategy and the Environment, 23(6),
395-416. https:/doi.org/10.1002/bse.1791
Waddock, S. (2004). Parallel Universes: Companies, Academics, and the Progress of Corporate
Citizenship. Business and Society Review, 109(1), 5-42. https:/doi.org/10.1111/j.0045-3609.2004.00002.x
Wang, Y., Chen, Y., & Benitez-Amado, J. (2015). How information technology influences environmental
performance: Empirical evidence from China. International Journal of Information Management, 35(2),
160-170. https:/doi.org/10.1016/j.ijinfomgt.2014.11.005
-1558-

Intangible Capital – http://dx.doi.org/10.3926/ic.721
Versión en español
Título: RSC y empresas tecnológicas: Un estudio sobre su implantación e integración y efectos sobre la
competitividad de las empresas
Resumen
Objeto: Se propone un modelo de ecuaciones estructurales para explicar las motivaciones de
implantar medidas de Responsabilidad Social Corporativa (RSC) en empresas tecnológicas
españolas y cómo influyen en la integración de la RSC la presencia de sistemas de gestión
normalizados previos a la implantación de dichas medidas. Asimismo, se estudia si la RSC tiene
influencia en la competitividad de dichas empresas.
Diseño/metodología/enfoque: El estudio se llevo a cabo en empresas ubicadas en Parques
Científicos y Tecnológicos españoles, mediante una encuesta y aplicando las ecuaciones
estructurales como herramienta estadística.
Aportaciones y resultados: Los resultados del modelo revelan que existe una relación positiva,
directa y estadísticamente significativa entre las motivaciones para la RSC, los sistemas de
gestión previos, la implantación de medidas de RSC y la integración real de la RSC en la
organización.
Limitaciones: Se encuentran determinadas por la técnica utilizada para el modelo propuesto:
ecuaciones estructurales, pues estas asumen una linealidad de las relaciones entre las variables
latentes.
Implicaciones prácticas: Las empresas pueden utilizar los resultados de este estudio como un
punto de apoyo para potenciar la integración de la RSC basándose en sistemas de gestión
previos y aprovechar las sinergias creadas entre ellos, pues la integración de la RSC tiene una
relación directa con la competitividad de la empresa.
Originalidad / Valor añadido: Se demuestra la vinculación entre las motivaciones de la RSC,
las acciones de RSC y su integración en las empresas tecnológicas de manera empírica y fiable.
Palabras clave: Responsabilidad Social Corporativa, Motivaciones, Empresas tecnológicas, Integración,
Ecuaciones estructurales
-1559-
Códigos JEL: M14
Intangible Capital – http://dx.doi.org/10.3926/ic.721
1. Introducción
Si algo caracteriza el entorno empresarial en los últimos años ha sido la aguda crisis económica sufrida,
la cual no puede ser atribuida meramente a un cambio de ciclo económico sino también a la ausencia de
valores y principios éticos en el funcionamiento de las organizaciones (Melé, Argandoña & Sánchez-
Runde, 2011). Por ello, una salida a la crisis puede venir de la mano de innovaciones sociales
(Goldsmith, 2010) y la Responsabilidad Social Corporativa (RSC) es considerada una innovación en la
gestión de empresas y como tal puede alcanzar su máximo valor estratégico e incluso hay
organizaciones que creen que la RSC protege contra los efectos negativos de la crisis económica
(Janssen, Sen & Bhattacharya, 2015). En este contexto, el estudio clásico de la RSC se han ampliado al
marco de la crisis económica (Pérez & del Bosque, 2012) y su gestión efectiva puede ayudar a las
organizaciones a minimizar los impactos negativos de la recesión.
Por otro lado, las organizaciones están constantemente adaptándose a los cambios económicos con la
intención de tener mayores posibilidades de supervivencia en el mercado. Un factor clave para ello es la
innovación (Bernardo, 2014). Damanpour y Gopalakrishnan (2001) la conceptualizan como “la
adopción de una idea o un nuevo comportamiento en la organización”. la RSC contribuye y fomenta la
innovación de tres maneras:
• la innovación que resulta del diálogo con los diferentes grupos de interés tanto internos como
externos a la empresa,
• la identificación de nuevas oportunidades de negocio derivadas de las demandas sociales y
medioambientales en productos y procesos más eficientes o en nuevas formas de negocio
dirigidas a la denominada base de la pirámide, formada por las personas con menos recursos
(Prahalad & Ramaswamy, 2004) y
• la creación de mejores lugares y formas de trabajar que favorecen la innovación y la
creatividad, como las basadas en mayor participación de los empleados y más confianza en
ellos (Benito Hernández & Esteban Sánchez, 2012).
-1560-

Intangible Capital – http://dx.doi.org/10.3926/ic.721
Por ello, las empresas, deben adoptar prácticas formalizadas de RSC y, por tanto, establecer aquellos
procedimientos y herramientas que estén alineadas con su estrategia corporativa (Bocquet, Le Bas,
Mothe & Poussing, 2013). Tal es así, que existen estudios que afirman que la RSC tiene una
contribución significativamente positiva en la competitividad nacional e incluso en los niveles de calidad
de vida (Boulouta & Pitelis, 2014). Dicho en otras palabras, cabe esperar que la innovación aumente
cuando la empresa es responsable y ese incremento de la innovación se traduce en mayor éxito
competitivo, potenciando el efecto que por sí misma ya ejercía la RSC en la competitividad de la
empresa (Vázquez & Sánchez, 2013), ya que siguiendo a Vilanova, Lozano y Arenas (2009) si la RSC
está integrada en los procesos de negocio genera prácticas innovadoras y, por tanto, una mejora de la
competitividad y además esta integración puede ser facilitada por procesos de gestión normalizados
previamente implantados.
La RSC se ha convertido en un factor cada vez más importante para la competitividad percibida de las
empresas (Turyakira, Venter & Smith, 2014). La competitividad es un concepto multidimensional que
se refiere a la capacidad de crear ventajas competitivas sostenibles que se puede utilizar tanto a nivel
nacional, como a nivel de las empresas (Vilanova et al., 2009). Así pues, el efecto de la RSC sobre el
éxito competitivo, entendiendo por éxito la obtención de unos resultados positivos para la empresa en
términos de posicionamiento en el mercado y que van más allá del ámbito financiero (Vázquez &
Sánchez, 2013), es mayor en aquellos sectores con alta competitividad (como el sector tecnológico) y
que siguen una estrategia proactiva versus reactiva (Marín, Rubio & De Maya, 2012), en los que la RSC
supone una ventaja competitiva, mientras que es menor en sectores poco competitivos, en los que las
empresas siguen diferenciándose ofreciendo ventajas tradicionales de marca, precio, calidad y
distribución (Rives & Bañón, 2008).
En la actualidad, existe un número creciente de empresas españolas que creen que deben contribuir al
desarrollo sostenible mediante la planificación de sus operaciones con el fin de favorecer el crecimiento
económico y el aumento de su productividad y competitividad garantizando al mismo tiempo la
protección del medio ambiente y fomentar la responsabilidad social, y cumpliendo así con los intereses
generales (Prado-Lorenzo, Gallego-Álvarez, García-Sánchez & Rodríguez-Domínguez, 2008) de la
sociedad, pues la inversión en iniciativas de RSC puede ser una de las fuentes de ventajas competitivas
(Apospori, Zografos & Magrizos, 2012) y una manera de mejorar el rendimiento económico de las
empresas (Hur, Kim & Woo, 2014).
-1561-

Intangible Capital – http://dx.doi.org/10.3926/ic.721
• investigar las motivaciones de las empresas tecnológicas para tomar parte de las iniciativas de
RSC e implantar actividades y políticas en su seno - practicas de RSC que crean innovaciones
en los procesos (Benito Hernández & Esteban Sánchez, 2012) -, integrándolas en el sistema de
gestión propio de cualquier organización y
• analizar los factores facilitadores de la implantación e integración de la RSC en el seno de la
organización y
• la influencia directa de la integración de la RSC en la competitividad de la empresa tecnológica.
2. Revisión de la literatura
Académicamente, la Responsabilidad Social (RS) se utiliza a menudo como un término general para
describir una variedad de cuestiones relacionadas con las responsabilidades de las empresas
(Hillenbrand, Money & Ghobadian, 2013). Waddock (2004), por ejemplo, define RS como "el grado de
(ir)responsabilidad manifiesta en las estrategias y prácticas de operaciones de una empresa, ya que
afectan a grupos de interés y al entorno natural en el día a día". Sin embargo, no existe una definición
universalmente aceptada sobre la RSC (Dahlsrud, 2008), aunque se puede afirmar que la RSC es,
además del cumplimiento estricto de las obligaciones legales vigentes, la integración voluntaria en el
gobierno y gestión, en la estrategia, políticas y procedimientos, de las preocupaciones sociales, laborales,
medioambientales y de respeto a los derechos humanos que surgen de la relación y el diálogo
transparente con sus grupos de interés, responsabilizándose así de las consecuencias y los impactos que
se derivan de las acciones de una organización (Mendoza, De Nieves & Briones, 2010).
Por otro lado, una gran parte de la literatura de RSC se ha centrado en el impacto de la RSC en el nivel
de la competitividad de las empresas (Boulouta & Pitelis, 2014), tanto grandes como pequeñas y en
diferentes sectores (Battaglia, Testa, Bianchi, Iraldo & Frey, 2014; Vidales & Ortiz, 2014), sin embargo
no se ha encontrado ningún estudio sobre su influencia sobre la competitividad de las empresas
tecnológicas, por lo que en los siguientes apartados se realizara dicha revisión y se propondrán las
hipótesis de este artículo.
-1562-
Siendo conscientes de todas estas situaciones, el objetivo de este artículo es:
Intangible Capital – http://dx.doi.org/10.3926/ic.721
2.1. RSC y sector tecnológico español
En la literatura científica existen numerosos estudios sobre la RSC tanto en grandes empresas (Melé,
Debeljuh & Arruda, 2006), como en pequeñas (p.e: Baumann-Pauly, Wickert, Spence & Scherer, 2013;
Vázquez-Carrasco & López-Pérez, 2013; Herrera, Larrán & Martínez-Martínez, 2013), en diferentes
sectores p.e. Sector financiero (Pérez Ruiz & Rodríguez del Bosque, 2012) y Bancos (Alcaraz &
Rodenas, 2013); Martínez-Campillo, Cabeza-García & Marbella-Sánchez, 2013), energético (Moseñe,
Burritt, Sanagustín, Moneva & Tingey-Holyoak, 2013) y en la Administración Pública (Bernal Conesa,
De Nieves Nieto & Briones Peñalver, 2014; García-Sánchez, Frías-Aceituno & Rodríguez-Domínguez,
2013) e incluso alguno que hace referencia a empresas del sector tecnológico (Guadamillas-Gómez,
Donate-Manzanares & Skerlavaj, 2010); las posibles motivaciones de adoptar la RSC (Prado-Lorenzo et
al., 2008; Graafland & Schouten, 2012), y su integración con otros sistemas de gestión de la empresa
(Bernardo, 2014; Von Ahsen, 2014; Castka & Balzarova, 2008); sin embargo, no se han encontrado
estudios sobre RSC, sus motivaciones e integración en empresas tecnológicas, las cuales son fuente
constante de innovación, tanto en procesos como en productos, por tanto, se considera escasa la
información sobre el sector tecnológico, denotando que no han sido analizadas en profundidad las
motivaciones de la RSC y su integración en el sistema de gestión de la empresa tecnológica, por ello se
estima interesante profundizar en el estudio de la misma en empresas tecnológicas españolas, ya que
investigaciones previas han demostrado que las organizaciones con una orientación estratégica hacia la
innovación apuestan por mejorar sus capacidades organizativas internas para ser más competitivas en
un entorno global (Suñe, Bravo, Mundet & Herrera, 2012). De hecho para fomentar las innovaciones
de producto y proceso, las empresas deben adoptar prácticas formalizadas de RSC pues ésta tiene una
contribución positiva en la competitividad (Boulouta & Pitelis, 2014).
En la literatura científica se establecen cuatro maneras destacables a través del cual la RSC puede crear
ventajas competitivas (Hockerts, 2015). Estas son:
• la reducción del riesgo,
• las ganancias de eficiencia,
• la reputación social y
• la creación de nuevos mercados.
Diversos autores (Perrini, Russo & Tencati, 2007; Spence, 2007) han señalado el sector como uno de
los elementos que inciden sobre la cultura organizativa a la hora de adoptar e integrar las prácticas de
-1563-

Intangible Capital – http://dx.doi.org/10.3926/ic.721
RSC en los planes estratégicos de las organizaciones. Así, por ejemplo, Perrini et al. (2007) encontraron
que las empresas del sector de las Tecnologías de la Información y la Comunicación (TIC) se
encontraban más dispuestas a controlar e informar sobre sus comportamientos de RSC mientras que
las empresas manufactureras se interesaban más por motivar a sus empleados a través de actividades de
voluntariado en la comunidad.
En un estudio realizado por Lorenzo, Sánchez and Álvarez (2009) se establece que el hecho de
pertenecer al sector de la tecnología y las telecomunicaciones tienen un efecto positivo aunque no
significativo en la divulgación de acciones de RSC.
En determinados sectores tecnológicos los períodos de desarrollo de productos son extremadamente
largos y las empresas suelen presentar resultados negativos en los primeros años de vida, presentado
mayores dificultades de financiación. En estos casos, los indicadores financieros no son efectivos para
valorar el potencial de las empresas, siendo más adecuados los activos intangibles y los basados en el
conocimiento (Quintana García, Benavides Velasco & Guzmán Parra, 2013).
Entre estos activos intangibles podemos encontrar la RSC (Lindgreen, Antioco, Palmer & Heesch,
2009) la cual como demuestran algunos estudios tiene una relación positiva con los beneficios
financieros (Hammann, Habisch & Pechlaner, 2009).
Además, la actividad desarrollada por una empresa tiene un alto impacto social cuando ésta opera en el
sector de las tecnologías de la información y las telecomunicaciones (Luna Sotorrío & Fernández
Sánchez, 2010).
Es por ello que se va a investigar y analizar la situación de las empresas tecnológicas españolas frente a
la RSC, tomando como punto de partida las ubicadas en parques científicos y tecnológicos españoles
pues en ellos hay una mayor presencia de empresas de alta tecnología (Vásquez-Urriago, Barge-Gil &
Rico, 2012).
Las empresas ubicadas en los parques tecnológicos muestran un mayor esfuerzo en innovación y
valoran más los obstáculos a la innovación (Vásquez-Urriago, Barge-Gil, Rico & Paraskevopoulou,
2014) y se aprecia un nivel de cooperación significativamente mayor en el caso de estas empresas
(Vásquez-Urriago et al., 2012).
El concepto de parque científico se originó a finales de 1950 en el contexto universitario
estadounidense (Jimenez-Zarco, Cerdan-Chiscano & Torrent-Sellens, 2013). El éxito de parques
-1564-

Intangible Capital – http://dx.doi.org/10.3926/ic.721
tecnológicos como el de Silicon Valley en California o el de Cambridge en Reino Unido ha influido para
reproducir el modelo en otros países (Ratinho & Henriques, 2010).
En España, los primeros parques surgieron a mediados de la década de 1980, siguiendo una estrategia
de atracción de empresas de alta tecnología (Jiménez-Zarco et al., 2013) con el objetivo de contribuir al
crecimiento económico y empresarial en el ámbito local o regional.
En 1988 se crea la Asociación de Parques Científicos y Tecnológicos de España (APTE) con el objetivo
de convertir a los parques científicos y tecnológicos en piezas claves del sistema de innovación español.
APTE se ocupa de poner en contacto al mundo científico de dentro y fuera de los parques con el tejido
empresarial de los parques para la creación y transferencia de conocimiento, mediante configuración de
sistemas regionales de innovación (Jiménez-Zarco et al., 2013), es por ello que España constituye un
caso interesante dentro de los parques científicos a diferencia de otros establecidos en Estados Unidos
o Reino Unido (Vásquez-Urriago et al., 2014).
Actualmente existen 68 parques científicos y tecnológicos asociados a APTE y en ellos se acogen a
empresas de origen, naturaleza e intereses distintos: spin-offs académicas de Base Tecnológica (EBT),
Empresas de Base de Conocimiento (EBC) y start-ups (Jimenez-Zarco et al., 2013).
Albahari, Catalano y Landoni (2013) demuestran cómo algunos parques contribuyen de forma
importante al desarrollo regional, en términos económicos y sociales, ya que favorecen el desarrollo de
una industria especializada e innovadora, y crear el germen para la creación de un cluster industrial.
Los parques tecnológicos tienen en común la creación de empresas tecnológicas o atraer a empresas ya
consolidadas para fomentar el desarrollo regional a través de un enfoque tecnológico y la creación de
empleo y bienestar (Ratinho & Henriques, 2010; Jimenez-Zarco et al., 2013), por tanto los parques
tecnológicos estarían directamente relacionados con dos de las tres dimensiones de la RSC (la
económica y la social) y generarían una red de cooperación entre empresas tecnológicas, lo cual puede
aumentar la capacidad de general conocimiento y ampliar positivamente las relaciones con los agentes
propios del negocio, si a ello además le unimos la adopción de políticas de RSC, esto va a permitir una
mayor flexibilidad y oportunidades para abordar problemas sociales con productos o servicios
innovadores, incrementar la capacidad de atraer, retener y motivar al personal y acceder a nuevos
conocimientos e información, con lo que las empresas pueden aumentar su desempeño y
competitividad (Benito Hernández & Esteban Sánchez, 2012).
-1565-

Intangible Capital – http://dx.doi.org/10.3926/ic.721
Estar ubicado en un parque tecnológico tiene efectos positivos en la innovación de productos e
incrementa las probabilidades de ser innovador entre un 10% y 20%, y aumenta las ventas debido a
nuevos productos alrededor de un 32% (Vásquez-Urriago et al., 2014).
Además las empresas pertenecientes a los parques son en promedio de menor tamaño, tienen una
mayor vocación exportadora, pertenecen más frecuentemente a un grupo de empresas, son en mayor
proporción de reciente creación y tienen una disminución menos frecuente de la cifra de negocios por
venta o cierre de la empresa (Vásquez-Urriago et al., 2012).
2.2. Motivaciones de la RSC y su integración
A pesar de la dificultad de aportar una definición de RSC (Dahlsrud, 2008), la idea general que se extrae
de todas ellas es que la RSC supone que las empresas deben llevar a cabo sus negocios de manera que
demuestren consideración para el más amplio entorno social con el fin de servir de manera constructiva
a las necesidades de la sociedad.
2.2.1. Motivaciones para la implantación de la RSC
Las motivaciones para la puesta en práctica de la RSC han sido estudiadas de forma general (Graafland
& Schouten, 2012) y en diferentes países (Prado-Lorenzo et al., 2008; Prajogo, Tang & Lai, 2012) y
sectores, encontrándose dos tipos diferentes de motivaciones principales: las externas o extrínsecas a la
organización, entre ellas destacan las de carácter financiero o económico que tienen relación con el
beneficio (Graafland & Schouten, 2012) y las internas o intrínsecas a la organización, que no solo
tienen que ver con el beneficio de la organización sino también con los valores y creencias del personal
que conforman las organizaciones (Graafland & Schouten, 2012).
2.2.2. Integración de la RSC en la organización
En referencia a la integración de la RSC en las empresas la literatura revela que muy pocas empresas la
tienen integrada de manera efectiva (Bernardo, Casadesus, Karapetrovic & Heras, 2012; Karapetrovic &
Casadesús, 2009), a pesar de los beneficios que aporta dicha integración (Bernardo, Simon, Tarí &
Molina-Azorín, 2015; Simon, Karapetrovic & Casadesús, 2012).
-1566-
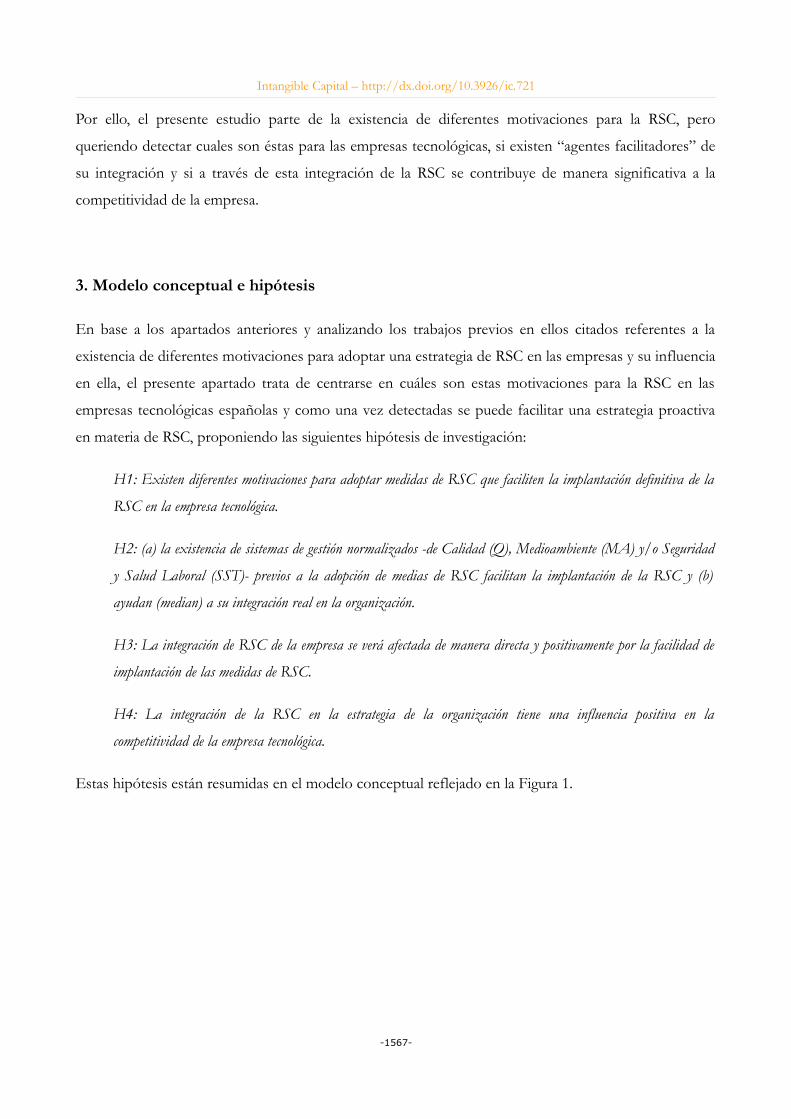
Intangible Capital – http://dx.doi.org/10.3926/ic.721
Por ello, el presente estudio parte de la existencia de diferentes motivaciones para la RSC, pero
queriendo detectar cuales son éstas para las empresas tecnológicas, si existen “agentes facilitadores” de
su integración y si a través de esta integración de la RSC se contribuye de manera significativa a la
competitividad de la empresa.
3. Modelo conceptual e hipótesis
En base a los apartados anteriores y analizando los trabajos previos en ellos citados referentes a la
existencia de diferentes motivaciones para adoptar una estrategia de RSC en las empresas y su influencia
en ella, el presente apartado trata de centrarse en cuáles son estas motivaciones para la RSC en las
empresas tecnológicas españolas y como una vez detectadas se puede facilitar una estrategia proactiva
en materia de RSC, proponiendo las siguientes hipótesis de investigación:
H1: Existen diferentes motivaciones para adoptar medidas de RSC que faciliten la implantación definitiva de la
RSC en la empresa tecnológica.
H2: (a) la existencia de sistemas de gestión normalizados -de Calidad (Q), Medioambiente (MA) y/o Seguridad
y Salud Laboral (SST)- previos a la adopción de medias de RSC facilitan la implantación de la RSC y (b)
ayudan (median) a su integración real en la organización.
H3: La integración de RSC de la empresa se verá afectada de manera directa y positivamente por la facilidad de
implantación de las medidas de RSC.
H4: La integración de la RSC en la estrategia de la organización tiene una influencia positiva en la
competitividad de la empresa tecnológica.
Estas hipótesis están resumidas en el modelo conceptual reflejado en la Figura 1.
-1567-

Intangible Capital – http://dx.doi.org/10.3926/ic.721
Figura 1. Modelo conceptual de hipótesis
4. Metodología
Existe una gran variedad de métodos para la agregación de datos existentes en las ciencias sociales
(Rodríguez Gutiérrez, Fuentes García & Sánchez Cañizares, 2013), sin embargo éstos no se aplican de
manera general en el campo de la investigación de la RSC. Uno de los métodos más ampliamente
utilizado es el análisis factorial, principalmente en trabajos cuya base de estudio se basa en encuestas
(Rodríguez Gutiérrez et al., 2013).
Para la recogida de datos, se enviaron un total de 489 invitaciones mediante email para el acceso al link
del cuestionario, siendo 98 empresas las que cumplimentaron el cuestionario, lo que supone una tasa de
respuestas de un 20.04%. En el caso de encuestas usando herramientas web que incluye un link de
acceso al cuestionario, la tasa de respuesta se encuentra en torno al 30% (Arevalo, Aravind, Ayuso &
Roca, 2013) aunque hay estudios empíricos con una tasa de respuesta válida entre el 10% y el 20%
(Ramos, Manzanares & Gómez, 2014; Chow & Chen, 2012; Homburg & Stebel, 2009).
Para la elaboración de este estudio se diseñó un cuestionario especifico, utilizando la escala Likert 1-5 (1
«totalmente en desacuerdo» y 5 «totalmente de acuerdo»), debido a que un gran número de preguntas
hacen referencia a cuestiones que no pueden ser cuantificadas con un valor concreto (ejemplo:
Implantar medidas de RSC para aumentar la motivación del empleado). En general, el cuestionario
-1568-

Intangible Capital – http://dx.doi.org/10.3926/ic.721
incluía preguntas relacionadas con las motivaciones de implementación de la RSC, la integración con
otros sistemas de gestión, su facilidad de integración, la adopción de una estrategia de RSC y los grupos
de interés para la organización, en línea con otros estudios (Vázquez & Sánchez, 2013; Prajogo et al.,
2012; De Godos Díez, Fernández Gago & Cabeza García, 2012; Law & Gunasekaran, 2012; Díez &
Gago, 2011).
Para la realización del análisis se ha recurrido, en este trabajo, a un modelo de ecuaciones estructurales
(SEM). Los modelos de ecuaciones estructurales son procedimientos estadísticos que permiten
comprobar la medida de las hipótesis funcionales, predictivas y causales, siendo estas herramientas
estadísticas multivariantes esenciales para entender muchos elementos de investigación y llevar a cabo
investigación básica o aplicada en las ciencias del comportamiento, de gestión, de salud y sociales
(Bagozzi & Yi, 2011).
En los modelos de ecuaciones estructurales tal y como afirman Vázquez y Sánchez (2013), se asumen
relaciones más complejas (con efectos directos e indirectos) al tiempo que se trabaja con variables
latentes (no observables directamente y que deben medirse a través de indicadores), llamados
constructos, lo que diferencia a estos modelos con los modelos clásicos de regresión multivariante.
Para la formación de los constructos se ha recurrido a los siguientes indicadores, basados en la literatura
consultada (Battaglia et al., 2014; Gallardo-Vázquez & Sanchez-Hernandez, 2014; Turyakira et al., 2014;
Asif, Searcy, Zutshi & Fisscher, 2013; Asif, Searcy, Zutshi & Ahmad, 2011; Lee, Park & Lee, 2013):
Motivaciones
Internas
MO1 Mejorar las condiciones laborales de mis trabajadoresMO2 Reducir el absentismo laboralMO3 Aumentar la motivación de los empleadosMO4 Mejorar las formación y capacitación de los empleadosMO5 Mejorar la eficacia y el control de las operacionesMO6 Construir sinergias entre los sistemas de gestión
Externas
MO7 Cumplir con leyes y políticas gubernamentalesMO8 Cumplir indicaciones de: clientes, accionistas, grupos ecologistas,…MO9 Mejorar las relaciones con la comunidad donde está asentada la organizaciónMO10 Salvaguardar los derechos de los consumidoresMO11 Reducir las reclamaciones de los clientesMO12 Proteger al medioambienteMO13 Favorecer el desarrollo sostenibleMO14 Mejorar la imagen de la empresa al coincidir con acciones de la competenciaMO15 Ser homologado como proveedor de organismos públicosMO16 Ser homologado como proveedor de organismos privadosMO17 Reducir las sanciones de organismos públicosMO18 Obtener ayudas o subvenciones de organismos públicos
MO19 Cumplir con requisitos de terceras partes, p.e. administración, entidades financieras, etc.
-1569-

Intangible Capital – http://dx.doi.org/10.3926/ic.721
ImplantacionIm1 Existe un conocimiento previo sobre las dificultades de implantación
Im2 Existen ventajas de tener un sistema de gestión normalizado, p.e, estandarización de procesos, formación del personal
Im3 Se conocen los procesos de auditoría interna y externa para la certificación
Im4 Se conocen los requisitos de los diferentes sistemas, (p.e. cumplimento legal, revisión por la dirección, auditorias, indicadores…)
Im5 Surgen sinergias entre los sistemas (comparten recursos, documentación común, etc.)
IntegraciónInt1 Comparten recursosInt2 Comparten procedimientos documentadosInt3 Comparten requisitosInt4 Se unifica el manual de gestiónInt5 Comparten personalSistemas De Gestion PreviosSGP1 Existe un departamento de gestión encargado de todo
SGP2 Los trabajadores conocen los sistemas de gestión y los aplican diariamente sin dificultades
SGP3 Los sistemas certificados son en sí el sistema de gestión de la organización y por tanto el certificado no es una cuestión de imagen
CompetitividadCOM1 Se logra un aumento de las ventasCOM2 Se produce un ahorro en costesCOM3 Mejora el acceso a la financiaciónCOM4 Crecen los ingresosCOM5 Mejora la imagen de la empresa o marcaCOM6 Se produce un acceso a nuevos mercados o clientesCOM7 Se obtienen ventajas competitivasCOM8 Mejora el retorno de la inversión COM9 Mejora la satisfacción de los clientesCOM10 Se obtienen colaboraciones con otras organizacionesCOM11 Aumenta la rentabilidad económica COM12 Aumenta la rentabilidad financieraCOM13 Se consigue una reducción del absentismo laboralCOM14 Incrementa de la satisfacción de los empleadosCOM15 Reducción de la conflictividad laboral por asuntos socialesCOM16 Se facilita la conciliación de la vida laboral y familiarCOM17 Existe participación de los empleados en los procesos de toma de decisionesCOM18 Aumenta la inversión en RRHH, p.e. con acciones formativas, plan de carrera…
COM19 Aumenta la igualdad de oportunidades en el trabajo, p.e. empleo de personas discapacitadas, promoción de mujeres a posiciones directivas
COM20 Reducción del número de accidentes laboralesCOM21 Mejora la seguridad y salud laboralCOM22 Se mejora la imagen externa de la organizaciónCOM23 Se mejora la imagen interna de la organizaciónCOM24 Se favorece la motivación de los empleados COM25 Se demuestra liderazgo en la comunidadCOM26 Se mejoran las relaciones con la comunidadCOM27 Se patrocinan acciones culturales y deportivas de la comunidadCOM28 Se participa en otras acciones públicas de manera positivaCOM29 Se enfatizan los derechos de los consumidores
Tabla1. Indicadores. Nota: Indicadores en negrita son aquellos que fueron validados en este estudio para las diferentes
escalas de los constructos
-1570-
Intangible Capital – http://dx.doi.org/10.3926/ic.721
Los modelos de ecuaciones estructurales incluyen dos niveles de análisis (el modelo de medida y el
modelo estructural ) (Hair Jr, Sarstedt, Hopkins & Kuppelwieser, 2014). En el análisis del modelo de
medida se verifica cómo los constructos hipotéticos se miden en términos de las variables observadas
(indicadores) y se basa en el cálculo de los componentes principales. El modelo estructural examina las
relaciones entre los constructos (Chen & Chang, 2011). En definitiva el modelo estructural trata de
realizar un análisis similar al de la regresión pero con poder explicativo (Vázquez & Sánchez, 2013),
estudiando los efectos directos e indirectos del conjunto de los constructos.
4.1. Análisis estadísticos
La técnica elegida dentro de SEM es la conocida como Partial Least Squares (PLS), por diferentes
razones pues:
• se ha utilizado previamente en las investigaciones relacionadas con la tecnología (Wang, Chen
& Benitez-Amado, 2015; Chen & Chang, 2011; Pavlou & El Sawy, 2006);
• el uso de PLS se ha recomendado cuando el conocimiento teórico sobre un tema es escaso
(Hair Jr et al., 2014) como es el caso (RSC y empresas tecnologías) y además PLS es más
adecuado para aplicaciones causales y de construcción de teorías (análisis exploratorio) (Roldán
& Sánchez-Franco, 2012; Henseler et al., 2014) aunque también puede ser utilizado para la
confirmación de dichas teorías (análisis confirmatorio) a través de la bondad de ajuste del
modelo estructural (Dijkstra & Henseler, 2015),
• PLS puede estimar modelos con indicadores reflexivos y formativos sin ningún problema de
identificación (Vinzi, Chin, Henseler & Wang, 2010) porque trabaja con compuestos
ponderados en lugar de factores (Gefen, Rigdon & Straub, 2011);
• PLS puede estimar modelos con muestras pequeñas, de hecho, los algoritmos de modelado de
PLS tienden a obtener resultados con altos niveles de potencia estadística (Reinartz, Haenlein
& Henseler, 2009), incluso cuando el tamaño de la muestra es muy modesto (Rigdon, 2014).
Por lo tanto, y siguiendo a Henseler et al. (2014) utilizamos PLS como un instrumento
estadístico destacable para la gestión y la investigación de las organizaciones.
El software utilizado fue SmartPLS 2.0 M3, desarrollado por Ringle, Wende y Will en 2005. Dado que
SmartPLS es un modelo de estimación y análisis SEM, utiliza el proceso de estimación en dos pasos,
-1571-

Intangible Capital – http://dx.doi.org/10.3926/ic.721
evaluando el modelo de medida y el modelo estructural (Hair Jr et al., 2014). En primer lugar, se estima
el modelo de medida, donde se determina la relación entre los indicadores y el constructo (Roldán &
Sánchez-Franco, 2012) y en segundo lugar, se realiza la estimación del modelo estructural, donde se
evalúan las relaciones entre los diferentes constructos, a través de los coeficientes path, su nivel de
significación (R2 Coefficent of determination) y la redundancia validada cruzada (Q2 Cross-validated
redundancy) (Hair Jr et al., 2014).
Esta secuencia asegura que tenemos los indicadores adecuados de los constructos antes de tratar de
llegar a conclusiones sobre las relaciones incluidas en el modelo interno o estructural (Roldán &
Sánchez-Franco, 2012).
4.1.1. Análisis del modelo de medida
En el modelo de medida se definen los constructos (variables latentes) que van a ser utilizados en el
modelo asignándole indicadores a cada uno, por tanto, se contemplan las relaciones entre cada
constructo y sus indicadores basándose en el cálculo de los componentes principales. En los modelos
de medición reflexivos, este análisis se lleva a cabo con referencia a los atributos de fiabilidad individual
del indicador, la fiabilidad del constructo, la validez convergente (Fornell & Larcker, 1981; Tenenhaus,
Vinzi, Chatelin & Lauro, 2005) y la validez discriminante (Hair, Sarstedt, Ringle & Mena, 2012).
La fiabilidad de cada elemento individual se evalúa mediante el análisis del factor de cargas
estandarizadas (λ), o correlaciones simples de los indicadores con su respectivo constructo (Hair Jr et
al., 2014). La fiabilidad del elemento individual es considerado adecuado cuando un indicador tiene un λ
mayor que 0.707 en su respectivo constructo (Carmines & Zeller, 1979). En este estudio, todos los
indicadores reflexivos tienen cargas por encima de 0.710 (cifras en negrita en la Tabla 2).
-1572-
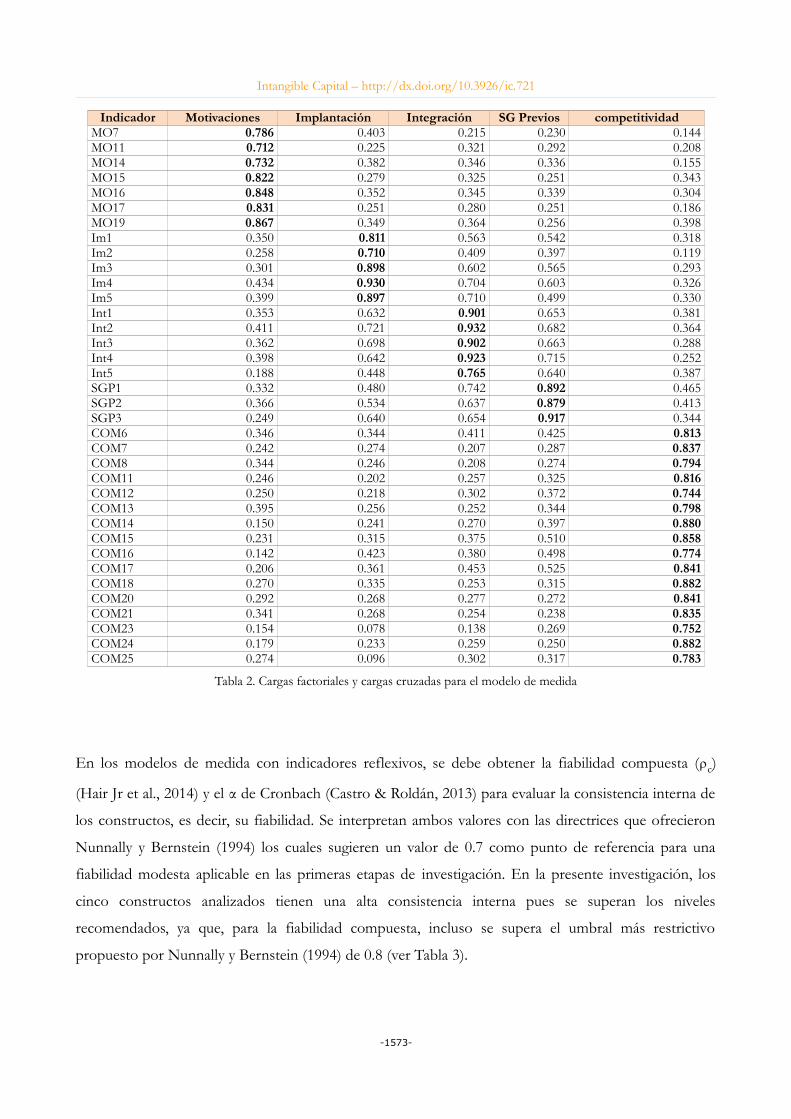
Intangible Capital – http://dx.doi.org/10.3926/ic.721
Indicador Motivaciones Implantación Integración SG Previos competitividadMO7 0.786 0.403 0.215 0.230 0.144MO11 0.712 0.225 0.321 0.292 0.208MO14 0.732 0.382 0.346 0.336 0.155MO15 0.822 0.279 0.325 0.251 0.343MO16 0.848 0.352 0.345 0.339 0.304MO17 0.831 0.251 0.280 0.251 0.186MO19 0.867 0.349 0.364 0.256 0.398Im1 0.350 0.811 0.563 0.542 0.318Im2 0.258 0.710 0.409 0.397 0.119Im3 0.301 0.898 0.602 0.565 0.293Im4 0.434 0.930 0.704 0.603 0.326Im5 0.399 0.897 0.710 0.499 0.330Int1 0.353 0.632 0.901 0.653 0.381Int2 0.411 0.721 0.932 0.682 0.364Int3 0.362 0.698 0.902 0.663 0.288Int4 0.398 0.642 0.923 0.715 0.252Int5 0.188 0.448 0.765 0.640 0.387SGP1 0.332 0.480 0.742 0.892 0.465SGP2 0.366 0.534 0.637 0.879 0.413SGP3 0.249 0.640 0.654 0.917 0.344COM6 0.346 0.344 0.411 0.425 0.813COM7 0.242 0.274 0.207 0.287 0.837COM8 0.344 0.246 0.208 0.274 0.794COM11 0.246 0.202 0.257 0.325 0.816COM12 0.250 0.218 0.302 0.372 0.744COM13 0.395 0.256 0.252 0.344 0.798COM14 0.150 0.241 0.270 0.397 0.880COM15 0.231 0.315 0.375 0.510 0.858COM16 0.142 0.423 0.380 0.498 0.774COM17 0.206 0.361 0.453 0.525 0.841COM18 0.270 0.335 0.253 0.315 0.882COM20 0.292 0.268 0.277 0.272 0.841COM21 0.341 0.268 0.254 0.238 0.835COM23 0.154 0.078 0.138 0.269 0.752COM24 0.179 0.233 0.259 0.250 0.882COM25 0.274 0.096 0.302 0.317 0.783
Tabla 2. Cargas factoriales y cargas cruzadas para el modelo de medida
En los modelos de medida con indicadores reflexivos, se debe obtener la fiabilidad compuesta (rc)
(Hair Jr et al., 2014) y el α de Cronbach (Castro & Roldán, 2013) para evaluar la consistencia interna de
los constructos, es decir, su fiabilidad. Se interpretan ambos valores con las directrices que ofrecieron
Nunnally y Bernstein (1994) los cuales sugieren un valor de 0.7 como punto de referencia para una
fiabilidad modesta aplicable en las primeras etapas de investigación. En la presente investigación, los
cinco constructos analizados tienen una alta consistencia interna pues se superan los niveles
recomendados, ya que, para la fiabilidad compuesta, incluso se supera el umbral más restrictivo
propuesto por Nunnally y Bernstein (1994) de 0.8 (ver Tabla 3).
-1573-
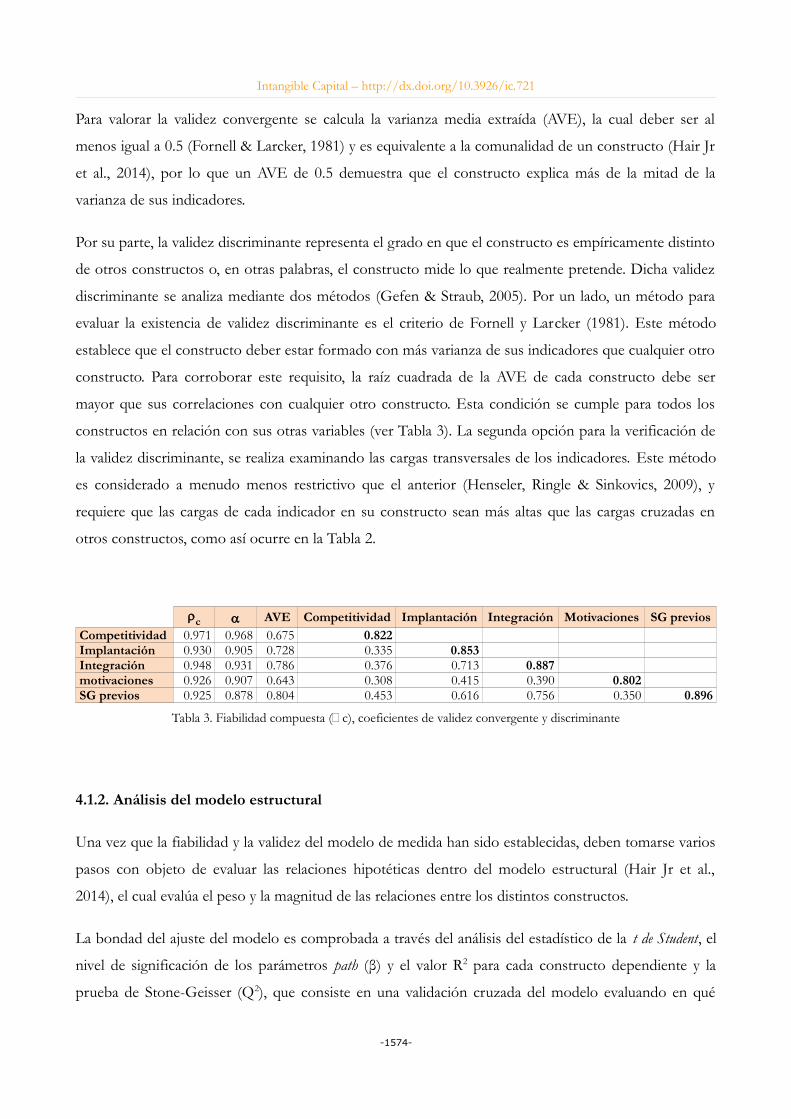
Intangible Capital – http://dx.doi.org/10.3926/ic.721
Para valorar la validez convergente se calcula la varianza media extraída (AVE), la cual deber ser al
menos igual a 0.5 (Fornell & Larcker, 1981) y es equivalente a la comunalidad de un constructo (Hair Jr
et al., 2014), por lo que un AVE de 0.5 demuestra que el constructo explica más de la mitad de la
varianza de sus indicadores.
Por su parte, la validez discriminante representa el grado en que el constructo es empíricamente distinto
de otros constructos o, en otras palabras, el constructo mide lo que realmente pretende. Dicha validez
discriminante se analiza mediante dos métodos (Gefen & Straub, 2005). Por un lado, un método para
evaluar la existencia de validez discriminante es el criterio de Fornell y Larcker (1981). Este método
establece que el constructo deber estar formado con más varianza de sus indicadores que cualquier otro
constructo. Para corroborar este requisito, la raíz cuadrada de la AVE de cada constructo debe ser
mayor que sus correlaciones con cualquier otro constructo. Esta condición se cumple para todos los
constructos en relación con sus otras variables (ver Tabla 3). La segunda opción para la verificación de
la validez discriminante, se realiza examinando las cargas transversales de los indicadores. Este método
es considerado a menudo menos restrictivo que el anterior (Henseler, Ringle & Sinkovics, 2009), y
requiere que las cargas de cada indicador en su constructo sean más altas que las cargas cruzadas en
otros constructos, como así ocurre en la Tabla 2.
rc a AVE Competitividad Implantación Integración Motivaciones SG previosCompetitividad 0.971 0.968 0.675 0.822Implantación 0.930 0.905 0.728 0.335 0.853Integración 0.948 0.931 0.786 0.376 0.713 0.887motivaciones 0.926 0.907 0.643 0.308 0.415 0.390 0.802SG previos 0.925 0.878 0.804 0.453 0.616 0.756 0.350 0.896
Tabla 3. Fiabilidad compuesta (c), coeficientes de validez convergente y discriminante
4.1.2. Análisis del modelo estructural
Una vez que la fiabilidad y la validez del modelo de medida han sido establecidas, deben tomarse varios
pasos con objeto de evaluar las relaciones hipotéticas dentro del modelo estructural (Hair Jr et al.,
2014), el cual evalúa el peso y la magnitud de las relaciones entre los distintos constructos.
La bondad del ajuste del modelo es comprobada a través del análisis del estadístico de la t de Student, el
nivel de significación de los parámetros path (β) y el valor R2 para cada constructo dependiente y la
prueba de Stone-Geisser (Q2), que consiste en una validación cruzada del modelo evaluando en qué
-1574-

Intangible Capital – http://dx.doi.org/10.3926/ic.721
medida los parámetros estimados son útiles para predecir las variables observadas correspondientes a
estos constructos (Roldán & Sánchez-Franco, 2012).
Así en primer lugar, se aceptarán aquellos coeficientes path, y por extensión las hipótesis planteadas, que
sean significativos según una distribución t de Student de una cola con n-1 grados de libertad (Roldán &
Sánchez-Franco, 2012). Estos valores, según Chin (1998) deben ser al menos de 0.2 e idealmente
superar el valor 0.3, por tanto si β <0.2 no hay causalidad y la hipótesis se rechaza (Ramírez-Correa,
2014), en el presente caso todos los β son mayores de 0.2 (ver Tabla 4). De acuerdo con Hair et al.
(2012) se utilizó un bootstrapping (5,000 remuestras) para generar los estadísticos t-Student y su errores
estándar, lo que nos permitió evaluar la significación estadística de los coeficientes path (Castro &
Roldán, 2013) y contrastar las hipótesis, como se observa en la Tabla 4.
Hipótesis b Standard Error t-Student AceptadaH1 Motivaciones->Implantación 0.227 0.087 2.587 SI**H2a SG Previos ->Implantación 0.536 0.100 5.342 SI***H2b SG Previos -> Integración 0.511 0.116 4.404 SI***H3 Implantación->Integración 0.398 0.113 3.507 SI***H4 Integración->Competitividad 0.376 0.114 3.290 SI***Nota: t(0.05, 4999) = 1.645158499, t(0.01. 4999) = 2.327094067, t(0.001, 4999) = 3.091863446* p < 0.05.** p < 0.01.*** p < 0.001.ns. No significativo, basado en t (4999), test de una-cola.
Tabla 4. Contraste de hipótesis planteadas
En segundo lugar, se analiza la varianza explicada. La bondad de un modelo se determina a través de la
fortaleza de cada relación estructural y se analiza utilizando el valor de R 2 para cada constructo
dependiente. Según Falk y Miller, (Falk & Miller, 1992), estos valores deben ser superiores a 0.1 para
poder considerar que el modelo tiene suficiente capacidad predictiva. Así pues, considerando que el R 2
es una medida de la exactitud del modelo (Hair Jr et al., 2014), y que por tanto mide la cantidad de
varianza del constructo que es explicada por el modelo (Serrano-Cinca, Fuertes Callén & Gutiérrez‐ ‐
Nieto, 2007) con los valores 0.75, 0.50, 0.25, respectivamente, se describen los niveles sustanciales,
moderados o débiles de la exactitud de la predicción (Hair Jr et al., 2014; Henseler et al., 2009), como se
puede observar en la Figura 2, todos los R2 están entre el 0.1 y el 0.75, por lo que tienen una capacidad
predictiva en diferente grado.
-1575-
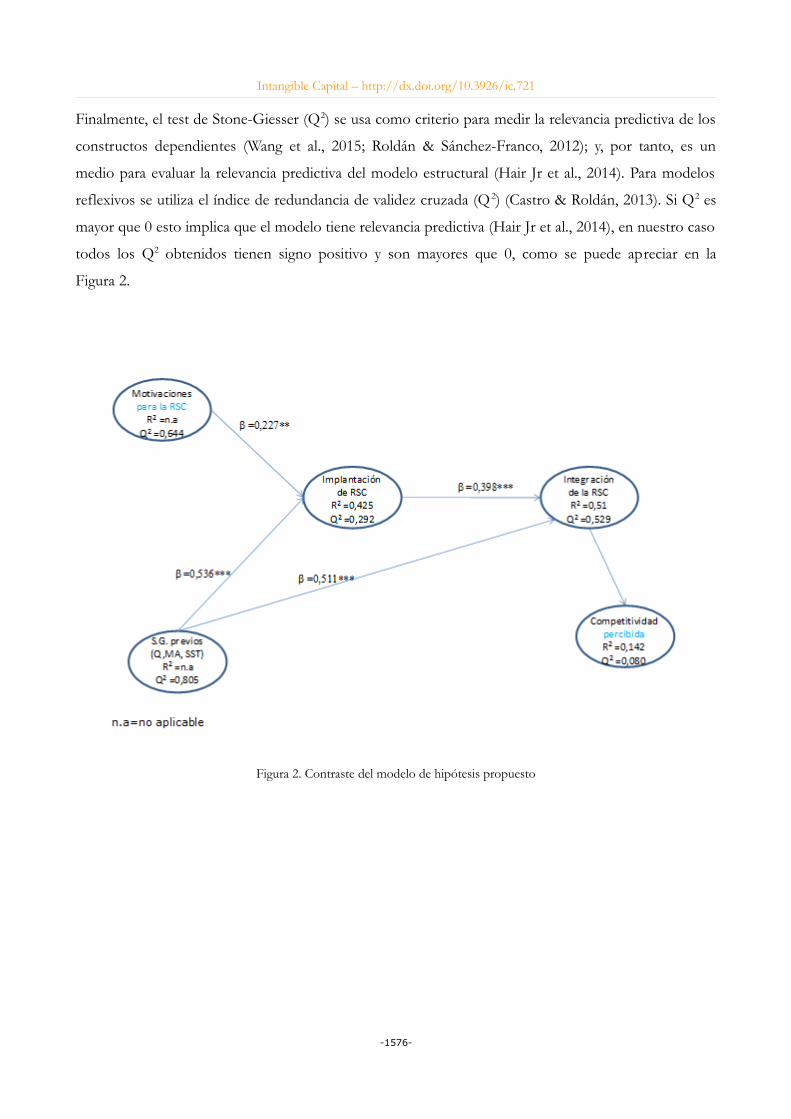
Intangible Capital – http://dx.doi.org/10.3926/ic.721
Finalmente, el test de Stone-Giesser (Q2) se usa como criterio para medir la relevancia predictiva de los
constructos dependientes (Wang et al., 2015; Roldán & Sánchez-Franco, 2012); y, por tanto, es un
medio para evaluar la relevancia predictiva del modelo estructural (Hair Jr et al., 2014). Para modelos
reflexivos se utiliza el índice de redundancia de validez cruzada (Q 2) (Castro & Roldán, 2013). Si Q2 es
mayor que 0 esto implica que el modelo tiene relevancia predictiva (Hair Jr et al., 2014), en nuestro caso
todos los Q2 obtenidos tienen signo positivo y son mayores que 0, como se puede apreciar en la
Figura 2.
Figura 2. Contraste del modelo de hipótesis propuesto
-1576-
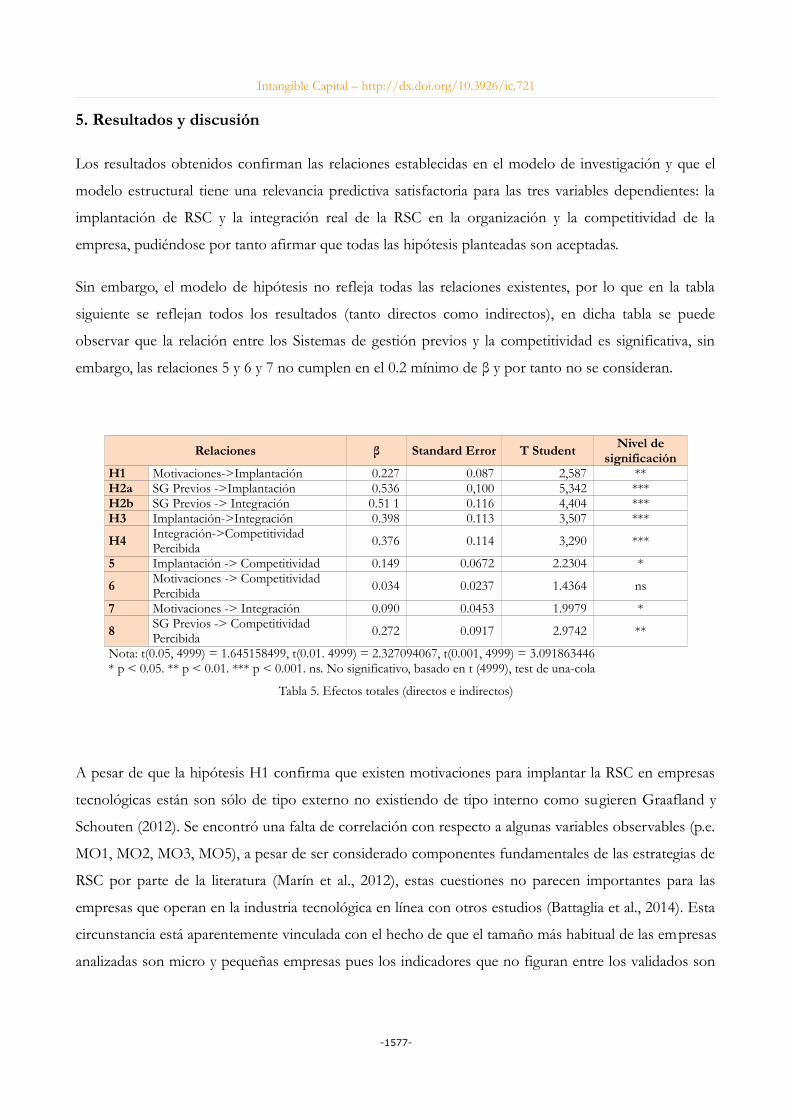
Intangible Capital – http://dx.doi.org/10.3926/ic.721
5. Resultados y discusión
Los resultados obtenidos confirman las relaciones establecidas en el modelo de investigación y que el
modelo estructural tiene una relevancia predictiva satisfactoria para las tres variables dependientes: la
implantación de RSC y la integración real de la RSC en la organización y la competitividad de la
empresa, pudiéndose por tanto afirmar que todas las hipótesis planteadas son aceptadas.
Sin embargo, el modelo de hipótesis no refleja todas las relaciones existentes, por lo que en la tabla
siguiente se reflejan todos los resultados (tanto directos como indirectos), en dicha tabla se puede
observar que la relación entre los Sistemas de gestión previos y la competitividad es significativa, sin
embargo, las relaciones 5 y 6 y 7 no cumplen en el 0.2 mínimo de β y por tanto no se consideran.
Relaciones β Standard Error T Student Nivel designificación
H1 Motivaciones->Implantación 0.227 0.087 2,587 **H2a SG Previos ->Implantación 0.536 0,100 5,342 ***H2b SG Previos -> Integración 0.51 1 0.116 4,404 ***H3 Implantación->Integración 0.398 0.113 3,507 ***
H4 Integración->Competitividad Percibida 0.376 0.114 3,290 ***
5 Implantación -> Competitividad 0.149 0.0672 2.2304 *
6 Motivaciones -> Competitividad Percibida
0.034 0.0237 1.4364 ns
7 Motivaciones -> Integración 0.090 0.0453 1.9979 *
8 SG Previos -> Competitividad Percibida 0.272 0.0917 2.9742 **
Nota: t(0.05, 4999) = 1.645158499, t(0.01. 4999) = 2.327094067, t(0.001, 4999) = 3.091863446* p < 0.05. ** p < 0.01. *** p < 0.001. ns. No significativo, basado en t (4999), test de una-cola
Tabla 5. Efectos totales (directos e indirectos)
A pesar de que la hipótesis H1 confirma que existen motivaciones para implantar la RSC en empresas
tecnológicas están son sólo de tipo externo no existiendo de tipo interno como sugieren Graafland y
Schouten (2012). Se encontró una falta de correlación con respecto a algunas variables observables (p.e.
MO1, MO2, MO3, MO5), a pesar de ser considerado componentes fundamentales de las estrategias de
RSC por parte de la literatura (Marín et al., 2012), estas cuestiones no parecen importantes para las
empresas que operan en la industria tecnológica en línea con otros estudios (Battaglia et al., 2014). Esta
circunstancia está aparentemente vinculada con el hecho de que el tamaño más habitual de las empresas
analizadas son micro y pequeñas empresas pues los indicadores que no figuran entre los validados son
-1577-

Intangible Capital – http://dx.doi.org/10.3926/ic.721
aquellos relacionados con los trabajadores. Por tanto, se abriría aquí una posible línea de investigación
entre la RSC y el factor humano en las empresas de ámbito tecnológico.
En referencia a los Sistemas de Gestión Previos (H2), los resultados si confirman lo sugerido por otros
autores en cuanto a que dichos sistemas implantados en la organización son facilitadores de la
integración de la RSC y tienen efectos indirectos positivos (Battaglia et al., 2014) y significativos sobre la
competitividad (ver Tabla 5).
Una vez que se han adoptados medias de RSC esta son asumidas por la organización y se puede usar
para reforzar la estrategia corporativa, tal y como sugieren Isaksson, Kiessling y Harvey (2014) ya que se
produce una integración real (H3) y significativa, por lo que la RSC forma parte de un intangible
estratégico en línea con otros estudios (Bocquet et al., 2013) que contribuye a la innovación y la
competitividad de la empresa tecnológica.
Por otro lado se confirma la relación existente entre la RSC y la competitividad percibida de la empresa
tecnológica planteada en la hipótesis H4 en línea con otros estudios (Hockerts, 2015). De hecho, hay
ciertos factores (p.e. COM6, COM7,COM8, COM13,COM14, COM15, COM21,COM24 y COM25)
que contribuyen a dicha relación como sugieren Hockerts (2015) y Turyakira et al. (2014). Al contrario
de lo que cabria esperar por estos estudios (Turyakira et al., 2014) otros factores no contribuyen a la
competitividad de la empresa tecnológica, (p.e. COM26 y COM27), destacando entre ellos el COM3
“Mejora el acceso a la financiación”, en contradicción con lo planteado por Quintana García et al.
(2013) y lo establecido por Battaglia et al. (2014). Así pues, seria necesario establecer una línea futura de
investigación que llevará a estudiar el efecto de la RSC y el performance financiero-económico en línea
con lo sugerido por algunos autores (Boulouta & Pitelis, 2014; Pamiés & Jiménez, 2011; Van Beurden
& Gössling, 2008).
6. Conclusiones
En el presente estudio, el objetivo ha sido examinar las motivaciones de implantar RSC en empresas
tecnológicas, su implantación e integración y su efecto en la competitividad de dichas empresas a través
de la aplicación de un modelo predictivo y un análisis estadístico, pues, el estudio del papel de las
empresas tecnológicas en la gestión ambiental, la sostenibilidad y en la RSC está aún en sus etapas
iníciales (Wang et al., 2015).
-1578-
Intangible Capital – http://dx.doi.org/10.3926/ic.721
A través del estudio realizado, se pretende cubrir el vacío detectado sobre las motivaciones en empresas
tecnológicas para la implantación de medidas de RSC, ya que si bien existen estudios previos sobre
motivaciones para la RSC, su integración y los resultados en empresas españolas, estos lo hacen desde
un punto de vista regional (Gallardo-Vázquez & Sanchez-Hernandez, 2014; Vintró, Fortuny,
Sanmiquel, Freijo & Edo, 2012) o analizando un único aspecto de dicha relación (Prado-Lorenzo et al.,
2008). Así pues, la ausencia de trabajos empíricos previos que analicen las motivaciones de la RSC en el
sector de la tecnología en España, su integración en la empresa y su efecto sobre la competitividad,
justificó su realización y se considera que viene a añadir un suplemento investigador a los estudios que
relacionan la RSC y su integración en las empresas, pues dicha relación no se estudia con un efecto
directo únicamente, sino que se ha encontrado una relación indirecta a través de los sistemas de gestión
previos como variable de mediación parcial sobre la competitividad.
Este estudio propone un modelo que explica las medidas de RSC en empresas tecnologías y su
influencia en la competitividad de dichas empresas. El modelo revela que el constructo (Integración de
la RSC) tiene una influencia significativa en la competitividad. Para demostrar esto último se han
planteado una serie de hipótesis a través de constructos o variables latentes, las cuales no son
directamente observables y se han asumido que las relaciones entre ellas son complejas. El modelo ha
siso estimado mediante la técnica SEM y ha sido probado usando una muestra de empresas tecnologías
españolas.
Los resultados obtenidos muestran que las motivaciones (en este caso, externas), los sistemas de gestión
previamente adoptados por las empresas y la implantación de medias de RSC están relacionados entre
sí, de tal manera que los sistemas de gestión previos y la implantación de medidas de RSC median
significativamente en el efecto de la integración real de la RSC en la organización y esta a su vez tiene
un efecto directo sobre la competitividad percibida. En consecuencia, los resultados tienen
implicaciones tanto teóricas como prácticas.
Así, la validación del modelo podrá ayudar a emprendedores tecnológicos y directivos a entender
porqué deberían prestar atención a las cuestiones de RSC y qué se espera de los esfuerzos que realizan
hacia el desarrollo medioambiental y social de su organización, más allá del puro desarrollo económico.
Desde un punto de vista práctico las empresas tecnológicas pueden utilizar los resultados de este
estudio como un punto de apoyo para potenciar la integración de la RSC en su estrategia corporativa a
través de medidas concretas de RSC como la formación de sus trabajadores, el conocimiento sostenible
y la comunicación con los stakeholders entre otros y aprovechar las sinergias en la gestión creadas entre
-1579-

Intangible Capital – http://dx.doi.org/10.3926/ic.721
los sistemas de gestión normalizados y la RSC, pues la integración de la RSC en empresas tecnológicas,
como ha quedado demostrado, tiene una relación directa con la competitividad en línea con otros
estudios (De Vries, Terwel, Ellemers & Daamen, 2015; Gallardo-Vázquez & Sanchez-Hernandez, 2014;
Swanson & Zhang, 2012).
A pesar de las aportaciones de este trabajo, también tiene algunas limitaciones. En primer lugar,
mientras que el hecho de que la muestra se restringe a empresas en España podría ser visto como una
falta de generalización de los resultados, también es cierto que nuestros resultados son consistentes con
la literatura y los resultados de estudios anteriores extraídos de muestras no españolas (por ejemplo
Turyakira et al., 2014 ; Hur et al., 2014), que apoya claramente la validez de nuestros resultados más allá
de las fronteras españolas. Además, el presente estudio tiene un enfoque de modelado asociativo,
puesto que va dirigido más hacia la predicción de la causalidad. Mientras que la causalidad garantiza la
capacidad de controlar los eventos, la asociación (predicción) sólo permite un grado limitado de control
(Falk & Miller, 1992).
En segundo lugar, otra limitación se encuentra determinada por la técnica utilizada para el modelo
propuesto: ecuaciones estructurales, que asume una linealidad de las relaciones entre las variables
latentes (Castro & Roldán, 2013).
En tercer lugar, las empresas tecnológicas son organizaciones dinámicas que cambian con el tiempo. En
consecuencia, la investigación futura de las mismas debería medir los constructos analizados a lo largo
de varios periodos de tiempo, teniendo en cuenta la dinámica para configurar las diferentes dimensiones
de la RSC.
Sin embargo, dadas las limitaciones indicadas anteriormente, el trabajo tiene que ser visto como
pionero, ya que representa un punto de partida para los aspectos de la RSC en cualquier empresa
tecnológica y cubre el hueco detectado en la literatura. Por tanto, como futuras líneas de investigación
se propone poner a prueba un modelo estructural que analizará la relación causal entre la orientación de
las empresas tecnológicas hacia la RSC y el performance económico. Los resultados de ese modelo
indicarán si la estrategia de RSC, o en una medida importante, explicarían el éxito competitivo y su
relación con el performance. Si es así, sería una estrategia interesante para las empresas tecnológicas que la
desarrollen determinar cuál es:
• la intención estratégica de la RSC;
• participar en la RSC para obtener un beneficio específico;
-1580-

Intangible Capital – http://dx.doi.org/10.3926/ic.721
• abordar la RSC como una inversión en activos intangibles;
• centrase en una categoría específica de las partes interesadas (por ejemplo, clientes, empleados,
proveedores, etc.);
• decidir cómo comunicar las iniciativas RSC; y
• diseñar y gestionar el proceso de toma de decisiones de la RSC.
Referencias
Albahari, A., Catalano, G., & Landoni, P. (2013). Evaluation of national science park systems: A
theoretical framework and its application to the Italian and Spanish systems. Technology Analysis &
Strategic Management, 25(5), 599-614. https:/doi.org/10.1080/09537325.2013.785508
Alcaraz, A.S., & Rodenas, S.P. (2013). The Spanish Banks in face of the Corporate Social Responsibility
Standards: Previous analysis of the financial crisis. Review of Business Management, 15(49), 562-581.
https:/doi.org/10.7819/rbgn.v15i49.1386
Apospori, E., Zografos, K.G., & Magrizos, S. (2012). SME corporate social responsibility and
competitiveness: A literature review. International Journal of Technology Management, 58(1/2), 10-31.
https:/doi.org/10.1504/IJTM.2012.045786
Arevalo, J.A., Aravind, D., Ayuso, S., & Roca, M. (2013). The Global Compact: an analysis of the
motivations of adoption in the Spanish context. Business Ethics: A European Review, 22(1), 1-15.
https:/doi.org/10.1111/beer.12005
Asif, M., Searcy, C., Zutshi, A., & Ahmad, N. (2011). An integrated management systems approach to
corporate sustainability. European Business Review, 23(4), 353-367.
https:/doi.org/10.1108/09555341111145744
Asif, M., Searcy, C., Zutshi, A., & Fisscher, O.A.M. (2013). An integrated management systems
approach to corporate social responsibility. Journal of Cleaner Production, 56, 7-17.
https:/doi.org/10.1016/j.jclepro.2011.10.034
Bagozzi, R.P., & Yi, Y. (2011). Specification, evaluation, and interpretation of structural equation
models. Journal of the Academy of Marketing Science, 40(1), 8-34. https:/doi.org/10.1007/s11747-011-0278-x
-1581-
Intangible Capital – http://dx.doi.org/10.3926/ic.721
Battaglia, M., Testa, F., Bianchi, L., Iraldo, F., & Frey, M. (2014). Corporate Social Responsibility and
Competitiveness within SMEs of the Fashion Industry: Evidence from Italy and France.
Sustainability, 6(2), 872-893. https:/doi.org/10.3390/su6020872
Baumann-Pauly, D., Wickert, C., Spence, L.J., & Scherer, A.G. (2013). Organizing Corporate Social
Responsibility in Small and Large Firms: Size Matters. Journal of Business Ethics, 115(4), 693-705.
https:/doi.org/10.1007/s10551-013-1827-7
Benito Hernández, S., & Esteban Sánchez, P. (2012). La influencia de las políticas de responsabilidad
social y la pertenencia a redes de cooperación en el capital relacional y estructural de las
microempresas. Investigaciones Europeas de Dirección y Economía de la Empresa, 18(2), 166-176.
https:/doi.org/10.1016/S1135-2523(12)70007-2
Bernal Conesa, J.A., De Nieves Nieto, C., & Briones Peñalver, A.J. (2014). Implantación de la
Responsabilidad Social en la Administración Pública: El caso de las Fuerzas Armadas Españolas.
Revista de Responsabilidad Social de la Empresa, 18(III), 101-124.
Bernardo, M. (2014). Integration of management systems as an innovation: a proposal for a new
model. Journal of Cleaner Production, 82, 132-142. https:/doi.org/10.1016/j.jclepro.2014.06.089
Bernardo, M., Casadesus, M., Karapetrovic, S., & Heras, I. (2012). Integration of standardized
management systems: Does the implementation order matter?. International Journal of Operations &
Production Management, 32(3), 291-307. https:/doi.org/10.1108/01443571211212583
Bernardo, M., Simon, A., Tarí, J.J., & Molina-Azorín, J.F. (2015). Benefits of Management Systems
integration: A literature review. Journal of Cleaner Production. Retrieved February 17, 2015, from:
http://www.sciencedirect.com/science/article/pii/S0959652615000803 https:/doi.org/10.1016/j.jclepro.2015.01.075
Van Beurden, P., & Gössling, T. (2008). The Worth of Values - A Literature Review on the Relation
Between Corporate Social and Financial Performance. Journal of Business Ethics, 82(2), 407-424.
https:/doi.org/10.1007/s10551-008-9894-x
Bocquet, R., Le Bas, C., Mothe, C., & Poussing, N. (2013). Are firms with different CSR profiles equally
innovative? Empirical analysis with survey data. European Management Journal, 31(6), 642-654.
https:/doi.org/10.1016/j.emj.2012.07.001
Boulouta, I., & Pitelis, C.N. (2014). Who Needs CSR? The Impact of Corporate Social Responsibility
on National Competitiveness. Journal of Business Ethics, 119(3), 349-364. https:/doi.org/10.1007/s10551-
013-1633-2
-1582-

Intangible Capital – http://dx.doi.org/10.3926/ic.721
Carmines, E.G., & Zeller, R.A. (1979). Reliability and Validity Assessment. Newbury Park, CA: Sage
Publications. https:/doi.org/10.4135/9781412985642
Castka, P., & Balzarova, M.A. (2008). Adoption of social responsibility through the expansion of
existing management systems. Industrial Management & Data Systems, 108(3-4), 297-309.
https:/doi.org/10.1108/02635570810858732
Castro, I., & Roldán, J.L. (2013). A mediation model between dimensions of social capital. International
Business Review, 22(6), 1034-1050. https:/doi.org/10.1016/j.ibusrev.2013.02.004
Chen, Y.-S., & Chang, C.-H. (2011). Utilize structural equation modeling (SEM) to explore the
influence of corporate environmental ethics: The mediation effect of green human capital. Quality
& Quantity, 47(1), 79-95. https:/doi.org/10.1007/s11135-011-9504-3
Chin, W.W. (1998). Commentary: Issues and opinion on structural equation modeling. JSTOR.
Retrieved April 13, 2015, from: http://www.jstor.org/stable/249674
Chow, W. S., & Chen, Y. (2012). Corporate Sustainable Development: Testing a New Scale Based on the
Mainland Chinese Context. Journal of Business Ethics, 105(4), 519-533. https:/doi.org/10.1007/s10551-011-
0983-x
Dahlsrud, A. (2008). How corporate social responsibility is defined: An analysis of 37 definitions.
Corporate Social Responsibility and Environmental Management, 15(1), 1-13. https:/doi.org/10.1002/csr.132
Damanpour, F., & Gopalakrishnan, S. (2001). The dynamics of the adoption of product and process
innovations in organizations. Journal of Management Studies, 38(1), 45-65. https:/doi.org/10.1111/1467-
6486.00227
De Godos Díez, J.L., Fernández Gago, R., & Cabeza García, L. (2012). Propiedad y control en la puesta
en práctica de la RSC. Cuadernos de Economía y Dirección de la Empresa, 15(1), 1-11.
https:/doi.org/10.1016/j.cede.2011.06.002
De Vries, G., Terwel, B.W., Ellemers, N., & Daamen, D.D.L. (2015). Sustainability or Profitability? How
Communicated Motives for Environmental Policy Affect Public Perceptions of Corporate
Greenwashing. Corporate Social Responsibility and Environmental Management, 22(3), 142-154.
https:/doi.org/10.1002/csr.1327
Díez, J.L.G., & Gago, R.F. (2011). ¿Cómo se percibe la dirección socialmente responsable por parte de
los altos directivos de empresas en España?. Universia Business Review, (29), 32-49.
-1583-

Intangible Capital – http://dx.doi.org/10.3926/ic.721
Dijkstra, T.K., & Henseler, J. (2015). Consistent and asymptotically normal PLS estimators for linear
structural equations. Computational Statistics & Data Analysis, 81, 10-23.
https:/doi.org/10.1016/j.csda.2014.07.008
Falk, R.F., & Miller, N.B. (1992). A Primer for Soft Modeling (1st edition.). Akron, Ohio: Univ of Akron
Pr.
Fornell, C., & Larcker, D. (1981). Evaluating Structural Equation Models with Unobservable Variables
and Measurement Error. Journal of Marketing Research, 18(1), 39-50. https:/doi.org/10.2307/3151312
Gallardo-Vázquez, D., & Sanchez-Hernandez, M.I. (2014). Measuring Corporate Social Responsibility
for competitive success at a regional level. Journal of Cleaner Production, 72, 14-22.
https:/doi.org/10.1016/j.jclepro.2014.02.051
García-Sánchez, I.-M., Frías-Aceituno, J.-V., & Rodríguez-Domínguez, L. (2013). Determinants of
corporate social disclosure in Spanish local governments. Journal of Cleaner Production, 39, 60-72.
https:/doi.org/10.1016/j.jclepro.2012.08.037
Gefen, D., Rigdon, E.E., & Straub, D. (2011). An Update and Extension to SEM Guidelines for
Administrative and Social Science Research. Mis Quarterly, 35(2), III-XIV.
Gefen, D., & Straub, D. (2005). A practical guide to factorial validity using PLS-Graph: Tutorial and
annotated example. Communications of the Association for Information systems, 16(1), 5.
Goldsmith, S. (2010). The Power of Social Innovation: How Civic Entrepreneurs Ignite Community Networks for
Good. San Francisco, CA: John Wiley & Sons.
Graafland, J., & Schouten, C.M.-V. Der D. (2012). Motives for Corporate Social Responsibility. De
Economist, 160(4), 377-396. https:/doi.org/10.1007/s10645-012-9198-5
Guadamillas-Gómez, F.J., Donate-Manzanares, M., & Skerlavaj, M. (2010). The integration of
corporate social responsibility into the strategy of technology-intensive firms: A case study. Zbornik
radova Ekonomskog fakulteta u Rijeci: \vcasopis za ekonomsku teoriju i praksu, 28(1), 9-34.
Hair, J. F., Sarstedt, M., Ringle, C.M., & Mena, J.A. (2012). An assessment of the use of partial least
squares structural equation modeling in marketing research. Journal of the Academy of Marketing Science,
40(3), 414-433. https:/doi.org/10.1007/s11747-011-0261-6
Hair Jr, J.F., Sarstedt, M., Hopkins, L., & Kuppelwieser, V.G. (2014). Partial least squares structural
equation modeling (PLS-SEM): An emerging tool in business research. European Business Review,
26(2), 106-121. https:/doi.org/10.1108/EBR-10-2013-0128
-1584-

Intangible Capital – http://dx.doi.org/10.3926/ic.721
Hammann, E.-M., Habisch, A., & Pechlaner, H. (2009). Values that create value: socially responsible
business practices in SMEs - empirical evidence from German companies. Business Ethics: A
European Review, 18(1), 37-51. https:/doi.org/10.1111/j.1467-8608.2009.01547.x
Henseler, J., Dijkstra, T.K., Sarstedt, M., Ringle, C.M., Diamantopoulos, A., Straub, D. W. et al. (2014).
Common Beliefs and Reality About PLS: Comments on Ronnkko and Evermann (2013).
Organizational Research Methods, 17(2), 182-209. https:/doi.org/10.1177/1094428114526928
Henseler, J., Ringle, C.M., & Sinkovics, R.R. (2009). The use of partial least squares path modeling in
international marketing. New Challenges to International Marketing, Advances in International
Marketing, 1-0(20), 277-319. Emerald Group Publishing Limited. Retrieved April 9, 2015, from:
http://www.emeraldinsight.com/doi/abs/10.1108/S1474-7979(2009)0000020014
Herrera, J., Larrán, M., & Martínez-Martínez, D. (2013). Relación entre responsabilidad social y
performance en las pequeñas y medianas empresas: Revisión bibliográfica. Cuadernos de Gestión, 13(2),
39-65. https:/doi.org/10.5295/cdg.120360jh
Hillenbrand, C., Money, K., & Ghobadian, A. (2013). Unpacking the Mechanism by which Corporate
Responsibility Impacts Stakeholder Relationships. British Journal of Management, 24(1), 127-146.
https:/doi.org/10.1111/j.1467-8551.2011.00794.x
Hockerts, K. (2015). A Cognitive Perspective on the Business Case for Corporate Sustainability: A
Cognitive Perspective of the Business Case. Business Strategy and the Environment, 24(2), 102-122.
https:/doi.org/10.1002/bse.1813
Homburg, C., & Stebel, P. (2009). Determinants of contract terms for professional services. Management
Accounting Research, 20(2), 129-145. https:/doi.org/10.1016/j.mar.2008.10.001
Hur, W.-M., Kim, H., & Woo, J. (2014). How CSR Leads to Corporate Brand Equity: Mediating
Mechanisms of Corporate Brand Credibility and Reputation. Journal of Business Ethics, 125(1), 75-86.
https:/doi.org/10.1007/s10551-013-1910-0
Isaksson, L., Kiessling, T., & Harvey, M. (2014). Corporate social responsibility: Why bother?.
Organizational Dynamics, 43(1), 64-72. https:/doi.org/10.1016/j.orgdyn.2013.10.008
Janssen, C., Sen, S., & Bhattacharya, C. (2015). Corporate crises in the age of corporate social
responsibility. Business Horizons, Emerging Issues In Crisis Management, 58(2), 183-192.
https:/doi.org/10.1016/j.bushor.2014.11.002
-1585-
Intangible Capital – http://dx.doi.org/10.3926/ic.721
Jimenez-Zarco, A.I., Cerdan-Chiscano, M., & Torrent-Sellens, J. (2013). Challenges and Opportunities
in the Management of Science Parks: design of a tool based on the analysis of resident companies.
Review of Business Management. Retrieved February 10, 2014, from;
http://apps.webofknowledge.com/InboundService.do?
SID=P26vG5IkeT12mbD3PbS&product=WOS&UT=000327498300003&SrcApp=CR&DestFail=http%3A%2F
%2Fwww.webofknowledge.com&Init=Yes&action=retrieve&Func=Frame&customersID=PCS&IsProductCode=Yes&
mode=FullRecord https:/doi.org/10.7819/rbgn.v15i48.1503
Karapetrovic, S., & Casadesús, M. (2009). Implementing environmental with other standardized
management systems: Scope, sequence, time and integration. Journal of Cleaner Production, 17(5),
533-540. https:/doi.org/10.1016/j.jclepro.2008.09.006
Law, K.M.Y., & Gunasekaran, A. (2012). Sustainability development in high-tech manufacturing firms
in Hong Kong: Motivators and readiness. International Journal of Production Economics, 137(1), 116-125.
https:/doi.org/10.1016/j.ijpe.2012.01.022
Lee, E.M., Park, S.-Y., & Lee, H.J. (2013). Employee perception of CSR activities: Its antecedents and
consequences. Journal of Business Research, 66(10), 1716-1724. https:/doi.org/10.1016/j.jbusres.2012.11.008
Lindgreen, A., Antioco, M., Palmer, R., & Van Heesch, T. (2009). High-tech, innovative products:
identifying and meeting business customers’ value needs. Journal of Business & Industrial Marketing ,
24(3/4), 182-197. https:/doi.org/10.1108/08858620910939732
Lorenzo, J.M.P., Sánchez, I.M.G., & Álvarez, I.G. (2009). Características del consejo de administración e
información en materia de responsabilidad social corporativa. Revista española de financiación y
contabilidad, (141), 107-135. https:/doi.org/10.1080/02102412.2009.10779664
Luna Sotorrío, L., & Fernández Sánchez, J.L. (2010). Corporate social reporting for different audiences:
the case of multinational corporations in Spain. Corporate Social Responsibility and Environmental
Management, 17(5), 272-283. https:/doi.org/10.1002/csr.215
Marín, L., Rubio, A., & De Maya, S.R. (2012). Competitiveness as a Strategic Outcome of Corporate
Social Responsibility: Competitiveness and CSR. Corporate Social Responsibility and Environmental
Management, 19(6), 364-376. https:/doi.org/10.1002/csr.1288
Martínez-Campillo, A., Cabeza-García, L., & Marbella-Sánchez, F. (2013). Responsabilidad social
corporativa y resultado financiero: Evidencia sobre la doble dirección de la causalidad en el sector de
las Cajas de Ahorros. Cuadernos de Economía y Dirección de la Empresa, 16(1), 54-68.
https:/doi.org/10.1016/j.cede.2012.04.005
-1586-
Intangible Capital – http://dx.doi.org/10.3926/ic.721
Melé, D., Argandoña, A., & Sanchez-Runde, C. (2011). Facing the Crisis: Toward a New Humanistic
Synthesis for Business. Journal of Business Ethics, 99(1), 1-4. https:/doi.org/10.1007/s10551-011-0743-y
Melé, D., Debeljuh, P., & Arruda, M.C. (2006). Corporate Ethical Policies in Large Corporations in
Argentina, Brazil and Spain. Journal of Business Ethics, 63(1), 21-38. https:/doi.org/10.1007/s10551-005-
7100-y
Mendoza, S., De Nieves, C., & Briones, A.J. (2010). Capacidades Empresariales en Responsabilidad
Social y Cooperación en los Agronegocios de la Región de Murcia.
Moseñe, J.A., Burritt, R.L., Sanagustín, M.V., Moneva, J.M., & Tingey-Holyoak, J. (2013).
Environmental reporting in the Spanish wind energy sector: An institutional view. Journal of Cleaner
Production, 40, 199-211. https:/doi.org/10.1016/j.jclepro.2012.08.023
Nunnally, J.C., & Bernstein, I.H. (1994). Psychometric Theory (3rd edition.). New York: McGraw-Hill.
Pamiés, D.S., & Jiménez, J.A. (2011). La naturaleza de la relación entre la responsabilidad social de la
empresa (RSE) y el resultado financiero. Revista europea de dirección y economía de la empresa, 20(4),
161-176.
Pavlou, P.A., & El Sawy, O.A. (2006). From IT Leveraging Competence to Competitive Advantage in
Turbulent Environments: The Case of New Product Development. Information Systems Research,
17(3), 198-227. https:/doi.org/10.1287/isre.1060.0094
Pérez, A., & Del Bosque, I.R. (2012). Measuring CSR Image: Three Studies to Develop and to Validate
a Reliable Measurement Tool. Journal of Business Ethics, 118(2), 265-286. https:/doi.org/10.1007/s10551-
012-1588-8
Pérez Ruiz, A., & Rodríguez Del Bosque, I. (2012). La imagen de Responsabilidad Social Corporativa
en un contexto de crisis económica: El caso del sector financiero en España. Universia Business Review,
33, 14-29.
Perrini, F., Russo, A., & Tencati, A. (2007). CSR Strategies of SMEs and Large Firms. Evidence from
Italy. Journal of Business Ethics, 74(3), 285-300. https:/doi.org/10.1007/s10551-006-9235-x
Prado-Lorenzo, J.-M., Gallego-Álvarez, I., García-Sánchez, I.-M., & Rodríguez-Domínguez, L. (2008).
Social responsibility in Spain: Practices and motivations in firms. Management Decision, 46(8),
1247-1271. https:/doi.org/10.1108/00251740810901417
Prahalad, C.K. & Ramaswamy, V. (2004). Co creating unique value with customers. ‐ Strategy &
Leadership, 32(3), 4-9. https:/doi.org/10.1108/10878570410699249
-1587-
Intangible Capital – http://dx.doi.org/10.3926/ic.721
Prajogo, D., Tang, A.K.Y., & Lai, K. (2012). Do firms get what they want from ISO 14001 adoption?:
An Australian perspective. Journal of Cleaner Production, 33, 117-126.
https:/doi.org/10.1016/j.jclepro.2012.04.019
Quintana García, C., Benavides Velasco, C.A., & Guzmán Parra, V.F. (2013). Capacidades de
investigación y directivas: señales informativas en la salida a bolsa de las empresas de base
tecnológica. Cuadernos de Economía y Dirección de la Empresa, 16(4), 270-280.
https:/doi.org/10.1016/j.cede.2013.06.005
Ramírez-Correa, P. (2014). Uso de internet móvil en Chile: Explorando los antecedentes de su
aceptación a nivel individual. Ingeniare. Revista chilena de ingeniería, 22(4), 560-566.
https:/doi.org/10.4067/S0718-33052014000400011
Ramos, M.I.G., Manzanares, M.J.D., & Gómez, F.G. (2014). El efecto del papel mediador de la
reputación corporativa en la relación entre la rsc y los resultados económicos. Revista de Estudios
Empresariales. Segunda Época, (1). Retrieved March 12, 2015, from:
http://revistaselectronicas.ujaen.es/index.php/REE/article/view/1378
Ratinho, T., & Henriques, E. (2010). The role of science parks and business incubators in converging
countries: Evidence from Portugal. Technovation, 30(4), 278-290.
https:/doi.org/10.1016/j.technovation.2009.09.002
Reinartz, W., Haenlein, M., & Henseler, J. (2009). An empirical comparison of the efficacy of
covariance-based and variance-based SEM. International Journal of Research in Marketing , 26(4),
332-344. https:/doi.org/10.1016/j.ijresmar.2009.08.001
Rigdon, E.E. (2014). Rethinking Partial Least Squares Path Modeling: Breaking Chains and Forging
Ahead. Long Range Planning, Rethinking Partial Least Squares Path Modeling: Looking Back and Moving
Forward, 47(3), 161-167. https:/doi.org/10.1016/j.lrp.2014.02.003
Rives, L.M., & Bañón, A.R. (2008). La responsabilidad social corporativa como determinante del éxito
competitivo: Un análisis empírico. Revista europea de dirección y economía de la empresa, 17(3), 27-42.
Rodríguez Gutiérrez, P., Fuentes García, F.J., & Sánchez Cañizares, S. (2013). Revelación de
información sobre clientes, comunidad, empleados y medio ambiente en las entidades financieras
españolas a través de las memorias de responsabilidad social corporativa (2007-2010). Investigaciones
Europeas de Dirección y Economía de la Empresa, 19(3), 180-187. https:/doi.org/10.1016/j.iedee.2012.12.002
-1588-

Intangible Capital – http://dx.doi.org/10.3926/ic.721
Roldán, J.L., & Sánchez-Franco, M.J. (2012). Variance-Based Structural Equation Modeling: Guidelines
for Using Partial Least Squares. Research methodologies, innovations and philosophies in software systems
engineering and information systems, 193-221. https:/doi.org/10.4018/978-1-4666-0179-6.ch010
Serrano Cinca, C., Fuertes Callén, Y., & Gutiérrez Nieto, B. (2007). Online reporting by banks: A‐ ‐ ‐
structural modelling approach. Online Information Review, 31(3), 310-332.
https:/doi.org/10.1108/14684520710764096
Simon, A., Karapetrovic, S., & Casadesús, M. (2012). Difficulties and benefits of integrated
management systems. Industrial Management & Data Systems, 112(5), 828-846.
https:/doi.org/10.1108/02635571211232406
Spence, L.J. (2007). CSR and Small Business in a European Policy Context: The Five “C”s of CSR and
Small Business Research Agenda 2007. Business and Society Review, 112(4), 533-552.
https:/doi.org/10.1111/j.1467-8594.2007.00308.x
Suñe, A., Bravo, E., Mundet, J., & Herrera, L. (2012). Buenas prácticas de innovación: Un estudio
exploratorio de empresas tecnológicas en el sector audiovisual español. Investigaciones Europeas de
Dirección y Economía de la Empresa, 18(2), 139-147. https:/doi.org/10.1016/S1135-2523(12)70004-7
Swanson, L.A., & Zhang, D.D. (2012). Perspectives on corporate responsibility and sustainable
development. Management of Environmental Quality: An International Journal, 23(6), 630-639.
https:/doi.org/10.1108/14777831211262918
Tenenhaus, M., Vinzi, V.E., Chatelin, Y.M., & Lauro, C. (2005). PLS path modeling. Computational
Statistics & Data Analysis, 48(1), 159-205. https:/doi.org/10.1016/j.csda.2004.03.005
Turyakira, P., Venter, E., & Smith, E. (2014). The impact of corporate social responsibility factors on
the competitiveness of small and medium-sized enterprises. South African Journal of Economic and
Management Sciences, 17(2), 157-172.
Vásquez-Urriago, Á.R., Barge-Gil, A., & Rico, A.M. (2012). Los parques científicos y tecnológicos
españoles, impulsores de la cooperación en innovación. ICE: Revista de Economía, 869, 99-114.
Vásquez-Urriago, Á.R., Barge-Gil, A., Rico, A.M., & Paraskevopoulou, E. (2014). The impact of
science and technology parks on firms’ product innovation: empirical evidence from Spain. Journal
of Evolutionary Economics, 24, 835-873. https:/doi.org/10.1007/s00191-013-0337-1
Vázquez, D.G., & Sánchez, M.I. (2013). Análisis de la incidencia de la responsabilidad social empresarial
en el éxito competitivo de las microempresas y el papel de la innovación. Universia Business Review, 38,
14-31.
-1589-
Intangible Capital – http://dx.doi.org/10.3926/ic.721
Vázquez-Carrasco, R., & López-Pérez, M.E. (2013). Small & medium-sized enterprises and Corporate
Social Responsibility: A systematic review of the literature. Quality & Quantity, 47(6), 3205-3218.
https:/doi.org/10.1007/s11135-012-9713-4
Vidales, K.B.V., & Ortiz, D.A.A. (2014). Responsabilidad social de las empresas agrícolas y
agroindustriales aguacateras de Uruapan, Michoacán, y sus implicaciones en la competitividad.
Contaduría y Administración, 59(4), 223-251. https:/doi.org/10.1016/S0186-1042(14)70161-5
Vilanova, M., Lozano, J.M., & Arenas, D. (2009). Exploring the Nature of the Relationship Between
CSR and Competitiveness. Journal of Business Ethics, 87(S1), 57-69. https:/doi.org/10.1007/s10551-008-
9812-2
Vintró, C., Fortuny, J., Sanmiquel, L., Freijo, M., & Edo, J. (2012). Is corporate social responsibility
possible in the mining sector? Evidence from Catalan companies. Resources Policy, 37(1), 118-125.
https:/doi.org/10.1016/j.resourpol.2011.10.003
Vinzi, V.E., Chin, W.W., Henseler, J., & Wang, H. (2010). Handbook of Partial Least Squares: Concepts,
Methods and Applications. Springer Science & Business Media. Berlin: Springer.
Von Ahsen, A. (2014). The Integration of Quality, Environmental and Health and Safety Management
by Car Manufacturers – a Long-Term Empirical Study. Business Strategy and the Environment, 23(6),
395-416. https:/doi.org/10.1002/bse.1791
Waddock, S. (2004). Parallel Universes: Companies, Academics, and the Progress of Corporate
Citizenship. Business and Society Review, 109(1), 5-42. https:/doi.org/10.1111/j.0045-3609.2004.00002.x
Wang, Y., Chen, Y., & Benitez-Amado, J. (2015). How information technology influences environmental
performance: Empirical evidence from China. International Journal of Information Management, 35(2),
160-170. https:/doi.org/10.1016/j.ijinfomgt.2014.11.005
Intangible Capital, 2016 (www.intangiblecapital.org)
Article's contents are provided on an Attribution-Non Commercial 3.0 Creative commons license. Readers are allowed to copy, distribute
and communicate article's contents, provided the author's and Intangible Capital's names are included. It must not be used for
commercial purposes. To see the complete license contents, please visit http://creativecommons.org/licenses/by-nc/3.0/.
-1590-