Embed Size (px)
Citation preview

1
++++++++++++++++++++++++++++++++++++++++++++++++++++++++++++++++++++++++++++++++++
+++++++++++++++++++++++++++++++++++++++++++++++++++++++++
CSO housing market study
Deliverable 2.2
Deliverable Report -Proficient D2.2 – CSO housing market study - [Public]
PROFICIENT; SME network business model for collective self-organised processes in the construction and retrofit of energy-efficient residential districts
The Proficient project is co-financed by the European Commission under the seventh research framework programme(FP7-201 2 -NMP-ENV-ENERGY-ICT-EeB; GA No. 312219)

2
Issue Date 7 March 2014 Produced by Metropolitan Research Institute Main authors Éva Gerőházi, József Hegedüs, Hanna Szemző (MRI) Contributors Information was provided by IAA, LCH, LLL, RDF, SIN, SOL, STU, TNO Version: final Reviewed by IAA and SOL Approved by Rizal Sebastian (TNO) Dissemination Public
Colophon
Copyright © 2012 by Proficient consortium
Use of any knowledge, information or data contained in this document shall be at the user's sole risk. Neither the PROFICIENT Consortium nor any of its members, their officers, employees or agents accept shall be liable or responsible, in negligence or otherwise, for any loss, damage or expense whatever sustained by any person as a result of the use, in any manner or form, of any knowledge, information or data contained in this document, or due to any inaccuracy, omission or error therein contained. If you notice information in this publication that you believe should be corrected or updated, please contact us. We shall try to remedy the problem.
The authors intended not to use any copyrighted material for the publication or, if not possible, to indicate the copyright of the respective object. The copyright for any material created by the authors is reserved. Any duplication or use of objects such as diagrams, sounds or texts in other electronic or printed publications is not permitted without the author's agreement.
The Proficient project is co-financed by the European Commission under the seventh research framework programme with contract No.: 312219. The information in this publication does not necessarily represent the view of the European Commission. The European Commission shall not in any way be liable or responsible for the use of any such knowledge, information or data, or of the consequences thereof.
CSO housing market study

3
Table of Contents
1. PUBLISHABLE EXECUTIVE SUMMARY 5
1.1 Housing and energy market trends 5
1.2 Consequences of the housing market trends to market segmentation 8
2. INTRODUCTION 10
2.1 The energy efficiency gap theory 10
2.2 The structure of the housing market study 14
3. TRENDS IN THE ENERGY MARKET 16
3.1 Energy prices 16
3.1.1 Factors that influence wholesale energy prices 16
3.1.2 Energy regimes 18
3.2 Energy consumption of the housing stock 22
4. THE CHANGING EUROPEAN HOUSING MARKET 25
4.1 Living conditions and housing production in Europe 25
4.2 The structure of the European housing market 31
4.3 The effect of the financial-economic crisis 37
4.4 Regional patterns of housing market development 39
4.5 How sub-national housing markets are influenced by the local circumstances 44
4.5.1 Regional differences within a nation 44
5. COLLECTIVE SELF ORGANIZED HOUSING (CSO) IN EUROPE 47
5.1 Definition 47
5.2 Newly constructed CSOs 48
5.2.1 Co- housing 53
5.3 CSOs and retrofitting 57
5.4 CSO values 61
5.4.1 Community life 61
5.4.2 Green values and energy efficiency 62
5.4.3 Sharing and collaborative characteristics of CSOs 63
6. ENERGY EFFICIENT INTERVENTIONS – PAST AND POTENTIALS 65
6.1 Energy efficient interventions already implemented 65
6.2 Energy efficient interventions: the future 68

4
6.2.1 Potential in new construction 68
6.2.2 Potential in retrofitting 68
6.3 Potentials in district level interventions 70
6.3.1 In new construction schemes 70
6.3.2 In retrofitting schemes 70
6.4 The potential of the ESCOs 72
7. BIBLIOGRAPHY 76

5
1. Publishable executive summary
1.1 Housing and energy market trends
The housing market study focused on the recent changes and short-term predictions with regard to the
development of the European housing and energy markets. While doing so it employed the central concepts of
Proficient: CSO (collective self-organised) housing, district level intervention and the inclusion of ESCO
companies. It aimed at understanding the dynamism of the post -crisis European housing market, and hoped to
understand under what circumstances households opted for energy efficient and green value dominated
refurbishment of their existing homes or decided to build a new one according to these values.
Locality emerged as a key concept in the study. In the post-crisis era we cannot talk about a generally good
perspective for the European housing and energy market. Rather, the outlook depends on a set of locally and
nationally determined circumstances, which can change within a fairly short distance and also within a limited
amount of time. Tradition also seems to matter a lot: as it was demonstrated the spread of CSO construction and
the importance of green values are currently the most important in the Nordic and the German speaking countries
of Europe, and this trend changes very slowly. But even in these countries the construction of CSO housing or the
complete refurbishment of an old building according to the most recent energy efficient and green principles
remains a niche market.
About the European housing market it was established that:
The European housing market is a predominantly owner occupied one. After the privatization process of
the 1990s the share of owner occupation exceeded 90% in most Central-Eastern European countries
and it was traditionally over 70-80% in the Mediterranean countries however it reached 53-84% by 2011
in Western and Northern Europe as well as a results of privatization and the decreasing share of new
rental constructions.
Still, the importance of owner occupation is transforming. Although the share of owner occupation is still
increasing slightly, public thinking about it has changed. There is much more talk about the importance
of a good rental market, especially in countries that were hit harder by the real estate crisis.
After the housing market crush of the late 2000s the recovery has been slow and sporadic. While certain
countries – like Germany, Austria or Norway – have been doing particularly well, many seem to be
lagging behind, like the Mediterranean and some Central European member states. Metropolitan regions
seem to follow a pattern of their own, increasing even in areas with no national growth – like Paris – and
remaining untouched by their national turmoil, like London.
Despite the existence of some major common trends it makes sense to talk about a segmented
European housing market, with very different forecasts for growth. The housing markets are embedded
into their sub-national contexts, where demographic movements, the economic and political importance
of a settlement in the regional/national/international context further influence, how they develop. Weak
cities, global cities, charter cities, smaller settlements in developing industrial areas, holiday destinations,
and suburbs all have a different development dynamics, meaning that within a national context various

6
settlements can perform in a radically different way. Settlements can outperform their countries and vica
versa, plus even within these settlements there is mostly no homogeneous market.
Much attention has been paid in the study to a special segment of the housing market: that of the CSOs
(collective self-organized housing). It was established that the market segment of collective self-organized
housing is radically different in case of new construction and retrofitting. CSOs in new construction mean that
group of people start a housing project in order to live according to their shared life-style vision. Thus, CSOs in
the new construction sector mostly mean co-housings, which have a common vision not only about the
construction itself but the way of life they would like to share with each other.
The share of CSOs in the new construction market is low. (It means that those part of the new construction
sector, where the future residents have a substantial role in deciding the architectural concept takes up a marginal
share of new construction.) The share of CSOs in the new construction sector can only be statistically measured
in four countries of the EU (Denmark, Germany, Netherlands, Sweden), but even there it is less than 5%. There
are some dozens of examples in other countries like Italy, France, Spain, Belgium, UK. However, CSOs in the
new construction sector can be very important in local context. In – and around - some European cities
CSOs became a relevant part of the new construction industry on which it is worth to establish a business and
public policy framework. (E.g. in and around bigger German cities, The Hague)
The share of residential communities that we can consider CSOs is substantially bigger in the already existing
stock if we regard all dwellings CSOs where the residents have full right to initiate and influence the retrofitting
process. All those dwelling belong to this category where the residents (being mostly owners but sometimes
tenants as well) have the right to express their wish directly or throughout an institutional framework (like general
assemblies, committees of the owners, etc.) Multi-family housing are more likely to be tenant based in Western
and Northern Europe (residential blocks owned by public or private bodies), while they are more likely to be owner
occupied in Southern and Eastern Europe (in the later case 30-60% of the housing stock could be considered as
a CSO). As a result one can observe that energy efficient retrofitting of the housing stock happens in the CSO
sector rather in Southern and Eastern-Europe while it is more common concerning the tenement sector in
Western and Northern-Europe. CSOs in the already existing stock not necessarily carry those features that are
very common in the new construction sector: strong community commitment, strong green values and sharing of
infrastructure and facilities.
Family housing could also be considered as a CSO in the retrofitting process where in a certain neighborhood the
owners cooperate with each other to implement a coordinated energy efficient intervention. Here it is however
much more complicated to reach this type of cooperation than in one multi-family building as the common interest
is not so obvious and the common governance structure is yet to be set up.
In order to understand how households might consider investments into energy efficiency in the future, the study
also focused on understanding how the energy market functions. It found that:
The trends concerning the energy prices are very uncertain to estimate for the next 10-15 years. In
general there was a constant growth of prices during the last decades, which is likely to continue in the

7
near future in spite of the large scale shale gas/oil resources, the growing energy efficiency and the
decreasing cost of renewables – that are still mostly more expensive than fossils. The reason for this is
that it is expected that the demand for energy will heavily increase as a result of economic development
in Asia, which increases the prices worldwide and thus has a serious impact on the heavily import
dependent European market.
The share of renewables in the energy mix is increasing in Europe and the EU2020 goal on the 20% of
renewable by 2020 seems to be realistic. On the other hand further increase could be questionable
because of its cost implications and the long term contracts and investments (like nuclear power plants)
in some countries.
The influence of the nation states on the retail energy prices is increasing (the wholesale prices are
liberalized in Europe), which makes them less predictable in the future causing uncertainties for
households in deciding about the interventions.
Based on these, the study found the following trends about energy efficiency in the new construction and
retrofitting sector:
Despite the growth of energy efficiency and the increasing importance of energy efficient investments in
the residential sector, the per capita energy consumption had been increasing in Europe (except for the
period of the economic crisis). This is a trend that will most likely continue in the next 10-15 years as well
as a result of growing consumption in general. (On the other hand the proportionate energy need for
producing GDP is constantly decreasing.)
The technical standards of new construction are constantly growing. According to European regulations
all new construction must be of ‘nearly zero-energy’ (the phrase should be defined by the member
states) by 2021. In several regions of Europe passive house is already the standard for new
construction.
Partly as a result, the energy used for heating one m² is constantly decreasing in nearly all member
states. This is partly because of new construction (the decrease is explained by new construction in 50%
in Germany and Slovakia, 35% for France and Netherlands, 27% for Sweden, while around 10% in
Ireland). Most of the energy saving however comes from the retrofitting process.
Currently it is more cost effective to ‘produce’ one MWh by retrofitting measures than by creating new
capacities of fossil and moreover renewable resources. Thus the Europe 2020 environmental goals
could be reach the easiest by retrofitting.
There are several support schemes in all member states for subsidizing energy efficient new
construction and mostly retrofitting measures. These schemes may include tax deductions, interest rate
subsidies and grants. The housing market seems to be very sensitive to these subsidies: large scale
interventions are hardy initiated without making use of any kind of subsidy.
Among energy efficient interventions district level interventions seem to be more and more common, but they
are still mostly in a pilot level phase. As it was mentioned above achieving a base for common interests and a
common governance structure on district level by aggregating privately owned housing units is an extra difficult

8
task compared to a simple construction or retrofitting process. It is more likely to happen in case of new
construction than in case of retrofitting. In the latter case mostly the local governments or their agencies, while
sometimes private actors like housing cooperatives are the bodies that play the role of the integrator that is why
district level organization as a result of a bottom-up approach is hard to find.
In connection with the role of ESCO companies it was discovered that they typically have a very low share in
energy efficient retrofitting interventions and in constructions regarding the housing sector, as this sector has high
transaction costs which reduce the profit expectations. The rental housing sector could operate with less
transaction costs than the owner occupied one (because of the centralized ownership and management), but this
sector does not belong to CSOs, thus is not in the focus of Proficient. Despite these statements, there are some
trends that may promote the slight increase of ESCO participation in the housing sector: higher technical
standards in new constructions and retrofitting, support schemes tied to the measured result of the interventions,
recovering bank sector that can provide more loans under better conditions, and assistance of the European
Union with special EIB schemes.
1.2 Consequences of the housing market trends to market segmentation
One of the main research questions of the housing market study was to define how large (or small) is the
market segment for ‘energy-efficient CSO residential neighbourhoods’ in the EU. The market segment for
energy efficient interventions is quite relevant and its share is growing as the technical standards grow and
subsidy schemes are created to support these activities. The share of CSO activities is substantial in the
retrofitting sector, while below 5% in case of new construction even in those countries where could be discovered
at all. ESCO and district level interventions are only in a piloting phase and rarely happen (rather in case of new
construction). So the adequate answer to this research question is that according to the current market processes
this market segment (where all the above mentioned characteristics are present at the same time) is nearly non-
existent.
The question is whether the current processes can be extrapolated directly to the future or not. Whether there are
any phenomena that can change the current trends. The slight increase of CSOs in the new construction sector
can be expected (however the previous favorable predictions have yet to be realized), as a result of:
community and social values: growing need for looking after the elderly; decreasing time for work thus
increasing time for community activities,
economical operation of infrastructure by means of sharing economy/collective consumption: growing
need for commonly operated facilities (like cars, sports, recreational, child care facilities),
green values: growing environmental consciousness.
On the other hand district level interventions such as the use of ESCO solutions can be more frequent in the
future than currently as they can provide real economic advantages. Nevertheless it is probably unrealistic to
expect that district level CSO energy efficient interventions (even without ESCO solutions) will be ever part of the
mainstream market. Innovative business models can help to increase their market share and that is the goal of
Proficient to elaborate.

9
Possible Proficient goals in connection with the new construction market:
CSO new construction market is by definition a niche market as the share of it is currently marginal, which means
that innovative business models can found their way rather than in a mainstream market. On the other hand what
the housing market study has displayed this market is rather driven by the intention of the owners to accomplish
their visions as cheap as possible: it means that individual flexible solutions characterise the market and the end-
users take over several roles of a business actor in order to control the processes and keep the costs low. (Finally
the costs can be high and the solutions inefficient but it is not always foreseen in the beginning.) Al this means,
that this market segment is a business opportunity for small enterprises (mainly for small architectural companies)
that can help organising the process and elaborate the technical plans. This is not a large scale profitable
business opportunity and is already operating. If this segment will grow than this is not a matter of a business
model, rather the intention of the inhabitants if they would like to joint such a way of life or not. Under these
circumstances Proficient may intend to:
Try to find those crucial points of the CSO process which can be transferred to a more business like
approach, meaning trying to find that equilibrium where the CSO values (community values, social
values, individuality, cost sensitivity) can be saved while the process is more business compatible (the
process is faster, the technical solutions are more modularised, the technical solutions are build more on
the economy of scale, the risks are standardised). This equilibrium can be different in different micro
segments, but a general model can indicate the borders of it and all SMEs should find their place in their
dedicated circumstances.
Possible Proficient goals in connection with the retrofitting market:
The energy efficient retrofitting market in the CSO sector in South Eastern-Europe can be considered a
mainstream market as privately owned multi-family buildings are in the process of rehabilitation every day. If this
is not the case than there are main structural problems behind (pricing of energy, lack of subsidies, low financial
capacity of the residents, more urgent needs for not energy efficient interventions, technical constrains of old
buildings, etc). Under such market conditions Proficient has several market segments to focus on:
working out business models that can handle the structural deficits of the market in those countries
where energy efficient retrofitting measures hardly happen in the CSO sector rather in the publicly or
privately owned tenement sector;
concentrating on retrofitting activities that not only result in energy efficient interventions but new
community activities (facilities) which change the social life of the inhabitants;
concentrating on district level interventions with the involvement of different CSO (and sometimes not
only CSO) communities resulting in more economic and sustainable energy efficient solutions;
concentrating on models with the involvement of ESCO companies as guarantees of quality.

10
2. Introduction
The high level of per capita energy consumption of the developed world and its possible reduction has become
one of the most important topics, given the high costs of fossil fuels and the uncertainties about their availability in
the mid- or long- term future. Furthermore, the political uncertainties involved as a result of energy dependency
for most European countries also strengthens the political and economic determination of cutting back
consumption. The residential sector represents an important source of possible energy reduction, as significant
part of the energy consumption happens here.
Proficient focuses on those energy efficiency investments that happen in a particular part of the housing sector:
that of collective self-organized housing. This segment entails owners, who have the will and the power to
influence the construction and retrofitting process of their building and decide about the energy efficiency
investments carried out. The housing market study situates the CSO segment in the entire housing sector,
overviewing its differences, the pros and cons compared to conventional housing, and reviewing the possibilities it
can mean for energy efficient investments.
2.1 The energy efficiency gap theory
One way to understand the necessary reduction of consumption is through the concept of energy efficiency
gap. The gap itself is defined as the difference between the amount of energy actually consumed and the optimal
amount of energy that would be theoretically satisfactory if the highest available technology was applied, supply
was regulated in the most optimal way and consumption was optimized as well.1 (Hirst and Brown 1990, 1198)
Thus the energy efficiency gap is a theoretical concept that constantly fluctuates in volume, as a consequence of
the technological changes and the seasonally changing needs. It also changes as a result of changing attitudes
towards what acceptable/desirable energy consumption and comfort level for an average household means.
By definition the complete closing of the energy efficiency gap is impossible. However, the decrease of its volume
is not only possible but of utmost importance both on ultra-national (EU) and national level. For both entities this
decrease means less dependency on outside energy sources and a lessening environmental pressure. And for
the nation states, it also means concrete budgetary savings.
As the energy efficiency gap is a concept tangible only on a macro level, it is through the energy regime that the
energy gap gets translated to the micro level to actors like households and small businesses. The energy regime
is the constellation of nationally specific institutions and policies with regard to energy provision that determine the
circumstances for the different actors to have access to energy and also determine the price they pay for it. The
energy regime is a complex system that contains regulations regarding the use of national energy resources, the
type and number of power plants, and the different national or European subsidies all stakeholders receive. But it
1 The first ones to create the term were Eric Hirst and Marylin Brown in 1990 in their article „Closing the efficiency gap: barriers
to the efficient use of energy”. (Hirst and Brown 1990)

11
also includes under what conditions energy service companies operate in the different nation states and the
regulations determining the price paid by households. Furthermore, the concept of energy regime also entails a
wider spectrum of policies that regulate how energy suppliers and transmitters operate, determine in which
segment of energy provision can free market conditions prevail, and establish if the national resources are used
by state-owned or by private companies. In short, the specific national energy regimes determine the particular
energy consumption patterns of households, companies and institutions of the nation states, and also determine
how effectively the different energy specific EU targets – a 20% reduction in EU greenhouse gas emissions from
1990 levels; raising the share of EU energy consumption produced from renewable resources to 20%; a 20%
improvement in the EU's energy efficiency – can become a reality.
It is through the energy regime that makes the energy paradox understandable. The paradox lies in the center of
the debate with regard to the energy efficiency gap.2 It means that in spite of potential savings, cost-effective
energy-efficiency technologies spread very gradually. (Shama 1983; Jaffe and Stavins 1994) Market failures like
misplaced incentives, distortionary fiscal and regulatory policies, unpriced costs and unpriced benefits and finally
unsufficient and inaccurate information all contribute to consumers choosing the inappropriate energy-efficiency
solutions, thus maintain the energy efficiency gap. Furthermore market barriers, that are defined as obstacles that
are not based on market failures, but are nevertheless in a way of spreading energy efficient technologies, like the
low priority of energy issues, capital market barriers and incomplete markets for energy efficiency are also
important contributing factors in maintaining a higher than necessary energy consumption.3
In order to reduce energy consumption state policies can interfere to compensate these market failures and
market barriers. The type of role a nation state plays in the energy provision and the compensation of these
failures is part and parcel of the entire energy regime question.
It is primarily through the pricing and the subsidy system that energy regimes strongly influence the different
actors’ preference, among them households’, for certain energy sources, be it the conventional fossil fuels or the
renewable energies and also their behavior with regard to saving energy. Households – whose housing and
energy consumption preferences - constitute the primary focus of this study- have an immense influence in the
entire energy problem and their behavior strongly impacts the possibility of reducing consumption in a
fundamental way. In the European Union in 2009 households were responsible for 29% of the final energy
consumption, and this number still excludes their transport consumption. In their case, if supported by appropriate
legislation and subsidies, the minimization of the energy gap has consequences regarding the household budget -
leaving households with more money to spend - and regarding the living conditions and comfort level in the widest
possible sense, as energy efficient improvements often entail the improvement of living conditions.
Given this background prompting households to save energy is an essential part of the national and European
efforts to close the energy efficiency gap. Thus, the reaching of public good – a substantial closing of the energy
2 The energy efficiency gap or often simply efficiency gap defines the problem of overconsumption of energy from the point of
view of investing into energy efficiency. It „refers to the difference between the actual level of investment in energy efficiency and the higher level that would be cost beneficial from the consumer’s point of view.” (Brown 2001, 1198) 3 About the detailed analysis see Brown 2001.

12
gap – is indivisibly tied to energy conscious household behavior.4 But what motivates/makes households invest
into energy efficiency? The study regards households as rational actors, who make decisions according to their
best actual/perceived interests. As a consequence the study assumes that households have to see their own gain
– any kind of “private good” – in order to change their energy consumption patterns and invest into energy
efficiency. What private good means however, is rather individual/household specific.
It is likely to be the combination of economic gains (e.g. the decrease of energy costs and/or the increase of
housing value), the improvement of comfort level of the home and the fulfillment of specific values, like that of
being eco-conscious, play an important part in the set of personal considerations. Housing presents one of the
best opportunities for a household to save energy, every housing investment – be it either new construction or
retrofitting – can be regarded an excellent opportunity to modify the energy consumption pattern of a household.
Households spend a substantial amount of their income on paying utility and maintenance costs – this varies
according to countries between 15-40 % - so reducing it through energy efficient investments can create
considerable savings. Furthermore, many of these investments also mean a growth of the comfort level of the
home – e. g. higher inside temperatures, nicer surrounding, less noise.5
While considering their options to maximize their gain (not necessarily a financial one), the behavior of
households is influenced in a myriad of ways. Households assess a set of micro and macro level variables, that
all exert their influence on their behavior. The interplay of various institutional, individual and technological factors
determines strongly their willingness to invest into energy efficiency. As the figure below shows (Figure 1) the
particularities of the national energy regime and the national institutional context, combined with the individual
household preferences and the technological options strongly influence how important energy efficiency will be on
the agenda of households and how likely they will be to invest into it.
4 It still has to be kept in mind that energy efficient investments are tricky, in a sense that they not necessarily prompt actual
energy saving. Current surveys also show that the energy consumption of EU countries is still on the rise. This is so despite the various EU and national government efforts to reduce energy consumption by different measures, including the introduction of higher energy standards for houses, more energy efficient appliances and heating installations. See more about the data at: Household energy concept data from the European Environment Agency, available at: http://www.eea.europa.eu/data-and-maps/indicators/household-energy-consumption.The term rebound effect conceptualizes this phenomena, which is dealt with at a later stage of this study. 5 Growing energy efficiency and growing comfort level might not increase in parallel ways. Saving energy can also mean the
reduction of comfort. E.g. the passive house technology entails that inhabitants should avoid opening their windows. Such restrictions of a passive house might by definition mean a decrease in comfort level, even if they don’t necessarily lead to stuffy air inside the buildings due to proper technological solutions.

13
Figure 1: Macro and micro level factors influencing household decisions about investment into energy efficiency
ENERGY REGIME
ENERGY PRICE LEVEL ENERGY PRICE STABILITYSUBSIDY FOR ENERGY
EFFICIENCY
HOUSEHOLD DECISION ABOUT IMPROVING ENERGY
EFFICIENCY
HOUSEHOLD PREFERENCE
TECHNOLOGICAL INNOVATION
SPEED OF INNOVATON
AVAILABILITY OF NEW
TECHNOLOGY
PRICE OF TECHNOLOGY
VALUES
ECONOMIC SITUATION
HOUSING SITUATION
INSTITUTIONAL CONTEXT
LEGISLATIVE ENVIRONMENT
HOUSING MARKET BANKING SYSTEM
As it has been mentioned already, it is the national energy regime that determines the price levels paid by
households, ensures price stability – or in some cases precisely their volatility – and determines the subsidies
available for households to increase the energy efficiency of their homes and the use of renewable energies in
their homes. As the example of Germany shows, where a reliable subsidy system has been combined with the
political championing of green values, particular energy policies can push for the wide-spread use of renewable
energy by household, even under less favorable environmental conditions (e.g. comparatively few hours of
sunshine per annum). 6 Furthermore, if the national energy system provides relatively low energy prices of fossil
fuels compared to the average household income, and these prices even tend to shrink, households will be less
likely to invest into improving energy efficiency and political parties will be less likely to pick up the issue of special
subsidies for these investments.
From the national institutional context the legislative background, the banking system and the housing system
stand out as playing the most important role in influencing the decision making process of households. A deprived
housing market – be it on a national, regional or local level - where extra investments rarely bring extra value and
where housing value in general is not growing, will hardly facilitate investments into energy efficiency.
6 For a good summary of the questions faced by the German energy policy see „European utilities: how to lose half a trillion
Euros” (The Economist 2013).

14
Furthermore, investments into energy efficiency mostly require cooperation with other owners/tenants. If the
housing system does not facilitate this cooperation, e.g. the legislation gives preference to the pursuit of individual
interests, than such investments are less likely to happen. Similarly, the availability of loans and the reliability of
the banking system, just like in any area of the economy, are quintessential for making people invest. And the
entire legislative system, the reliability and accountability of contracts are important in making such long term
investments possible.
Finally technology should not be dismissed either, as technological advancement makes the investment into
energy efficiency easier. However, both the accessibility of the most recent technology and its price are factors
that strongly modify the possibility of application. As difficultly available or too expensive technology has little
chance of becoming wide-spread, thus will likely make very little contribution to energy saving on a national level,
however advanced it is.
When household preferences are analyzed, they always have to be understood in this macro context determined
by the energy regime, national institutional setting and the technological level. These preferences however can
strongly alter the decision about an investment into improving energy efficiency. In this vein the housing study
argues that both the actual economic and housing situation of a household and their assessment by the
household play a decisive role in reaching the decision about investment. On the one hand households, who
consider their neighborhood bad or running down or want to move on quickly for some other reason are less likely
to invest into energy efficiency. Furthermore, households in a perilous economic state will most probably have a
hard time coming up with appropriate resources and will be less willing to invest, despite the fact that they would
need to lower their energy costs. But such investments are not only costly, but are likely to return only on the long
run. On the other hand households in a relatively stable economic situation, and/or who are likely to remain in
their housing unit, are more likely to realize energy efficiency retrofitting projects in their homes- if supported by
the above listed macro conditions like a stable banking system, a good loan, and available subsidy. Such factors
as regarding their energy bills disproportionately high or hoping to increase the value and comfort level of their
home make investment decisions more likely. But, the desire to save money and curb energy consumption is by
far not restricted to families, who are economically dependent on it. Rather, families with very high income and
often indulging in luxury energy consumption – e.g. they maintain a swimming pool or a sauna – are also very
keen on employing different technologies to save energy. In their case, high cost of technology and long period of
investment return is not a problem, making less commonly used solutions more wide-spread in their case. Finally,
the existence of green and eco-friendly values are also crucial factors in influencing decisions about energy
efficient retrofittings or constructions. Households are more likely to spend money on energy efficiency if this also
means that such behavior is in compliance with their core values.
2.2 The structure of the housing market study
All the questions of the energy efficient retrofitting and housing construction become particularly interesting when
examined in the context of Collective Self-Organized Housing (hereafter CSO) that represent a small, but growing
segment of the European housing construction. It can be said that CSOs formulate one pillar of the Proficient
concept that tries to connect energy efficiency and housing, given the experience that newly constructed CSOs

15
often provide a number of energy efficient solutions to their inhabitants. The other two pillars are district level
interventions and the involvement of energy service companies (hereafter ESCOs) in the retrofitting process.
District level interventions mean an economy of scale, making more advanced investments into energy efficiency
available for smaller income households as well, and at the same time strengthening community building and
CSO development. ESCOs mean expert guidance for the households and also risk sharing.
The combination of these pillars together delineate specified segments of the European housing market. The size
and the geographical position of these segments is very different in each country of the EU, depending on the
nation specific housing market systems, the system of subsidies to invest into energy efficiency and the local
energy regime. Furthermore, more elusive concepts such as traditions - e.g. the spread of cohousing - and values
– e.g. how green is the public opinion – also influence strongly where these possible segments can be found, or in
which direction and to what extent they can be expanded in the near future.
This study focuses on finding and describing these potential market segments in the European housing market,
where energy efficient investments can be carried out utilizing the three pillar concepts of Proficient. It takes the
housing market and economic crisis of 2008 as its point of departure. These crises have profoundly changed the
way the European population – and often the politicians as well – think about the housing market and the role of
the state and the community in it. They have opened the way for new approaches for the incorporation of more
principles aimed at achieving sustainability of the development and offering a chance to promote a new type of
building culture.
As a result of the intertwined crises today, no doubt, there is a changing landscape of the European housing
market. It is in the backdrop of these changes that the study analyses the aspects considered by households
when contemplating investments into energy efficiency.
1. First, it focuses on the issues of energy market analyzing the energy price setting mechanisms
and the energy consumption of residential buildings being the main factors of households’
decision in connection with energy efficient interventions.
2. Second it gives a picture about how the housing markets are evolving in Europe, emphasizing
regionalism, national peculiarities and the importance of the sub-national level. It is from the point of
view of sub-national markets that CSOs and other, more avant-garde trends of building and
residence, like co-housing are analyzed.
3. Finally the energy market and the housing market are studied together concentrating on the
identification of the market potentials of the three main proficient terms (CSO, district level, ESCO)
in the sphere of energy efficient construction and retrofitting.

16
3. Trends in the energy market
3.1 Energy prices
The study considers energy prices as one of the most important engines behind energy efficient interventions the
level and volatility of which influences significantly the market decisions. Energy prices experienced by the final
consumers are defined by two major components: 1) the wholesale price of energy and 2) the energy regime, the
national/regional system of energy distribution and price setting.
3.1.1 Factors that influence wholesale energy prices
Some years ago it was predicted that the world was running out of fossil fuels, leading to sharply increasing
prices at first than to the shortage of fuels themselves. The situation has changed since. Currently it seems that
the increase in demand may be rather moderate (as a result of updated and less fuel consuming technologies)
while new sources of supply appeared. The price of the different fossil fuels (oil, gas and coal) is uncertain and
there are factors for increasing but also for decreasing the prices.
Factors increasing the prices of fossil fuels:
Accelerating economic development mainly in Asia that may increase demand significantly (it is
predicted, that the highest increase in demand will be experienced in China, which will be replaced by
India around 2020 and the Middle-East). (IEA 2013)
Increasing costs of deployment as fuel can only be found in the deeper layers of the Earth.
Factors decreasing the prices of fossil fuels:
New fossil fuel energy sources (mainly shale/light tight gas and oil), reserves of which can be found all
over the world. Its biggest recovery is implemented in the United States which is likely to to reach energy
independency soon as a result of that. However, it is predicted that within 10 years these resources will
not be cost effective any more and the resources from the Middle-East will be necessary again). In
Europe significant shale gas/oil reserves are found in Poland, France, Estonia. However, given the
environmental hazards associated with their recovery the European regulations are more severe, than in
the USA making the recovery economically less efficient.
Reducing demand: cars will use fewer oil that will compensate the increase in the number of vehicles in
the developing countries; most of the technologies tend to be more and more energy efficient and as a
result of that Europe is predicted to use less energy in the future than currently in spite of the ‘rebound
effect’. (The latter term means that the lower proportional costs actually encourage households to
consume more energy, despite the original incentive to save energy and costs.)
Europe is not independent from world wide processes. According to the estimates the demand in Europe (and
also in OECD countries) will substantially decrease related to oil and coal and somewhat increase related
to natural gas. (BP 2011) At the same time dependency on an outside energy source remains a serious
question in the European Union, where only 48% of the energy need was produced by the member states in

17
2009. In the same year dependency on oil imports reached 83.5% and 64.2% for gas, which rate is growing
constantly (Market Observatory for Energy 2011). All the member states of the European Union depend on
import except for Denmark. The most dependent countries are: Malta, Luxemburg, Latvia, Cyprus, Ireland,
Lithuania, Italy. The least dependent are Estonia, Romania, Czech Republic, The Netherlands, Poland and the
UK (Market Observatory for Energy 2011). The Russian Federation is the EU's most important single supplier of
energy products, accounting for over 25% of the EU consumption of oil and gas, whereas Europe is the most
important destination for Russia's energy exports. (Market Observatory for Energy 2010)
It means that the primer price of fossil fuels is mainly dependent on the world prices. From 1998 to 2010, the
annual average prices of crude oil (Brent), coal (EU steam coal imports as reported by the IEA) and gas (German
border) have increased between two to five times. (Market Observatory for Energy 2011) (However it does not
automatically mean the increase in price of electricity as even without state intervention several factors modify the
net price of fossil fuels before it reaches the consumers, like the efficiency of power generation and the vertical
integration of the value chain.
The question is whether renewable energies could represent a real alternative to fossil fuels in the future.
Currently renewable energies are often not cost efficient, with their artificially maintained feed-in tariffs. Thus, their
development is strongly dependent on political and popular support, as the case of Germany shows. Here
renewable energy sources are widely supported despite the country’s not so lucky geographical position for their
use. The country’s determination to provide the necessary energy by renewable sources instead of nuclear power
or fossil fuels is also reflected by the relative high energy prices if compared to the income of the population. The
support is essential to overcome a further difficulty presented by the renewable energies, which is the relative
volatility of energy prices as a result of sudden growths in production due to whether changes. (European
Commission 2012) Nevertheless, with improving technologies and very uncertain forecasts about the availability
of resources in mid-and long-term perspective their development might prove to be an economically sound
decision.
In spite of the growing popularity of renewable energy sources the fuel mix changes relatively slowly due to long
asset lifetimes, but gas and non-fossil fuels gain share at the expense of coal and oil. The fastest growing fuels
are the renewables which share is currently about 8,7% - EU 27 - (with the range of 36,3 % in Norway - and high
share in the Scandinavian and Baltic states - and 0% in Malta in 2010) from the final energy consumption.
(Eurostat 2013) Hopefully it can increase to 20% by 2020 (most member states has already reached their interim
targets). Far the highest share among the renewables is waste and biomass. There are always technological and
economic concerns about renewable energy’s ability to compensate the fossil fuels effectively. However, so far all
the barriers that seemed to be impossible to cross have fallen from time to time. Thus the predictions on the share
of renewables should be taken cautiously. On the other hand doubts are raised in connection with the
enforcement of the increased of the share of renewables. There may have several economic and environmental
obstacles slowing down its expansion, like the need for building new grids, costly and energy consuming
production of technological facilities, need for space, etc..
The wholesale price of energy includes both the prices of fossil fuels and renewables not mentioning the need for
replacing the outdated power plants. During the last years a clear increase in prices was experienced.

18
Furthermore, it is predicted (among others) by the International Energy Agency that price disparities in the world
will increase in the next 10 years more than they have so far, and this will hurt Europe. This price disparity may
result in serious comparative disadvantage of the energy intensive industries of Europe on the other hand it may
encourage investments to energy efficiency both in the industrial and residential sector.
3.1.2 Energy regimes
Energy regimes are the results of institutional settings that influence the production, distribution and pricing of
energy in a given country. The main public actors in these fields are the European Union, the member states and
in certain cases the regions and local authorities, while private actors like energy production and service
companies, energy distributors are also influential stakeholders.
EU level
The Energy Roadmap of the European Union for 2050 – which is still under preparation - calls the security of
supply (diversity of sources), competitive prices, energy efficiency and the reduction of greenhouse emissions the
pillars of European energy policy. It also endorses the idea of working together with the member states to change
the energy system and to provide energy solidarity. (Saryusz-Wolski 2013) The EU 2050 roadmap hopes to
reduce greenhouse emissions by 95% compared to the 1990 level. (Communication from the Commission 2011)
In order to reach that the EU has appointed intermediate goals like the EU 2020 strategy which has a combined
target on energy efficiency and environment that sets the ambitious target of reducing the greenhouse gas
emissions by 20% compared to the 1990 levels, aims at creating 20% of the energy consumed from renewables
and aims at having a 20% increase in energy efficiency – meaning decreasing the ''Union's 2020 energy
consumption of no more 1 483 Mtoe primary energy or no more than 1 086 Mtoe of final energy''. (The crucial
question is how efficient is the pressure from the side of the EU to the member states to implement the strategy in
spite of economic considerations.)
There are several directives that facilitate the reaching of the 2020 and 2050 targets. Among others in 2010 the
European Union passed the Directive on the Energy performance of Buildings (Directive 2010/31/EU) which
promotes the improvement of the energy performance of buildings, by requiring all member states to introduce a
system of building certificates, and to introduce minimum requirements for the energy performance of new
buildings and new building units. Furthermore, minimum energy requirements are also set for already existing
buildings and building units that are subjects to major renovations. The Directive also requires that by 2021 all
new buildings should be practically zero-emission ones. (Official Journal of the European Union 2010)
In 2012 the EU passed a Directive on Energy Efficiency that “establishes a common framework of measures for
the promotion of energy efficiency within the Union in order to ensure the achievement of the Union’s 2020 20 %
headline target on energy efficiency and to pave the way for further energy efficiency improvements beyond that
date” (Official Journal of the European Union 2012). In the framework of the Directive member states are obliged
to set a national energy efficiency target. This directive modified and even repealed former directives in the topic,
like Directive 2006/32/EC that gave the definition of ESCOs.

19
At the same time, in order to have lower price levels in the energy sector and to create a more unified, and a
better functioning energy generation and supply system, the European Union has been pushing to liberalize and
to open up energy markets (see among others regulation No 714/2009 of the European Parliament and the
Council decision on 13 July, 2009). The energy price liberation has only affected the wholesale electricity market
so far. In this case generation, transmission, distribution and the sale of electricity became deregulated on a
European level however the retail segment (households) is not liberalized yet.
National level
The national energy regime relates to the complex system of institutional setting that shapes the energy
production, distribution and price setting mechanisms. It may include the determination of import-export rates
(aiming at reaching energy independency), the ownership of the state in different service providers, the definition
of different public taxes and levies, the market ruler function, subsidies for different interventions or subsidies to
prices, the involvement in the price setting and control mechanisms etc. The system of energy regimes is
extraordinarily complex and the current study does not aim at discovering all of its complexity. The only aim of this
chapter is to highlight how influential the member states are on influencing the retail prices of energy in the
countries of Europe in order to show what kind of price risk the consumers and the developers of energy efficient
investments must face when designing the interventions.
The price of fossil fuels has significantly increased between 1998 and 2010, however the price of electricity and
associated delivery costs for domestic and industrial consumers did not change significantly – net of taxes
measured in 2005 Euro (The Market Observatory for Energy 2011) as national states intervened in the market.
Even if the world market conditions are the same for each country of Europe the electricity/heating prices that the
consumer experience could be highly divergent. This is partly because of the difference concerning the national
resources (availability of domestic resources) and also because of the difference in national/regional prices
setting mechanisms (e.g. taxation and other tools influencing price setting, like subsidies for renewables). The
relative share of the taxes for the group of EU 15 varies from 5% (UK) to more than 50 % (DK). It is likely that the
share of taxes is gradually increasing. If compared to the electricity price, gas price to consumers is somewhat
less heavily taxed in EU member states on average. Whereas in 2011 on average the basic energy price in
residential end-user gas prices made up 52%, in case of electricity it was ‘only’ 44%. (Vaasa ETT 2012, 13,19).
In household consumption band Db (annual consumption between 1000 kWh and 2500 kWh) households in
Bulgaria paid the lowest price (around 8.5 €cents/kWh, including taxes), while households in Denmark paid the
highest price (around 33 €cents/kWh, including taxes). In the same time period natural gas prices were the lowest
for Bulgarian and Romanian households and the highest for Danish and Swedish households (European
Commission 2012).

20
Table 1: Average price of energy sources for households (first half of 2013)
Electricity Natural gas District heating
Bulgaria 5.2-9.5 cent/kWh 6.4 cent/kWh n.d
Czech Republic 9.7 cent/kWh 8.2 cent/kWh 5.7 cent/kWh
Germany 29 cent/kWh 6.6 cent/kWh 5.4-8.7 cent/kWh
Hungary 14.4 cent/kWh 4.7 cent/kWh 7.4-8 cent/kWh
Italy 15-20 cent/kWh 8 cent/kWh n.d
Netherlands 23 cent/kWh 65 cent/m³ n.d
Spain 17 cent/kWh (2012) 5.7 cent/kWh n.d
United Kingdom 18.7 cent/kWh (2012) 5.76 cent/kWh (2012) n.d
Source: data provided by Proficient partners
Compared to their income, the Northern and Western countries of the European Union households usually pay
less than the EU average – with Island and Norway being the lowest – and Central, Southern and Eastern
households of the Union pay more than the EU average for electricity. (Eurostat 2012)
With regard to natural gas, despite some trends, no such clear geographical determination is apparent. In this
case Luxembourgian households, followed by Romanians pay the lowest amount compared to their income, and
households in Bulgaria pay the most for the consumption of natural gas. So the effect of energy price on
households’ payment capacity is strongly mitigated by the economic conditions of a country. The three countries
with the highest residential energy consumption – Luxemburg, Finland and Denmark – also have higher than
average energy prices, but higher than average GDPs as well.
In most countries there is no unanimous price of electricity or gas even in the retail market as the different
suppliers provide at different prices. However the range of prices could be regulated differently: some countries
seems to be more paternalistic where the prices are more regulated by the state (like Bulgaria, Hungary), while in
some countries the competition in the retail sector governs more the prices (like in the UK or Norway).
Table 2: Main characteristics of national household energy price regulation
Country National energy price regulation
Bulgaria
There are three electricity providers in the country. They are delivering the electricity district
based and the citizens cannot choose between the suppliers. They basically have monopoly
that’s why the prices are regulated by a government agency. There is only one gas provider
and the prices are also regulated by the same government agency.
Czech Republic National Energy Regulatory Office partially regulates prices (e.g. there are regulated and non
regulated cost elements in the electricity price structure).
Germany
In Germany prices are not regulated by the government. There are local utility providers that
had a monopoly in the past, but currently there is a strong competition. Still, the prices still
reflect the rather oligopolistic structure of the market.

21
Hungary
Previously energy price was proposed by the suppliers (that have an exclusive supplier right
for the different regions in case of electricity) and the National Energy Office had the
authority to validate it. Currently, price components are controlled more strictly by the
government that forces the suppliers to reduce prices.
Italy The price of electricity is the same in the whole peninsula (and appr. 15% higher in Sardinia
and Sicilia) and is set by the government.
Netherlands
Energy prices are to a certain extent depending on the costs of producing the electricity or
gas, and are based on pure market mechanisms. The rest of the price is determined by
taxes and connectivity rights, which depend on the governmental policies in place.
Norway The prices are set according to market mechanisms based on the competition of suppliers.
Spain
Prices were set by energy auctions, however due to the incorrect behaviour of some actors
the system was terminated and from April 2014 the system of average wholesale prices will
be used.
United Kingdom
There are 6 major energy suppliers that define prices based on market competition, which is
stated to become too oligopolistic. Government institutions have no direct role in price
setting.
Source: information provided by Proficient partners
It seems from the table above that the national energy markets are either dominated by market competition
(naturally taking into account the public obligations like taxes) or strictly pubic regulated. Even in countries where
market competition is the strongest element of prices settings it is a major complain that prices are too high and
cannot be explained by purely market reasons. It is not only the price level, rather the price volatility which is the
major concern when implementing an energy efficient intervention. Experience shows that price volatility caused
by market mechanisms can be high and is hard to predict for decades, the risks of political involvement in price
setting, which is undeniably present in case of government controlled price setting mechanisms, are even bigger.

22
Box 1. Elements of energy price regulation in Hungary
The price of the wholesale energy is liberalized in Hungary as well – as all over the EU – however the price of the retail energy
(electricity, gas) is heavily controlled. This price used to be regulated by the National Energy Office, which negotiated with all
energy providers individually based on a legally binding price setting formula, while the price of district heating was decided on
local level. The energy price also contained heavy subsidies making the retail prices lower than the input costs. The current
government (from May 2010) started to centralize the price setting system even in case of district heating. In addition in 2013
the government forced the retail energy providers (electricity, gas, water, sewer and waste) to reduce their consumer price by
10% in January 2013 and by an additional 10% in November 2013 (the third wave of price reduction is announced to happen
after April 2014). These measures already resulted in significant losses for the energy supply companies. Losses were
refinanced by the state budget in case of the local government owned district heating companies but were not compensated in
case of the private energy suppliers.
The left wing opposition of the UK government announces very similar arguments saying that the 6 energy providers keep
extraordinary high prices and the state should step in the price setting mechanism forcing them to reduce their prices.
Source: Hungarian and UK daily newspapers
Not only taxation, direct price setting mechanisms, operation of state owned energy companies, quota setting and
subsidies for electricity and gas may determine the domestic prices, but the feed-in price for the inclusion of the
renewables into the grid may influence heavily the financial effectiveness of energy efficient investments. The
feed-in prices are in general higher than the average electricity prices in order to encourage the production of
renewables. However the feed-in tariffs increase the average energy price and may change quite frequently
making the return on investments uncertain.
Box 2: Price setting of renewables in Spain
Feed-in legislation was introduced in Spain in 2007-2008 regarding photovoltaic installation and other renewable energy
sources. This accelerated the installment of new facilities all around the country. Instead of the previously expected 400
megawatt of solar to be installed more than 2600 megawatt was implemented. On January 2012 the Spanish government
terminated operating the system concerning the new items being created after January 2013. The already developed capacity
was not affected. This decision lead to a prompt termination of such devices and brought constant uncertainty about the future
plans in investments.
Source: Wikipedia and interviews
3.2 Energy consumption of the housing stock
The overall trend was growing consumption concerning energy for decades as European households bought
more electric household appliances, changed them more frequently, travelled more and built bigger homes.
(European Environment Agency 2012) On the other hand households in general seemed to have reacted quite

23
rapidly in the face of economic crisis decreasing their consumption rather rapidly. Residential energy consumption
in the European Union reached its peak in 2005 and 2006, and was decreasing until 2010. (EurActiv.com 2012;
Bertoldi et al. 2012) Whereas the energy consumption of residential buildings (that take up about 20% of the total
energy consumption of the European Union) seems to reduce year by year.
Figure 2: Energy use for space heating per m² dwelling
Source: Energy Efficiency Trends in Buildings in the EU (2012). http://www.odyssee-indicators.org/publications/PDF/Buildings-brochure-2012.pdf, p. 27
The differences between the average energy consumption for heating/cooling could be explained both by climatic
factors (e.g. in 15% of the Spanish apartments there is not heating appliance installed) and the state of the
residential stock and also the habit of tolerating modest temperature. (E.g. the technical conditions of UK
buildings are quite poor in general but the energy used for heating is quite low. This is basically about the
tolerance of colder temperature in the dwellings.) There are some countries where the energy used for heating is
quite moderate in spite of the unfavorable weather conditions. Countries like Sweden, Denmark and Norway are
ahead in energy efficient construction thus their residential stock is in a rather good shape. At the same time the
Baltic countries suffer the most from the weather conditions which is not counteracted by the proper insulation of
residential buildings.
The energy consumption for heating is steadily decreasing. This is party due to new construction (which is carried
out according to stricter standards; 50% of the decrease could be explained by new construction in Germany and
Slovakia while it is below 10% in most of the new member states), and partly due to the energy efficient
investments (insulation, upgraded heating appliances).
The energy consumption of the residential buildings is very different, but as a “rule of thumb” we can say that the
older the building is the more energy it consumes. (There are some exceptions though, as in some periods in
some countries the construction standard was worse in the 1960s than in the 1950s.) Nearly in all countries it can
be observed, that up to a certain date residential buildings consumed a significant amount of energy for heating
(around 200-250 kWh/m²), than a sharp decrease happened around 19060s (Germany) and 1970s (Portugal) to

24
120-150 kWh/m². In some countries, like Bulgaria, the decrease came only in the 1990s. Furthermore, the newest
buildings do not consume more than 50-100 KWh/m² (or max 10-15 kWh/m² in case of passive housing).

25
4. The changing European housing market
The European housing stock is evolving. The combined useful floor space – that includes both the residential and
non-residential areas is estimated to be approximately 25 billion m2, 75% of which is residential floor space. This
residential stock is mostly made up by single family houses that occupy 64% of it in m2, whereas 36% is found in
apartment blocks. This residential space is growing at an approximately 1% rate annually. (BPIE 2011, 8-9) This
growth is the result of a combination of new construction, demolishing and renovation/ transformation of the
existing stock.
Construction in the residential sector makes up approximately 42% of the entire construction industry in Europe.
This proportion can be considered high in a global perspective, as it is second only to South America. Until 2006,
during the period of its unprecedented growth, residential construction was one of the most important forces
behind the national and European GDP growth. The outbreak of the real estate crisis changed it, as it meant that
the construction of new residential buildings decreased by 40%. In 2010 the construction of new residential stock
made up about 16,5% of the total construction industry, and was significantly less than the proportion made up by
renovations and transformation of the residential stock, which in 2010 was the largest component (26,6%) of the
total construction output in Europe. However, as with new construction, the average numbers about Europe hide
big regional differences for the importance of refurbishments and transformations on the European housing
markets. (CECODHAS Housing Europe)
The current chapter focuses on outlining these regional differences: how and where the differences lie in
production, housing structure and prevailing housing conditions under the umbrella of the unified European
market in a post-crisis situation. It shows that larger geographical regions influenced by path dependence – e.g.
the socialist heritage – can face very similar challenges and behave in similar ways. But it also shows the
importance of national regulations just as well the crucial role smaller geographical units play within a nation when
influencing how housing markets function. It hopes to give a picture of the areas that are booming and those that
are lagging behind, with the aim of trying to find the current place and possible expansion place of CSOs in the
European housing market.
4.1 Living conditions and housing production in Europe7
There were approximately 212 million households in the EU in 2012, and size of these households was 2.4
persons on average. One and two-person households made up a little bit more than 60% of all households, with 3
and 4 person households making up another 32% (Eurostat). The average household size is generally bigger in
the former Soviet Block countries than in the EU-15 states, with extended families living in one household being
more common than in the EU-15 countries. Furthermore, Nordic and North-Western households are smaller than
Mediterranean ones, where extended families are the most common among the New Member states. (Iacovou
and Skew 2011)
7 In the following segment most data refer to EU27, only due to the fact that the Croatian accession happened recently and the
available studies do not yet include the relevant data about them.

26
Persistent regional patterns are strongly altered by country specific variables, like reproduction rates, migration, traditions and even such traditions and even such things as the difficulty of establishing a new household, as demonstrated by the table below. (See
below. (See
Table 3). It lists a select number of EU countries that includes all geographical regions, and both old and new
member states. East and Central European countries, that on average have the largest household size, show a
rather different picture on a closer look. While household size in Poland almost reaches 2,9 persons, which is way
above the EU average, both Hungary (2,42 person/households) and the Czech Republic (2,38
persons/households) are at the EU average, way below some Mediterranean countries like Spain or Western
European countries like Ireland. In Ireland, which has the highest fertility rate in the entire EU and a strong
Catholic traditions household size (2,787 persons/households) exceeds far the household size of other Western
countries. (The Journal 2013) Its closest neighbor the UK has 2,37 persons/households and the Netherlands has
2,22 person/household.
Table 3: Population and household size of selected EU countries
Name of the
country
Number of
Inhabitants
(*1000)
Average
household size
Name of the
country
Number of
Inhabitants
(*1000)
Average
household size
Austria 8 420 2,307 Ireland 4 600 2,788
Belgium 11 900 2,604 Italy 60 600 2,405
Czech Republic 10 510 2,383 Luxembourg 512 2,535
Denmark 5 600 2,154 The Netherlands 16 700 2,227
Estonia 1 340 2,233 Poland 38 500 2,895
Finland 5 390 2,165 Spain 46 800 2,586
France 64 300 2,473 Sweden 9 218 1,980
Germany 81 800 2,025 United Kingdom 62 600 2,371
Hungary 9 930 2,422
Source: Dilek Tosun, Housing needs in Europe, CECODHAS Housing Europe, Research Briefing, May 2013.
With regard to the type of accommodation these households reside in, no regional pattern seems to emerge, only
country specific differences can be observed. In 2011 somewhat more than 40% of the EU population lived in
flats, whereas somewhat less (34.4 %) in detached houses. The remaining almost one-quarter lived in
semi-detached houses (Eurostat 2011). But the availability of floor space already shows deep regional
disparities behind the trend of the general increase of available floor space for individual households. The
analysis shows that only 14% of the available floor space is located in Central and Eastern Europe that includes
10 member states of the EU 27 and approximately 20% of the entire EU population. (The data is still before the
time of the Croatian accession.) At the same Mediterranean countries, with approximately one quarter of the EU
27
population, have around 36% of the available floor space. Northern and Western countries seem to be the closest
to their population proportion in the availability of floor space: for about 54% of the EU population they have
approximately 50% of its residential floor space. (BPIE 2011, 8-9)
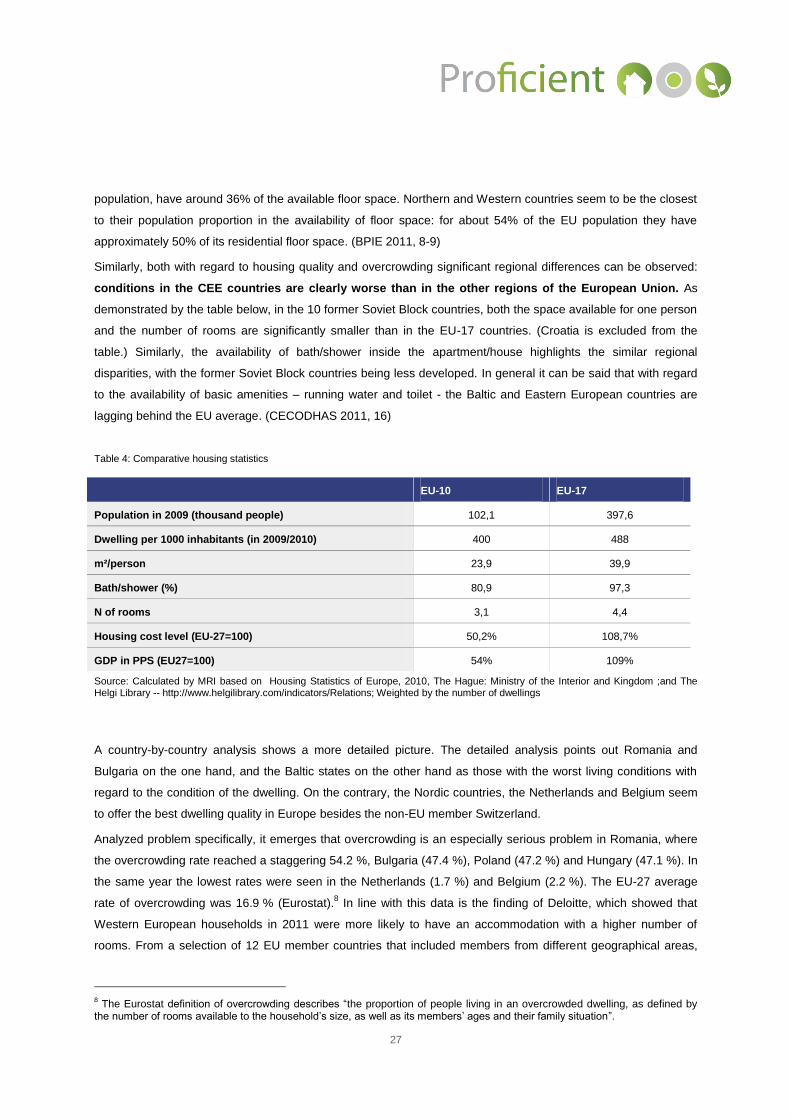
Similarly, both with regard to housing quality and overcrowding significant regional differences can be observed:
conditions in the CEE countries are clearly worse than in the other regions of the European Union. As
demonstrated by the table below, in the 10 former Soviet Block countries, both the space available for one person
and the number of rooms are significantly smaller than in the EU-17 countries. (Croatia is excluded from the
table.) Similarly, the availability of bath/shower inside the apartment/house highlights the similar regional
disparities, with the former Soviet Block countries being less developed. In general it can be said that with regard
to the availability of basic amenities – running water and toilet - the Baltic and Eastern European countries are
lagging behind the EU average. (CECODHAS 2011, 16)
Table 4: Comparative housing statistics
EU-10 EU-17
Population in 2009 (thousand people) 102,1 397,6
Dwelling per 1000 inhabitants (in 2009/2010) 400 488
m²/person 23,9 39,9
Bath/shower (%) 80,9 97,3
N of rooms 3,1 4,4
Housing cost level (EU-27=100) 50,2% 108,7%
GDP in PPS (EU27=100) 54% 109%
Source: Calculated by MRI based on Housing Statistics of Europe, 2010, The Hague: Ministry of the Interior and Kingdom ;and The Helgi Library -- http://www.helgilibrary.com/indicators/Relations; Weighted by the number of dwellings
A country-by-country analysis shows a more detailed picture. The detailed analysis points out Romania and
Bulgaria on the one hand, and the Baltic states on the other hand as those with the worst living conditions with
regard to the condition of the dwelling. On the contrary, the Nordic countries, the Netherlands and Belgium seem
to offer the best dwelling quality in Europe besides the non-EU member Switzerland.
Analyzed problem specifically, it emerges that overcrowding is an especially serious problem in Romania, where
the overcrowding rate reached a staggering 54.2 %, Bulgaria (47.4 %), Poland (47.2 %) and Hungary (47.1 %). In
the same year the lowest rates were seen in the Netherlands (1.7 %) and Belgium (2.2 %). The EU-27 average
rate of overcrowding was 16.9 % (Eurostat).8 In line with this data is the finding of Deloitte, which showed that
Western European households in 2011 were more likely to have an accommodation with a higher number of
rooms. From a selection of 12 EU member countries that included members from different geographical areas,
8 The Eurostat definition of overcrowding describes “the proportion of people living in an overcrowded dwelling, as defined by
the number of rooms available to the household’s size, as well as its members’ ages and their family situation”.

28
the study listed the UK, Spain and Germany as the countries, where households acquired apartments with the
highest number of rooms, and named Poland, Hungary and the Czech Republic with the smallest apartments with
regard to the number of rooms (Deloitte 2012). However the room size not necessarily corresponds to the
apartment size. Actually, the newly built UK homes are the smallest in Western Europe. Compared to the 76m² of
the UK homes, the Irish ones were almost 88 m² in 2005, whereas the homes in the Netherlands were 115,5 m²
and 137 m² in Denmark (RIBA 2011; MyNewPlace blog 2012). Homes in the former Soviet Block countries are
usually smaller than the Western European average.
In the entire EU 27 some 30 million people were subjected to severe housing deprivation in 2009, making up
approximately 6% of the entire population of the EU 27. Housing deprivation – defined as the combination of
living in an overcrowded dwelling and at the same time being too dark (1), or suffering from a leaking roof or
damp walls/foundations, etc. (2) or having no bath or shower. However, whereas in countries like the
Netherlands, Finland and Norway it effected less than 1% of the entire population, in former Soviet Block
countries the problem is much more prevalent. In case of Bulgaria and Latvia severe housing deprivation reached
approximately 18%, while at the same time in Romania it topped a staggering 28,6% (Rybowska and Schneider
2011).
It seems that darkness is mostly a persisting problem in Slovenia, Latvia and the UK, whereas the problem has
been solved mostly in the Czech Republic, Slovakia, Finland, Denmark and the Netherlands. The problem of
leaking roof or any problem related to damp walls, foundations, etc. seem to be the least solved ones in the EU
countries, as comparatively highest percentage of dwellings has a problem with it. The 15,9% of the EU average
is surpassed quite extensively by all the Baltic countries, Cyprus, Bulgaria, Romania and Slovenia. Mediterranean
countries also face an above average rate of dwellings facing leakages and dampness. The Nordic countries,
Switzerland and Slovakia are the countries that reported the least problems in this regard in 2009. Finally, a third
type of problem affecting the dwellings is the lack of appropriate sewage system that manifests itself in the lack of
toilets and the lack of showers/baths in a dwelling. Again it the Baltic states, Bulgaria and Romania that stand out
from the countries, as those facing the most problems. Romania’s case with an approximate 42% of the dwelling
stock having no flushing toilet and shower/bath is quite extreme, but even the Baltic states averages – ranging
between 12-18% - are rather high if compared to other EU countries.

29
Table 5: Share (%) of population facing a particular sort of housing problem, 2009
Name of
country
Leaking
roof
Bath /
Shower
Flush-
ing
toilet
Dark-
ness
Name of
country
Leak-
ing roof
Bath /
Sho-
wer
Flush-
ing
toilet
Dark-
ness
EU-27 15,9 3,1 3,5 7,3 Hungary 14,5 4,2 7,1 8,4
Belgium 15,2 0,9 0,6 9,6 Malta 10,0 0,2 0,0 6,7
Bulgaria 23,9 15,6 26,2 6,8 Netherlands 14,2 0,0 0,0 3,7
Czech
Republic 14,6 0,5 0,7 4,3 Austria 15,3 0,7 1,3 6,5
Denmark 7,8 0,7 0,0 4,5 Poland 17,6 5,6 4,8 8,3
Germany 14,0 0,3 1,2 4,8 Portugal 19,7 2,7 2,4 8,6
Estonia 20,2 12,8 12,2 4,7 Romania 22,0 41,2 42,5 8,7
Ireland 13,2 0,6 0,3 5,6 Slovenia 30,6 0,6 0,6 15,5
Greece 17,6 1,1 1,8 6,7 Slovakia 6,6 0,3 1,1 3,5
Spain 17,6 0,0 0,0 6,9 Finland 4,9 1,0 0,8 4,4
France 12,6 0,6 0,8 7,5 Sweden 6,6 0,5 0,0 6,1
Italy 20,5 0,4 0,2 7,9 United
Kingdom 14,6 0,2 0,5 10,6
Cyprus 29,4 0,7 0,7 5,7 Iceland 17,4 0,1 0,3 1,8
Latvia 25,7 18,2 16,6 10,9 Norway 8,2 0,1 0,1 4,1
Lithuania 21,3 15,9 17,2 8,8 Switzerland 8,6 0,1 0,1 5,8
Luxembourg 17,5 0,2 0,8 7,0
Source: Anna RYBKOWSKA, Micha SCHNEIDER, "Population and social conditions", Eurostat Statistics in Focus, 4/2011 Available at:.http://epp.eurostat.ec.europa.eu/cache/ITY_OFFPUB/KS-SF-11-004/EN/KS-SF-11-004-EN.PDF
The housing stock itself is relatively new, the bulk of it being built after WWII. There seems to be an urban rural
difference, with the urban housing stock being younger and the rural – mostly consisting of farmhouses – being
made up of older homes on average. The current stock is a result of increasing housing production and programs
designed to eliminate housing shortage right after the war, which peaked in the mid-1970s. In their peak period
new units could equal around 2-2,5% of the existing housing stock in some countries. The production of new
housing as a percentage of the entire housing stock started to decline after that, although in some countries, like
Portugal and Slovenia the period of growth persisted longer. In Portugal 20% of the current housing stock was
built in the 1990s. (Andeweg and Brunoro 2007, 3)
Housing production has been decreasing massively since the outbreak of the financial and real estate crisis, as
shown, among other things by the massive decrease of issued building permits. A look at the number of issued
building permits is also helpful in forecasting how the construction industry is going to perform in the next few
years. An analysis of how it changed over the years points the picture of an EU deeply in trouble, with still little
sign of an overall recovery. Between 2007 and 2011 it was only in Switzerland, where the number of issued

30
housing permits increased by 36%. In the hardest hit countries, like most Southern European countries, Ireland
and Hungary the decrease in the number of issued permits ranged between 60 and almost 90%, with Spain being
the most affected at an 89% decrease. (RICS 2012, 12) In Italy, building permits decreased by 70% between
2005 and 2012, their number is projected to shrink further.9 In the Netherlands, which is suffering from a slowly
deflating housing bubble, the number of building permits has been decreasing since 2006. In 2012 there were
approximately 37 thousand permits issued, which was 33% down from the previous years (Statistics Netherlands
2013). In contrast, the least effected countries – e.g. Germany, France and Sweden – the decrease in the number
of residential building permits was less than 20% between 2007 and 2011 (RICS 2012, 12).
In line with this trend the housing development intensity for residential buildings decreased substantially over the
years. The country to experience the sharpest decrease was Spain, where between 2008 and 2011 the number of
completed apartments dropped from 10,1 to 6,5 per a 1000 inhabitants. The other two countries experiencing a
sharp decrease were Denmark and Hungary: In the former the number of completed apartments went down from
5,2 to 2,8, whereas in the latter the decrease meant that the number of completed apartments went down to from
5,8 in 2008 to 3,1 in 2011. Despite the changes the Spanish housing production is still significantly higher than the
European average, which is partly due to administrative support from the government and partly to the demand
for holiday homes (Deloitte 2012, 5). In the same period the highest growth of housing intensity was experienced
by Italy and Belgium, in both countries increasing the production to 4,2 completed apartments per 1000
inhabitants.
In the entire EU Spain and France (5,7 completed apartments per 1000 inhabitants) showed signs of the highest
building intensity in 2011, despite the fact that all countries have encountered a financial and a real estate crisis.
The same index was around the EU average (3,9 apartments for 1000 inhabitants) for countries like Poland,
Belgium or Italy. And the lowest rates were recorded in Denmark and Germany (Deloitte 2012, 5). Although some
countries have experienced already a period of recovery, for the entire EU, there was still some decrease
between 2011 and 2012. Whereas in 2011 there were 3,9 completed apartments per 1000 inhabitants, this
number went down to 3,3 in 2012 (Deloitte 2013).
9 From the Italian Proficient Housing Market Questionnaire report, source: ANCE (National Association of Building
Constructors). Housing Market Questionnaires were prepared by every participating Proficient country and they contained information about their respective housing and energy markets.

31
After a long period of stalling as a result of the real estate crisis, housing production is expected to pick up
pace in the next years, although current predictions suggests that by 2017 production will not reach the
pre-crisis, 2007 levels. Current analysis suggests that the persisting high level of immigration combined with the
tendency of the growing number of households – that shrink in size at the same time – will maintain a high level
demand for housing. With regard to the first one it can be said that among countries of the European Union it has
been Luxemburg, Spain, Italy, the UK and Portugal that have been registering the highest immigration numbers
per 1000 inhabitants.10
With regard to the second point it should be emphasized that as a result of the growing
number of households even in countries, where there is no overall housing shortage, sectorial demand will
remain. Often there is the lack of good quality and affordable homes. (Tosun 2013)
Housing production will be very small in Europe, if put into a global perspective, since roughly 80% is expected to
take place in regions of dynamic population growth and developing economies, more precisely in
Asia/Pacific and Africa/ Mideast regions. China is projected to remain the world’s largest housing market with the
world’s largest housing stock by 2017. In the same time period, housing production in Western Europe and North
America is projected to produce the fastest growth in the production of new units. In Europe Spain and Italy are
thought to produce double-digit increases annually, if compared to the levels of 2012. (PR Newswire 2013)
4.2 The structure of the European housing market
As it can be inferred from the sections above, it is very hard to talk about a single European housing market.
Rather, the big legislative differences, the regional and national peculiarities, the effects of path dependency and
the differences in housing policies, the share of owner occupied and the tenant sector, and the housing finance
systems create very strong national peculiarities. (Patrizia Immobilien AG 2012 and 2013) Furthermore, looking
into the national scene in detail, a European housing market of regions is discovered, with big regional disparities
underlying these national numbers. Housing markets reflect very closely the economic performance of the
region/city they are found in. These regions and cities function differently in the post-crisis era, some profiting
from the effects of globalization, some suffering from it and their housing markets behave accordingly.11
(Typically, housing markets in metropolises, capital cities and cities of great touristic, financial or economic
importance have suffered significantly less and recuperated faster than the general economic and real estate
conditions of their own countries would indicate. And even within these settlements there is a great deal of
variability, as separate neighborhoods can have very differently performing housing markets, even in close
proximity.
However, the crisis also demonstrates that despite the big differences, all countries are affected by common
policy trends, economic influences and financial regulations. One such trend has been the growing emphasis on
owner occupation in all countries. As a result, currently the European housing market is primarily an owner-
occupied one, with almost 71% of the European population living in owner occupied households in 2011
Eurostat). The prevalence of owner occupation is the result of years of political support and the realization of
10
On the other hand Baltic countries and Bulgaria registered negative migration in 2012. For a detailed chart see: http://www.indexmundi.com/Map/?v=27&r=eu&l=en and http://www.indexmundi.com/g/r.aspx?v=27. 11
On the issue of regional development of Europe in a globalized world see Capello et al. 2011).

32
broader economic goals through subsidizing home ownership. Housing finance markets were liberalized
drastically over recent decades as part of this process. The growth of home ownership was realized through
income and interest rates, housing policies and housing finance markets shaping both the size of the housing
supply and the housing demand and the price of residential housing. (OECD 2011) It meant decades of housing
policies focusing on empowering the possibly widest spectrum of households to buy their homes. It meant that
borrowing opportunities were expanded and borrowing costs were lowered and down payment requirements were
reduced. Households started to rely on loans and mortgages to finance housing. (OECD 2011, 6-7) These
policies changed the housing market structure – e. g. the owner/ tenant ratio, the entrance route to the market for
those leaving the parental home and the possible use of housing as a source of equity in the latter part of life – in
a considerable part of the countries of the European Union.
The effects of these policies are felt all over the countries of the European Union, and strongly influence the ways
the European housing market will develop in the future. House prices went up considerably: It is estimated to
have increased real house prices by as much as 30% in the average OECD country over 1980 to 2005. As a
consequence – as argued by Angelini, Laferrère and Weber (2010) – housing presents without doubt the largest
share of household wealth for older households, and many regard housing as a source of security in old age.12
As
the authors argue, a generally growing living standard and better access to credit strongly contributed to the fact
that, consecutive age cohorts became home-owners at a younger than their predecessors. (Although they also
state that the mean age of home-ownership age has remained varied across the continent.) This development
also meant that family help and inheritance became less important in general – although have remained
sufficiently important in the Central and Eastern part of Europe (Angelini et al. 2013).
The exact measures of the housing policy pushing owner-occupation were wide ranging, mostly focusing on tax
incentives and subsidized loans over a long period of time. They also included the policies of housing privatization
most prominently present in the UK and the Eastern European countries. As a result of these policies, housing
construction by the early 2000s became dominated by private sector investments with the parallel decline of
social housing construction. At the same time, in the EU 15 countries there was a lot of attention paid to improve
the private rental stock, seen as an important source of accommodation. During these times the housing output
was the highest in the urban areas, although, the construction of second homes in the Mediterranean countries
was also significant (Norris and Shiels 2004).
Besides changing the housing market and the financial markets, and providing an artificially stimulated, but
constant boost for the economy, the growth of owner occupation also influenced labor force mobility. The
prevalence of owner occupation makes labor market movement more difficult. As argued by an OECD study, the
transaction costs involved with moving is significantly higher in case of owner-occupation than in case of renters.
Outright owners are estimated 13% less likely to move than renters, and owners with a mortgage are 9% less
likely to move than renters. The difference between the two numbers is accounted for by the stronger incentives
in case of owners with a mortgage to find a job soon (OECD 2011, 9-10).
12 About housing wealth as a source of income in old-age see the results of the EU funded DEMHOW (Demographic Change
and Housing Wealth) project. See http://www.birmingham.ac.uk/research/activity/social-policy/chasm/projects/demhow.aspx

33
The push for growing owner occupation only came to a halt following the economic and housing market bust
2007/2008, which was instrumental in changing how policy makers were thinking about the role of rental and
owner occupied homes, However, there had been signs of slowing down earlier as well (CECODHAS 2011). In
Britain for example, home ownership rates started to drop in the 2000s following a century of constant growth
(Marsden 2013), and the process of privatization was slowing down in almost all OECD countries at the same
time (Andrews et al. 2011, 17). But as the table below shows (See Table 1) on a select number of EU member
states and Norway, this still meant that the share of owner occupied housing was on the rise. Between 2005 and
2011 – the choice of period in question covers both the peak period of the housing production, the ensuing bust
and the beginning of slow recovery – there was a slight rise from 68 to a little bit less than 71% in the share of
owner occupied households.
Table 6: The changing share of owner-occupied housing in Europe on the example of select countries, 2005-2011
Countries 2005 2011
European Union (27 countries) 68.0 e 70.7
Bulgaria 85.4 87.2
Czech Republic 73.5 80.1
Germany 53.3 53.4
Netherlands 63.9 67.1
Spain 89 * 82.7
France 61.8 63.1
Italy 72.8 72.9
United Kingdom 70.0 67.9
Norway 82.7 84.0
Hungary 88.1 89.8
eestimated, * 2003, Source: Eurostat, 2011.http://appsso.eurostat.ec.europa.eu/nui/submitViewTableAction.do
This average slow grows hides big differences. A closer analysis shows that besides the UK, which was already
mentioned above, Spain stands out as the only country having experienced an actual reversion of the trend that
sees the growth of the owner-occupied sector. The approximate 6% drop in the owner occupation rate in Spain is
connected to the effects of the crisis, which left the country’s housing market paralyzed.
In the same timeframe of 6 years there were also countries that managed to stabilize their share of owner
occupation – like Germany or Italy – or limiting its growth to one or two percent like Hungary or France. The
Czech case stands out with experiencing an above average growth of home ownership rates. This is in relation to
a differently paced, longer privatization process the country went through compared to the other former Soviet
Block countries.
The data above also demonstrates that there are deep regional differences in Europe with regard to the
importance of owner occupation in Europe. As Table 6 shows above, owner occupation was especially high in

34
2011 among the former countries of the Soviet Block. In 2011 in the 12 new member states of the EU there was a
86,7% owner occupation rate against the 66,7% of the EU15. This difference is mostly due to the housing
privatization policies of the 1990s in the CEE countries that created a tangible difference between the old and new
EU member states with regard to the share of owner-occupied and rental housing emerged. In 2011 owner
occupation was the lowest in Germany with 53%, where renting is viewed as a viable option for a wide social
stratum and it is not regarded as a sign of social deprivation. It was the highest in Romania, there reaching almost
97% in 2011, but other former Soviet bloc countries, including Estonia, Hungary and Slovakia were also barely
under or slightly above 90%. Private rental is also very marginal in most CEE countries. The rental sector is also
significantly smaller in the Southern European countries of Spain, Italy, Portugal and Greece than in many other
Western and Northern members of the European Union (Eurostat). In the mid-2000s Greece, Italy and Spain
home ownership accounted for over 70 per cent of dwellings (Norris and Winston 2012, 19).
The table also shows that there is no homogeneity among the home owners either, in a sense that the
predominance of outright owners versus the predominance of owners with outstanding loans/mortgages
sheds light to the fact that in different countries families have to follow different strategies to acquire a
home. In 2011 approximately one-fourth (exactly 27,6%) of the population of the EU-27 lived in owner occupied
homes free of any mortgage or loan, while 43,1% lived in an owner-occupied home with an outstanding mortgage
or loan (Eurostat).13
There are big regional differences with regard to the distribution of outright owners. Whereas
in the CEE countries – as a consequence of a give-away type privatization and the comparatively recent spread
of housing mortgage schemes – the share of home owners with a mortgage, despite the particularly high home
ownership rates, is rather low in the entire population (app. 5-15%). Romania represents the most extreme case,
with 96% of the population living in owner occupied households without an outstanding mortgage, and only 0,6%
of the population living in a households with a mortgage. On the other end of the spectrum in the Nordic countries
and the Netherlands more than half of the population is a home owner with a mortgage (50-70%), meaning that
even many elderly couples are indebted. Other EU countries are dispersed between these two extremes, with the
Southern European countries more likely to have higher outright ownership rates (Eurostat 2010).
Table 7: EU population by tenure status (% of population) in 2011
Tenant - market
price
Tenant - reduced
price or free
Owner occupied,
with mortgage or
loan
Owner occupied, no
outstanding mortgage
or housing loan
EU-27 (1) 18.1 11.2 27.6 43.1
Romania 1.0 2.4 0.6 96.0
Bulgaria 1.7 11.1 1.5 85.7
Lithuania 1.3 6.5 6.7 85.6
Slovakia 8.0 1.7 8.2 82.0
13
Eurostat, Housing Conditions, 2011.http://epp.eurostat.ec.europa.eu/statistics_explained/index.php/Housing_conditions

35
Latvia 7.9 9.6 8.3 74.2
Poland 3.5 14.5 8.4 73.7
Slovenia 5.5 17.0 7.7 69.8
Estonia 2.5 14.0 16.7 66.9
Hungary 2.9 7.314
23.1 66.7
Malta 1.8 17.4 17.7 63.1
Czech Republic 13.0 6.9 18.1 61.9
Greece 17.2 6.9 15.7 60.1
Cyprus 10.2 15.9 15.3 58.5
Italy 13.3 13.8 15.6 57.3
Spain 9.0 8.2 32.9 49.8
Portugal 12.2 12.8 34.0 41.0
France 19.1 17.8 29.4 33.7
Finland 10.2 15.7 41.9 32.2
Austria 26.2 16.3 25.7 31.8
Belgium 18.9 9.3 41.9 29.9
Luxembourg 27.0 4.8 40.0 28.2
United Kingdom 13.3 18.8 41.9 26.0
Germany 39.9 6.7 28.1 25.3
Denmark 32.8 0.1 52.7 14.4
Netherlands 32.4 0.5 59.6 7.6
Sweden 30.0 0.3 65.9 3.7
Croatia 1.6 6.4 2.6 89.5
Norway 10.5 5.5 63.0 21.0
Iceland 11.0 11.1 62.7 15.1
Switzerland 51.4 4.7 39.4 4.4
Source: Eurostat
The data on ownership structure also suggests a less wide spread and less developed mortgage system both in
Southern and Eastern Europe, further underlining the above mentioned fact that it is more difficult to enter the
housing market and become an owner in these regions and the fact that family help plays a more crucial part in
14
The Census of 2011 found 2,7% municipal tenants and higher share of private rentals and owner occupied dwellings.

36
facilitating entrance to and climbing up in the housing market here. (Mulder and Billari 2006; Kohli and Albertini
2007)
Ownership also means very different legislative and institutional backgrounds, entailing different rights and
influence of owners with regard to retrofitting their property if it is not a single family home. But it is not only
between owners that big differences exist. There are considerably different models for tenants in the different
countries, bestowing them with different rights regarding both private and municipal/state rentals.
Furthermore, the type of housing legislations just as the institutions handling the problems and questions of
housing differ from country to country. Also, there is a vast difference if we look at attitudes about the importance
and significance of home-ownership. Here we find that in countries with above average home-ownership rates it is
regarded a failure if someone is stuck as a tenant, and households are ready to take on extraordinary financial
risks to acquire a home. The negative consequences of this can be observed by the debt crisis many Hungarian
families became part of as a result of their extensive housing mortgages. In these countries – partly as a result of
the limited renting opportunities - a home is also looked upon as the most important asset that can be passed on
within the family. (Hegedüs and Szemző 2010) However, in countries with a more extensive and developed
housing rental system – be it social or private rental – the lack of acquiring a home is not regarded as being
“failed” in a very crucial dimension of life. Even people with a middle-class existence are part of the rental system.
As the data above shows there is a significant difference in how the rental markets are structured, if we look at the
share of private rentals, where tenants pay the market price and the share of social rentals, where tenants pay a
reduced or no price at all. The same geographical divisions that apply to the ownership data apply to tenant
structures as well. In the former Soviet Block countries – with the exception of the Czech Republic - private
rentals typically make up a smaller segment of the already small rental segment. Furthermore, in these systems
tenants often enjoy very limited rights which first and foremost makes the system little reliable, allowing among
others very fast evictions and easy leaving of a rented home. However, this phenomenon is not only the problem
of the housing legislation. Many of these private rentals are found in the grey zone of the economy – evading
registration for cheaper rents and no taxation - but consequently depriving both tenant and landlord from being
able to exercise their rights properly. In these countries social/ municipal rentals are secure. In these countries
tenants can enjoy a high level of security if they are in a municipally owned social rental. However, given the very
small capacity of the entire rental sector and the very low rate of turnover in the municipal sector, it is
exceptionally hard to enter the municipal system, even for families in a very hard financial condition.
A very different picture emerges if we look at the countries with a significant rental sector. In these countries
private rentals usually make up a larger share of the rental sector. The data from 2011 shows that in Sweden,
Denmark, Germany, the Netherlands, Luxemburg and Austria over one-quarter of the population resides in
private rentals. Somewhat smaller is the share of private rentals in Belgium and France, but even here they
accommodate close to 20% of the population. The UK seems to provide an exception among these countries,
with a relatively high rental sector – over 30% - but with only a smaller share of the tenants paying market price
for their rentals (See Table 7). These high percentages shed light to a very differently functioning private rental
sector then in most former Soviet Block countries. Although the systems can be vastly different from country to

37
country, it can generally be said that private rentals in these systems usually operate as part of the legal economy
and tenants have ample rights, protecting them from the landlords.
Mediterranean countries seem to constitute a category of their own, with smaller rental sectors and an
approximately similarly sized sector of the private rentals and municipal/subsidized rentals. Greece is an
exception, with a more important private rental sector. In Italy home ownership rates have grown considerable
especially in the South and small towns as a result of tax breaks for ownership, easier mortgage borrowing and
generally growing living standard and as a consequence new housing supply has been almost exclusively
destined for homeownership. Italy’s example also show, how particular regulations – in their case the continued
strict rent control and other restriction – resulted that private rental is unattractive in Italy. In pre-crisis times, while
housing price rose by 6,3% between 2000 and 2008, the rents rose by an average of 2,5% in the same time
period (NuWire Investor 2009).
4.3 The effect of the financial-economic crisis
The housing and real estate crisis of 2008 put an end to the period of continued political push for home
ownership, and put a rather drastic halt to approximately two decades of uninterrupted growth in house prices all
over Europe. Research found that household housing wealth – which covers the value of all residential dwellings
and that of the land beneath the homes owned by the households - not only grew rapidly in the years preceding
the crisis, but its share among the household assets has increased. Between 1999 and 2006 the housing wealth
in the euro area has increased from 13,211 EUR billion to 24,232 billion EUR. The average nominal growth rate
reached approximately 9% annually. In the same time period the share of housing wealth in households’ net
worth increased substantially as well: from approximately 59% in 1999 to 68% in 2006 and 2007 (Eiglsperger and
Haine 2009).
The crisis changed substantially the European housing markets, influencing on a national scale subsidy and
mortgage programs. But given the overwhelming share housing accounted in the wealth of the European
households, the crisis radically changed family strategies about housing investments in particular and saving
portfolio decisions in general. Furthermore, as proved by an OECD study, as a consequence of the fact that the
large price decreases reduced the wealth of numerous households, their consumption patterns were changed
likewise (OECD 2011, 6). Besides, it influenced how families approached energy efficient investments: if they
regarded their execution viable/desirable or not in their financial and housing situation.
While the crisis led to substantial decrease in property prices almost all over the continent, a more detailed
analysis shows that the effect of the housing crisis was rather localized. The exact size of the impact on the
real estate market was strongly dependent on various local factors: most importantly the legal and regulatory
barriers presented by the various nation states, coupled with the varying traditions favoring renting over
ownership, and different levels of state involvement following the crisis. (Zemcik and Zabrodska 2012) A further
difference impeding the evolution of very similar crisis patterns in the entire EU was the fact that the
deterritorialization of the European mortgage markets – as pointed out by Aalbers – has been slow and limited,
with primary mortgage markets remaining largely national. (Aalbers 2009) Furthermore, as the housing crisis
was triggered by an economic one, economically weaker countries were harder hit and – as it will be

38
shown – recovery has been more difficult for them. These national differences were further complicated
by local differences: most importantly large metropolitan areas together with their extended zone of influence
have fared usually better, especially if they had international and political importance. Cities mostly financial,
economic, commercial and political centers were not only hit less severely, but have been recuperating much
quicker.
On general, recovery has been very slow in the European real estate market and the outlook is still rather
bleak, with stagnation or moderate recession still dominating in a significant part of Europe. For the most
part, neither the house prices nor the housing production have returned to the peak level of 2007. Data from 2010
suggested that compared to 2007 the construction of residential housing stock decreased by 40%. (CECODHAS)
The analysis of the house price index for the European Union shows that prices – compared to a 2010 level –
were the lowest in 2009 and following a time of stabilization in 2010, stagnation and a small recession ensued.
(Eurostat 2013)
A sign of the continuing crisis is that the decreasing production of residential housing stock, which was
significantly sharper than the decrease in prices, is still going on. A complexity of factors lies behind this
decrease, including the lack of credit for perspective homeowners, the lack of will to purchase new homes by
households, developers’ inability to raise adequate money to start new projects and finally developers’ strategy to
maintain relatively high prices instead of cutting them. As a consequence, sharp decrease in the residential
housing production has been felt in countries with no supply overhang as well.
This housing crisis, which has been going on longer than previous post-war crises is not likely to end soon. (Ball
2012) Although by early 2012 prices in the Eurozone reached on average the pre-crisis levels, the prognosis for
general recuperation is bleak, with a few countries faring rather well, some stagnating and some facing dire
problems on their real estate markets. (Patrizia Immobilien AG 2012, 2013) The reason behind the prolonged
crisis, as pointed out by Michael Ball, is that the housing crisis has been accompanied by a prolonged economic,
debt and currency crisis of the Euro zone and the EU, with the sovereign debt of households stagnating. There is
a “problem spot” constituted by the Mediterranean countries, where economic instability is often combined with a
political one. In the meantime the policy options of many European governments have been narrowing
considerably, with the stricter mortgage regulations already in place in order to evade another real estate bubble
and with money and will to introduce stimulus packages for the housing market lacking. Furthermore, with
housing taxes levied increasingly, real estate growth is likely to be held back for a longer period of time. (RICS
2012) Furthermore, the risk aversion of households in the times of economic crisis is expected to strengthen the
stagnation of the European housing market on short-term (Standard and Poors 2013). Investors are also adapting
to this new situation. This adaptation has been largely centered on the mitigation and aversion of risks,
strengthening flexibility, the dismissal of general pan-regional investments and the focus of individual and specific
opportunities. Investors – both in the residential and the commercial sector – have been reshaping their portfolios
for the last five years (Walker 2013).
Given this background many assume that the complete recovery in the real estate market is going to be very
slow, but in countries like Germany, Austria, France or the UK, where the economy is performing comparatively

39
well, the growth of investments is expected even in a very short term. The bleak outlook coupled with the risk
aversion strengthened the trend of growing preference for rental dwellings. As part of this trend,
governments are looking into strengthening their rental sector, although there are still many institutional and
legal obstacles to overcome. In 2013 it was announced that in order to revitalize its construction sector and to
find a solution to the problem of not enough rental dwellings, the Spanish government plans to spend
approximately 2.4 billion euros in the next three years to retrofit buildings and to facilitate the access of the low
income people to the rental market. (EUbusiness 2013) At the same time in Hungary, another country badly hit
both by the economic and housing crisis, a National Asset Management Agency was set up. The Agency took
over the ownership of those apartments, where the owners were unable to continue paying their mortgages. The
former owners were thus turned into tenants. Currently, the Agency owns app. 1500 units, but the number is
expected to grow to 20.000 in a couple of years. (Hegedüs and Somogyi 2013; Hegedüs 2013)
Nevertheless, mid-term forecasts are already talking about recovery, taking the passing of the debt and economic
crisis as a point of departure and assuming that the growth of economy is likely to return. They further underline
that there will be a housing shortage in certain part of Europe, as a result of the specific demographic
movement, more precisely a still rising population, a growing demand for larger living space and an
increasing number of separate households. (Standard and Poors 2013) However, these forecasts also
emphasize an important consequence of the fragmented European real estate market: that it is going to be very
different, reflecting important lines of division based on different housing and welfare regimes, the economic
performance of the different countries and path dependence.
4.4 Regional patterns of housing market development
Thus, in understanding the short and mid-term development of the European Housing market country specific
patterns are essential in the characterization of the European housing market. Despite the many convergences,
the housing tenure systems, the housing legislations and the subsidy systems are not only different in
the different countries, but are also strongly path dependent. (Eurostat 2010) They are, as it has been
argued by many, strongly influenced by the welfare state regime dominant in the specific country. (Kemeny 2006)
This combination of historical heritage with the specific welfare arrangements has contributed to the emergence of
regional specificities, creating in many respects a relatively distinct Central/Eastern European and a Southern
European pattern in housing arrangements. In certain aspects Northern and Western European countries also
constitute a housing region. On a household level the regional and country specific differences mean different
opportunities for households to acquire a home, downgrade or upgrade it. As a consequence, it also influences
the possible energy efficient investments families can afford or plan to make.
In 2011 the catchy phrase was coined of “hot North and cool South” referring to the differently behaving European
regions in the direct aftermath of the crisis. In 2010 it seemed that most Nordic countries, and even Germany,
France and Belgium survived the crisis without much problem and could begin to grow, and even the Baltic States
started to recover after the suffered losses during the housing market crush. (This proved to be false in case of
France though.) In contrast the economically troubled Mediterranean countries have all suffered major to
moderate losses, supplemented with other weak economy countries like Ireland and Hungary (CECODHAS). As it

40
will be spelt out in the following pages in more detail a closer look at the different regions of Europe shows
badly affected CEE and Southern European EU countries with very little sign of recovery, practically
unaffected German speaking and Nordic countries and mostly recovering Western countries, with the
exception of the Netherlands.
The effect of economic instability and fiscal crisis has been most apparent in the Southern European
region, with Italy, Portugal, Spain and Greece being very strongly affected and as the persistence of their
economic problems that has made their housing market outlook for the forthcoming years particularly
bleak. The Spanish problem has been made more complicated by the overproduction of housing in the years
preceding the crisis and a vast supply overhang as a consequence. Spain stands out among the Euro area
countries as a country which – together with France – experienced a period between 1998 and 2007, where by all
approximation the rise of housing process and that of the residential investment into housing was exceptional. In
the period it reached house prices grew by an annual above 10%, peaking in 2004 at 2004 (Antipa and Lecat
2010, 162). This exceptional housing boom had been financed for approximately 15 years preceding the crisis by
one of Europe’s lowest mortgage interest rates. In the imminent aftermath of the crisis the country’s unsold
residential stock was estimated to be around one-fifth of the entire stock, with years of development necessary to
clear it (Zemcik and Zabrodska 2012). Italy has also been suffering from a week real estate market, and similarly
to Spain the economic difficulties the country has been facing make its easing on the short run very unlikely. With
regard to the future, the demographic constitution of the country – the fact that the group between 30 and 40, the
country’ most important buyers group, is forecasted to shrink remarkably until 2020 – makes any recovery more
difficult (Durden 2013). Actually, the housing crisis has followed a very different pattern than in other
Mediterranean countries. Despite the political and fiscal troubles faced by the country, Italian real estate market
proved to be rather resilient for a very long time in face of the crisis, largely due to its comparatively
underdeveloped mortgage market. Although the country has the fourth largest economy in the EU, in 2011 the
mortgage market made up of approximately 20% of the GDP against the EU average of 50% (NuWire Investor
2009).
Another problem spot, suffering from a slowly recovering economy combined with a badly performing
housing market is constituted by the Eastern and Central European countries of the European Union. In
all of these countries the pre-crisis years, starting usually around the new millennium, were characterized by a
significant housing boom, reaching in exceptional cases 25-30% annual property price increases. The effect of
the crisis was however not directly connected to this growth – e.g. Poland was barely affected although the
previous annual growth rates had been among the highest here – but similarly to the Southern European
countries with economic and fiscal troubles, like Hungary and Bulgaria, have suffered the most during the crisis.
Whereas in Poland the number of new residential building permits dropped by 28% between 2007 and 2011
during the same time in Hungary the decrease was by 68% (RICS 2012, 12). This decrease is still continuing in
Hungary, as according to a report by the Central Statistical Bureau, in the first nine months of 2013 the number of
completed apartments was 37% less than a year before. The only exceptions have been Budapest and areas of

41
Western Hungary, with strong economic potential.15
(Origo 2013) The Czech case is somewhere between the
Polish and the Hungarian one: after four years of a depressed housing market with decreasing production and
prices, it seems that in 2013 the market started to stabilize. By the end of 2013 some analysts expect that
dwelling prices will begin to rise again, and starting from 2014 this rise can reach about 3%. The expectation of
the solid rise is combined with the expectation of a stabilizing economy as well (Global Property Guide 2013).
Another significant and very particular factor contributing to the badly performing real estate markets in
the CEE region has been the sudden disappearance of foreign investment, which had formerly
contributed substantially to the pre-crisis boom in these countries. In Bulgaria for example between 2000
and 2008 property prices grew by approximately 300%. And between 2006 and 2008 real estate absorbed
approximately one-quarter of all foreign direct investment in Bulgaria. The crisis led to drying up of foreign funds,
contributing substantially to the dramatic losses. In 2008, real estate prices started to slide quickly in Bulgaria.
Although the speed has slowed down considerably, as of 2013 the outlook is still very bad for the Bulgarian
housing market, where housing prices in January, 2013 were 38% lower than in the peak period of the third
quarter of 2008 (Global Property Guide 2013). Similar tendencies could be observed in many CEE countries,
where cross border real estate investments led by foreigners was found in a significantly higher share than in the
EU 15 countries (Bushnell and McAllister 2012).
The Bulgarian case is also interesting from a regulatory point of view. The current stalling of the real estate
market is also the result of the fact that many dwellings are owned by more than one person/family and therefore
it is hard to agree on selling it, especially with large fluctuations in prices over the years. The price of keeping a
property is low, there are no strong regulations that oblige the owners to keep the property in a certain state, so
there is no incentive to sell it other than the money gained from selling it.16
Following a very different paths, both Great Britain and Ireland were badly affected by the economic and
real estate crisis, but their current prospects of recovery are better than those for most Southern and
Eastern European countries of the EU as their economies beginning to show signs of improvement.
Indicating the strength of the crisis, the number of building permits dropped sharply in both countries following the
crisis, although Ireland belonged to the worst hit group by 86% decrease between 2007 and 2011, while in the UK
a more moderate decline of 42% was registered. Compared to the pre-crash levels, the value of Irish homes has
fallen approximately by 50% as of 2013. With their economies stabilizing, housing markets in both countries seem
to recuperate, although the exact pace of it is rather uncertain. In 2013 Ireland’s economy is expected to grow in a
row for three years, and the country’s housing market registered its first annual rise since the crash, although a
significant share of the households is not expected to ever recover the entire equity lost (TheGuardian 2013).
Similarly, the latest data on Britain’s housing markets show tentative signs of recovery in 2013 after three years of
flat or falling activity. UK wide house prices have risen at their fastest pace for three years17
- up to 3.9 per cent in
the year to July – the strongest rate of growth since August 2010. Nonetheless, this springs from a low base for
15
http://vallalkozoi.negyed.hu/vnegyed/20131104-zuhan-a-lakasepitesi-kedv.html?sec-3 16
Bulgarian Housing Market Questionnaire for the Proficient 17
Calculations are based on the Nationwide house price index.

42
comparison - annual prices in July 2012 had fallen by 2.6% and considerable ground needs to be regained in
order for prices to reach pre-crash levels: current average UK prices are 12% higher than the low points of the
financial crisis they are still around 10% below the high points of late 2007 (Frank Knight Property Research). A
key factor driving this price growth is the reduction in price and increased availability of mortgage credit. Low
interest rates also matter: official rates have been at 0.5% for more than four years. This low interest-rate
environment has also meant a shortage of alternative investments for savers. And the lack of affordable housing
means that rental yields on the average property are above 6% – and that has proved an attractive investment for
new and existing buy-to-let landlords in recent months at a time when saving rates are so low (Bank of England
2013).
The Netherlands, another country hit hard by the crisis, has still yet to show signs of recovery. It is its
troubled housing market and the ensuing mortgage crisis that are at the center of the persisting economic woes of
the country, which contrary to French, German or British examples still shows no sign of recovery (Financial
Times 2013). The country’s real estate crisis has been compared to that of Spain and the US (Schult and Seith
2013). The housing bubble was brought on as a result of continuous government policies giving tax breaks and
thus promoting household leverage and ever increasing housing prices. The housing prices increased similarly
fast like in the peripheral countries of the EU before 2008, leaving approximately 30% of the Dutch mortgage
holders with properties that are worth less then what they still owe. Housing prices decreased by approximately
21% since 2008, and it is estimated that the bottom has not been reached yet (Financial Times 2013). The rapid
decline of the housing production data mirrors the economic and real estate crisis. Whereas the total housing
production (including market, governmental, private production) was nearly 100 000 units in 2006, it fell to below
40 000 units by 2012. And for 2013, according to expectations of experts like P. Boelhouwer of the OTB Institute,
this number is expected to fall below 30 000 for this year.18
The mitigation and postponement of the housing crisis strongly depended on effective state policies. In
France for example demand for housing was kept up by a series of government incentives until 2012.
France, similarly to Spain, experienced a very spectacular boom of the prices between 1998 and 2007, with the
annual growth rate of prices averaging above 10% and peaking at 16% in 2004 (Antipa and Lecat 2010, 162). But
unlike in Spain the crisis did not result the immediate crash of the market, which was partly due to the intervention
of the state. However, the state measures were withdrawn consecutively because of the emerging economic
difficulties. As a result, the French housing market has been through two cycles of ups-and-downs. Following the
sharp decrease in 2008 and 2009, an annual growth of 8% was recorded in house prices. (5,8% in real terms).
However, by 2011 the growth was slowing down, turning into decline by 2012. Besides the decline of price level,
data also suggests that in correlation with it demand for acquisitions has been decreasing substantially. In Paris
for example the sale of existing homes fell by 44% compared to the previous year in January 2013 (RICS
Research 2012).
The German speaking countries of the EU, plus Switzerland and the Nordic countries presented a rare
exception in the economic and housing market turmoil of the 2000s. For different reasons, the housing
18
Netherlands Housing Market Questionnaire for Proficient

43
markets of these countries have remained largely unaffected by the market crunch. Switzerland turned to
be an economic safe haven with the value of Swiss franc continuously increasing, and parallel to this experienced
unprecedented growth in its housing investments fueled both by the very low interest rates and very intensive
interest from investors. Between 2007 and 2011housing prices increased by 14,5% in real value. House prices
continued to increase after 2011 as well, and this was also accompanied by an increase in housing output, even
raising the question of a possible overheating of the market (RICS Research 2012). Austria and Germany have
not presented such an unprecedented growth, but their housing markets have remained stable in the entire period
aided by a solid economic performance and the fact that their housing markets were never as heated as in the
rest of Europe. The case of Germany is particularly interesting from this respect as the country registered a
comparatively depressed housing at the early years of the new millennium (RICS Research 2012). Its current
development suggests that the country’s economic growth is slowing, but the housing market is forecasted to
grow (RICS Research 2012; Global Property Guide 2013). Actually, the very stable real estate market is expected
to register an increasing demand for the next 15 to 20 years, with shifts from rural areas to the economical
stronger cities (Deloitte 2013, 5).
The same pattern is also true for Austria, as the country did not go through the similar housing boom like the other
European countries, registering a decline in housing production in the 2000s following the growth of the 1990s
(NuWire Investor 2012). The housing market in Austria has also remained stable in the entire period, with an
approximate growth of 20% in value since 2009 in major cities like Vienna or Salzburg (Gregor 2013). The
Northern region of the EU and Norway have also remained completely or relatively unscratched by the crisis,
although the Danish housing market suffered serious losses right in the aftermath of the crisis. Both the Finnish
and the Swedish housing market continued to grow during the crisis, fueled by countries’ strong economic
performance. The continued growth came to a halt only in 2011 in both countries, mostly as a result of economic
slowdown. In both countries the near future seems to indicate stagnation, with the possibility of small decline or
growth (RICS Research 2012).
Norway’s housing market movements are more reminiscent of the processes in Switzerland. Given the country’s
very strong economy and its vast oil reserves, the surging income of the population and the growing population
thanks to immigration, the crisis not only evaded the country, but current house prices are so high that agencies
like IMF or Bloomberg are warning against a possible real estate bubble. In its recent study IMF estimated that
Norwegian house prices might be overvalued by as much as 40%.19
Goldman Sachs put Norway – together with
Switzerland, Germany, Israel and Canada – among the 5 biggest housing bubbles in the world (Phillips 2013).
Prices in Norway are up by 30% from the lowest point of the housing crisis, and are further fueled by the limited
housing supply. This is a result of planning instruments as land use restrictions, relatively stringent minimum size
and high quality standards (Phillips 2013). Given the relative overheated nature of the market, the government
stated to intervene to try to cool down the market (Knudsen and Koranyi 2013).
19
http://www.ft.com/intl/cms/s/0/9147aab8-16be-11e3-9ec2-00144feabdc0.html#axzz2mJRomEr4

44
4.5 How sub-national housing markets are influenced by the local circumstances
The success of a particular housing investment is strongly dependent on how the sub-national housing market
functions. The local markets’ current problems and developmental forecasts are strongly determined by the local
transportation network, economic production, commercial and political importance and the demographic
composition of the settlement. Based on all these factors needs and requirements for housing investments
differ locally, and in order to be successful the interventions have to adapt to the set of factors
determined by the local housing market. As it will be argued below, that local housing markets often defy
national and international trends: it seems that large metropolitan areas with great economic and political
power can often maintain growing price and production levels even during depression periods. Settlements
situated in areas with stable economic production and enough working opportunity usually fare better than
settlements in the countryside with regard to their housing markets. Furthermore, settlements that function as
destinations for migration – this however usually coincides with relative economic and political stability –are also
more likely to maintain a relatively stable housing market as they are able to keep up an increasing demand
.Finally, the presence of specified services – like in a holiday or retirement settlement - can keep up the local
housing market despite national economic difficulties.
It is also in the local housing market that different demographic phenomena – most importantly aging and
migration – exert a marked influence. It has been proven that different demographic conditions, in and out
migration, the changing life-cycles of the population influence the housing market, raising or diminishing the
demand for housing, putting pressure on the house prices (Malmberg 2012). The overrepresentation of a certain
age group can most certainly increase the demand for specified housing, the most prominent example being that
aging societies need more homes designed to meet the needs of the elderly. Furthermore, with the spread of
home care the former model of equity release in old age and the adaptation of housing to the life-cycle changes,
putting pressure on the local housing demand (Bell and Rutherford 2012). But the European housing market has
to be prepared for the effects of aging in less specific cases as well: as current predictions say that by 2030 the
median age of the NUTS 2 regions’ population is projected to be between 34.2 years and 57.0 years, and the
share of the population aged 65 years or over is expected to range between 10.4 % and 37.3 % (Giannakouris
2010). And these trends will undoubtedly change the housing demand of the population in general.
4.5.1 Regional differences within a nation
There have been significant regional and city regional price differences within the different nations, as most
countries demonstrate. Often there is a very significant urban rural split among the house prices of the
different settlements, and these differences even grow as markets begin to recover.
In the UK for example, whereas England has been experiencing limited to modest growth, Northern Ireland saw
prices fall 2.3% on the last quarter. Similarly, Southern England has seen stronger price growth than Northern
England in every quarter for the last four years. Prices in the south of England were up 3.0% in July year-on-year,
whilst in the north they rose by 0.5%. Nonetheless, despite the lowest levels of price growth coming from northern
English regions, the strongest performance of any metropolitan area in England was in the north-east region -
Newcastle City returned annual price growth of 11% in July (Frank Knight Research).

45
The UK example also shows that regional differences can be explained in terms of regional variations in demand
and supply conditions. High average earnings, full employment, inward migration, relatively limited housing stock,
and tight restrictions on new house building in London account for high average prices in London. In contrast,
lower average wages, more housing stock, and easier planning means that average prices in many of the regions
are relatively low. This regional disparity makes it difficult for individuals to move regions in search of work and
reduces the geographical mobility of labour.20
Similarly, in regionally segmented countries like Italy or Germany, the regional location of a particular
settlement can be crucial factor in determining how the real estate market fares. In Germany, the growth of
the housing market is much higher in the West than in the East and generally also higher in the South than in the
North. 21
In Italy, with regard to the housing market 5 macro regions exist: North-East, North-West, Centre, South
and the Isles. As of 2011 and later property prices decreased in all five regions as a result of a troubled housing
market. Although an interesting aspect of the Italian housing market has been the fact that due to the country’
very urbanized nature, it is difficult to make a real distinction between urban and rural areas.22
Particular traditions – like the keeping of second homes – can influence, how the housing market functions. In
Norway for example, where the tradition of keeping large second homes in rural areas is very strong, this means
that the market is not only strong in major cities and towns due to the stable and continuing economic
development in these areas, but in rural areas as well, as secondary residences hytte/cabins or fritids bolig/free-
time houses are a cultural norm. These houses are in deeply rural areas and may be larger in m2
then the
primary residence. Similarly in Spain, the special market for the second homes keeps the housing production per
1000 inhabitants way above the EU average, despite the deep economic, fiscal and real estate crisis of the
country. The rural housing market makes up an important segment of the Spanish housing market: nearly half of
registered buildings in the census of 2001 were in rural population centres of less than 10,000 inhabitants.23
Importantly however, even in countries, where the housing market is still sliding, stark regional and local
differences mean that in some areas increases are possible. Hungary for example has been expensing a very
severe economic and housing market crisis, and housing prices have been decreasing for five consecutive years,
still registering a 2% decline in the first quarter of 2013 (Index 2013). Despite this, several settlements have been
registering growth in housing prices for a while. Either fuelled by local economic growth, as the presence of a
significant economic investor – in case that of Audi in the city of Győr – or the presence of tourism, like in the bath
town of Héviz, it results that national trends are overridden by local and even international interests in the housing
market (Szilágyi 2013; Origo 2013).
Housing markets in the capital cities behave usually differently from the rest of the country: while some
evaded the recession entirely, others could recuperate much quicker than housing markets in the country side or
in other cities. Dublin, which was severely hit by the crash in 2008, could grow significantly faster during 2013, the
first years when the Irish housing market registered growth since the crash, than all other settlements. In 2013
20
UK Housing Market Questionnaire for Proficient 21
German Housing Market Questionnaire for Proficient 22
Italian Housing market Questionnaire for Proficient 23
Spanish Housing Market Questionnaire for Proficient

46
house prices in Dublin grew by 4.2% whereas the rest of the country grew by 0,7% (The Guardian 2013). So the
differences between house prices in Dublin and other cities grew, widening the housing market gap (Daft 2013).
Similarly the differences between the housing market in London and other areas of the UK have grown
substantially. Whereas in an area inside London known as Prime Central London(PCL) prices in 2006 were just
over three times as expensive as the average UK property, today they are almost seven times the average UK
property. By the second quarter of 2013 the London housing market has returned to prices 5% higher high peaks
of late 2007.24
Besides London, Vienna, and even Berlin and Paris to some extent, seem to have defied both international and
national trends, flourishing during the crisis. Investments into the property of these cities served as an
escape route for many, particularly for investments coming from emerging markets (Zemcik and Zabrodska
2012). Migration in general helps to maintain housing demand, although it does not suffice alone. Madrid
and Barcelona for example have been important destinations for migration, similarly to Milan or Lisbon, but all of
these cities have lost a considerable amount in housing values. And migration of the retired will present housing
demand in only a few settlements under very specific conditions, one of these being most notably the weather.
At last, it should be mentioned that most settlements – as capital cities and other cities – are not homogenous
either. Rather, their housing markets are fragmented, where developing areas are mixed with stagnating
and deprived ones. And households’ assessment about their particular housing situation will mean that
their relative position is weighted against other areas of the settlement. It seems that the same trend of
increasing difference following the crisis, apparent among different settlements of a country, is also evident within
the settlements themselves. In Budapest for example the high prestige areas have managed to maintain interests
in moving there much more than some of the low prestige ones on the outskirts of the city. The growing
differences made real estate agents refer to the city’s housing market is “being torn into two” (Fekete 2012).
24
Frank Knight Property Research, available at: http://my.knightfrank.com/research/?regionid=2

47
5. Collective Self Organized Housing (CSO) in Europe
5.1 Definition
The picture that emerges in the post-crisis Europe is that of strong regional differences, partial recovery and
partial deepening of the crisis. In relation to the general economic performance of a country, its particular housing
legislation and housing policy, the particular economic and employment conditions prevailing in a specific area of
a country, as well as other factors like the demographic movement influence profoundly how the housing market
performs in different areas. Whereas the general pre-crisis boom is gone, there are many openings in the
residential segment of the housing market, aiming at people with different income and expectations. It is in this
fragmented post-crisis housing market that where the role of Collective Self Organized Housing (CSO) is being
investigated in this section. CSOs represent, as it will be spelt out in this section, a solution to some of the
concerns raised by crisis, and offer possibilities to lead a more eco-friendly and sustainable lifestyle
often at a more reasonable price.
By definition CSO housing “refers to a group of individuals that acts in association to organise and commission
the processes of formation, requirement definition, planning, design, implementation and / or maintaining their
own housing project (new construction, refurbishment and retrofitting projects). A CSO housing project is typically
characterized by a mutual dependency between the individuals participating. Participants have the right to step
into contractual agreement (both on the individual and collective level)“. Single family houses only belong CSOs if
they are organized on district level, since we can only talk about a collective, neighborhood level decision making
process in that case.25
In the vast majority of cases CSOs include owners only. However, the complete exclusion
of tenants can lead to the distortion of the real situation. It should be noted that depending on the national
legislative environment, the specific contract between the landlord and the tenant, or the specific founding
document and regulation of a housing association, tenants can be quite influential with regard to retrofitting plans
and other type of investments. Similarly, municipal tenants can sometimes enjoy a high level of influence with
regard to retrofitting. Furthermore, the inclusion of tenants in newly forming CSOs is often fostered by
municipalities that hope to strengthen the social integration and achieve a relative social mixture in the different
neighborhoods.
CSO concept is flexible: change is an essential part of the CSO definition. CSO is also a potential that can be
fulfilled, as the retrofitting cases will demonstrate. A housing community can evolve into a CSO over the course of
years, as they engage in different works. And notwithstanding the deep differences between the European
countries, the trend of community-based, environmentally conscious behavior is growing everywhere, influencing
living arrangements and consumption patterns. Furthermore, a less explored, but nonetheless important aspect of
the CSO study is to understand which features – e.g. car sharing in co-housings or communal facilities - can be
transported to the mainstream housing market, used under radically different living arrangements.
25
PROFICIENT Terminology, 2013 August

48
CSOs can be formed both with the aim to construct new housing or to retrofit an existing one. But these
two markets differ substantially from each other: with regard to the size of the market segment, the size of
the average buildings, but also with regard to the underlying aims of intervention.
5.2 Newly constructed CSOs
In case of new construction any form of collective housing project is considered a CSO, where the future owners
have a decisive role in planning, design and construction processes. Newly built CSOs often have residents that
choose a life-style significantly different from the mainstream. People, who engage in the construction of CSO
housing usually have a strong drive to live according to certain values to have a certain lifestyle.
CSOs in new construction are not only a housing form but often a form of behavior that influence a vast
array of aspects of life. The combination of value and life style elements include the importance of green values
and energy efficiency, the incorporation of a more grass-root oriented ideology that places significantly greater
importance to community and in relation to this to sharing and that of collaborative economy. Furthermore it
includes a bigger emphasis on the activities of individuals as decisive factors to influence the life of a community.
These values are helpful in creating stronger neighborhoods and more sustainable urban areas. They are by
definition useful planning tools to evade the overheating of the real estate market and as a consequence the
creation of a supply overhang in the residential areas. Furthermore, they can play a very important role in
promoting energy efficient interventions. As a result, the majority of newly constructed CSOs are actually co-
housings.
Figure 3. The CSO market for new construction

49
Newly constructed CSOs are regarded to have a very positive influence from various aspects.
From an economic point of view:
CSOs are a viewed as a form of housing investment that helps to evade the overheating of the
markets
CSOs can be an effective tool in cutting housing prices by 10-20%, as the cases in Germany
and Switzerland demonstrate – although there are cases when the CSO process makes the
construction more expensive
CSOs usually have the potential to advance energy efficient investments at an economic
(district level) scale that make these investments cheaper and accessible for a wider strata
They also present an opportunity for the SMEs to be involved in the process of refurbishment
and construction.
From a community point of view
Many CSOs contribute to urban sustainability by strengthening community involvement and
advocating green values.
The success of the CSO phenomenon is closely tied to the notion of making a community
based approach of living available to many people, although – as it will be spelt out later -
CSOs differ substantially with regard to the level of community involvement.
CSOs can contribute to the achievement of multi-age, multi-cultural and sustainable
neighbourhoods, with different housing arrangements attracting members of different social
strata.
From an urban development point of view
CSOs contribute to the reutilisation of unused housing space: be it an abandoned former
industrial site, an unused public site, like a school or an unused housing in need of
refurbishment
CSO developments can become part of larger scale urban renewal projects, forming their
backbone by combining social, architectural and ecological goals
The different actors in the CSO process often see different advantages in participation. For the end users –
including both owners and tenants – the possibility of influencing their immediate living environment is usually one
of the most important pull factors. This can mean a variety of different things, ranging from living with close friends
or at least with like-minded people to arranging a living environment that is energy and eco conscious. Actually,
the importance of ecological motivations seems to be growing among these initiatives. CSO can also be
instrumental in offering them services that would not be available otherwise, or the availability of which could be
very costly under any other circumstance. Such services can include collective child services for younger families,
or the services of a nurse/doctor on a CSO compound created for the elderly.

50
For municipalities CSOs can offer the prospect of integration, the partial solution of a few pressing social
problems and an important tool in strengthening social cohesion. Immigrants, elderly or families in need of social
help can find a safe and suitable accommodation in a CSO with the help of the municipality, helping them to
integrate into mainstream society. Furthermore, depending on the specificities of the construction, CSOs can also
offer cheaper accommodation to all these at-risk households, helping them further on. And CSOs can be useful
from an urban point of view. Catering after the needs of the inhabitants means that they are more likely to stay in
the neighbourhood, attributing to its sustainability on the long run. So CSOs can be a useful tool in urban renewal
projects and revitalisation of somewhat run-down neighbourhoods, but Similarly, sustainability and the
improvement of social cohesion can also be important factors for housing cooperatives, who want to provide
homes that are both affordable and at the same time eco conscious for their inhabitants.
Box 3: The use of newly constructed CSOs for urban development
The Tübingen case shows how the promotion of CSOs can be a useful tool in the hands of the municipality to achieve its goals
of urban development. The city of Tübingen, in order to ease the affordability problems that have become unbearable starting
from the mid-1990s. So the City purchased vacant land in the brownfield area of the town – that had previously been vacated
by NATO – and started to create am urban area, where the development would be dominated by Baugemeinschaften (the
German version of co-housings), who were obliged to keep their ground floor area for non-residential use. Semi-private court
yards were also created, with cars usually being kept at the periphery of the development. As a result, a vibrant, multi-
functional neighborhood came into being, with a diversity of buildings and dwellings, where the cost of housing was 10-20%
lower than in other parts of Tübingen. (bfc website 2013)
There are many examples showing the fact that the role of public sphere is crucial in bringing about the CSO
constructions. Behind the public engagement there is always the conviction that these CSOs contribute to urban
renewal and sustainability by utilizing of unused plots, strengthening social cohesion and lowering the cost of
living for many. The methods of involvement might be varying, depending most importantly on the goals of the
municipality, the local parameters with regard to available land/building and the financial situation of the
perspective residents.

51
Box4: Municipal strategies for promoting CSOs
Berlin has been following what can be at best described as an approach that involves less direct involvement, but the focus on
organizational help. The city itself, with its abundantly available vacant plots dispersed in the entire area, has been ideal for such
a development. With the help of the municipality the process of creating a Baugemeinschaft has been standardized, a network
of SMEs was established, and the local government has been active in making information available for interested parties. The
city even hosted conferences about the Baugemeinschaften, and numerous exhibitions and lectures were held.
In Hamburg, the municipality plays a more assertive role, actively influencing the use of land to promote the development of
Baugemeinschaften. There is a special department within the municipality to oversee and coordinate the Baugemeinschaften.
The department facilitates the appropriate land search, and the city reserves approximately 20% of available land for the
Baugemeinschaften. (bfc website 2013)
The development of CSOs is useful for different economic actors as well - such as developers, construction
companies, architectural firms or any type of SMEs interested in the housing construction/refurbishment business
– who want carve out a special niche for themselves in a market dominated by big companies. Their exact role
depends very much on what segment they plan to target. The CSO examples listed above show that SMEs can
count on the support of public bodies. A crucial question for SMEs involved in the development of such projects is
how to match individuality with standardization. In many of the newly constructed CSOs individual influence
seems to be a crucial question. But it is the element of standardization that can both save time and lower the
costs. In the website of the UK co-housing association e.g. there is a resource centre aimed at dispersing
practical knowledge and information about creating a successful community. Although at a very initial stage, there
are elements of standardization involved in this resource list, as complete individuality has very high transaction
costs both with regard to money and time.
Box 5: A typical SME: mixing business with a mission
The Wonderlandhill Development Company is a US based company that is a nice example of trying to mix standardisation with
individuality. It is the largest developers in the United States, who have completed over 20 co-housings. The company focuses
offering a variety of services to co-housings, from carrying out a complete development, to selling vacant cohousing helping and
to helping to form a community. The company mixes business interests with its strong mission, expressed during its lecture
series and advocacy for co-housing. (http://www.whdc.com/what-mission.html)
CSOs in new construction do not represent a large share of the European housing market. Rather, they represent
a segment whose importance has been accentuated by the housing market crisis and its aftermath as it has been
regarded a way to avoid the overheating of the market again. Actually, the exact importance of CSOs is very
different in the various national housing markets. Different housing legislations and the different housing
mortgage conditions, the prevailing economic conditions just as well the traditions and values influence both the
possibility of creating a CSOs and the type of CSOs that are being created in the countries of the European

52
Union. Furthermore, national statistics rarely measure their presence among new constructions. The Dutch
statistical bureau, the Statistic Netherlands is one of the few exceptions, trying to gauge the presence of CSOs in
the country. However, even they seem to handle the data as an aggregate. According to a report from 2010, 10%
of the construction in the Dutch housing market is privately commissioned (Boelens et al. 2010, 69). Private
commission however is an aggregate term, referring to single families commissioning work, co-commissioning –
which is a mixture between large developments and collective control – and CSOs.26
Consequently, the CSO
element of the Dutch housing market is quite marginal, despite the political push to strengthen it (Boelens et al.
2010, 69).
Despite the lack of national statistical interest, local statistics, some data is available with regard to communities.
And these also suggest that even in cities that foster the growth of CSO housing, there importance varies from
marginal to small. Currently Freiburg has approximately 220.000 residents, and its alternative city district Vauban,
houses approximately 60 projects that include 5000 inhabitants.27
In Berlin, a city receptive to alternative housing
solutions, where an entire network of architects and it is estimated that by 2020 approximately 5% of the people
will be involved in a community housing project, making approximately 150.000 people reside in community
housing. The Berlin case is particularly interesting, as it also showcases that a relatively large and stable market
can bring about the standardization of the CSO building process, with architects firms and organizations creating
a network and offering services for this specific segment of the housing market (bfc 2013). Actually, in some cities
in Southern Germany the share of the CSO-Housing in new constructions is 30 % or even higher.28
With regard to the spatial positioning of newly constructed CSOs it can be said that cities, both smaller and larger,
represent the primary areas for CSO involvement. Co-housings are often found in large and medium sized-cities
that offer them the necessary infrastructure – e.g. a developed public transportation system and many working
opportunities – and in many cases their municipalities are also facilitating the constructions in the hope of
providing cheaper accommodation for families and trying to keep their population from going to suburbs. A further
advantage could be that unused and undervalued areas – e.g. school buildings, abandoned factory areas can be
reutilized (Winfriedhaertel.de 2014).
Box 6: Repurposing old/unused buildings and areas
The case of the Vauban neighbourhood in the German city of Freiburg is a nice example of converting unused areas to
residential ones. Vauban was a former military base that has been developing since 1998. By now there are approximately 5000
inhabitants. The area became a mix of working and living area, with highly energy efficient buildings and a lot of avant-garde,
socially sensitive and ecological projects. The average age of inhabitants is 28 years.
Similarly, in the Dutch city of Eindhoven an old, unused school building from the 1930s is being converted into 10 apartments
26
Co-commissioning means that the end-user agrees to a binding and interactive relationship with the developer. The latter still has the ultimate responsibility for the entire construction process, but the end-user has a much wider choice between different elements, floor, roof tiles, bricks, or frames (size). This type of construction is usually carried by a professional developer or corporation that brings the plot (ground), takes the risk and has experience. The end-users (buyers or tenants) are involved in the designing and/or realization of the dwellings. Per project, the specific degree of control and choice usually varies 27
German Housing Market Questionnaire for Proficient 28
German Housing Market Questionnaire for Proficient

53
with additional 10 apartments being built. Carried out with the help of the Kilimanjaro foundation, an organization that
specializes in finding old buildings that are suitable for being transformed, this particular project will be targeted for people 45
years and over.
For more about the cases see: Bas Hasselaar, State-of-the-art of CSO energy-efficient new districts. Deliverable 7.4
Some CSO communities exist in rural areas in Italy or in the UK. In Italy these communities are mostly addressed
to low-density district in rural areas, which is mainly related to the growing vision of a more and more sustainable
way-of-life related to this kind of groups. However in Germany the share of CSO housing is practically non-
existent.
However, even within one country – meaning a single legal system determining the fundamental
characteristics of the housing market - CSOs can occupy different segments. Whereas some developments
are in high prestige areas with rather wealthy inhabitants, but a lot of CSO housing can be found in the lower
segments of the housing market as well. Furthermore, the influence of the owners and the sense of community
also varies depending on the type and size of CSO housing. These differences are vital, since they denote that
the inhabitants most likely will have different needs.
5.2.1 Co- housing
Co-housings constitute probably the largest share of CSO construction. Here people cooperate on many issues,
not only maintenance and interventions. They often have common goals and follow a similar lifestyle. They are
often driven by green values that are also often accompanied by a strong social mission. Many co-housings are
pioneering to use energy-efficient concepts, such as small co-generation plants (heat and electricity co-
generation), on the block- or neighbourhood level, or solar energy and heating panels supporting distant heating.
Other types of communal CSOs include religious communities – like the communities created by the Krishna
believers – or even communities designed to house the retired and elderly.
Co-housings have a defining philosophy with regard to life-style, collective goals, the role of sharing. Residents of
the co-housings find a different balance between private and community than normally practiced. They do not
regard their home "as a private retreat from the world beyond". Rather, "co-housing schemes provide different
alternatives for living" These alternatives manifest themselves in the architectural built of a compound, as well as
the daily "home-making" routines that can include shared care for children and the elderly, shared meals and
cooking (Blunt and Dowling 2012, 263).
Helen Jarvis defines co-housings as intentional communities, which “typically include the clustering of smaller-
than-average private residences to maximize shared open spaces for social interaction; common facilities for
shared daily use; and consensus-based collective self-governance (Jarvis 2011, 560). Co-housings come about
as a result of collective activities and a shared physical space. Land use arrangements and also the process of
participatory design contribute to the fact that co-housings have a higher share of public and semi-public spaces
than more conventional living arrangements (Jarvis 2011). Currently, green values and the possibility of leading

54
an eco-friendly life represent a big push for the formation of co-housings, but the hope to find a problem to the
aging question is also growing in importance.
The co-housing movement started in Denmark in 1964 with a construction at the outskirts of Copenhagen. Soon
other project followed, but breakthrough came in the spreading of co-housing as the Danish government and the
financial institutions became interested in the co-housing movement. For financial institutions co-housings
became a good investment as here houses were sold before completion. As the acceptance of the co-housing
idea grew, developers also started to integrate co-housing ideas into older neighbourhoods. Today co-housing is
so well-established and accepted that master plans designate large areas for co-housing developments.
Compared to the original project, today the average size of the dwellings are smaller, while the shared facilities
and common land have increased (Milman 2013).
Co-housings offer answers to several problems. One of them is economizing with resources and evading waste.
They enable resource sharing for their inhabitants in ways that are not so readily available to non-community
residents. They not only employ efficient technologies, but by introducing new methods of sharing, new routines
of resource sharing and carrying out daily household routines they improve resource management and help
ecological sustainability (Gram-Hansen et al 2009). But this sustainability is meant not only in an ecological
sense, but often sociocultural and economic sustainability is included as well, as shown by the Finnish example of
Kellokas. Co-housings often also try to evade homogeneity. However, given the price pressure and the fact that
standardization can give better prices, it can’t be avoided sometimes.
Box 7: Example of a Finish co-housing
Kellokas is a Finnish example for co-housing where the co-housing is found in a townhouse. With and aim to reduce carbon
monoxides heating and warm water is produced with renewable energy, almost free of charge. Hybrid power solution of solar
collectors and geothermal heating are also installed. Any excess heat produced by of the solar collectors is transferred into and
stored within 200 meter deep geothermal wells. During the construction process healthy, durable and sustainable non-toxic
materials were used allowing walls to breathe to evade mould.
Architectural design was used to foster sustainability in several sense. First, the co-housing was constructed in a way to adapt
to its surroundings. Second, it was constructed to be able to adapt to the changing needs of its inhabitants. Not only was
typological flexibility employed, allowing the co-housing can hosts different inhabitants with varying wishes. But also the
individual apartments are designed in a way that inhabitants, in case of need, will be able to rent out or sell part of their
apartments.
See more details about the project at: http://www.karinkrokfors.fi/co-housing.html
Sustainable consumption is also advocated by co-housings. Although many aspects of collaborative consumption
can function in wider spatial proximity, the fact is that collaborative consumption, the sharing of services and
products, physical proximity provided by co-housing is often necessary (Stratmann et al. 2013). But a particular

55
trait of co-housings – one that sets them apart from gated communities – is that they can fulfil important social
roles not only within their own communities but also with regard to the outside communities. As Dorit Fromm
argues, while examining 5 sites that these communities not only produce social contacts, services and security for
their own inhabitants, but mostly try to connect to their neighbourhood (Fromm 2012). They can have positive
effect on their direct surrounding, aiding their development and sustainability both in social and ecological sense,
and as a result they can be instrumental in small-scale neighbourhood renewal.
Furthermore, co-housing can help facing specific difficulties faced by modern society, predominantly urban
societies. These including alienation and social isolation. Co-housings are generally a good place for social
integration. They offer a chance for migrants to integrate into the mainstream society. They allow households in
need of temporary help to find a cheaper solution to their plight. It was in this vein that in 1995 in Morgan Hill,
California, an affordable housing community for single parents was established. The aim was to allow them to
study and gain better job skills. As part of the project childcare is provided on site (The Cohousing Company
2014).
Probably the most important segment that is gaining in importance is the special co-housing segment designed
for the elderly as an answer to the growing aging problem. These co-housings are essentially an investment by
older in social capital and mutual support to evade the anonymity of modern neighbourhoods at a time when
single households are on the increase and many older people live alone. They offer also special care and housing
option for people with special needs (Brenton 2013). In the architecture of these co-housings accessibility is a
much more central theme than in age-integrated co-housing communities (Gottschalk et al. 2000).
Senior co-housing is a relatively new type of development that is booming all over Europe. Responding to the
particular needs of a country, it is most wide spread, where CSO housing and co-housing is wide spread as well.
In Germany for example the development of co-housing for the elderly is being subsidized both on federal and
state level, given the country’s enormous problem of aging. But they appear very often in Denmark and the
Netherlands as well. In Denmark a study about co-housings in Denmark found in 1997 altogether 51 senior
communities housing about 1000 people. During the research it was found out that an important motivation
behind their move was trying to find good quality but manageable apartments. The physical proximity of
neighbours about the same age also played a significant role in the decision of many. However, residents did not
necessarily look for joint activities with their neighbours. With regard to the resident profile it was found that
residents of the co-housings were more likely to be single and women than people in the same age group in non-
cohousing schemes (Gottschalk et al. 2000).
In the Netherlands the concept of the “living group” in part of the central government policy important for
sustaining health and wellbeing of the elderly. It is regarded as a tool to reduce demand on health and social care
services. It is implemented through the partnerships between Dutch local authorities and housing associations
(Brenton 2013).

56
Box 8: Dutch co-housing culture
An important aspect of co-housings in the Netherlands has been its apparent flexibility, meaning that besides the mixed co-
housing communities – that make up the majority of cases – there are many specific ones, accommodation the special needs of
particular ethnic, gender or age groups. With regard to senior co-housing an important development has been the spread of
‘retrofit’ co-housing. This is not a co-housing in the strict sense of the word, but fulfils functions of community, so essential in the
co-housing culture. Here housing associations help their older tenants to form a mutually supportive and sociable living group
without moving – with a flat in their block kept untenanted to act as their ‘common house’. In these situations, the pre-existing
senior cohousing community model acts as a helpful template.
As part of this process that favours the development of senior co-housings, provincial grants were made available to subsidize
‘collective private commissioning’ (Brenton 2013, 5).
The possible role co-housing can fill in housing market divides participants and experts. Whereas scholars and
those people, who initiate and participate in the collaborative process of co-housing construction see it as a
solution to the spread renewable energy and as an experiment to proceed towards a more sustainable life-style
and production pattern. However housing politicians and many executives are often more sceptical, and see the
role of co-housings and collaborative governance and self-steered cooperatives as a peripheral solution for a
small percentage of dwellers (Tummers 2011).
The acceptance and spread of co-housings is variable across Europe. Whereas in the Nordic country they make
up approximately 5% of the entire housing stock – the whole movement started in Denmark and Sweden in the
1960s – in other parts of Europe there are significantly fewer examples. In the Netherlands and in Germany they
are still relatively wide spread, with growing importance in certain regions. In these countries big cities like Berlin,
Hamburg or smaller ones like the Hague or Freiburg make the spread of co-housing a central theme of their
urban policy. Actually, there has been a noticeably growing interest in Germany in recent years from different
municipalities that see the support of co-housing as a measure to maintain sustainable inner cities with
inhabitants, who are willing to stay. In a study conducted at the TU Dortmund by Peter Ache and Micha
Fedorowitz researchers found that numerous German municipalities – in their case 26 – became the motors of
these co-housing projects, trying to energize and help the process of organisation and execution (Ache and
Fedorowitz 2012).
But in other areas of Europe, only sporadic attempts or a few examples to be found. Currently in the UK, there are
15 established co-housings, and the association’s website lists another 43 in the organizational phase. And the
numbers are usually similarly low in other European countries. And these communities are usually made up of a
few families. Besides the UK, it is in France, Belgium, Spain and Italy, where the development seems to be most
promising among the newcomers. In Italy e.g. there has been significant media coverage, leading to the
establishment of two co-housing organisations and the initiation of various projects (Lietaert 2013). The
acceptance and availability of co-housing is the lowest in East-Central Europe.
The price of a co-housing development differs substantially: it can often be significantly smaller – e.g.co-housing
developers in Berlin estimated it to be about 25% cheaper than normal developments for new construction – but

57
in a few cases these developments can be more costly as well (Winfriedhaertel 2014). The reasons for this are
manifold, which on the one hand make the creation of the co-housings a more personal, but also a more lengthy
process. As a primary source of money sparing is through investing the participants’ own work and
expertise instead of that of a developer. As a result, the building costs plummet, but the time involved growth
substantially. Based on examples in the UK or Germany, it is safe to say that the complete development of a co-
housing can take as much as 8 to 10 years from the first conception of the idea until its completion. Second, the
lack of a developer cuts down costs in a way that it allows participants to spare the profit and advertisement
costs. Third, some funding is often available through public sources: like for the inclusion of social rental
dwellings in the complex or through the availability of funding for advanced green technology. Fourth, these co-
housing communities can make use of abandoned sites and buildings that are often available at a relatively
cheaper price.
However, there are also situations, when developing a co-housing might be more costly. If the land available is
expensive, if there is very little municipal help or the advanced technologies applied are expensive or not
subsidized at all, then developing a co-housing might be very costly. Actually, the small number of co-houses is
numerous European countries can partly be in connection with the relative high cost of their development in those
areas. In the UK for example the average property prices in the postcode area for the same type of properties in
non co-housing matched the prices asked for properties currently on the market for co-housing. If these results
were typical of a larger sample, prices would be unaffordable in most cases for households on average earnings.
Some of the currently developing schemes have conditions attached to their planning permission for ‘affordable’
housing to be included in the scheme.
Finally, one important problem associated with the development of co-housings is the relative long time of
development. Even if there is support from the public bodies, finding the appropriate land and carrying out the
development can take a very long time. For the founding members this can mean a development time between 8
to 10 years. As a result, in many cases only fraction of the founding members actually moves in the co-housing.
5.3 CSOs and retrofitting
CSOs in the retrofitting sector represent a much larger segment as they theoretically include all owner
occupied buildings with more than one dwelling inside (or individual buildings on district level): here the
community of owners can decide on the future renovation measures throughout a valid governance structure
(decision making system). Furthermore, when tenants can exert substantial influence on the physical state and
physical alteration of their building as well as its financial maintenance, tenement buildings can also be
considered CSOs. In case of retrofittings it is usually less the life style and value elements that dominate but the
importance of energy efficiency as a source of possible savings and growing comfort level. Community is often
not present in the retrofitting scene in the same strict sense as it is in the newly built CSOs. Rather, as the figure
below shows, the retrofitting cases can include different value elements, but this is not the rule. All in all the
market share of CSOs in retrofitting is quite substantially different from CSOs in new construction: they are far
more numerous.

58
However, CSOs in the retrofitting sector cover very different market segments and CSO means radically
different housing conditions all over Europe. CSOs are also a regional concept, conveying a slightly different
meaning in the different parts of Europe. The different examples of CSOs all over Europe show that CSO housing
includes a vast array of various housing arrangements. It seems that different countries, with their specific
housing markets and legislations produce different CSO markets. As a result, the scope of interventions initiated
by the different CSOs is radically different, thus offer very different opportunities for SME involvement.
What seems definite is that regardless of regional specificities typically multi-storey multi-family buildings
represent the primary market for CSO retrofittings.
In the Netherlands there is a great variety of housing types that are suitable for CSO retrofitting. There is quit a
share of houses built after 1975 that are owner occupied, low density multi family, or terraced houses; fitting the
criteria for need of deep renovation (energy performance related) and might sincerely be helped with an CSO
housing renovation. Furthermore, in the market of refurbishment, there are many building types, not being
residential now, that might meet a potential of transforming into houses / apartments in the future. Unused
schools, churches, former factory buildings and desolated office buildings all fit the criteria. Also the call for more
(re)development in the cities, by small scale demolish and rebuild, or transformation initiatives, there is a
significant potential for CSO housing initiatives. Land in these situations is often owned by housing associations.29
29 Dutch Housing Market Questionnaire for Proficient
CSO RETROFITTING
GREEN VALUES/ ENERGY
EFFICIENCY
COMMUNITY LIFE
SHARING

59
In Italy the most common building type for CSO is the multi-family housing built in the post-second world war era.
And starting from the 1970s, the Italian housing sector has been characterized by collective initiatives in the form
of housing cooperatives. Nowadays housing cooperatives still represents an affordable way to build your own
home reducing time and costs, and to meet the end-users requirements. Cooperatives operate mainly with high
density housing consisting in multi-storey and multi-family houses.30
In the CEE countries and the Baltic States CSOs are largely formed by large housing cooperatives, group of
condominiums, or even single, but very large condominiums. These buildings suffice district level requirements in
themselves. A large part of the CSO housing stock - as a consequence of the urbanization and construction
trends of Socialism - is constituted by pre-fabricated housing estates in the region. These estates have their
specific retrofitting needs, and programs to improve their energy efficiency, their direct environment and the look
of the building facades have been in place in all CEE and Baltic countries. Another type of housing belonging to
the CSO category in this region is the urban core of settlements dating usually from the late 19th
and the early 20th
century.
In the Anglo-Saxon countries multi-storey buildings are usually municipally owned or tenement buildings, where
the individual flats are privately rented. As a consequence, in these countries CSOs are formed from detached
and semi-detached houses. It is in the context of these buildings that the term district level gains importance: it is
the cooperation of detached buildings that turn them into CSOs. In the UK housing associations have the potential
through residents associations to be CSOs.31
Housing cooperatives are a very important among the CSOs both in the Northern and the German speaking part
of Europe, constituting a core part of the CSO segment. Precisely because of their organization structure, they
offer good opportunities for district level interventions and ESCOs. In Germany CSOs mainly consist of row
houses and apartments in multi-storey buildings. In Norway the greatest potential for CSOs is the owner occupied
multifamily condominiums or cooperatives, in particular existing within the housing stock.
The following table summarizes five models, highlighting the region specific housing types where CSOs can
mostly be found, also indicating about the possible size of the CSO segment in the entire housing market.
30 Italian Housing Market Questionnaire for Proficient
31 UK Housing Market Questionnaire for Proficient

60
Table 8: Different forms of CSOs in the different European regions
The CEE and
Baltic model
the German
speaking areas
including the
Netherlands
the Northern model
the
Mediterranean
model
the Anglo-Saxon
model
BUILDING
TYPE
multi-storey
buildings with
many units
typically multi-
storey buildings
with many units
both multi-storey and
concentrated
detached/semi-
detached homes, more
alternative living
arrangements –like co-
housings – are wide
spread
multi-storey
buildings with
detached or semi-
detached houses
organized on a
district level
POSSIBLE
LEGAL
FORMS
condominiums or
housing
cooperatives
condominiums or
housing
cooperatives,
predominantly housing
cooperatives, but other
legal forms as well
predominantly
housing
cooperatives but
other legal forms
as well
various legal forms
SIZE OF THE
HOUSING
SEGMENT
in many countries
make up the
majority of
housing stock, in
others a
significant part
make up usually a
significant part of
the housing stock
make up usually a
significant part of the
housing stock
make up usually
a significant part
of the housing
stock
make up a small
part of the housing
stock
Every country has a specific building tradition combined with its specific housing legislation, which strongly
determines the building types that are the most wide-spread among CSOs in the existing stock.
- Condominiums: These are multi-unit buildings, the different units are separately owned and where the
owner, usually the occupant, has the right, along with other owners, to use the common areas. Common
elements such as exterior walls, floors or structural systems are owned by the condominium association or
by the community of owners. There are usually association fees for maintenance and property upkeep,
taxes and insurance on the common areas and reserves for improvements (Smith 2012)
- Housing cooperatives: housing cooperative is a collective housing organization in which members (or
shareholders) participate in the governance of the property. Such organizations are typically made up of
residents and follow cooperative principles, running on a not-for-profit basis in order to provide goods and
services members at the lowest practical cost. They can be made up of owners, tenants or the mix of them.
If tenant cooperatives belong to CSOs depend on the rights and influences tenants have (Smith 2012).
- Family-owned units in detached or semi-detached houses and row houses: Individual family housing can
only be regarded CSOs if the owners initiate construction or retrofitting in a coordinated action together.
- Other forms (homeowners associations, limited companies, etc)

61
5.4 CSO values
As shown by the previous analysis there are core values, around which CSOs are built. These are community life,
green values and the importance of sharing. Although these values are present both in the new construction and
the retrofitting sector, their importance varies considerably as it was emphasized. Whereas the new constructions
are almost always value-based, in retrofittings values usually play a significantly more marginal role, with energy
efficiency for the sake of saving playing the most important role.
5.4.1 Community life
Community is a key concept about CSOs, although it can mean very different things, ranging from simple, target
oriented cooperation to the aim of leading a life along common values. Based on this, it is possible to differentiate
between communal and non-communal CSOs, although certain housing types can fit into both categories and the
dividing line is not rigid, rather a continuum. Furthermore, with regard to matters of the decision making process
there seems to be a big difference between communal and non-communal CSOs, with the former being more
democratic and encompassing.
In non-communal CSOs people cooperate for maintenance and interventions, but the real community is lacking.
However, it is precisely the interventions that can help to bring it about. These buildings constitute the largest
share of the market. In these buildings CSO is a possibility that can be achieved. Usually, these non-communal
CSOs are separate houses dispersed in a larger neighborhood. Similarly, gated communities and the district level
association of detached or semi-detached houses also qualify for non-communal CSOs. These CSOs largely
decide with a majority decision, but the exact framework for their decision making process is usually set by the
national housing legislation.
Communal CSOs are rather different. Here people not only cooperate on the issues of maintenance, but rather try
to follow similar life styles and as part of their agenda try to organize joint programs an incorporate all members in
them. Helping each other out is often also a significant factor in these tight knit communities. Thus, common
meals, common chores, and looking after various members – e.g. with child care facilities and senior care
facilities – are the most important of these joint programs. Co-housings are the best examples of these
communal CSOs. These communal CSOs are often the most democratic, meaning that they seek consensual
decisions for each important matter. This type of decision making process requires strategies for cooperation from
all participants and aims for reaching a solution/agreement that is acceptable for everyone, although it is not
necessarily the favorite of the different individuals.32
Current projections say that the importance of community is about to gain significance. For once, due to the lack
of rising incomes and the corresponding stagnating demand for goods, coupled with an ageing population and the
outsourcing of low skill work to Third World countries, governments have to come up with new approaches to
maintain the level of employment, or at least slow down its depression. For this goal, they launch public work
programs, or support employment in the public sector. For more developed countries, this means classic public
sector employment, in less developed First World countries (e.g. new EU Member States) this could be massive
32 For a good summary about it see http://en.wikipedia.org/wiki/Consensus_decision-making

62
public works campaigns, sometimes an obligatory criterion for social and unemployment benefits. Although the
majority of these occupations do not result in productive work that could substantially contribute to the overall
economic product, they at least keep the masses busy, and off the streets (Economist 2014). At the same time
other factors suggest that the work and leisure time equilibrium will change in many developed countries. Given
that in many Western societies the economic development creates a situation where part time employment will
become more accepted. Both phenomena will result that the quality of life becomes heavily dependent on the
living space and the local community. With enough income to live on, devoting more time to community
involvement and living might become an option for a greater number of people.
5.4.2 Green values and energy efficiency
There are many differences between CSOs with regard to the importance of energy efficiency and green values.
The most important is based on the fact if it is a newly built CSO or the refurbishment of an old building. In the
latter case there is usually less inclination to create life style changing green investments, and as a rule there is
much less flexibility involved in changing the physical premises as much as in cases of new construction. In the
former case residents are usually far more conscious about the environmental hazards and are more willing to do
something against them than the average EU resident. Many CSOs are constructed in a way to function as
passive houses, but even those that are not usually have rules that foster an energy conscious behaviour. In both
cases wealth and social position of the CSO inhabitants also influences the residents’ aims and wishes about
green involvement.
Depending on the exact circumstances, the goals and wishes of the inhabitants, their wealth, their values, the
closeness of cooperation between them, there are various solutions available for improving energy efficiency.
Architectural solutions:
o Economizing with space: the reduction of the size of the private dwellings, which is – partly –
compensated by a bigger common area
o The application of high tech materials to create a good insulation for the dwellings
o Taking the heating power of the sun in consideration and placing dwellings and dwelling
windows accordingly
Transportation solution:
o On a personal level using solutions like car-sharing among the inhabitants or preferring the use
of bikes/public transportation. In a few cases this might include renouncing the use of cars
o On a general level using the local resources and possible cooking from locally grown food in
order to reduce the transportation involved in the production process
o Maintaining a small local store in case the CSO is situated in the outskirts
Energy solutions:
o Reducing the consumption by metering it
o Applying renewable energy: it is mostly solar, however under certain circumstances this can
include wind, geothermal or hydro energy

63
o The common use of domestic machines, e.g. washing machines
Waste management:
o The minimization of waste by recycling as much as possible
The chosen actions and deeds of CSOs do not happen in a void, rather they are part of a larger movement,
where the questions of sustainability, the effects of environmental pollution and the questions of energy use – or
overuse – have become an important topic that come up both on EU and on national policy levels in each
country.33
However, the application of these measures, if they are successful or not and how they are perceived is
very different in the different EU countries. In the Scandinavian and the German speaking countries and the
Netherlands such measures have a relatively wide social support, with both local and central governments
introducing regulations in favour. However, in many of the former Soviet Block countries but also partly the
Mediterranean countries, there seems to be a less strong attachment to following green values currently.
5.4.3 Sharing and collaborative characteristics of CSOs
For the most part sharing choirs and goods is the characteristic of newly constructed CSOs. As examples show,
several co-housings have a car sharing service, own joint bicycles, aim at leading a common kitchen that supplies
them with common meals for a part of the week, or even venture to cultivate vegetables together. Some try to
have common washrooms and even operate joint offices. The aim is always to try to minimize waste and
maximize the usage of available resources, be it space, energy, food or time.
Although they are small in number, they should be regarded important. Their importance derives from the fact that
they are part of a larger trend in the entire Western world that sees community and sustainability as the focus of
the development of the future. Through this trend, some of the specific co-housing attributes can be transported to
the mainstream, affecting significantly more people. The change of behavior entails various things, besides the
spread of environmentally conscious behavior and ethical consumption also the growth of the movement that
emphasizes the eating of locally grown food. But it is best accentuated by the growth of sharing or
collaborative economy.
Spread from the mid-2000s but really given boost after the financial and economic breakdown of 2007/2008, the
sharing economy was made possible by technological advancement. It comes in different forms and structures,
but a substantial part of it utilizes the internet. Importantly, it strongly connects global with local, as the sharing
economy often helps in exploring and strengthening the local economy by also making it globally available. Often
referred to as collaborative consumption essentially means that owners rent out something they are not using to
strangers. These things include mostly cars, houses or parts of houses, bicycles or even high value goods as a
photographic equipment, kitchenware or music instruments (Geron 2014). But the possible spectrum of
marketable goods is increasing, entering the realms of less high value goods. As part of this trend e.g. there are
33 This means that despite the crisis, movements such as Fairtrade have flourished in many EU countries during
the past years. Among others only in the UK the sales of Fairtrade certified products increased by 14% in 2013.

64
attempts to use the peer-to-peer system to sell home-made food in Greece both to save money for households,
but it also has the extra effect of reducing food waste (Skarlatos 2013).
Box 9: The transition town initiative
The reconomy and transition town movements exemplify very tangibly what the collective economy means in practice.
Originating in the UK, these interrelated projects were founded in the early 2000s with the aim of creating communities that were
more self-sufficient. Sustainability, local ecological resilience and the restricted dependency and use of fossil fuels are in the
center of the transition town movement, just as well as the promotion of locally grown food. Among others communities focus on
reducing drastically their dependency on oil, and establish such things as community gardens, waste exchanges or try to repair
old items. Community is a key concept in the transition town movement, meaning that decisions must include the different local
actors: the inhabitants, institutions and the elected representatives. In May 2010, there are over 400 communities that
were recognized Transition Towns, spread mostly in the English speaking parts of the world, including different types of
communities like villages, city neighborhoods, city districts or entire cities. They are regard by many as providing an exemplary
way out of economic and financial crisis. (Source: Wikipedia, available at:
http://en.wikipedia.org/wiki/Transition_Towns_(network) and http://www.theguardian.com/environment/transition-towns)
Given the wide variety of participating entities, the project later changed its name to Transition Initatives. Transition towns
already have a network called the transition network that provides them ideas, allows them to exchange their experiences and
connect. See: http://www.transitionnetwork.org/
The reconomy project came to as part of the transition town movement, with the aim of putting local production into the center of
the local economic life. (http://www.reconomy.org/) It hopes to foster a new type of economic life with an emphasis on
collective/sharing economy, local currencies, the growth of local initiatives and production that are also eco-friendly. As part of
the initiatives ideas such as community owned local power stations get realized – e.g. in Brixton, which is a part of London – or
local currencies were introduced in Totnes, Stroud, Lewes, Brixton and Bristol.(See
http://www.theguardian.com/environment/transition-towns.

65
6. Energy efficient interventions – past and potentials
6.1 Energy efficient interventions already implemented
It is very difficult to assess the total scope of retrofit in Europe, but it is estimated, that around 0,5-2,5% of the
housing stock is renovated annually for energy efficient purposes. (BPIE 2011) Still it is estimated, that up to 50%
of buildings in Europe are not insulated. (Ecorys, MRI, LSE 2013)
It would be extremely interesting to know in which market segments was retrofitting with an aim of energy
efficiency improvement was the biggest. Unfortunately there are no reliable data on that as most of the regular
retrofitting activities do not require any special permission so no official registration can be statistically evaluated.
What can be evaluated however in some cases is the spatial distribution of the use of different state subsidies.
There are some examples showing that not really the financial capacity but the organizational capacity of
the city and other structural and technical factors what matters the most. E.g. in Hungary the state subsidy
for the renovation of system-built buildings was concentrated into urban areas but there was no connection
between the level of income of the residents of one city and the scale of interventions. Some developed cities
experienced a very low level of interventions – like Budapest – while cities with lower economic development
show the signs of nearly complete reconstruction of their housing estate stock – like Pécs. The same could be
said about the United Kingdom, where the most affluent areas accomplished the least energy retrofitting per
thousand dwelling.
Box 10: Use of CERT in the UK
In 2013 a research was commissioned by UK government to analyze the take up of CERT (Carbon Emissions Reduction
Target) support scheme funded by the suppliers. The main statements were as follows:
Overall, 39% of the surveyed households reported they had taken up subsidized energy efficient measures since
April 2008.
Concerning the area type it seems, that the different types benefitted approximately according to their population
weight, except for metropolitan areas that were underrepresented. (20% rural, 31% suburban, 34% urban and 16%
metropolitan)
The least developed northern regions benefitted the most from the CERT scheme, where about 20-25% of the
dwellings were affected by the subsidy scheme – in contract to London, where 10% (partly as a result of ‘more
difficult to treat’ housing types).
The post-family households were vastly overrepresented among the CERT takers (partly because of the specificity
of the scheme that targeted more the elderly households).
Source: https://www.gov.uk/government/uploads/system/uploads/attachment_data/file/ 48208/3339-evaluation-of-the-
delivery-and-uptake-of-the-carbo.pdf

66
In the following table we can observe that in each EU member state (at least in the ones that belong to Proficient
project) there is some kind of a subsidy scheme available for energy efficient housing construction and/or
retrofitting.
Table 9: Major national support schemes for energy efficient retrofitting or new construction measures
Country Energy efficiency support schemes recently available for residential buildings
Bulgaria
For residential buildings there is no support from the public sphere, however almost every bank offer a
loan for projects in the area of energy efficiency which is mostly concentrated on installing new
windows and placing outside insulation.
Czech Republic
New Green Savings programme: it has 5 fields of interest:
Reducing energy performance in existing family houses
Building family houses with very low energy performance
Efficient use of energy resources (installing devices run by renewables)
Support for preparation and provision of implementation of measures supported (support for
contracting experts)
Bonus for combining selected measures (extra support for combining different measures)
The subsidy content is between 30-55% based on the proposed energy savings.
Multi-family buildings are not considered for support under this scheme.
Panel 2013+ programme: low interest loans for upgrading panel buildings.
Approximately 55% of large panel buildings (LPB) have been partly refurbished but it is estimated that
complete refurbishment has been done in 30% of LPB only.
Germany
KfW-Darlehen: A credit at reduced rates of interest or a subsidy for
New constructions: the lower the assumed demand for primary energy is the lower the
interest rate (or the higher the subsidy) is. The rates change frequently. Financing is eligible
for all the construction elements.
Refurbishment: The subsidized financing refers mainly to the energy-saving measures in
existing houses.
Since 2006 the federal government of Germany yearly provides an amount of €1 Billion within the
scope of the initiative „Wohnen, Umwelt, Wachstum“ (Habitation, Environment, Growth) to make the
programs that are dedicated to the CO2 reduction more attractive and to fulfil the national obligations
(Kyoto) in terms of the climate protection. The yearly government-funded volume is about 17 Billion
according to the KfW-Bank.
360.000 residential units have been refurbished with the help of the KfW in the year 2012. (There are
ca. 40.000.000 existing residential units in Germany) 36% of the new constructions of residential units
used subsidies from the KfW bank.
Hungary
National subsidy for supporting the energy efficient retrofitting of system-built residential buildings
was introduced in 2001. It provided 30% grant from the state, 30% from the local municipality and 30%
own share from the residents. After some years the municipal subsidy became a non-compulsory
element and the subsidy disappeared from the state budget in 2009 – however some billions were
provided in 2013 from the CO2 quota. It is announced to continue in 2014 mainly from EU funds and
will aim at complex renovations. By the end of 2013 about 30% of the prefabricated residential
buildings have received some support. Besides this mainstream support programme interest rate
subsidy for the renovation of multi-family buildings exists for decades and in certain years subsidy
schemes for traditionally built family and multi-family houses were also announced providing 30%
grant for the tenderers.

67
Italy
The most important Energy efficient program is operated on national level. This programme allows to
deduct from the annual taxation of each citizen 65% of the amount of the expenditures for
refurbishment actions in order to improve energy efficiency in buildings, divided in maximum 10 yearly
rates for an overall amount of 100.000 Euro. Since 2006 until 2012 about 40% of the housing stock in
Italy was refurbished in some extent with the help of this programme.
Netherlands
In the Netherlands different schemes for supporting energy efficient interventions were in operation for
decades. Currently there is a particular subsidy for renovation activities like some refunds on double
glazing, or installing PV panels. Unfortunately for both consumers and producers (suppliers), these
programmes are always rather short term, and hardly have enough budget allocated comparing to the
demand.
There is a measure to help renovation as a form of VAT reduction over the last two years that has
resulted in some increase of renovation activities in the residential sector. The tax reduction means
that over all labour for renovation and construction work, only 6% tax is eligible, instead of the 21 %
VAT normally. It is expected that also in 2014 this tax measure will stay in place.
Norway
The construction of EeB projects is funded by local property developers who receive support from
Enova via targeted programmes and support schemes. Enova is a public enterprise that is owned by
the Ministry of Petroleum and Energy and financed via funds allocated from the Norwegian Energy
Fund.
For housing construction and implementing housing repairs (if they meet certain environmental
purposes) a loan with favourable conditions is provided by the Husbanken up to 80-100% of the
total costs.
Spain
In Spain the national subsidy scheme aims at:
improving the energy efficiency of the thermal envelope of existing residential buildings;
improving the energy efficiency of heating systems of existing residential buildings;
replacement of conventional energy to biomass in heating, cooling and hot water in existing
residential buildings;
replacement of conventional geothermal energy in heating, cooling and hot water production for
existing residential buildings.
United Kingdom
Green Deal (that replaced the already existing CERT scheme from the beginning of 2013 resulting in
less burden on the national budget) is a Government-backed scheme to help make cost-effective
energy saving improvements. Under the scheme, householders and businesses can take out loans
(only in case the savings/month exceeds the instalment/month) to make 45 different types of
adjustments to their property, such as installing double-glazing, insulation and new heating systems,
with repayment taken through the property’s electricity bill rather than from individuals. The experts for
planning the works and the constructors are selected from a prequalified list. There is also a favourable
loan attached to the scheme (however not much favourable than a regular loan).
ECO (Energy Company Obligation) is funding from the big six energy suppliers to support energy
improvements for people on certain benefits, for those in solid wall properties and for households in the
poorest parts of the country.
Source: information provided by Proficient partners
Even support schemes are different (grant, loans, tax incentives provided by different actors) it seems, that the
efficiency of them (meaning how big share of the housing stock was involved in the programs) does not depend
on their type: tax incentives in Italy could have a bigger effect than interest rates subsidies in the Czech Republic
not to mention the substantive grant scheme in Hungary. It seems that subsidies in general have a perverse
effect: they contribute to decreasing the investment costs, but as they became general the actors in the
investment field expect them, which means that the interventions are postponed until the most recent subsidy

68
scheme is published. General subsidy schemes also have the drawback that they can contribute to increasing the
investment prices. as prices are calculated with the existing subsidy program in mind. Thus, the schemes do not
increase the efficiency of investment and decrease the pay back period only the profit of constructors happens to
be higher.
As the EU 2020 aims and the actions against climate change become more and more serious it is expected that
the subsidy schemes for energy efficient new construction and retrofitting will continue.
6.2 Energy efficient interventions: the future
6.2.1 Potential in new construction
According to the EU directives (Directive on energy performance of buildings 2010/31/EU) all new building
construction and major renovation in Europe is required to be ‘nearly zero-energy’ by the end of 2020. On the
other hand to define what is ‘nearly zero-energy’ is the task of the member states. In some regions of Europe
these requirements are foreseen to be met in a shorter period: In German regions where the Green Party is ruling
the progress is quicker. ‘Half of the cities in Germany (with the notable exception of Berlin) have already adopted
Frankfurt’s “Guidelines for Economical Construction 2009” which requires Passive House performance for new
construction and major renovation of public buildings (Pike Research 2011). (Pike Research envisages that
ESCO companies will be involved in passive house constructions in the future after getting experienced with
public buildings.) In Brussels the target date for reaching the passive house standard for new construction is
2015.
All this means, that heading for 2020 the intensity of energy efficient intervention in the housing sphere may
fasten (in some cases probably to avoid thorough interventions after 2020). These regulations have an important
effect. It is due to them that the energy consumption of one m² new dwelling in 2009 was about 30-60% less than
it was in 1990 (Bertoldi et al. 2012, 28). Currently the construction of passive houses are somewhat (10-25%)
more expensive than building regular homes. This gap between the cost of passive houses and regular new
construction increases as we go North, meaning that the extra investment costs are not paid off by the decrease
in the heating bill. However with the increase in the construction numbers and as the passive house market
becomes a volume one the extra costs may disappear. (E.g. it already happened in Germany.)
6.2.2 Potential in retrofitting
According to careful investigations based on the current cost levels it is worth more to implement retrofitting
measures than to carry out investment into fossil or renewable energies. In order to produce/save one MWh
energy efficient interventions would cost the least (Cambridge Retrofit 2014).
Fossil fuel/nuclear – €30 to €75/MWh
On-shore wind – €60 to €75/MWh
Large scale PV – €110 to €140/MWh
Small scale PV – €125 to €250/MWh
Off-shore wind – €125 to €175/MWh

69
Tidal stream – €250 to €350/MWh
Energy efficiency – €20 to €45/MWh
Based on these data people (and countries should promote energy efficiency first before investing in any other
energy sources. However, the market potential for energy efficient retrofitting (not the major ones where
‘nearly zero energy’ will be the standard soon) can be the highest in those countries where the following
conditions are the most favorable:
1. The energy consumption of the dwellings is relatively high which means that by the interventions the
energy saved could be substantial (this factor is not very favorable in the Mediterranean countries).
2. The price of energy and income ratio is high, which means that the money saved by the interventions
increases the residual income substantially. (This is a big impediment in those countries where people
can easily afford higher energy prices and are not encouraged to spare, e.g. in the Netherlands.)
3. On the other hand the price of intervention should be affordable, otherwise – in spite of the high energy
prices – the intervention cost reduces the residual income too much. (The later is the case e.g. in the
Baltic states.)
Table 10: Typology of EU countries based on their energy efficiency potential in the housing field
Energy efficiency gap is high (high
demand for retrofitting)
Energy efficiency gap is low (low
demand for retrofitting)
Housing demand is high (high
demand for new construction)
United Kingdom (certain urban areas),
Germany (certain urban areas), Finland,
Poland, in certain Benelux areas
France (certain areas), Denmark,
Norway
Housing demand is low (low
demand for new construction) Baltic countries, Central Europe Mediterranean countries
Despite the fact that some countries have a higher potential to energy efficient retrofitting than in others not
mentioning the potential in new construction all the countries have different market segments where the energy
efficiency gap, the affordability of interventions and the energy costs/income provide favourable conditions to
energy efficient interventions.
In addition it has to be taken into account, that not only the saving potential but other factors like the importance of
green values, the potential increase in the real estate value of the dwelling, and the increase in the comfort level
can play an equally important role in deciding about the investments. Based on these characteristics we may
differentiate between the two market segments concerning the intentions for retrofitting:
Cost sensitive segment: saving potential is the most important factor for retrofitting. The energy
efficient intervention does not result in significant increase in the value of the real estate (downmarket).
Those interventions are in the focus which have a short pay off period.
Value based segment: the property is in an upmarket position, so the intervention may result in high
increase in the real estate value and/or the residents are environmental cautious and/or they are willing

70
to increase their comfort level of living. This case a complex intervention with longer pay off period is
applicable.
According to Pike Research the market of energy efficient interventions in the existing buildings has started to
move from the introductory phase to the growth phase, however, but most probably not in all market segments.
Some of the segments seem to be already in mass production (at least before the economic crisis) like the
installment of simple energy efficient retrofitting measures in prefabricated buildings in several EU countries. On
the other hand, complex energy efficient projects seem still to be in a piloting phase.
6.3 Potentials in district level interventions
6.3.1 In new construction schemes
District level interventions in new construction schemes are very common as it can be more cost effective in
construct a complete neighbourhood with all the necessary facilities and it provides more freedom for the
developer to obtain a bigger piece of land and optimize the layout. Even many co-housing developments include
several buildings and these buildings in some cases are placed in a newly developed neighbourhood that has a
special character, or “mission”. This character is mostly about energy efficiency (like Vauban in Freiburg), green
values (like Möckernkierz in Berlin) and sometimes about social values (like mixed aged neighbourhoods). The
organization on district level is implemented by the local government or government agencies.
In the last 10-15 years more and more new neighbourhoods are built up with special focus on the eco standards.
We may experience examples nearly in all member states of the Union, like Eco-cities program in four member
states (Helsingborg and Helsingor - building 598 eco-dwellings, 584 eco-rehabilitated, Tudela - 350 Eco-buildings,
Trondheim – 350 eco-dwellings. Sometimes blocks of social housing are also built in an extremely energy efficient
way, like in Belgium (St-Agatha-Berchem). In many cases new construction is mixed with retrofitting of the
existing housing stock.
6.3.2 In retrofitting schemes
Energy efficient investment on district level could be the focus or a ‘side effect’ of an intervention. Neighborhood
renewals started at the end of the 70s in the old member states they could be experienced only in the 90s in the
new member states. There are several national and regional programs aiming at restructuring the mostly deprived
neighborhoods. (E.g. SozialeStadt in Germany, Politique de la Ville in France, Big Cities program in the
Netherlands). The level and type of interventions are very different starting from the upgrading of the public
spaces to the total demolition and reconstruction of residential districts. The interventions do not have a clear
energy focus but lately – probably as a result of the increasing energy standards and the growing visibility of
green issues – the improvement of the energy parameters of the buildings became an inevitable part of the
interventions.

71
Box 11: Use of EU funds for housing interventions between 2007-2013
The resources of the European Regional Development Fund (ERDF) for housing purposes opened up in 2007 for the new
member states in order to implement complex rehabilitation measures in deprived neighborhoods in order to avoid further
deterioration. In spite of the original intentions the subsidy was not used in about half of the old member states till 2012, and was
rather used for separate buildings in the Baltic states. Only some countries implemented district level interventions (Hungary,
Czech Republic, Poland and later on Bulgaria). The interventions contained investment into the housing stock – private and
public – but also into public spaces and the social infrastructure. Energy efficient interventions were also common but they did
not exceed the standardized level (insulation, window change and engineering in the best case.) The possibility was opened up
to the new member states in 2009 but only for energy efficient interventions with some social targeting goals – practically it was
implemented in the social housing sector. Only some countries lived with the opportunity (UK, Italy, Greece pilot program level),
but in France the resources contributed significantly to the reconstruction of the French social housing stock.
The exact regulation on the use of the ERDF for housing purposes is not published yet, however from the discussions it seems
to be obvious that a more substantial support from the EU funds is expected between 2014-2020. The capping of ERDF 4%
(which the housing subsidies could not exceed between 2007-2013) will be terminated and also the obligation of targeting to the
more deprived neighborhoods seems to be eliminated. Most probable the funds will be used for the energy efficient renovation
of publicly or privately owned multi-family buildings. The complex interventions on district level could be less relevant than
between 2007-2013, a more volume based approach is rising that aims as reducing the energy efficiency gap in housing as
much as possible.
Source: Study on sustainable regeneration in suburbs- promoting social integration in deprived neighborhoods through housing
interventions by ERDF (Ecorys UK, MRI, LSE 2013)
In some cases not the complex, socially determined renewal of a certain district is in the focus of the intervention,
rather the improvement of the energy standards. Sometimes older buildings are completely reconstructed
according to the newest (sometimes passive house) standards, like row of homes in Mannheim's Gartenstadt
neighbourhood (24 apartments), R2 Cities is in 3 cities: Valladolid, Kartal-Istanbul and Genoa (council housing),
UK- Hackbridge. However in general these projects are piloted rather than mainstreamed. The use of alternative
energy is less common in the retrofitting projects than in the new construction ones.
There are also mass programmes available aiming at strengthening the energy efficient retrofitting of whole cities
or districts (like the RENEW programme in London or the Cambridge retrofitting project) that provide framework
for individual efforts for retrofitting. Even these programmes are organised on city level there is space for bottom
up approaches to create neighbourhood level cooperation in the future.
From a technical point of view the advantages of district level interventions can not be overestimated. In several
cases the houses in a district area are somewhat interconnected (e.g. with district heating systems or with other
source of energy). If several buildings are retrofitted from a neighbourhood than a completely different capacity of
energy resource would be needed and the fix cost of the operation of the energy system will grow putting large
burden on those buildings that did not manage to retrofit. It is much more efficient to resize these integrated

72
energy systems in one package. District level interventions have advantages in the implementation stage as well
as the construction works can be lot more cost efficient if the materials are ordered in large scale or as some
facilities are used at the same time (e.g. crane or staging).
No matter whether it is a retrofitting project or a new construction one the strong involvement of the public
actors – mostly as leaders of the process – could be observed. The interests and the attention of the public
sphere is the highest in deprived neighbourhoods where neither the expertise nor the financial capacity is
available from the residents’ side. In case of a higher status area the role of the public sphere is more about
coordination, co-financing and participating in pilot technical and organisational schemes.
There are very few examples for initiating projects on district level by means of a bottom up approach.
Co-housing with some dozens of dwellings can be created based on the initiative of the future residents, but a
neighbourhood with several co-housing communities or newly constructed buildings is a result of a public or
private intention. In case of retrofitting we can observe the same: district level interventions are organised by
mainly public actors with the aim of urban renewal. The cooperation of individual buildings’ communities in order
to implement a large scale improvement project is basically unknown.
6.4 The potential of the ESCOs
Energy Service Companies could be found in the European market since the 1880s, however till the 1990s their
number was limited similarly to their range of their activity (Boza-Kiss and Grosser-Lagros 2013). Since then
several forms of ESCO services were developed from the standard energy supply contracting to energy
performance contracting. All of these main types integrate several business models based on what types of
services are implemented by the ESCO company and how the risks and investments are shared between the
participants. ESCO is not a service which is explained explicitly and the same ESCO services may have different
names in different countries (CEM in the UK while Chauffage in the other countries). The “official” definition of
ESCO services comes from Directive 2006/32/EC, according to which ‘energy service company’ (ESCO): a
natural or legal person that delivers energy services and/or other energy efficiency improvement measures in a
user's facility or premises, and accepts some degree of financial risk in doing so. The payment for the services
delivered is based (either wholly or in part) on the achievement of energy efficiency improvements and on the
meeting of the other agreed performance criteria’.
The essence of this definition is that ESCOs – differently from a normal developer – have interests in quality
management as they take part of the risks by performance contracting. By this definition ESCOs could be
understood in the framework of retrofitting projects (energy savings compared to the already existing
consumption) or in case of new construction (energy performance of the new object or certain percent of green
energy source). In this frame ESCOs may provide different services:
engineering, architecture, technical services, procurement services
technology, development, maintenance services
source of energy
equity capitals, loans

73
The services of ESCO companies could be favourable for those clients that do not have either the technical or
financial capacity to implement an energy efficiency project while the client is able to measure the risks which
should be shared between the ESCO company and the final beneficiary. ESCO services raise extra costs for the
consumer (as expertise costs money), while it can also lead to the decrease of costs as the ESCO company has
the direct interest to save as much money as possible on the operation in order to keep the agreed performance
level.
The ESCO market is slowly developing in most countries (not necessarily in the housing sector), mainly as a
result of increasing energy prices. Interestingly enough up to 2005 ESCO business models were more popular in
those countries where environmental awareness is lower (e.g. Italy, France, Hungary, Czech Republic) and
unpopular e.g. in the Scandinavian countries. Currently the ESCO market is promoted by the European Union not
mentioning the very ambitious national and local energy efficiency action plans.

74
Table 11: Comparison of the status and change of the ESCO markets between 2009-2012
Region/
group
Champions in
Western Europe
EPC leaders Eastern European
success stories
Scandinavia Southern
Europe
Example
countries
IT, UK, FR DE HU, Baltic SE, DK, NL ES, PT, GR
Status large markets, still
slowly growing
large markets small-medium
markets, decreasing
medium, fast
growth
small-medium,
stagnating, but
sometimes
growing
Driving
factors
- political
commitment
-white certificate
systems or other
driving national
policies
- strong promotion
- political
commitment
- good examples
and focus on
information
dissemination
- only EU
requirements, but
with a minimalist
approach
- local political
commitment and
support mechanisms
have dried up
- climate
awareness
- customer
demand
- ability to keep
creditworthiness
by clients
- political support
and dissemination
of demo-projects
- economic
collapse and a
need for cost
savings,
- search by the
construction
sector for new
businesses
- strong political
support in terms
of legislation and
leadership
through
renovation of
public buildings
Trends in
the future
still some level of
grows, but it is
unclear whether
this can be
sustained in the
future
continues to grow,
even quickly and
provides an
example, as well as
conscious know-how
dissemination to
other countries
if the conditions do
not change, and
awareness does not
grow locally, the
markets will further
decrease
continuous string
growth. Until
recently other EE
measures were
dominant, but
lately EPC has
been discovered
as a suitable
solution
depending on
the success of
the running
projects (i.e. not
many fails), a
large growth
may be seen.
However, even a
few and small
failures may
have detrimental
effects
Source: Benigna Boza-Kiss and Enrique Grosser-Lagross: Energy Service Companies in the EU (2013)
However we have to bear in mind that the table above displays the market situation concerning all sectors of
energy efficient interventions not only housing. The biggest market share of ESCOs could be observed in case of
public buildings and in case of commercial or office buildings. ESCOs in the housing sector are relevant in
Germany and Austria but mainly in connection with publicly owned housing complexes or buildings owned by
housing companies. Large scale retrofitting projects in the CSO sector are extremely rare, only some examples
can be found all over Europe. The reason behind is that the transaction costs are high in case of CSOs and
ESCO companies can easily find those market segments in which they can earn more profit. On the other hand

75
ESCO companies with the highest share in the sector are not SMEs but rather big companies that are able not
only to implement but to finance the interventions. In countries where bank loans became extremely difficult to
reach as a result of the crisis the market relevance of SME ESCOs decreased (e.g. in the Mediterranean
countries). SMEs in the ESCO sphere may have bigger market where a more flexible however less finance
intensive approach is required: non-typical complex projects, housing projects which have too high transaction
costs for the big companies. On the other hand ESCOs can hardly compete in such circumstances where
subsidies are not at all tied to any kind of energy performance requirements. These types of generous subsidy
schemes do not encourage the end-users to control the energy performance as the main goal turns to be the
simple use of the subsidy. (On the other hand it is politically not easy to create such a subsidy scheme which
reclaims back the grant in case of insufficient savings.) The other factor that makes the circumstances
unfavourable for ESCOs is the volatility of energy prices which creates uncertainties concerning the savings.
Despite these, there are some trends that may result in some increase in the participation of ESCOs in the
housing sphere in the future: higher technical standards in new constructions and retrofitting which requires more
expertise, support schemes tied to the measured result of the interventions, recovering bank sector that can issue
more loans under better conditions, and assistance of the European Union with special EIB schemes, can all
contribute to higher ESCO participation.

76
7. Bibliography
Aalbers, Manuel. 2009. “The globalization and Europeanization of mortgage markets.” International Journal of Urban and Regional Research 33(2): 389-410.
Ache, Peter and Micha Fedorowitz. 2012. “The Development of Co-Housing Initiatives in Germany.” Built Environment 38 (2).
Andeweg, Marie-Therese and Silivia Brunoro. 2007. “Introduction.” Marie-Therese Anderweg, Silvia Brunoro and Leo G.W. Verhoef, (eds). Cost C16Improving the quality of the existing urban building envelopes. State of the art. Research in Architectural Engineering Series 2. IOS Press.
Andrews, Dan et al. 2011. “Housing markets and structural policies in OECD countries.” OECD Economics Department Working Paper No. 836. Available at: http://www.oecd-ilibrary.org/docserver/download/5kgk8t2k9vf3.pdf?expires=1376309183&id=id&accname=guest&checksum=703D9E2EE73FF7709ED65DC1214CAB14
Angelini, Viola, Anne Laferrère and Guglielmo Weber. 2013. "Home-ownership in Europe: How did it happen?" Advances in Life Course Research 18: 83-90.
Angelini, Viola, Anne Laferrère, and Gugliemo Weber. 2010. “Homeownership in Old Age at the Crossroad between Personal and National Histories.” Paper provided by Munich Center for the Economics of Aging (MEA) at the Max Planck Institute for Social Law and Social Policy in its series MEA discussion paper series with number 10216, December 2010.
Antipa, Pamfili and Rémy Lecat. 2010. „The ’housing bubble’ and financial factors: Insights from a structural model of the French and Spanish residential markets." Housing markets in Europe. A Macroeconomic Perspective (Oliver de Bandt, Thomas Knetsch, Juan Penalosa and Francesco Zollino eds.) Berlin: Springer. 161-187.
Ball, Michael. 2012. “Housing market developments in Europe.” The Appraisal Journal, Spring. 114-122.
Bank of Englang. 2013. News Release - Bank of England provides explicit guidance regarding the future conduct of monetary policy. Available at: http://www.bankofengland.co.uk/publications/Pages/news/2013/096.aspx
Bell, David and Alasdair Rutherford. 2012. ”Long-term care and the housing market.” Scottish Journal of Political Economy 59(5). November.
Bertoldi, Paolo, Bettina Hirl and Nicola Labanca. 2012. “Energy Efficiency Status Report 2012. Electricity Consumption and Efficiency Trends in the EU-27.” JRC Scientific and Policy Reports. Available at: http://iet.jrc.ec.europa.eu/energyefficiency/sites/energyefficiency/files/energy-efficiency-status-report-2012.pdf.
bfc website. 2013. „In pursuit of energy efficient minimalism. BFC on baugruppen: Proactive Jurisdictions.” Available at: http://bruteforcecollaborative.com/wordpress/category/elevating-the-discourse/page/2/ - already used from a different aspect above
Blunt, Alison and Robyn Dowling. 2012. Home. London: Routledge.
Boelens, Luuk,. Gideon Bolt, Beitske Boonstra, Jeroen Brouwer, Pieter Hooimeijer and Nadine Nonnekes. 2010. Zelfbouw In Reflectie - Evaluatie SEV-experimenten (C)PO/MO. Utrecht.
Boza-Kiss, Benigna and Enrique Grosser-Lagros. 2013. “Energy Service Companies in the EU – market description and overall trends.” Draft paper. Prepared for Proficient project.
BP. 2011. “BP Energy Outlook 2030.” Presentation. 2011 January. http://www.bp.com/liveassets/bp_internet/globalbp/globalbp_uk_english/reports_and_publications/statistical_energy_review_2008/STAGING/local_assets/2010_downloads/2030_energy_outlook_booklet.pdf

77
Brenton, Maria. 2013. “Senior cohousing communities – an alternative approach for the UK?” Paper was commissioned as part of the JRF programme on A Better Life. Available at: http://www.jrf.org.uk/sites/files/jrf/senior-cohousing-communities-full.pdf
Brown, Marylin A. 2001. „Market failures and barriers as a basis for clean energy policies.” Energy Policy 29: 1197-1207.
Buildings Performance Institute Europe (BPIE). 2011. Europe’s buildings under the microscope. A country-by-country review of the energy performance of buildings. Available at: http://www.europeanclimate.org/documents/LR_%20CbC_study.pdf
Bushnell, C. and P., McAllister. 2012. “Ownership Advantages in Cross-border Real Estate Development: Some Evidence from European real estate markets.” Working Papers in Real Estate and Planning. Hanley University of Reading.
Cambridge Retrofit. 2014. “A public forum.” Available at: http://www.cambridgeretrofit.org/blog.aspx
Capello, Roberta, Ugo Fratesi and Laura Resmini. 2011. Globalization and Regional Growth in Europe: Past Trends and Future Scenarios. Berlin-Heidelberg: Springer.
CECODHAS Housing Europe. http://www.housingeurope.eu/news/1870
CECODHAS Housing Europe’s Observatory. 2011. Housing Europe Review 2012: The nuts and bolts of European social housing systems. October. Available at: http://www.housingeurope.eu/www.housingeurope.eu/uploads/file_/HER%202012%20EN%20web2_1.pdf.
daft.ie. 2013. “The Daft.ie House Price Report. An analysis of recent trends in the Irish residential sales market.” First Quarter, 2013. Available at: http://www.daft.ie/report/Daft-House-Price-Report-Q1-2013.pdf
Deloitte. 2012. Property Index: Owerview of European Residential Markets. How do Europeans live and for how much? Available at: http://www.deloitte.com/assets/Dcom-Italy/Local%20Assets/Documents/Pubblicazioni/EN_PropertyIndex2012B.pdf
Deloitte. 2013. Property Index: Overview of the European Residential Markets. European Housing 2012. Available at: http://www.deloitte.com/assets/Dcom-Austria/Local%20Assets/Documents/Studien/Property_Index_2013_ENG_s.pdf
Durden, Tyler. 2013. Italian Housing Market Faces Ongoing Collapse. Available at: http://www.zerohedge.com/news/2013-09-12/italian-housing-market-faces-ongoing-collapse
Eiglsperger, Martin and Wim Haine, 2009. “EU housing statistics.” IFC Bulletin No 31. Available at: http://www.bis.org/ifc/publ/ifcb31j.pdf
EUbusiness. 2013. „Spain drafts EUR 2.4 bn plan for housing, construction.” Available at: http://www.eubusiness.com/news-eu/spain-economy.nru/
EurActiv.com. 2012. “Household electricity consumption reaches new high: Report.” Available at: http://www.euractiv.com/energy-efficiency/households-electricity-consumpti-news-516650
European Commission. 2012. “Quarterly Report on European Electricity Market.” Market Observatory for Energy 5(3,4). Available at: http://ec.europa.eu/energy/observatory/electricity/doc/qreem_2012_quarter3.pdf
European Environment Agency. 2012. “Household Consumption.” Available at: http://www.eea.europa.eu/themes/households/intro
Eurostat. 2010. “The comparability of imputed rent.” Methodologies and Working papers. Available at: http://epp.eurostat.ec.europa.eu/cache/ITY_OFFPUB/KS-RA-10-022/EN/KS-RA-10-022-EN.PDF
Eurostat. 2010. „The distributional impact of imputed rent in EU-SILC.” Methodologies and Working Papers.
Eurostat. 2013 Housing price statistics – house price index. Available at: http://epp.eurostat.ec.europa.eu/statistics_explained/index.php/Housing_price_statistics_-_house_price_index
Eurostat. 2013. Housing Conditions 2011. Available at: http://epp.eurostat.ec.europa.eu/statistics_explained/index.php/Housing_conditions

78
Eurostat, 2013. Population by dwelling type. Available at: http://epp.eurostat.ec.europa.eu/statistics_explained/index.php?title=File:Distribution_of_population_by_dwelling_type,_2011_(%25_of_population).png&filetimestamp=20130522183331
Eurostat, 2013. Social inclusion and living conditions 2011. Available at: http://epp.eurostat.ec.europa.eu/portal/page/portal/income_social_inclusion_living_conditions/data/database
Eurostat, 2013. Electricity price for households. Available at: Eurostat: Electricity prices for household consumers, available at: http://epp.eurostat.ec.europa.eu/statistics_explained/index.php?title=File:Electricity_prices_for_household_consumers,_2012s2,_PPS_kWh.png&filetimestamp=20130527075349
Fekete, Emese. 2012. „Kettészakadt ez a város.” Origo.hu. Available at: http://www.origo.hu/gazdasag/gazdasag-plusz/20120831-ketteszakadt-varos-lakasarak-budapesten-2012ben.html
Financial Times, 2013. „Deflating housing bubble at the heart of Netherland’s economic downturn”. Financial Times, August 15, 2013. Available at: http://www.ft.com/intl/cms/s/0/b0bc12ce-05b3-11e3-8ed5-00144feab7de.html#axzz2kMamFVmD
Fromm, Dorit. 2012. „Seeding community: collaborative housing as a strategy for social and neighbourhood repair.” Built Environment 38 (2).
Geron, Tomio. 2014. “Airbnb And The Unstoppable Rise Of The Share Economy.” Forbes. Available at: http://www.forbes.com/pictures/ehfk45edlgh/0122_sharing-williams-snapgoods_650x455-jpg/#gallerycontent
Giannakouris, Konstantinos. 2010. “Regional population projections EUROPOP2008: Most EU regions face older population profile in 2030.” Eurostat, 1/2010. Available at: http://epp.eurostat.ec.europa.eu/cache/ITY_OFFPUB/KS-SF-10-001/EN/KS-SF-10-001-EN.PDF
Global Property Guide. 2013. “Bulgaria’s Housing Market Stagnating.” Global Property Guide. Availableat: http://www.globalpropertyguide.com/Europe/Bulgaria/Price-History
Global Property Guide. 2013. “Czech Republic: housing prices are stabilizing.” Global Property Guide. Available at: http://www.globalpropertyguide.com/Europe/Czech-Republic/Price-History
Global Property Guide. 2013. “House prices in Germany are picking up.“ Global Property Guide, Germany. Available at: http://www.globalpropertyguide.com/Europe/Germany
Gottschalk, Georg, Susanne Palsig Jensen, Anja Dahl and Eigil Boll Hansen. 2000. “Study of the well being of older people in co-housing.” Presented at the Conference on Housing in the 21st Century: Fragmentation and Reorientation. 26-30 June 2000, Gävle, Sweden.
Gram-Hansen, Kristen, Run Holst Scherg and Robert S. Christensen. 2009. “One-person households: A growing challenge for sustainability and housing policy.” Paper presented at the ENHR Conference in Prague, June 28-July 1, 2009.
Gregor, Alison. 2013. „House hunting in Austria.” New York Times, January 30, 2013. Available at: http://www.nytimes.com/2013/01/31/greathomesanddestinations/real-estate-in-austria.html?pagewanted=all&_r=0
Hegedüs, József and Eszter Somogyi. 2013. „Innovatív elemek a szociális lakáspolitikában Magyarországon (Innovative elements in the Hungarian social housing policy).” Working paper, MRI. January 2013.
Hegedüs, József and Hanna Szemző. 2010. "Households' strategy in old-age: financing retirement and care in Hungary." Teorija in Praksa 47(5): 1062-1077.
Hegedüs, József. 2013. “Unorthodox” housing policy in Hungary – is there a way back to public housing?” The Future of Public Housing: Trends in the East and the West (Jie Chen, Mark Stephens, Joyce Yanyun Man eds.) Germany: Springer-Verlag GmbH.
Hirst, Eric and Marylin Brown. 1990. „Closing the efficiency gap: barriers to the efficient use of energy.” Resources, Conservation and Recycling 3(4): 267-281. http://en.wikipedia.org/wiki/Energy_efficiency_gap
79
Iacovou, Maria and Alexandra J. Skew. 2011. "Household composition across the new Europe: Where do the new Member States fit in?"Demographic Research 25 (Article 14): 465-490. August. Available at: http://www.demographic-research.org/Volumes/Vol25/14/.
IEA. 2013. “Word Energy Outlook 2013 presentation.” http://www.iea.org/multimedia/video/name,44419,en.html
Index.hu. 2013. “Most érdemes ingatlanba fektetni.” index.hu. Available at: http://index.hu/gazdasag/ingatlan/2013/08/12/fhb_lakasarindex/
Jaffe, Adam B. and Robert Stavins. 1994. „The energy-efficiency gap: What does it mean?” Energy Policy 22: 804-810.
Jarvis, Helen. 2011. „Saving space, sharing time: integrated infrastructures of daily life in cohousing.” Environment and Planning 43: 560-577.
Kemeny, Jim. 2006. „Corporatism and Housing Regimes.” Housin, Theory and Society 23(1): 1–18.
Knudsen, Camilla and Balazs Koranyi. 2013. “Norway's housing boom needs further cooling.” Reuters, September 30, 2013. Available at: http://www.reuters.com/article/2013/09/30/us-nordic-investment-norway-housing-idUSBRE98T0O220130930
Kohli, Martin and Marco Albertini. 2007. “The generational contract in the family: Explaining regime differences in financial transfers from parents to children in Europe.” Domosoc Working Paper Number 2007-24.
Lietaert, Matthieu. 2013. The growth of cohousing in Europe. Cohousing.org. Available at: http://www.cohousing.org/cm/article/europe
Malmberg, Bo. 2012. “Fertility cycles, age structure and housing demand.” Scottish Journal of Political Economy 59(5). November.
Market Observatory for Energy. 2010. “Country File, Russia.”
Market Observatory for Energy. 2011. “Key Figures.” Available at: http://ec.europa.eu/energy/observatory/countries/doc/key_figures.pdf
Marsden, Sam. 2013. Home ownership falls for first time in nearly 100 years – ONS. The Telegraph. April 19. Available at: http://www.telegraph.co.uk/property/propertynews/10006239/Home-ownership-falls-for-first-time-in-nearly-100-years-ONS.html
Milman, Danny. 2013. „Where It All Began: Cohousing in Denmark.” Cohousing.org. Available at: http://www.cohousing.org/cm/article/related_denmark
Mulder, Clara.H. and Francesco c. Billari. 2006. “Home-ownership regimes and lowest-low fertility.” Paper for the Workshop ‘Home ownership in Europe: policy and research issues’. Delft, 23-24, November 2006.
MyNewPlace blog. 2012. „How Do You Stack Up? Apartment Sizes Around the World.” MyNewPlace blog. Available at: http://localtalk.mynewplace.com/2012/02/20/how-do-you-stack-up-apartment-sizes-around-the-world/
Norris, Michelle and Nessa Winston. 2012. “Home-Ownership, Housing Regimes and Income Inequalities in Western Europe.” Gini Discussion paper 42. May.
Norris, Michelle and Patrick Shiels. 2004. Regular National Report on Housing Developments in European Countries: Synthesis Report. Available at: http://www.environ.ie/en/Publications/DevelopmentandHousing/Housing/FileDownLoad,2453,en.pdf
NuWire Investor. 2009. „Italy's Real Estate Market Expected To Slump In 2010.” NuWire Investor, October 27,
2009. Available at: http://www.nuwireinvestor.com/articles/italy-real-estate-market-expected-to-slump-in-2010-53948.aspx
NuWire Investor. 2012. “Austrian Housing Market Makes Gains.” NuWire Investor, June 21, 2012. Available at: http://www.nuwireinvestor.com/articles/austrian-housing-market-makes-gains-59385.aspx
OECD. 2011. Housing and the Economy:Policies for Renovation. Chapter from forthcoming: Economic Policy Reforms 2011, Going for Growth. Available at: http://www.oecd.org/newsroom/46917384.pdf

80
Official Journal of the European Union. 2010. “Directive 2010/31/EU Of the European Parliament and of the Council of 19 May 2010 on the energy performance of buildings.” Available at: http://eur-lex.europa.eu/LexUriServ/LexUriServ.do?uri=OJ:L:2010:153:0013:0035:EN:PDF
Official Journal of the European Union. 2012. “Directive 2012/27/EU of the European Parliament and of the Council of 25 October 2012 on energy efficiency.” Available at: http://eur-lex.europa.eu/LexUriServ/LexUriServ.do?uri=OJ:L:2012:315:0001:0056:EN:PDF
Origo.hu. 2013. “Zuhan a lakásépítési kedv.” Origo. Available at: http://vallalkozoi.negyed.hu/vnegyed/20131104-zuhan-a-lakasepitesi-kedv.html?sec-3
Origo.hu. 2013. „Százmillióért eladjuk, de a papa még leszedné a körtét.” Available at: Origo.hu.
http://www.origo.hu/gazdasag/20130815-az-autoipar-es-a-turizmus-hajtja-a-magyar-ingatlanpiac-fejlodo-szigeteit.html
Patrizia Immobilien AG. 2012. Residential Market Report Europe 2010/2011. Available at: http://www.patrizia.ag/fileadmin/Redaktion/Wohnmarkt_Europa/Wohnungsmarktbericht_Europa_2010_2011_Engl.pdf
Patrizia Immobilien AG. 2013. Residential Market Report Europe 2012/2013. Available at: http://www.patrizia.ag/fileadmin/Redaktion/Wohnmarkt_Europa/WMB_Europa_2012_2013_E.pdf
Phillips, Matt. 2013. “The world’s five largest housing bubbles: A brief, whirlwind tour.” Quartz Daily Brief, October 24, 2013. Available at: http://qz.com/139190/the-worlds-five-largest-housing-bubbles-a-brief-whirlwind-tour/
Pike Research, 2011. “Energy-Efficient Buildings: Europe.”
PR Newswire. 2013. “World Housing Market.” Available at: http://www.prnewswire.com/news-releases/world-housing-market-229861061.html
“Price developments on the EU retail markets for electricity and gas 1998 – 2011.” Available at: http://ec.europa.eu/energy/observatory/electricity/doc/analysis_retail.pdf
RICS Research. 2012. “French house prices falling, amidst struggling economy.“ Housing Review 2012. RICS Research and Global Property Guide: France. Available at: http://www.globalpropertyguide.com/Europe/france/Price-History
RICS Research. 2012. European Housing Review 2012. February.
Royal Institute for British Architects (RIBA). 2011. The case for space: The size of England’s new homes. September. Available at: http://www.architecture.com/Files/RIBAHoldings/PolicyAndInternationalRelations/HomeWise/CaseforSpace.pdf and http://localtalk.mynewplace.com/2012/02/20/how-do-you-stack-up-apartment-sizes-around-the-world/
Rybowska, Anna and Micha Schneider. 2011. Population and Social conditions. Eurostat. Available at: http://epp.eurostat.ec.europa.eu/cache/ITY_OFFPUB/KS-SF-11-004/EN/KS-SF-11-004-EN.PDF
Saryusz-Wolski, Jacek (rapporteur). 2013. “Motion for a European Parliament Resolution.” Report of February 8, 2013. Available at: http://www.europarl.europa.eu/sides/getDoc.do?pubRef=-//EP//TEXT+REPORT+A7-2013-0035+0+DOC+XML+V0//EN#_part1_def5
Schult, Christoph and Anne Seith. 2013. „Underwater: The Netherlands Falls Prey to Economic Crisis.” Der Spiegel, 14/2013, March 30. Available at: http://www.spiegel.de/international/europe/economic-crisis-hits-the-netherlands-a-891919.html
Shama, Avraham . 1983. „Energy conservation in US buildings: solving the high potential/low adoption paradox from a behavioral perspective.” Energy Policy 11: 148-167.
Skarlatos, Theopi. 2013. “Cookisto: A new Greek way of getting dinner.” BBC News Magazine. Available at: http://www.bbc.co.uk/news/magazine-24163742
Smith, Susan J. ed. 2012. International Encyclopedia of Housing and Home. Amsterdam: Elsevier.

81
Standard and Poors. 2013. Economic Research, Europe's recession is still dragging down house prices in most markets. January. .Available at: http://www.standardandpoors.com/spf/upload/Ratings_EMEA/2013-01-17_EuropesRecessionIsStillDraggingDownHousePrices.pdf
Statistics Netherlands, 2013. Press release. March 5. Available at: http://www.cbs.nl/NR/rdonlyres/36ACD625-6D36-4E2E-9710-724286D9F29E/0/PB13e017.pdf
Stratmann, Judith, Laura Weiss Ferreiro and Rumy Narayan. 2013. “Towards, Sustainability: Analysis of Collaborative Behaviour in Urban Cohousing.” MA Thesis at the School of Engineering Blekinge Institute of Technology Karlskrona. Sweden.
“Study on sustainable regeneration in suburbs - promoting social integration in deprived neighbourhoods through housing interventions by ERDF.” Ecorys, MRI, LSE 2013.
Szilágyi, Eta. 2013. „Oroszok és ukránok vásárolják fel a magyar ingatlanokat.” Napi.hu. Available at: http://www.napi.hu/ingatlan/oroszok_es_ukranok_vasaroljak_fel_a_magyar_ingatlanokat.554139.html
The Cohousing Company. 2014. “History.” Available at: http://www.cohousingco.com/history/
The Economist. 2013. „European utilities: how to lose half a trillion Euros.” The Economist, October 18.
The Economist. 2014. “Coming to an office near you.” Economist, January 18.
The Guardian 2013. “Irish house prices record annual rise for first time since 2008.” The Guardian, July 13, 2013. Available at: http://www.theguardian.com/business/2013/jul/23/irish-house-prices-annual-rise
The Journal. 2013. “Ireland has the highest fertility rate in the European Union.” Available at: http://www.thejournal.ie/ireland-fertility-rate-european-union-1117954-Oct2013/
Tosun, Dilek. 2013. „Housing needs in Europe.” CECODHAS Housing Europe Research Briefing, May. Available at: http://www.housingeurope.eu/www.housingeurope.eu/uploads/file_/CECODHAS%20Observatory%20breifing_housing%20needs%20in%20EU_2013%20(2).pdf
Tummers, Lidewij. 2011. “Intentional communities: methods for reviewing the rise of citizens’ housing initiatives in a European perspective.” Presentation held at the ENHR conference in Toulouse, in July 5-8, 2011. Available at: http://www.enhr2011.com/sites/default/files/Tummers-final-WS17.pdf
Vaasa ETT Global Energy Think Tank. 2012. “European Residential Energy Price Report.” Available at: http://www.vaasaett.com/wp-content/uploads/2012/06/European-Residential-Energy-Price-Report-2012_final.pdf
Walker, Peter 2013. "The Hunt for Safety: Real Estate Prospects in Europe and Asia." Urban Land, January 22. Available at: http://urbanland.uli.org/Articles/2013/Jan/ETEurope
Winfriedhaertel.de. 2014. “Why Berlin loves co-housing projects.” Winfried Hartel. Available at: http://www.winfriedhaertel.de/e148/e184/index_eng.html
Zemcik, Petr and Anna Zabrodska. 2012. “The varied Cycles of European Housing Markets.” Moody’s analytics, February 2012.