Embed Size (px)
Citation preview

Canberra’s Ecological Footprint
CSIRO Wildlife & Ecology Resource Futures Program Population-Development-Environment Project GPO Box 284 CANBERRA ACT 2601 Ph: +61 - 2 - 6242 1600 Fax: +61 - 2 - 6242 1555 Email: [email protected] Internet: http://www.dwe.csiro.au/research/futures Working Document 98/12: Canberra’s Ecological Footprint (Part 1) © 1998 Disclaimer You accept all risks and responsibility for losses, damages, costs and other consequences resulting directly or indirectly from using any information or material in this paper. To the maximum permitted by law, CSIRO excludes all liability to any person arising directly or indirectly from using the information in this paper.
Canberra’s Ecological Footprint
ACKNOWLEDGEMENTS
Many thanks to the following people and organisations for their help and support during this project: • Dr John Harris - Convenor of the Environmental Education Program, University of
Canberra. • The CSIRO-University Collaborative Research Grants Program and Dr Brian Walker,
Chief of CSIRO Wildlife and Ecology for supporting this collaborative research. • Environmental Education students researching separate parts of the Canberra Ecological
Footprints Project: Richard Clements, Jacek Lukaszyk, David Marsden-Ballard and Rosemary Metcalf.
• Ms Anna Petroeschevsky - Griffith University. • Staff at the Resource Futures Program, CSIRO Wildlife and Ecology, Gungahlin • Staff at the Australian Bureau of Statistics, Belconnen. • Staff at the ACT Department of Planning • Ms Lyndel Sutton

Canberra’s Ecological Footprint
CONTENTS
Executive Summary 1 PART ONE 2 Chapter 1 - Introduction 3 Chapter 2 - Pacing out the Ecological Footprint 10 PART TWO 20 Chapter 3 - Resource and Land use in Australia and the A.C.T 21 Chapter 4 - Economics and Expenditure, Australia and the A.C.T 57 PART THREE 67 Chapter 5 -Canberra’s Ecological Footprint for Food 68 Chapter 6 - Canberra’s Ecological Footprint for Housing 83 Chapter 7 - Canberra’s Ecological Footprint for Transport 97 Chapter 8 - Canberra’s Ecological Footprint for Consumer Goods 110 Chapter 9 - Canberra’s Ecological Footprint for Services 118 Chapter 10 - Canberra’s Total Ecological Footprint 132
PART FOUR 135 Chapter 11 - Assessing the Ecological Footprints Concept 136 Chapter 12 - Reducing Canberra’s Ecological Footprint 144

Canberra’s Ecological Footprint
TABLE AND FIGURES Note that for ease of reference, tables and figures are numbered consecutively together in the style used in the Australian Bureau of Statistics’ Environment Publications. 1.1 Initial Research Reports on Canberra’s Ecological Footprint 1.2 The Place Needs Some Work - But How to Fix It? 1.3 The Ecological Footprint of Canberra Extends Far Beyond the City Boundary 2.1 The Five Types of Daily Consumption 2.2 The Ecological Footprints Land Consumption Categories 2.3 The Ecological Footprints Matrix 2.4 Steps to Estimating the Ecological Footprint 2.5 Change in the Ecological Footprint and Available Land During this Century 2.6 The Individual Earthshare - How Much Nature is There per Global Citizen? 2.7 The Ecological Footprint of Nations 2.8 Ecological Footprint of Australia (Preliminary Estimate), by State/Territory, 1991 2.9 Calculating Embodied Energy, Using Energy Intensity Data. 2.10 Outline of the Presentation of Data and Calculations in this Report 3.1 Summary of Resource and Land Use in Australia and the A.C.T, 1993/94 3.2 Land Use in Australia, 1993/94 3.3 Land Use in the Australian Capital Territory 3.4 Canberra’s Planned Land Use Categories 3.5 Estimated Proportions of Urban Land Use (%),Canberra, 1993 3.6 Planned Public Open Space, Canberra 3.7 Types of Housing, Canberra 1993/94 3.8 Selected Transport Data, Australia and ACT 3.9 Average Waste Produced (per person), Sydney, 1990 3.10 Measured Waste to Landfill and Recycling, Canberra, 1993/94 3.11 Landfill Sites, Canberra 3.12 Estimating Canberra’s Total Waste 1993/94 3.13 Agricultural Land Use, Australia, 1993/94 3.14 Area of Crops (ha) in Australia, 1994 3.15 Area of Grain Crops (ha), Australia, 1993/94 3.16 Grain Crops - Production, Area and Yields for 1993/94 3.17 Area of Fruit Crops (ha), Australia, 1993/94 3.18 Fruit Crops - Production, Area and Yields for 1993/94 3.19 Area of Vegetable Crops (ha), Australia, 1993/94 3.20 Vegetable Crops - Production, Area and Yields for 1993/94 3.21 Area of Other Food and Feed Crops (ha), Australia, 1993/94 3.22 Other Food Crops - Production, Area and Yields for 1993/94 3.23 Non Food Crops - Production, Area and Yields for 1993/94 3.24 Livestock Numbers, Australia, 1993/94 3.25 Meat and Meat Products - Production and Yields for 1993/94 3.26 Dairy Products & Eggs- Production and Yields for 1993/94 3.27 Ecological Differences Between Natural and Agricultural Systems 3.28 Estimate of Land Degradation, Australia, March 1993 3.29 Change in Forested Land Area (‘000 ha) Australia, 1788-1990 3.30 Sectors of the Australian Forest Industry 3.31 Production and Consumption of Forest Products, Australia, 1993/94 3.32 Forest Land Use, Australia, 1993/94 3.33 Australia’s Energy Consumption for 1993/94 3.34 Australia’s Energy Production and Consumption, 1993/94 3.35 Estimated Annual Energy Land Consumption, Australia, 1993/94 3.36 Comparison of Residential Energy Consumption, ACT and Australia 3.37 Estimated Electricity Consumption, ACT, 1993
Canberra’s Ecological Footprint
3.38 Estimated Gas Consumption, ACT, 1993 3.39 Estimated Transport Fuel Energy Consumption, Canberra, 1993/94 4.1 The Ecological Footprints Land Types 4.2 The Australian Economy - Layers of the Cake 4.3 Gross State Product (%) by Industry, Australia and A.C.T, 1993/94 4.4 Imports and Exports, Canberra 1993/94 4.5 Employment by Industry, A.C.T, August 1994 4.6 Average Annual Income and Expenditure, Australian States/Territories, 1993/94 4.7 Average Annual Expenditure (per person) Canberra and Australia, 1993/94 4.8 Detailed Average Annual Expenditure and Income (per person), Australian States and Territories,
1993/94 4.9 Total Public Sector Expenditure, Australia, 1993/94 4.10 Average Annual Consumption of Energy and Expenditure, per person, Australia, 1993/94 5.1 The Ecological Footprint Land Types used for Food in the ACT 5.2 Average Food Consumption (kg per person), Australia, 1993/94 5.3 Average Expenditure on Food, Australia and Canberra 1993/94 5.4 Annual Expenditure on Takeaway and Restaurant Food, Canberra and Australia, 1993/94 5.5 The Ecological Footprint for Land Degraded for Food, Canberra, 1993/94 5.6 Estimated Ecological Footprint for Grains, Canberra, 1993/94 5.7 Estimated Ecological Footprint for Fruit, Canberra, 1993/94 5.8 Estimated Ecological Footprint for Vegetables, Canberra, 1993/94 5.9 Estimated Ecological Footprint for Other Foods, Canberra, 1993/94 5.10 Estimated Ecological Footprint for Beverages, Canberra, 1993/94 5.11 Estimated Ecological Footprint for Crop Lands Used for Food, Canberra, 1993/94 5.12 Estimated Ecological Footprint for Meat and Meat Products, Canberra, 1993/94 5.13 Estimated Ecological Footprint for Poultry and Eggs, Canberra, 1993/94 5.14 Estimated Ecological Footprint for Dairy Products, Canberra, 1993/94 5.15 Estimated Ecological Footprint for Grazing Lands, Canberra, 1993/94 5.16 The Ecological Footprint for Forest Land Used for Packaging, Canberra, 1993/94 5.17 Estimated Embodied Energy in Agricultural Chemicals, Australia, 1993/94 5.18 Estimated Embodied Energy in Food, Australia, 1993/94 5.19 Estimated Ecological Footprint for Food (per person), Canberra, 1993/94 6.1 The Ecological Footprint Land Types used for Housing in the ACT 6.2 Area Covered by Houses and Associated Buildings 6.3 The Ecological Footprint for Land Consumed by Housing, Canberra, 1993/94 6.4 Ecological Footprint for Garden Land, Canberra, 1993/94 6.5 Estimated Amount of Timber Used in Canberra Housing 6.6 Estimated Ecological Footprint for Forest Land, Canberra, 1993 6.7 Estimated Residential Operating Energy Consumption, ACT, 1993 6.8 Residential Energy Consumption, Canberra 6.9 The Gross Energy Requirements (GER) of Building Components 6.10 Use of Construction Materials in ACT Housing 1983-1992 6.11 The Gross Energy Requirements (GER) of Housing Components 6.12 GER of Housing Fitout Components 6.13 Estimate of the Energy Embodied in Housing, ACT 6.14 Estimated Energy Embodied in Housing Construction, ACT 6.15 Estimated Total Embodied Energy in Housing, ACT 6.16 Estimated Ecological Footprint (per person) for Canberra Housing 7.1 The Ecological Footprint Land Types used for Transport in the ACT 7.2 Area Consumed by Transport Infrastructure, Canberra, 1993/94 7.3 The Transport Components of Energy Land 7.4 Energy Conversion Factors for Liquid Fuels 7.5 Fuels and Energy Used for Road Transport, Canberra, 1993
Canberra’s Ecological Footprint
7.6 Fuel Energy Used in Air Transport, Australia, 1993/94 7.7 Transport Fuel Energy Consumption, ACT, 1993/94 7.8 Estimates of Embodied Energy (Gj) in Raw Materials (kg) - Medium European Car 7.9 Estimate of Energy Embodied in the Canberra Motor Vehicle Fleet, 1993 7.10 Estimate of Energy Embodied in the Canberra Motor Vehicle Fleet, 1993 7.11 Estimate of Total Energy Embodied Energy in Motor Vehicles 7.12 Embodied Energy in Construction of Transport Infrastructure, Canberra 7.13 Estimated Total Energy Embodied in Transport Infrastructure. 7.14 Estimated Ecological Footprint for Energy Land, Canberra, 1993/94 7.15 Estimated Ecological Footprint (per person) for Transport, ACT, 1993/94 8.1 The Ecological Footprint Land Types used for Consumer Goods in the ACT 8.2 Estimate of Land Consumed by Waste Disposal, Canberra, 1993/94 8.3 Estimated Ecological Footprint for Crop and Grazing Land for Consumer Goods, Canberra, 1993/94 8.4 Calculating Embodied Energy, Using Energy Intensity Data 8.5 Public and Private Expenditure on Consumer Goods, Canberra, 1993/94 8.6 Estimated Energy Embodied in Consumer Goods, Canberra, 1993/94 8.7 Estimated Ecological Footprint for Consumer Goods 9.1 The Ecological Footprint Land Types used for Services in the ACT 9.2 Estimate of Land Consumed by Commercial and Public Buildings, Canberra, 1993/94 9.3 Estimate of Garden Land Used for Services, Canberra, 1993/94 9.4 Energy Used for the Operation of Commercial and Public Buildings, ACT, 1993 9.5 GER for Commercial and Public Buildings in the ACT 9.6 Energy Used in Construction of Commercial and Public Buildings , Canberra 9.7 Total Energy Embodied in Commercial and Public Buildings, Canberra (Gj) 9.8 Calculating Embodied Energy, Using Energy Intensity Data 9. 9 Public and Private Expenditure on Services, Canberra, 1993/94 9.10 Ecological Footprint (per person) for Energy Embodied in Services, Canberra, 1993/94 9.11 Estimated Ecological Footprint (per person) for Services, Canberra, 1993/94 10.1 Canberra’s Ecological Footprint 10.2 Canberra’s Ecological Footprint (ha), per person, 1993/94 10.3 Canberra’s Ecological Footprint Measured in Houseblocks 11.1 Wealth Distribution Across the Australian Population 11.2 Weekly Household Expenditure by Quintile, Canberra, 1993/94 11.3 Weekly Household Expenditure by Quintile, Canberra, 1993/94 11.4 Comparison of Weekly Household Expenditure by Highest Group (Q5), with Lowest Group (Q1),
Canberra, 1993/94 11.5 Proportional Expenditure for the Highest (Q5) Group, Canberra, 1993/94 11.6 Proportional Expenditure of the Lowest (Q1) Group, Canberra, 1993/94 12.1 The Sectors of Society Interlink Like a Celtic Knot 12.2 Our Changing View of the Economy, Nature and Society 12.3 Manufacturing and Design Questions 12.4 Questions to Ask Before Buying a New Consumer Item. 12.5 Some Ways to Reduce Our Ecological Footprint
Canberra’s Ecological Footprint
1
EXECUTIVE SUMMARY An ecological footprint is the per person area of land required to supply the goods and services that sustain our everyday life and lifestyle. It is defined as the amount of land in six categories (crop, grazing, garden, consumed, forest and energy land) required to provide our requirements for food, housing, transport, consumer goods and services. An approximation of the ecological footprint for Canberra is about 4.44 hectares (that is, nearly 58 average sized Canberra houseblocks) per person. The components of this area are shown in the table below. Category FOOD
HOUSING
TRANSPORT
CONSUMER GOODS
SERVICES
TOTAL
=
Hectares
1.39
0.35
0.77
0.67
1.26
4.44
House Blocks
18.1
4.7
10.0
8.7
16.3
57.8
This study’s estimate of Canberra’s ecological footprint is consistent with the results of other studies being conducted in Australia, particularly those by Griffith University in Brisbane. In world terms, Australia is among the countries with higher per person ecological footprints, including USA and Canada. Each one of us with a modern day lifestyle needs 4-5 ha of ecologically productive land to supply our food, living space and built environment and to assimilate our wastes. This is equivalent to more than 50 average sized housing blocks per person. Such is the size of our dependence on land that is remote from where we live our daily lives. It has been estimated by the originators of the ecological footprints concept, William Rees and Mathis Wackernagel, that the average amount of land area available for each world citizen is about 1.5 ha per person. There are many ways that the ecological footprint methodology can be made more appropriate and more accurate. However, making improvements in the calculation methods will not change the blindingly obvious fact that the size of our current ecological footprint means that we are consuming more than can be sustained in the long term. This is the first part of an ongoing study being undertaken as a Masters Degree by one of the authors and by the CSIRO Resource Futures Program. The next stage will take the ecological footprint concept out to community groups in Canberra and explore the use of the concept in education, and in changing the behaviour and attitudes of ordinary Canberra citizens in respect to levels and types of consumption. It is intended that this report be used to convey the measuring of the ecological footprint to as wide an audience as possible. This has led to the use of a “non-academic” style and the inclusion of many graphics and tables.
Canberra’s Ecological Footprint
2
PART ONE
INTRODUCING CANBERRA’S ECOLOGICAL FOOTPRINT
This part of the report includes the following chapters:
1. INTRODUCTION
Introduction - Overview of the ecological footprint concept and of the Canberra project.
2. MEASUREMENT How the ecological footprint is estimated.

Canberra’s Ecological Footprint
3
1. INTRODUCTION The Canberra Ecological Footprint1 Project At every level, from the individual to the global, we all use energy and natural resources in our daily lives. One way to measure just how much we use, and to begin to get an idea of how “sustainably” we are living, is by measuring how much land is required to produce our ongoing requirements. This land area is called our ecological footprint. This report estimates the ecological footprint for Canberra - for the city itself and for an “average” citizen, and shows how the ecological footprint was calculated. It is intended to be the foundation document for workshops sessions with community groups in Canberra to discuss our level of consumption and to explore ways we can reduce it. This report is presented in 12 chapters grouped into four parts: PART 1 Chapter 1 - Introduction to the ecological footprint concept and the Canberra
project. Chapter 2 - How is an ecological footprint measured?
PART 2 Chapter 3 - A summary of resource use in Australia and the ACT Chapter 4 - An overview of relevant economic data for Australia and the ACT from the perspective of calculating the ecological footprint
PART 3 Chapters 5-9 - The calculations of Canberra’s ecological footprint using five categories of consumption - food, housing, transport, consumer goods, services. Chapter 10 - A matrix which brings these calculations together into the total ecological footprint for Canberra.
PART 4 Chapter 11 - A look at some of the assumptions used in this report, the idea of an “average” ecological footprint, and some of the difficulties and potentials inherent in the ecological footprints concept. Chapter 12 - Some suggestions on how we can reduce our ecological footprint.
Goods Housing
Transport Services
Food
Canberra’s Ecological Footprint
4
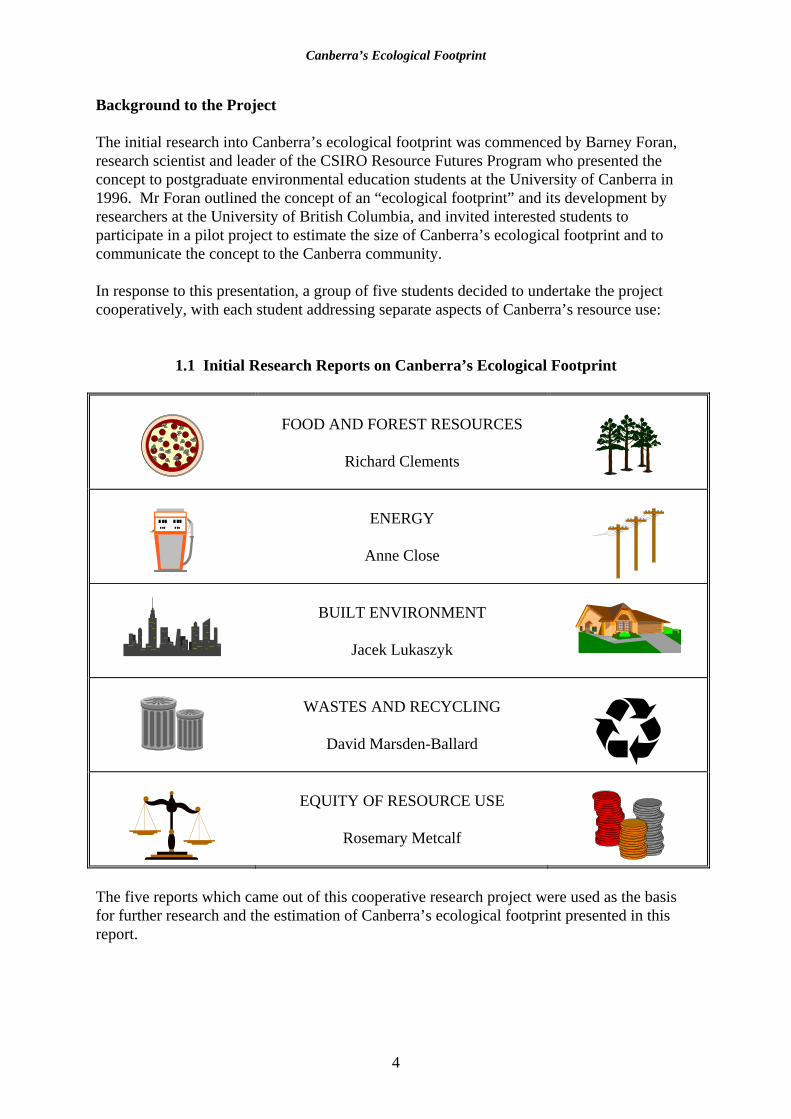
Background to the Project The initial research into Canberra’s ecological footprint was commenced by Barney Foran, research scientist and leader of the CSIRO Resource Futures Program who presented the concept to postgraduate environmental education students at the University of Canberra in 1996. Mr Foran outlined the concept of an “ecological footprint” and its development by researchers at the University of British Columbia, and invited interested students to participate in a pilot project to estimate the size of Canberra’s ecological footprint and to communicate the concept to the Canberra community. In response to this presentation, a group of five students decided to undertake the project cooperatively, with each student addressing separate aspects of Canberra’s resource use:
1.1 Initial Research Reports on Canberra’s Ecological Footprint
FOOD AND FOREST RESOURCES
Richard Clements
ENERGY
Anne Close
BUILT ENVIRONMENT
Jacek Lukaszyk
WASTES AND RECYCLING
David Marsden-Ballard
EQUITY OF RESOURCE USE
Rosemary Metcalf
The five reports which came out of this cooperative research project were used as the basis for further research and the estimation of Canberra’s ecological footprint presented in this report.

Canberra’s Ecological Footprint
5
Our Use of Nature - Is it Sustainable? Have you ever wondered how much we rely on nature to survive, and how much of the Earth is needed to keep each of us in the manner to which we have become accustomed, or to which we aspire? Its easy to see our farming and hunting ancestors as completely dependent on nature, but surely these days we have developed a more independent and sophisticated stage of civilisation. For those of us who live in cities, consuming commodities from all over the world and occasionally venturing to the countryside for recreation, its easy to feel that nature is something “out there”. However, from an ecological viewpoint:
We are not just connected to nature, we are nature - as we eat, drink and breathe, we constantly exchange energy and matter with our environment. The human body is continuously wearing out and rebuilding itself - in fact, we replace almost all the molecules in our bodies about once a year. The atoms of which we are made have already been part of many other living beings. Particles of us once roamed about in a dinosaur, and some of us may well carry an atom of Caesar or Cleopatra2.
Although it may seem that in our highly technological and industrial society we are further away from dependence on nature than our forebears, in fact the reverse is true - our per capita consumption is much larger now than at any stage of history - and all the resources and energy we use (including food, housing, clothes, cars, videos and computers) come ultimately from nature. As our consumption of nature increases, through increased agriculture, fishing, industry, commerce, so does our impact on the world’s ecosystems and hence other species. The more humans use, the less there is for others. Scientists3 have estimated that the extent of our ongoing impact on the Earth is substantial and growing: • our activities have transformed between one-third and one-half of the land surface; • our industrial processes have altered the atmosphere - CO2 concentration has increased by
nearly 30% since the beginning of the industrial revolution - less than 200 hundred years; • we use more than half of all accessible surface fresh water; • our changes to wildlife habitat have led to the extinction of one-quarter of bird species;
and • we have transformed or destroyed half the world’s mangrove areas - valuable nurseries for
marine species.

Canberra’s Ecological Footprint
6
The rapid growth in global population and the increase in industrial development and consumption which follow, use more and more space and resources. A graphic view of our situation is described in Natural Capital and Human Economic Survival:
The Earth was once a cavernous mansion where the human family, relatively few in number, lived for many millennia without causing too much harm or running short of space or supplies. Now we have occupied every available bedroom and have even begun to fill up the less congenial niches, even the cellar and the broom closets. The floors are sagging in places, the cistern sometimes runs dry and the lights flicker now and then. The place needs some work.4
However, despite the widespread acknowledgement that “the place needs some work”, there is confusion and disagreement about what this work should be. The concept of sustainability - that we live within the available resources equitably, leaving sufficient for future generations, while maintaining ecological integrity - has intuitive appeal but goes against the grain of prevailing economic theory which places its reliance for everything good and healthy on continual growth and development. Reconciliation of these seeming opposites, growth and sustainability, is being sought by the notion of “sustainable development”. However, the essential tension between these two concepts has led to confusion about what “sustainable development” is, and a range of meanings including those almost diametrically opposed has emerged. To ecologists it means development within what is sustainable by the Earth’s biosphere; to business executives it means sustaining the current level of business activity and often, sustaining growth; to those concerned with global equity it means ensuring that the Earth’s poor have a chance to achieve a reasonable standard of living; to others it means achieving a level of resource consumption which can be sustained into the future so that following generations are not disadvantaged.
1.2 The Place Needs Some Work - But How to Fix It?
Faster growth!
Slower growth! Conserve resources!
Protect wilderness!
Business as usual!
No growth! Spend, spend spend!
Feed the poor!
Canberra’s Ecological Footprint
7
The difficulty in finding common ground among these conflicting views has led to a paralysis in decision making which in turn has meant that to some extent “sustaining business as usual” has become the popular interpretation of the term “sustainable development”. The first Australian State of the Environment Report defines the term thus:
Sustainable development is arguably the central issue of our time. Its basic aim is to meet the needs of the present without compromising the ability of future generations to meet their own needs.5
The report goes on to identify three key areas of the environment which need to be maintained in order to ensure sustainability: • biodiversity - the variety of species, populations, habitats and ecosystems; • ecological integrity- the general health and resilience of natural life-support systems,
including their ability to assimilate wastes and withstand stresses such as climate change and ozone depletion; and
• natural capital - the stock of productive soil, fresh water, forests, clean air, ocean and other
renewable resources that underpin the survival, health and prosperity of human communities.
In Australia, as elsewhere, although we recognise the need to protect and maintain our environment, policies to ensure that this will happen are often slow in coming. Part of the global delay in developing and implementing policies which will improve our long term survival lies in our perception and understanding of the extent of our impact on the planet. If measuring the human impact on natural ecosystems is difficult, then interpreting and communicating the significance of our impact in such a way that people feel able to make constructive changes is an enormous challenge:
There is no blueprint for a sustainable society waiting to be discovered. The problem itself changes over time as the result of economic-environmental linkages, and their repercussions in human societies. In so far as there is any solution to the sustainability problem, it is successful adaptation to changing circumstances.6
One of the adaptations which we urgently need, is the will and ability to use the vast range of data and information we do have to make constructive decisions for the future. The ecological footprint concept is an attempt to use existing consumption data in a way that can be seen as measuring sustainability.

Canberra’s Ecological Footprint
8
Stepping Towards Sustainability with Ecological Footprints
If we cannot measure, we cannot manage. To make sustainability a reality, we must know where we are now, and how far we need to go.7
The ecological footprints concept, developed by Canadian researchers Mathis Wackernagel and William Rees, is based on the idea that for every item of our resource and energy consumption, we use a certain amount of land area. When we think about a city, for example, Canberra, we know that the land area used by the city is much greater than its physical dimensions. Canberra’s inhabitants could not survive without the land needed to grow food crops and forest products, gather water, provide the raw materials and energy for consumer goods, and absorb wastes. This wider area is the city’s ecological footprint.
1.3 The Ecological Footprint of Canberra Extends Far Beyond the City Boundary
The ecological footprint uses the ecological concept of “carrying capacity” - where ecologists look at, for example, a nature reserve of a given size and try to estimate how many animals of a particular species, perhaps koalas, could live in this area. They may find that the carrying capacity of the nature reserve is 20 koalas. This figure will of course depend on many factors, including size of the reserve, vegetation cover, climate, level of disturbance, presence or absence of other species, etc. The ecological footprint is a way to measure our actual consumption, to compare this consumption with that of other communities and with what is available in nature. This measurement of carrying capacity in reverse is known as “appropriated carrying capacity”. Knowing how much land we “appropriate” can assist us in making positive choices towards treading more lightly on the Earth, and hence moving towards sustainability.
Canberra’s Ecological Footprint
9
The size of a city’s ecological footprint is not fixed but is dependent on money income, prevailing values and the state of technology. The ecological footprint of a given population is the amount of land used exclusively by that population. Once measured an ecological footprint can be used to:
• compare the impact of different cities or populations on a per capita basis to reveal the effects of different technologies, values and lifestyles, including equity of resource use;
• compare the size of an individual’s footprint with the current fair Earthshare of land for each person - the amount of ecologically production land available per person on Earth;
• measure the change in impact (footprint size) due to different ways of doing things, such as introducing energy efficiency measures, appropriate technologies, developing new social attitudes to consumption and waste. References and Notes 1. The ecological footprint concept is outlined in: Wackernagel, M and Rees, W (1996) Our
Ecological Footprint: Reducing Human Impact on the Earth. New Society Publishers. Philadelphia.
2. Wackernagel, M and Rees, W (1996) Our Ecological Footprint: Reducing Human Impact on the Earth. New Society Publishers. Philadelphia.
3. Vitousek PM, Mooney HA, Lubcenco J, Melillo JM (1997) “Human Domination of Earth’s Ecosystems” in Science Vol 277 25 July 1997. www.sciencemag.org
4. Prugh, T (1995) Natural Capital and Human Economic Survival. International Society for Ecological Economics. Solomons, MD. Page 16.
5. State of the Environment Advisory Council (1996) State of the Environment. Australia. CSIRO Publishing. Collingwood. Page 5
6. Common, M (1995) Sustainability and Policy. Limits to Economics. Cambridge University. London. Page 6.
7. Wackernagel M (1997) Ecological Footprints of Nations. Earth Council. New Mexico. www.ecouncil.ac.cr.

Canberra’s Ecological Footprint
10
8.
2. PACING OUT OUR ECOLOGICAL FOOTPRINT We can measure the ecological footprint of an individual, a household, a city, a country, or even the whole of humanity by calculating how much land we use to support our current way of life. This chapter includes: • an overview of how the ecological footprint is measured; • some examples of projects at the global, national and local levels; and • an outline of how the ecological footprint for Canberra was calculated. Measuring the Ecological Footprint Although it would be extremely difficult to measure the exact land area required to produce every item of our consumption, we can start by making estimates within the five main categories of daily consumption. These are shown in 2.1 below.
2.1 The Five Types of Daily Consumption
FOOD
HOUSING
TRANSPORT
CONSUMER GOODS
SERVICES
Within each of these areas of consumption, different types of land are used. To give an example, consider the different types of productive land area needed to produce our food and deliver it to the local supermarket - we use cropland for fruits, vegetables and grains, grazing land for meat products, forests for packaging materials. We also use considerable amounts of energy to produce our food - for the operation of farm machinery, production of fertilisers and pesticides, and for food transportation. In the process of producing and consuming food we also degrade land - eg, through soil erosion and salinisation and the landfill space used for food wastes. We can estimate how much land is used from each of the major land use types shown in the following table and sum these together to give a total food footprint.

Canberra’s Ecological Footprint
11
2.2 The Ecological Footprint Land Consumption Categories
CONSUMED LAND
This includes land that has been built over by cities, roads and infrastructure; and land that is degraded through pollution, soil loss and salinity. It is called “consumed” because it is no longer biologically productive. Built over land is often located in the most fertile areas, leading to the loss of potential arable land.
GARDEN LAND
This land includes our private gardens as well as sports grounds and open space used for recreation and visual amenity in urban areas. It is “reversibly built” land because it could potentially be used for other uses, eg. forestry or food growing.
CROP LAND
The land which supports crops which provide us with food and fibres, including fruit and vegetables , sugar, cotton, - this is land which is usually highly productive, with good soils and climate.
GRAZING LAND
The grazing land for cattle, sheep and other animals. This land is usually less productive than arable land, often in drier areas, it can sometimes be shared with wildlife.
FOREST LAND
Farmed or natural forests that can yield timber products, while also preventing erosion, providing climate stability, maintaining hydrological regimes, and if properly managed, protecting biodiversity.
ENERGY LAND
We need to include the energy we use into the ecological footprint because we are rapidly using the stored energy produced by photosynthesis over millions of years and releasing CO2 into the atmosphere in quantities which may be altering the Earth’s climate. Energy land should be reserved for growing forest or any plant cover which has a high capacity to absorb this CO2. Another way to calculate energy land is to estimate the land required to cultivate crops for biomass energy production. One measure is an hectare of land per year for every 100 gigajoules of energy we use.

Canberra’s Ecological Footprint
12
The Ecological Footprint Matrix To work out our total ecological footprint we need to measure how much land from each of the land use types shown above is used for each of the above basic consumption categories: food, housing, transport, consumer goods and services. Each cell in the ecological footprints matrix shown below includes land which has been used for various purposes, some directly observable like the land “consumed” by building a house on it, others more distant, like the energy used to manufacture fertilisers for food production.
2.3 The Ecological Footprint Matrix LAND TYPE
FOOD
HOUSING
TRANSPORT
CONSUMER GOODS
SERVICES
CONSUMED Soil erosion, salinity, landfill
Land built over by houses
Roads, pavements, bike paths.
Landfill, polluted sites
Built over for community centres, etc
GARDEN Private gardens
Urban open space & sports fields
CROPS Food crops eg fruit, vegs, grains
Non-food crops eg. cotton, tobacco
GRAZING Grazing land for meat and dairy
Grazing land for wool production
FOREST Food packaging
Construction materials
Packaging and production.
Paper -advertising, banking, etc
ENERGY Energy for machinery, fertilisers, etc
Energy for building materials, heating, etc
Energy to make & fuel vehicles and roads
Energy to produce goods
Energy to produce services
Once the major components of the matrix have been identified, the ecological footprint can be estimated, using the following steps:
2.4 Steps to Estimating the Ecological Footprint
• Estimate the amounts of resources and energy consumed by the city’s inhabitants within the five categories: food, housing, transport, consumer goods and services.
• Estimate the amount of land required within each of the land categories shown above for
each of the commodities consumed. • Divide the total consumption by the population size to give the average per person
ecological footprint.
Canberra’s Ecological Footprint
13
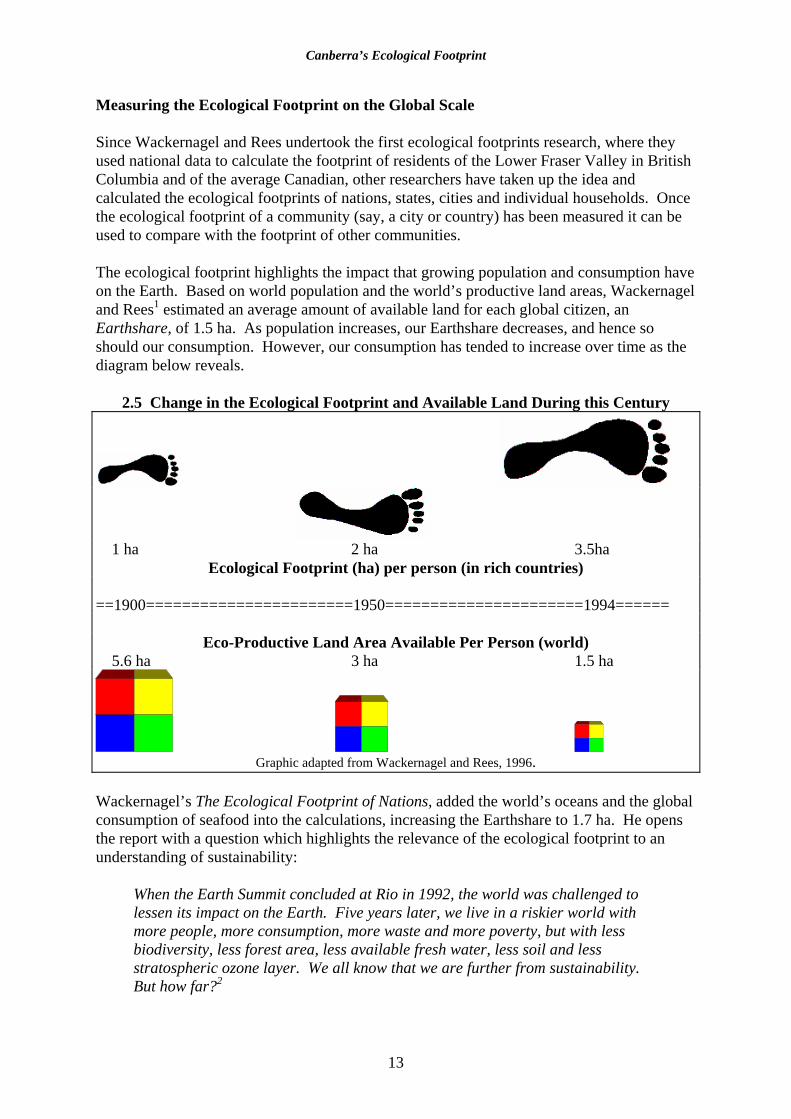
Measuring the Ecological Footprint on the Global Scale Since Wackernagel and Rees undertook the first ecological footprints research, where they used national data to calculate the footprint of residents of the Lower Fraser Valley in British Columbia and of the average Canadian, other researchers have taken up the idea and calculated the ecological footprints of nations, states, cities and individual households. Once the ecological footprint of a community (say, a city or country) has been measured it can be used to compare with the footprint of other communities. The ecological footprint highlights the impact that growing population and consumption have on the Earth. Based on world population and the world’s productive land areas, Wackernagel and Rees1 estimated an average amount of available land for each global citizen, an Earthshare, of 1.5 ha. As population increases, our Earthshare decreases, and hence so should our consumption. However, our consumption has tended to increase over time as the diagram below reveals.
2.5 Change in the Ecological Footprint and Available Land During this Century
1 ha 2 ha 3.5ha
Ecological Footprint (ha) per person (in rich countries)
==1900=======================1950======================1994======
Eco-Productive Land Area Available Per Person (world) 5.6 ha 3 ha 1.5 ha
Graphic adapted from Wackernagel and Rees, 1996.
Wackernagel’s The Ecological Footprint of Nations, added the world’s oceans and the global consumption of seafood into the calculations, increasing the Earthshare to 1.7 ha. He opens the report with a question which highlights the relevance of the ecological footprint to an understanding of sustainability:
When the Earth Summit concluded at Rio in 1992, the world was challenged to lessen its impact on the Earth. Five years later, we live in a riskier world with more people, more consumption, more waste and more poverty, but with less biodiversity, less forest area, less available fresh water, less soil and less stratospheric ozone layer. We all know that we are further from sustainability. But how far?2
Canberra’s Ecological Footprint
14
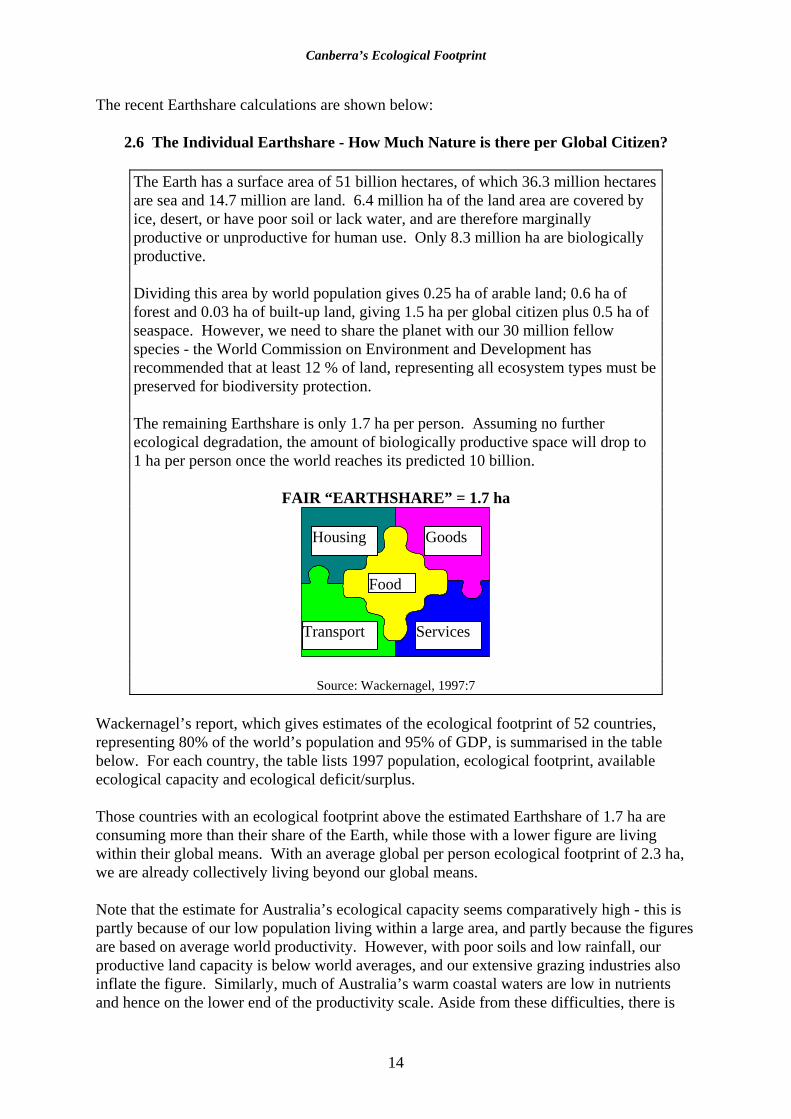
The recent Earthshare calculations are shown below:
2.6 The Individual Earthshare - How Much Nature is there per Global Citizen?
The Earth has a surface area of 51 billion hectares, of which 36.3 million hectares are sea and 14.7 million are land. 6.4 million ha of the land area are covered by ice, desert, or have poor soil or lack water, and are therefore marginally productive or unproductive for human use. Only 8.3 million ha are biologically productive. Dividing this area by world population gives 0.25 ha of arable land; 0.6 ha of forest and 0.03 ha of built-up land, giving 1.5 ha per global citizen plus 0.5 ha of seaspace. However, we need to share the planet with our 30 million fellow species - the World Commission on Environment and Development has recommended that at least 12 % of land, representing all ecosystem types must be preserved for biodiversity protection. The remaining Earthshare is only 1.7 ha per person. Assuming no further ecological degradation, the amount of biologically productive space will drop to 1 ha per person once the world reaches its predicted 10 billion.
FAIR “EARTHSHARE” = 1.7 ha
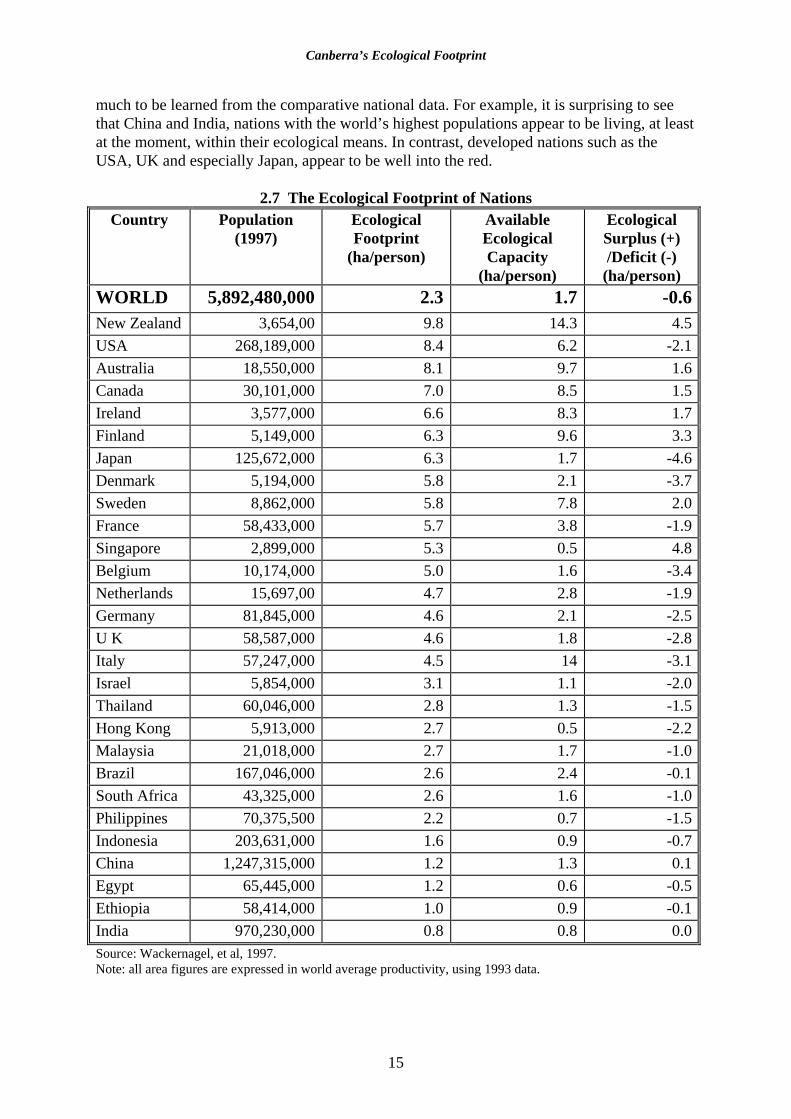
Source: Wackernagel, 1997:7 Wackernagel’s report, which gives estimates of the ecological footprint of 52 countries, representing 80% of the world’s population and 95% of GDP, is summarised in the table below. For each country, the table lists 1997 population, ecological footprint, available ecological capacity and ecological deficit/surplus. Those countries with an ecological footprint above the estimated Earthshare of 1.7 ha are consuming more than their share of the Earth, while those with a lower figure are living within their global means. With an average global per person ecological footprint of 2.3 ha, we are already collectively living beyond our global means. Note that the estimate for Australia’s ecological capacity seems comparatively high - this is partly because of our low population living within a large area, and partly because the figures are based on average world productivity. However, with poor soils and low rainfall, our productive land capacity is below world averages, and our extensive grazing industries also inflate the figure. Similarly, much of Australia’s warm coastal waters are low in nutrients and hence on the lower end of the productivity scale. Aside from these difficulties, there is
Goods Housing
Transport Services
Food
Canberra’s Ecological Footprint
15
much to be learned from the comparative national data. For example, it is surprising to see that China and India, nations with the world’s highest populations appear to be living, at least at the moment, within their ecological means. In contrast, developed nations such as the USA, UK and especially Japan, appear to be well into the red.
2.7 The Ecological Footprint of Nations Country Population
(1997) Ecological Footprint
(ha/person)
Available Ecological Capacity
(ha/person)
Ecological Surplus (+) /Deficit (-)
(ha/person) WORLD 5,892,480,000 2.3 1.7 -0.6New Zealand 3,654,00 9.8 14.3 4.5USA 268,189,000 8.4 6.2 -2.1Australia 18,550,000 8.1 9.7 1.6Canada 30,101,000 7.0 8.5 1.5Ireland 3,577,000 6.6 8.3 1.7Finland 5,149,000 6.3 9.6 3.3Japan 125,672,000 6.3 1.7 -4.6Denmark 5,194,000 5.8 2.1 -3.7Sweden 8,862,000 5.8 7.8 2.0France 58,433,000 5.7 3.8 -1.9Singapore 2,899,000 5.3 0.5 4.8Belgium 10,174,000 5.0 1.6 -3.4Netherlands 15,697,00 4.7 2.8 -1.9Germany 81,845,000 4.6 2.1 -2.5U K 58,587,000 4.6 1.8 -2.8Italy 57,247,000 4.5 14 -3.1Israel 5,854,000 3.1 1.1 -2.0Thailand 60,046,000 2.8 1.3 -1.5Hong Kong 5,913,000 2.7 0.5 -2.2Malaysia 21,018,000 2.7 1.7 -1.0Brazil 167,046,000 2.6 2.4 -0.1South Africa 43,325,000 2.6 1.6 -1.0Philippines 70,375,500 2.2 0.7 -1.5Indonesia 203,631,000 1.6 0.9 -0.7China 1,247,315,000 1.2 1.3 0.1Egypt 65,445,000 1.2 0.6 -0.5Ethiopia 58,414,000 1.0 0.9 -0.1India 970,230,000 0.8 0.8 0.0Source: Wackernagel, et al, 1997. Note: all area figures are expressed in world average productivity, using 1993 data.

Canberra’s Ecological Footprint
16
Measuring Australia’s Ecological Footprint Researching the ecological footprint of individual nations, cities and households is being undertaken by groups around the world. In Australia, a group at Griffith University3 has been calculating the ecological footprint of the south-east region of Queensland, one of the fastest growing areas in Australia - and for Australia as a whole. A preliminary estimate for the ecological footprint for an average Australian is about 4.5 ha. State averages ranged from 4.23 ha in New South Wales to 4.95 ha in the Northern Territory as shown in the table below. 2.8 Ecological Footprint of Australia (Preliminary Estimate), by State/Territory, 1991
(average hectares/per person) STATE DEGR GARDEN CROPS GRAZING FOREST ENERGY TOTAL
NSW 0.08 0.02 0.48 1.71 0.55 1.42 4.23VIC 0.08 0.02 0.48 1.71 0.53 1.90 4.71QLD 0.11 0.02 0.48 1.71 0.52 1.61 4.44SA 0.09 0.02 0.48 1.71 0.49 1.55 4.33WA 0.12 0.02 0.48 1.71 0.47 1.82 4.61TAS 0.10 0.02 0.48 1.71 1.07 0.96 4.33NT 0.17 0.02 0.48 1.71 0.25 2.33 4.95
ACT 0.08 0.02 0.48 1.71 0.55 1.44 4.28TOTAL 0.09 0.02 0.48 1.71 0.54 1.67 4.50
Source: Simpson, et al 1996 Measuring Canberra’s Ecological Footprint Canberra’s ecological footprint was measured for the 1993/94 financial year - or as close to that year as data were available. This year was chosen as being the most recent where complete sets of data were accessible, especially detailed data from publications like the Australian Bureau of Statistics (ABS) Household Expenditure Survey.4
Canberra’s population at the end of 1993 was close to 300,0005, so this figure was used to determine the individual ecological footprint from the city’s total consumption. Many statistics for the ACT are not disaggregated, but rather are included within the figures for NSW. This led to the need to make estimates for ACT for some data types. The lack of complete data for the production and consumption of most commodities, has led most ecological footprints research to rely on data from a range of sources. In this report, the sources of consumption data used varies widely. Local physical data, such as the actual land area covered by housing, or the road transport fuel used in the ACT has been used wherever possible as this gives the most accurate measure of Canberra’s consumption. For other data, such the consumption of food, or use of fuel for rail transport, local figures are not available and national averages have been used.

Canberra’s Ecological Footprint
17
Measuring “Embodied” Energy “Embodied” energy is all the energy which goes into producing consumer goods and services. This includes the energy used to: • mine/harvest the raw materials; • manufacture and process the goods and services; • transport the goods and services to consumers. There are various ways to measure embodied energy - some researchers undertake energy analysis projects to calculate all the various energy inputs to a particular finished product, this can vary enormously from country to country and even from manufacturer to manufacturer. Some estimates of embodied energy used in this report, such as in the average motor vehicle and in building materials, are based on energy analysis research. An alternative method to measuring the energy which has been used in the complex chain of interactions required to produce various consumer goods or to provide services; is to use “energy intensity” data. Energy intensity is the amount of energy embodied in any commodities in proportion to its monetary value. This data is worked out through extensive calculation of the “input-output” patterns of production, where a final factor is provided to represent the energy/value within a product or range of products. Energy intensity figures for this report have been extrapolated6 for 1993/94 from data published by Common and Salma7.8,9 at the Australian National University. The embodied energy contained within various goods and services is calculated by multiplying the amount of money spent within each consumption category by the energy intensity figure for that category as shown in the diagram below. The financial data used is from the ABS Household Expenditure Survey (private expenditure) and from other ABS publications (government expenditure). The embodied energy is measured in gigajoules.9
2.9 Calculating Embodied Energy, Using Energy Intensity Data.
Expenditure
X
Energy Intensity
=
Embodied Energy
$A Gj/$A Gj
Canberra’s Ecological Footprint
18
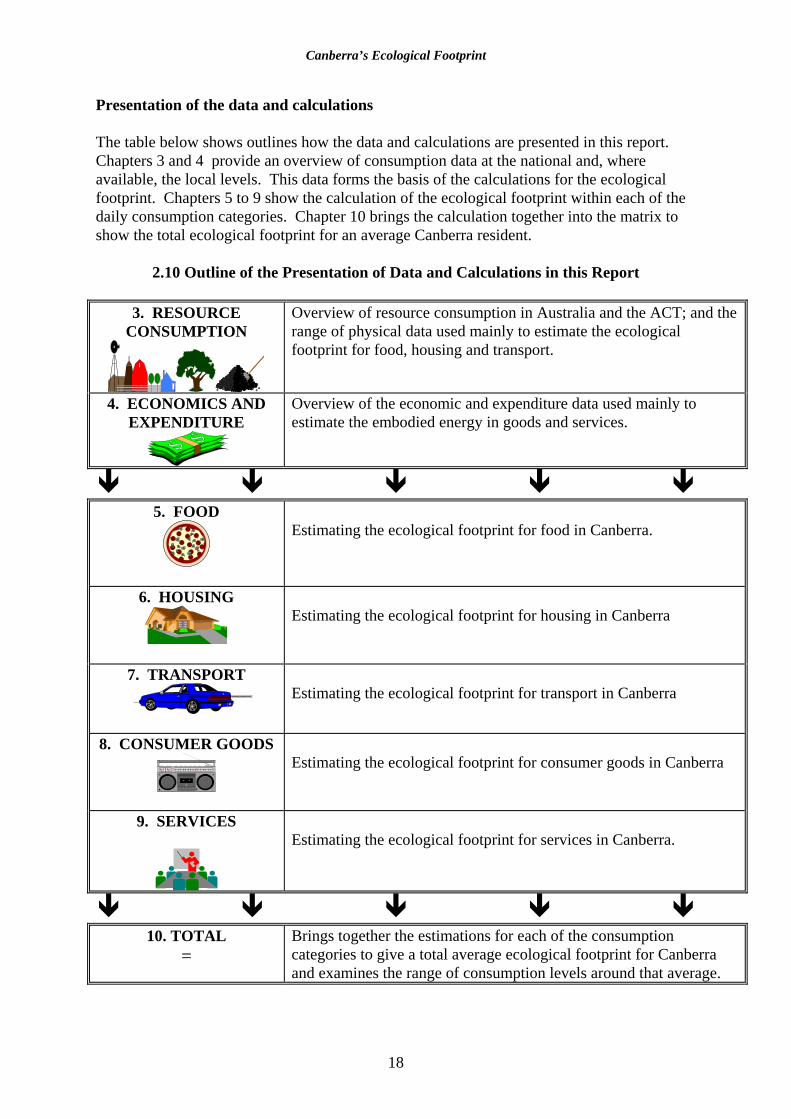
Presentation of the data and calculations The table below shows outlines how the data and calculations are presented in this report. Chapters 3 and 4 provide an overview of consumption data at the national and, where available, the local levels. This data forms the basis of the calculations for the ecological footprint. Chapters 5 to 9 show the calculation of the ecological footprint within each of the daily consumption categories. Chapter 10 brings the calculation together into the matrix to show the total ecological footprint for an average Canberra resident.
2.10 Outline of the Presentation of Data and Calculations in this Report
3. RESOURCE CONSUMPTION
Overview of resource consumption in Australia and the ACT; and the range of physical data used mainly to estimate the ecological footprint for food, housing and transport.
4. ECONOMICS AND EXPENDITURE
Overview of the economic and expenditure data used mainly to estimate the embodied energy in goods and services.
5. FOOD
Estimating the ecological footprint for food in Canberra.
6. HOUSING
Estimating the ecological footprint for housing in Canberra
7. TRANSPORT
Estimating the ecological footprint for transport in Canberra
8. CONSUMER GOODS
Estimating the ecological footprint for consumer goods in Canberra
9. SERVICES
Estimating the ecological footprint for services in Canberra.
10. TOTAL
= Brings together the estimations for each of the consumption categories to give a total average ecological footprint for Canberra and examines the range of consumption levels around that average.

Canberra’s Ecological Footprint
19
References and Notes 1. Wackernagel, M and Rees, W (1996) Our Ecological Footprint: Reducing Human Impact
on the Earth. New Society Publishers. Philadelphia. 2. Wackernagel M (1997) Ecological Footprints of Nations. Earth Council. New Mexico 3. Simpson R, Lowe I and Petroeschevsky A (1997) Draft Report - The Ecological Footprint
of Australia, with a Focus on the South-East Queensland Region. Griffith University. Brisbane.
4. Data takes time to collect and collate, so ABS data is usually published 2-3 years after collection. The report relies on several ABS publications, especially the Australian Bureau of Statistics (1995) Summary of Results: 1993/94 Household Expenditure Survey. Australia. ABS Cat No 6530.0. Canberra.
5. Australian Bureau of Statistics (1994) ACT in Focus. ABS. Canberra. ABS Cat 1307.8. 6. Close, A (unpub) Estimating Canberra’s Ecological Footprint - Energy. Canberra
University Research Project. 7. Common, M (1995) Sustainability and Policy. Limits to Economics. Cambridge
University. London. 8. Common, MS and Salma, U (1992a) “Accounting for Changes in Australian Carbon
Dioxide Emissions” in Energy Economics. Butterworth-Heinmann. 9. Common MS and Salma, U (1992b) An Economic Analysis of Australian Carbon Dioxide
Emissions and Energy Use. Centre for Resource and Environmental Studies. ANU. Canberra.
10. Measurements of energy can be expressed in a confusing array of measurements, for example kilowatt hours, British thermal units, calories, joules. In keeping with the growing trend in energy reporting and accounting in Gigajoules (ABS National Energy Accounts, ABARE Energy Reports, Wackernagel and Rees, 1996), this energy “common currency” is used in this report.
Canberra’s Ecological Footprint
20
PART TWO
AN OVERVIEW OF RESOURCE USE, CONSUMPTION AND EXPENDITURE IN AUSTRALIA AND THE A.C.T
This part of the report includes the following chapters:
3. RESOURCE AND LAND USE Overview of resource and land use in Australia and the A.C.T and the range of physical data used to estimate the ecological footprint for food, housing and transport.
4. ECONOMICS AND EXPENDITURE Overview of the economic and expenditure data used to estimate the embodied energy in goods and services.
Canberra’s Ecological Footprint
21
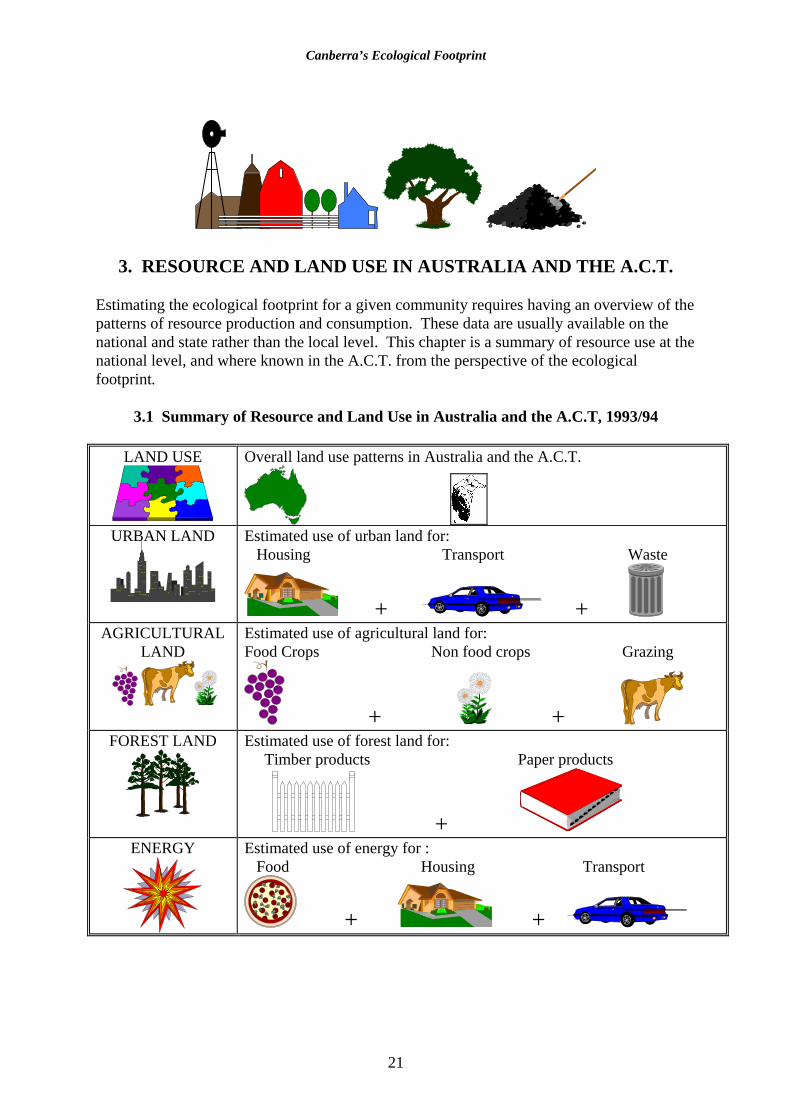
3. RESOURCE AND LAND USE IN AUSTRALIA AND THE A.C.T. Estimating the ecological footprint for a given community requires having an overview of the patterns of resource production and consumption. These data are usually available on the national and state rather than the local level. This chapter is a summary of resource use at the national level, and where known in the A.C.T. from the perspective of the ecological footprint.
3.1 Summary of Resource and Land Use in Australia and the A.C.T, 1993/94
LAND USE
Overall land use patterns in Australia and the A.C.T.
URBAN LAND
Estimated use of urban land for: Housing Transport Waste
+ + AGRICULTURAL
LAND
Estimated use of agricultural land for: Food Crops Non food crops Grazing
+ + FOREST LAND
Estimated use of forest land for: Timber products Paper products
+ ENERGY
Estimated use of energy for : Food Housing Transport
+ +
Canberra’s Ecological Footprint
22
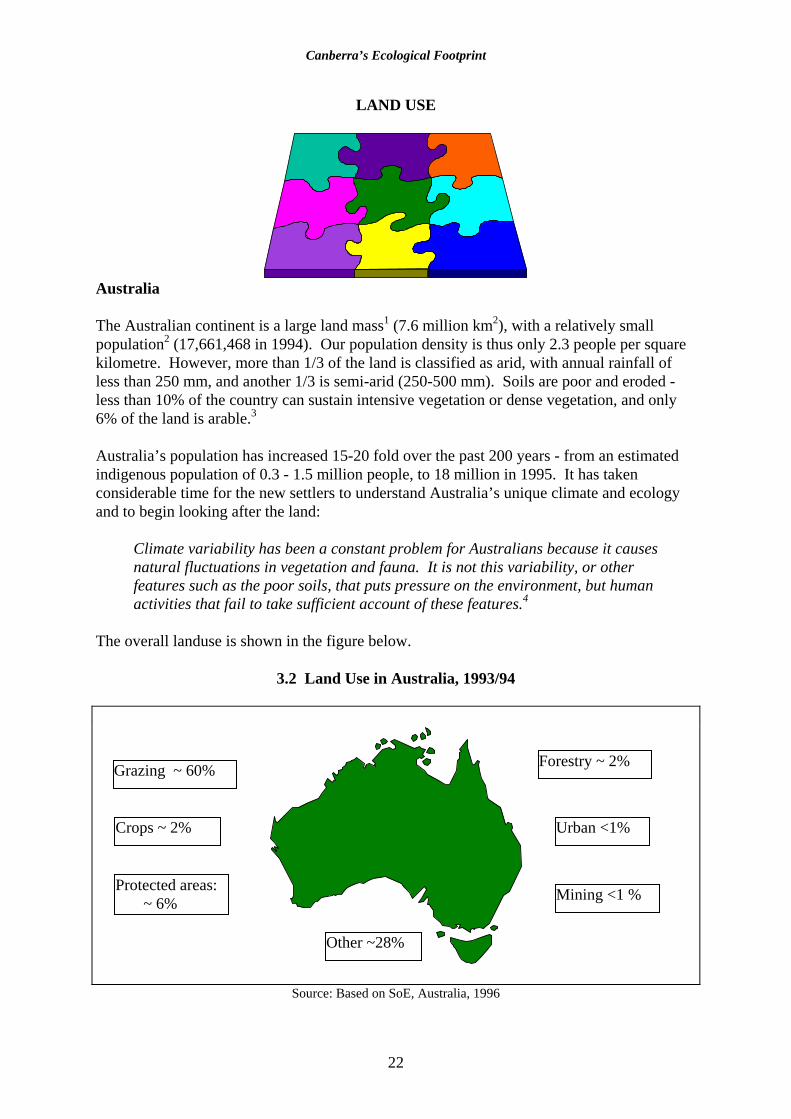
LAND USE
Australia The Australian continent is a large land mass1 (7.6 million km2), with a relatively small population2 (17,661,468 in 1994). Our population density is thus only 2.3 people per square kilometre. However, more than 1/3 of the land is classified as arid, with annual rainfall of less than 250 mm, and another 1/3 is semi-arid (250-500 mm). Soils are poor and eroded - less than 10% of the country can sustain intensive vegetation or dense vegetation, and only 6% of the land is arable.3 Australia’s population has increased 15-20 fold over the past 200 years - from an estimated indigenous population of 0.3 - 1.5 million people, to 18 million in 1995. It has taken considerable time for the new settlers to understand Australia’s unique climate and ecology and to begin looking after the land:
Climate variability has been a constant problem for Australians because it causes natural fluctuations in vegetation and fauna. It is not this variability, or other features such as the poor soils, that puts pressure on the environment, but human activities that fail to take sufficient account of these features.4
The overall landuse is shown in the figure below.
3.2 Land Use in Australia, 1993/94
Source: Based on SoE, Australia, 1996
Grazing ~ 60%
Urban <1%
Forestry ~ 2%
Mining <1 % Protected areas: ~ 6%
Crops ~ 2%
Other ~28%

Canberra’s Ecological Footprint
23
A.C.T
3.3. Land Use in the Australian Capital Territory
Source: ABS (1996) Cat No 1307.8
The total area of the A.C.T is about 236,800 ha. With a population of 300,000 (in 1994) this gives a population density of nearly 1.3 people per ha. As shown in the above figure, national park and water catchment areas cover more than half the A.C.T, agriculture and plantation forestry cover a significant area, and the city of Canberra comprises 14% of the total area.5
Based on the broad overview of land uses outlined above, the following sections examine in closer detail the range of land uses which involve human consumption of resources, ie. those which generate an ecological footprint: • Urban land - the land used for houses and gardens, roads and pavements, open space for
recreation, and land used for absorbing or storing wastes. • Agricultural land - the land used for producing fruit and vegetables, grains and other
foods, stock feed, textiles, non-food crops; the land used for grazing stock and the land degraded through agriculture.
• Forest land - the land used to produce timber and paper products. • Energy land - the land required to absorb the carbon dioxide generated by the use of fossil
fuels.
National parks & reserves = 53%
Agriculture = 23%
Urban Area = 14%
Plantation Forestry = 10%

Canberra’s Ecological Footprint
24
URBAN LAND
Australia The Australian population is highly urbanised, about 85% of people live in towns and cities of 10,000 or more. Although these urban areas comprise less than 1% of Australia’s total land area, their impact on the environment is far greater than this.6 Unlike compact European cities, our cities sprawl - this can largely be attributed to our comparatively recent development - since the advent of the railway and the motor engine. Australian cities have much lower population densities (10-18 people per hectare) than most of the world’s major cities (eg. New York 45, Paris 48, London 56, Singapore 83 Tokyo 160, Hong Kong 293).7 A.C.T. Canberra city is located in the north of the A.C.T, within the Jerramomberra, Upper Molonglo, Murumbidgee, Ginninderra and Lower Molonglo catchments.8 The larger Canberra districts have their own major centres - Civic, Belconnen, Woden and Tuggeranong. Medium sized centres are at Dickson, Kingston-Manuka, and Kippax, while most suburbs include a small shopping cluster. Industrial centres are separate from the residential areas, at Fyshwyck, Mitchell and Hume.
3.4 Canberra’s Planned Land Use Categories Land Use Code Total (ha) %
Designated 4,139.6 11.7Residential B1 15,772.9 44.4Commercial B2 854.5 2.4Industrial B3 802.6 2.3Community B4 1,357.2 3.8Recreation B5 653.4 1.8Water B6 375.8 1.1Municipal Services B7 150.2 0.4Entertainment, accom, leisure B8 399.4 1.1Urban open space B9 3,092.9 8.7Broadacre & rural B10/B11 2,554.4 7.2Hills, ridges, river corridor, bush B12/B13/B14 2,946.1 8.3Forestry plantations B15 94.5 0.2Major roads B16 2,310.6 6.5Total 35,504.0 100.0
Source: A.C.T. Dept of Planning database9
Canberra’s Ecological Footprint
25
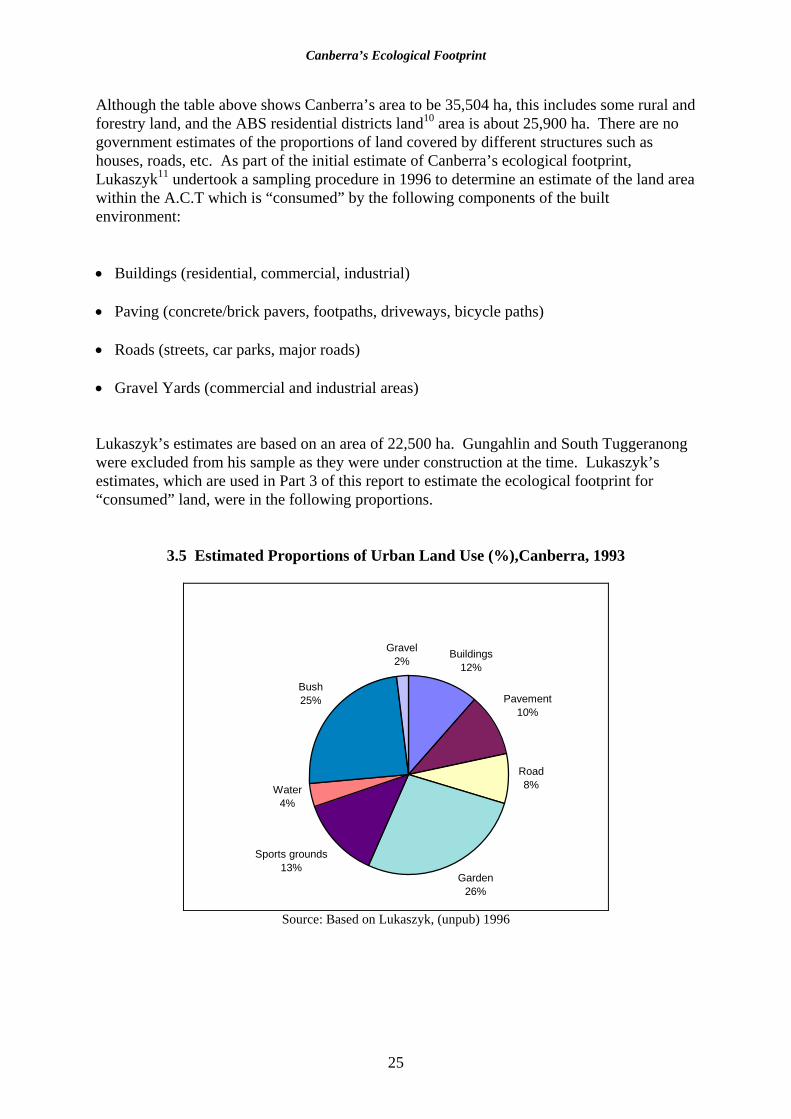
Although the table above shows Canberra’s area to be 35,504 ha, this includes some rural and forestry land, and the ABS residential districts land10 area is about 25,900 ha. There are no government estimates of the proportions of land covered by different structures such as houses, roads, etc. As part of the initial estimate of Canberra’s ecological footprint, Lukaszyk11 undertook a sampling procedure in 1996 to determine an estimate of the land area within the A.C.T which is “consumed” by the following components of the built environment: • Buildings (residential, commercial, industrial) • Paving (concrete/brick pavers, footpaths, driveways, bicycle paths) • Roads (streets, car parks, major roads) • Gravel Yards (commercial and industrial areas) Lukaszyk’s estimates are based on an area of 22,500 ha. Gungahlin and South Tuggeranong were excluded from his sample as they were under construction at the time. Lukaszyk’s estimates, which are used in Part 3 of this report to estimate the ecological footprint for “consumed” land, were in the following proportions.
3.5 Estimated Proportions of Urban Land Use (%),Canberra, 1993
Buildings12%
Pavement10%
Road8%
Garden26%
Sports grounds13%
Water4%
Bush25%
Gravel2%
Source: Based on Lukaszyk, (unpub) 1996
Canberra’s Ecological Footprint
26
First time visitors to the A.C.T. often ask “where is everybody?” Canberra’s low population density, decentralised shopping and business areas and bushland setting combine to present a uniquely spacious urban environment, leading to the title of the “bush capital”. Canberra’s urban population density is estimated to be 12 persons per hectare,12 which is low compared with other Australia cities and very low by world standards. How does this low population density affect the ecological impact of Canberra’s residents? It requires a relatively high energy input to provide and maintain infrastructure, transportation and general maintenance. Basic services like electricity, sewerage, stormwater drainage, water, gas, telecommunications and street lighting are spread over a large area serving a relatively small number of people, and require a large amount of energy to build, maintain and upgrade. This low population density leads the A.C.T to be a relatively expensive place to live, and for the same reason, it was expected that the per person ecological footprint could also be greater than for other Australian cities.
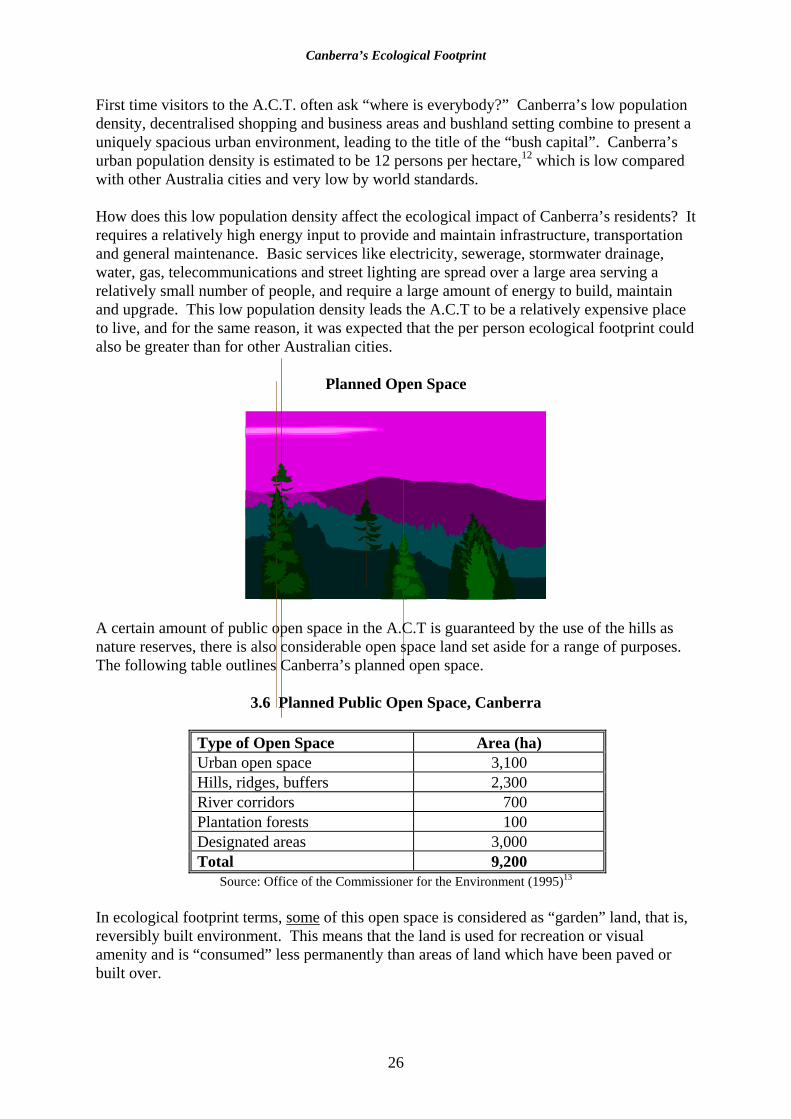
Planned Open Space
A certain amount of public open space in the A.C.T is guaranteed by the use of the hills as nature reserves, there is also considerable open space land set aside for a range of purposes. The following table outlines Canberra’s planned open space.
3.6 Planned Public Open Space, Canberra
Type of Open Space Area (ha) Urban open space 3,100 Hills, ridges, buffers 2,300 River corridors 700 Plantation forests 100 Designated areas 3,000 Total 9,200
Source: Office of the Commissioner for the Environment (1995)13 In ecological footprint terms, some of this open space is considered as “garden” land, that is, reversibly built environment. This means that the land is used for recreation or visual amenity and is “consumed” less permanently than areas of land which have been paved or built over.
Canberra’s Ecological Footprint
27
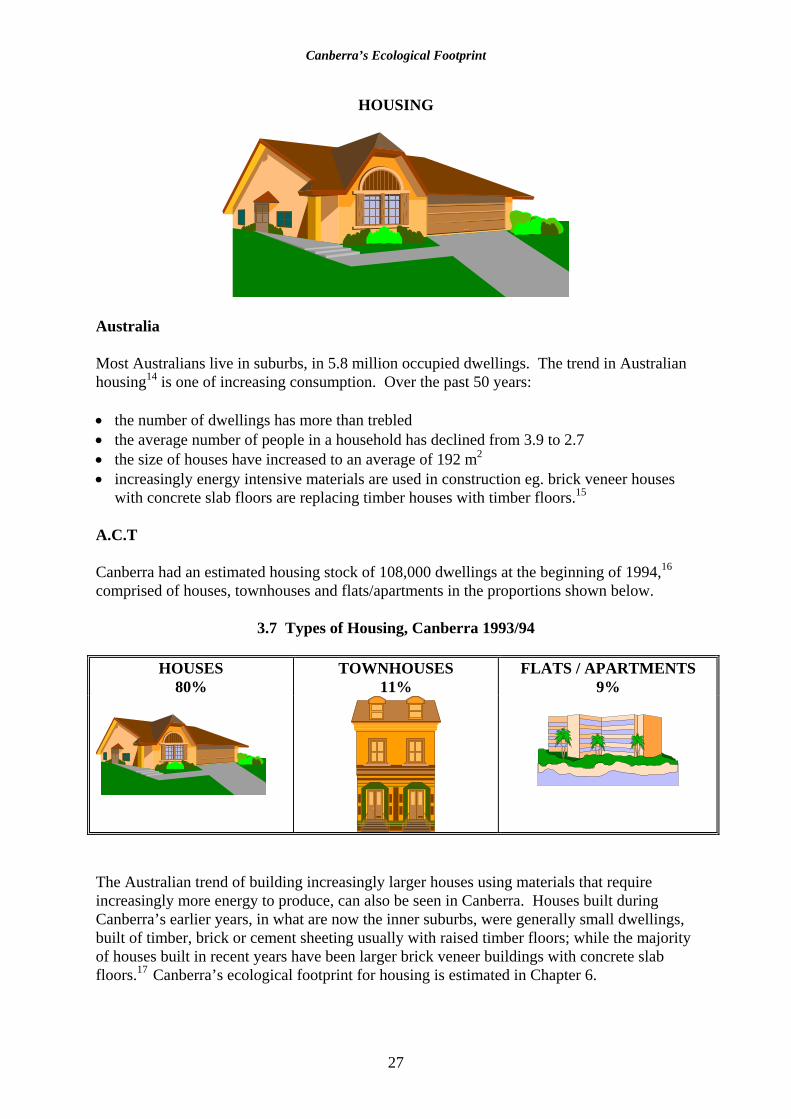
HOUSING
Australia Most Australians live in suburbs, in 5.8 million occupied dwellings. The trend in Australian housing14 is one of increasing consumption. Over the past 50 years: • the number of dwellings has more than trebled • the average number of people in a household has declined from 3.9 to 2.7 • the size of houses have increased to an average of 192 m2 • increasingly energy intensive materials are used in construction eg. brick veneer houses
with concrete slab floors are replacing timber houses with timber floors.15 A.C.T Canberra had an estimated housing stock of 108,000 dwellings at the beginning of 1994,16
comprised of houses, townhouses and flats/apartments in the proportions shown below.
3.7 Types of Housing, Canberra 1993/94
HOUSES 80%
TOWNHOUSES 11%
FLATS / APARTMENTS 9%
The Australian trend of building increasingly larger houses using materials that require increasingly more energy to produce, can also be seen in Canberra. Houses built during Canberra’s earlier years, in what are now the inner suburbs, were generally small dwellings, built of timber, brick or cement sheeting usually with raised timber floors; while the majority of houses built in recent years have been larger brick veneer buildings with concrete slab floors.17 Canberra’s ecological footprint for housing is estimated in Chapter 6.
Canberra’s Ecological Footprint
28
TRANSPORT
Australia The use of motorised transport is an essential part of modern living in Australia. At the same time as providing us with mobility, transport brings unwanted effects - air pollution, traffic accidents, congestion, noise. Because the availability of transport and urban structure are tightly interwoven, we can also attribute urban sprawl - over one million hectares of land were consumed by Australian cities in the fifteen years to 1992 - to the easy availability of private transport.18 Australian cities have the world’s highest road provision19 - 8.8 metres (per person) compared to the US (6.6 m), European cities (2.1 m) and Asian cities (1.0 m).
Cars require a great deal of space. It has been estimated that a car can take up to 30 times more space to move each person than public transport. The faster cars travel the more room they need in terms of highway space and buffer zones. Cars also require a significant amount of space for parking spaces near homes, shopping centres, work places and educational and recreational facilities. It has been estimated that cars can take up to three times the space of the average family home.20
Australians have double the per person car use of that in European cities and less than half the public transport use. The proportion of people using public transport in Australia has been declining for some time,21 almost halving from an average of 176 trips in 1961 to 91 trips in 1991. Our current transport patterns are relatively recent. Mees22 reports that private vehicle use was limited until the 1950s because of the wartime rationing of petrol. In Melbourne in 1951, 57% of trips to work were by public transport and only 18% were by car. Forty years later, public transport had declined to 15%, while 75% of trips to work were by car. Motorised transport uses energy - 26% of the primary derived energy used in Australia in 1993/94, and is the main user of energy derived from petroleum products. The rate of energy use is growing - 2.3% per annum. during the twenty years to 1993/94.23 The national transport trends appear to be as follows: • the number of cars per person is increasing; • frequency of car use is increasing; • trips continue to lengthen; • the vehicle fleet is ageing; • the average fuel efficiency did not improve over the 20 years to 1991, as it was offset by
the ageing of the car fleet and larger vehicles; • the overall use of energy is increasing.
Canberra’s Ecological Footprint
29
A.C.T. How does transport in the A.C.T. compare to the Australian trends? Does the city live up to its reputation for high environmental standards and the promise of its comprehensive network of almost 1,000 km of cycle paths? 24 As shown in the table below, Canberrans have more cars (per person) and travel further than the Australian average. On the positive side, Canberrans have a younger fleet and a therefore a higher proportion of cars using non-leaded petrol (post 1986).
3.8 Selected Transport Data, Australia and A.C.T.
Transport Data A.C.T. AUST Motor vehicles per 1,000 people a 591.0 595.0 Average age of fleet 10.0 10.4 Proportion of vehicles made after 1986 (%)b 46.0 42.0 Average distance travelled - passenger cars (‘000 km) b 16.4 14.4 Proportion of passenger vehicles in fleet (%)c 87.0 79.0
Sources: ABS (1997) 4605.0: a - 1993 data; b - 1995 data. ABS (1994) 1307.8: c1993 Canberra’s design incorporates clusters of employment and retail areas together within walking distance - with public transport connecting these areas and the suburbs. Canberra’s early planning:
....envisaged major employment and retail centres in the town centres, with people living and working within their district. Such a system would increase goals of sustainability by reducing travel distance, which means less traffic, decreased consumption of fossil fuels and decreased emission of air pollutants. From the quality of life perspective, it also meant reduced commuting time and less traffic noise. 25
Despite this planning, Canberra can still be defined as automobile dependent, based on the major features that distinguish automobile dependent cities - low population density, extensive provision for the car (roads and parking) and poor public transport usage.26 While Canberra’s employment is highly localised within the town centres, the low population density and high level of provision for cars makes private car travel an attractive option for most people. The local ACTION bus service provides a good service during peak hours, and a proportion of work trips are made via public transport, however many trips are not work-related and there would be very few people who, for example, do their grocery shopping by bus. It has been estimated that only about 7% of people travelled to work by bus in 1991.27 The low traffic congestion in Canberra compared to most Australia cities and the high quality road system mean that people are more likely to use cars. An NRMA funded study into traffic accidents in 1996 highlighted the prevalence of high speed driving as a major cause of accidents in the A.C.T. The report found that our low density, high speed traffic environment contributes to speeding.28 Canberra’s ecological footprint for transport is estimated in Chapter 7.
Canberra’s Ecological Footprint
30
URBAN WASTES
Australia Australia produces more municipal solid wastes than any other industrialised nation - 681 kg per person per year compared with an OECD average of 513 kg.29 Wastes and pollution impact on land, water and air. The impact may be brief and reversible or long-term and difficult to reverse (eg. contamination by radioactive waste or long lived stable chemicals). The average quantities of waste (per person) for Sydney during 1990 is shown in the table below.30 These figures can be assumed to approximate the national average.
3.9 Average Waste Produced (per person), Sydney, 1990
Type of Waste Quantity per person (tonnes)
Solid wastes 0.77 Sewage 128.00 Hazardous wastes 0.04 Air wastes (including carbon dioxide, carbon monoxide, sulfur oxides, nitrous oxides, hydrocarbons, and particluates).
9.30
Total 138.11 Source: Australian State of the Environment Report (1996)
Just over 9.0 of the 9.3 tonnes given for air wastes is comprised of the carbon dioxide emissions produced when fossil fuels are burnt. Measurements for the waste ecological footprint include the land area used for solid and liquid wastes, and the land area needed to absorb the waste CO2. A.C.T. Canberra, with few manufacturing industries, does not have to deal with the immediate waste disposal due to production of goods. There is also a strong and growing trend towards recycling - material going to landfill was reduced by almost half during the period 1989/90 to 1995/96. 31 The table below shows wastes to landfill and recycling in Canberra for 1993/94.
Canberra’s Ecological Footprint
31
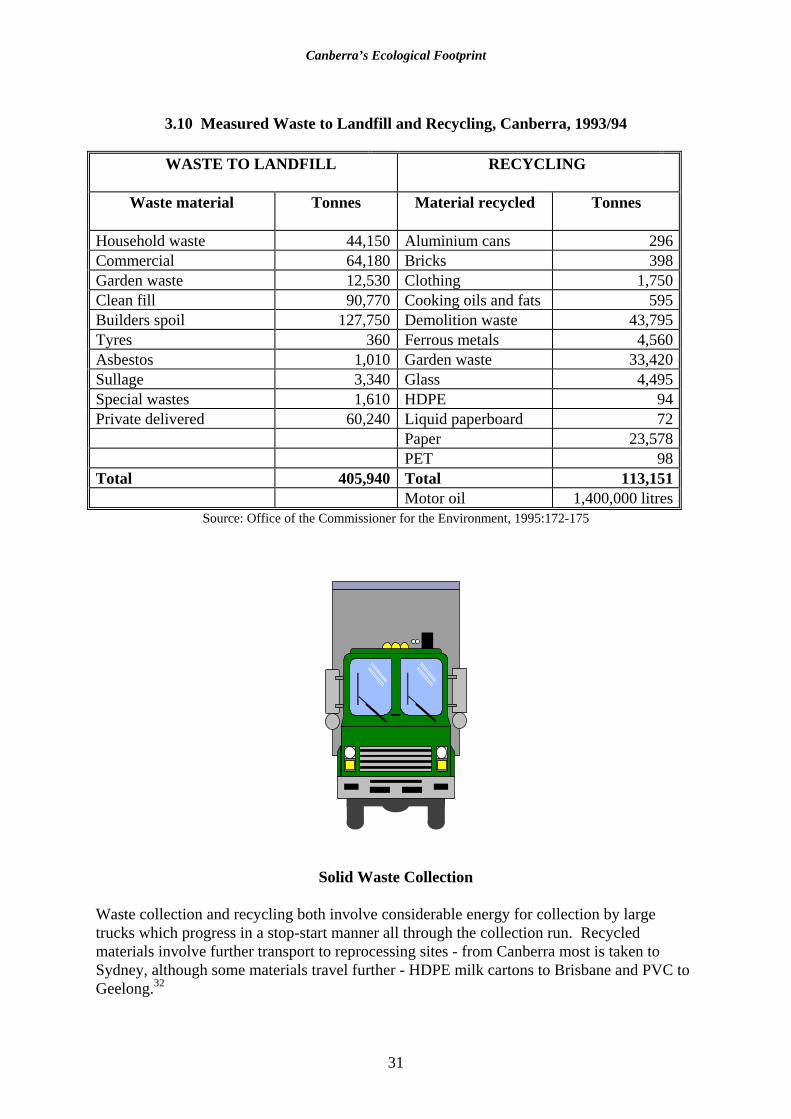
3.10 Measured Waste to Landfill and Recycling, Canberra, 1993/94
WASTE TO LANDFILL
RECYCLING
Waste material
Tonnes Material recycled Tonnes
Household waste 44,150 Aluminium cans 296Commercial 64,180 Bricks 398Garden waste 12,530 Clothing 1,750Clean fill 90,770 Cooking oils and fats 595Builders spoil 127,750 Demolition waste 43,795Tyres 360 Ferrous metals 4,560Asbestos 1,010 Garden waste 33,420Sullage 3,340 Glass 4,495Special wastes 1,610 HDPE 94Private delivered 60,240 Liquid paperboard 72 Paper 23,578 PET 98Total 405,940 Total 113,151 Motor oil 1,400,000 litres
Source: Office of the Commissioner for the Environment, 1995:172-175
Solid Waste Collection Waste collection and recycling both involve considerable energy for collection by large trucks which progress in a stop-start manner all through the collection run. Recycled materials involve further transport to reprocessing sites - from Canberra most is taken to Sydney, although some materials travel further - HDPE milk cartons to Brisbane and PVC to Geelong.32
Canberra’s Ecological Footprint
32
Canberra’s Landfill Sites Canberra’s current landfills sites cover 235 ha of land which will be useable every year for the next 10-15 years as outlined in the table below.
3.11 Landfill Sites, Canberra
Mugga Lane West Belconnen Fill Zone (ha) 8.8 2.8
Total Area (ha) 140 95 Expected Life (yrs) 10-15 10
Source: Marsden-Ballard (unpub) Marsden-Ballard cites OECD calculations that for every tonne of waste at the consumer level, there are 5 tonnes created in the manufacturing processes and a further 20 tonnes of resource extraction waste, such as farming, logging or mining. If the area required to absorb these wastes were included in Canberra’s waste footprint, then we could expect to need 25 times the current landfill area, as shown below. These figures are used in Chapters 6 and 8 in estimating Canberra’s ecological footprint..
3.12 Estimating Canberra’s Total Waste 1993/94
Household Waste
Manufacturing Waste (x5)
Resource Extraction Waste (x20)
Total Waste (x25)
Canberra’s Waste (tonnes)
405,940 2,029,700 8,118,800 10,148,500
Waste per person (tonnes)
1.35 6.77 27.06 33.83
Total Land Area (ha)
235 1,175 4,700 5,875
Land Area per person (ha)
0.0007 0.0039 0.016 0.0195
Liquid Wastes The major liquid wastes are sewerage and storm water runoff. Storm water is collected via large pipes under footpaths and via low-lying areas which are usually old creek beds which have been paved or grassy areas which have been incorporated into playing fields and urban open space. Most of Canberra’s storm water flows into the lake system, carrying with it a range of waste and pollutants. Objects such as takeaway food containers, plastic bags and larger sediments are caught in Gross Pollutant Traps sited at the end of floodways. Nutrients, toxic substances (such as pesticides and heavy metals), and hydocarbons are washed into Canberra’s lakes, from where they may volatilise (evaporate) or become incorporated into lake sediments. Ponds have been constructed in Belconnen, Tuggeranong and Gungahlin to provide initial treatment of storm water runoff before it moves into the lakes system.33 The lakes have been included in Chapter 9 in the estimation of Canberra’s ecological footprint for services.

Canberra’s Ecological Footprint
33
AGRICULTURAL LAND USE
Australia Australia’s land area under agricultural production34 during 1993-94 was 469.1 million ha, or 61% of the total land area. This was a decline from a peak of 500.7 million ha in 1975-76. The decline has been due to a range of factors including economic difficulties, environmental problems, and competing land uses, including urban development. Livestock grazing is the largest land-user, in the semi-arid and arid zones livestock graze on native grasses, this represents about 90% of the land area used for agriculture. A further 6% of land is used for grazing on introduced pastures in the higher rainfall and irrigation areas. About 4% is used for crops. The following figure shows Australia’s agricultural land uses.
3.13 Agricultural Land Use, Australia, 1993/94
Source: ABS (1992) Cat No 4140.0 35
A.C.T. Agricultural land comprises 23% of the total A.C.T. land area, most of this is sheep and cattle grazing, irrigated cropping takes up less than 100 ha, while vineyards use less than 25 ha.36
Canberra’s Ecological Footprint
34
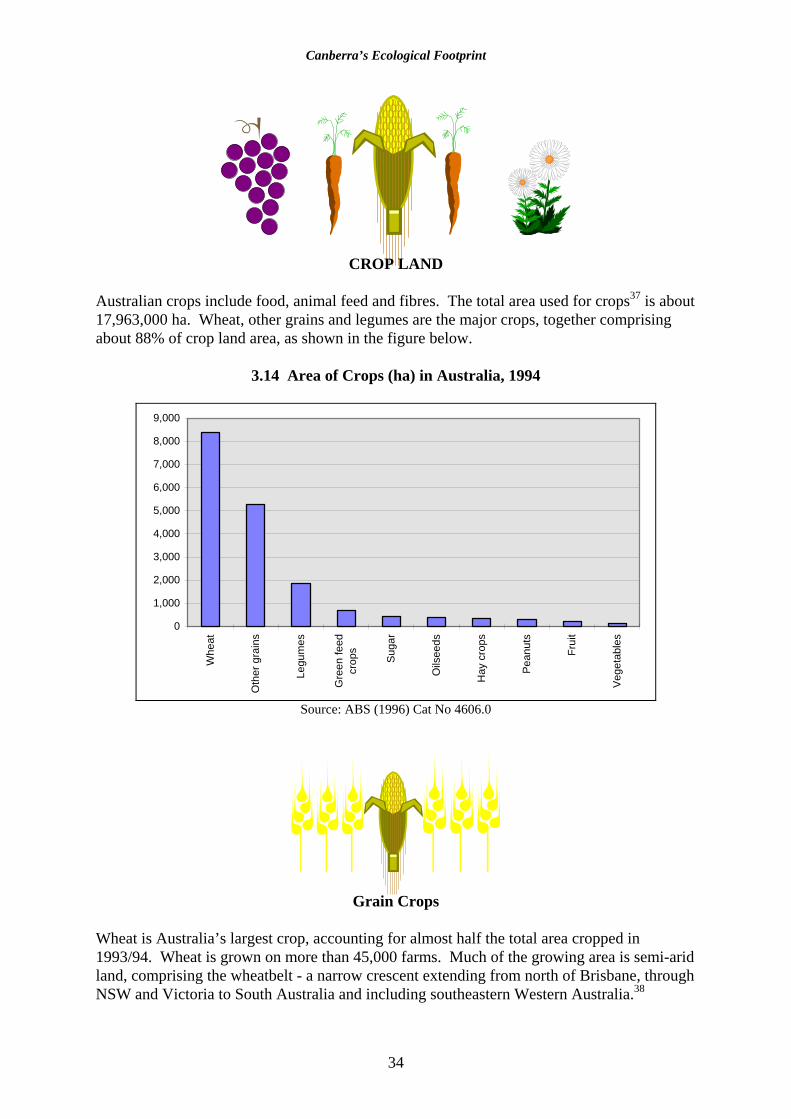
CROP LAND Australian crops include food, animal feed and fibres. The total area used for crops37 is about 17,963,000 ha. Wheat, other grains and legumes are the major crops, together comprising about 88% of crop land area, as shown in the figure below.
3.14 Area of Crops (ha) in Australia, 1994
0
1,000
2,000
3,000
4,000
5,000
6,000
7,000
8,000
9,000
Whe
at
Oth
er g
rain
s
Legu
mes
Gre
en fe
edcr
ops
Suga
r
Oils
eeds
Hay
cro
ps
Pean
uts
Frui
t
Vege
tabl
es
Source: ABS (1996) Cat No 4606.0
Grain Crops Wheat is Australia’s largest crop, accounting for almost half the total area cropped in 1993/94. Wheat is grown on more than 45,000 farms. Much of the growing area is semi-arid land, comprising the wheatbelt - a narrow crescent extending from north of Brisbane, through NSW and Victoria to South Australia and including southeastern Western Australia.38

Canberra’s Ecological Footprint
35
Australia is the world’s fourth largest wheat exporter, contributing 11% of the global market. However, production has not increased significantly during the past 20 years and yield is lower than for export competitors.39 The graph below shows the land used by wheat and the other grain crops during 1993/94.
3.15 Area of Grain Crops (ha), Australia, 1993/94
Whe
at
Bar
ley
Oat
s
Gra
in S
ourg
hum
Ric
e
Triti
cale
Mai
ze
0
1000
2000
3000
4000
5000
6000
7000
8000
9000W
heat
Bar
ley
Oat
s
Gra
in S
ourg
hum
Ric
e
Triti
cale
Mai
ze
Area ('000 ha)
Source: ABS Cat No 7113.0
The table below shows grain production for 1993/94, the land area used and the average Australian yield.40 The average NSW yield is also shown, as this figure is used in Chapter 5 to estimate the ecological footprint for food consumption in Canberra.
3.16 Grain Crops - Production, Area and Yields for 1993/94
Grains Australian Production
(‘000 tonnes)
Total Area (‘000 ha)
Australian Yield(t/ha)
NSW Yield (t/ha)
Main Producing
State Wheat 16,479 8383 2.0 2.6 WA Barley 6,668 3424 1.9 2.2 VIC/WA Grain Sorghum 1,084 499 2.2 2.3 QLD Rice 1,082 132 8.2 8.4 NSW Oats 1,647 947 1.7 1.7 NSW Triticale 263 129 2.0 2.6 NSW Maize 204 44 4.7 7.0 NSW Total 27,427 13,558 n.a. n.a. n.a.
Source: ABS Cat No 7113.0
Canberra’s Ecological Footprint
36
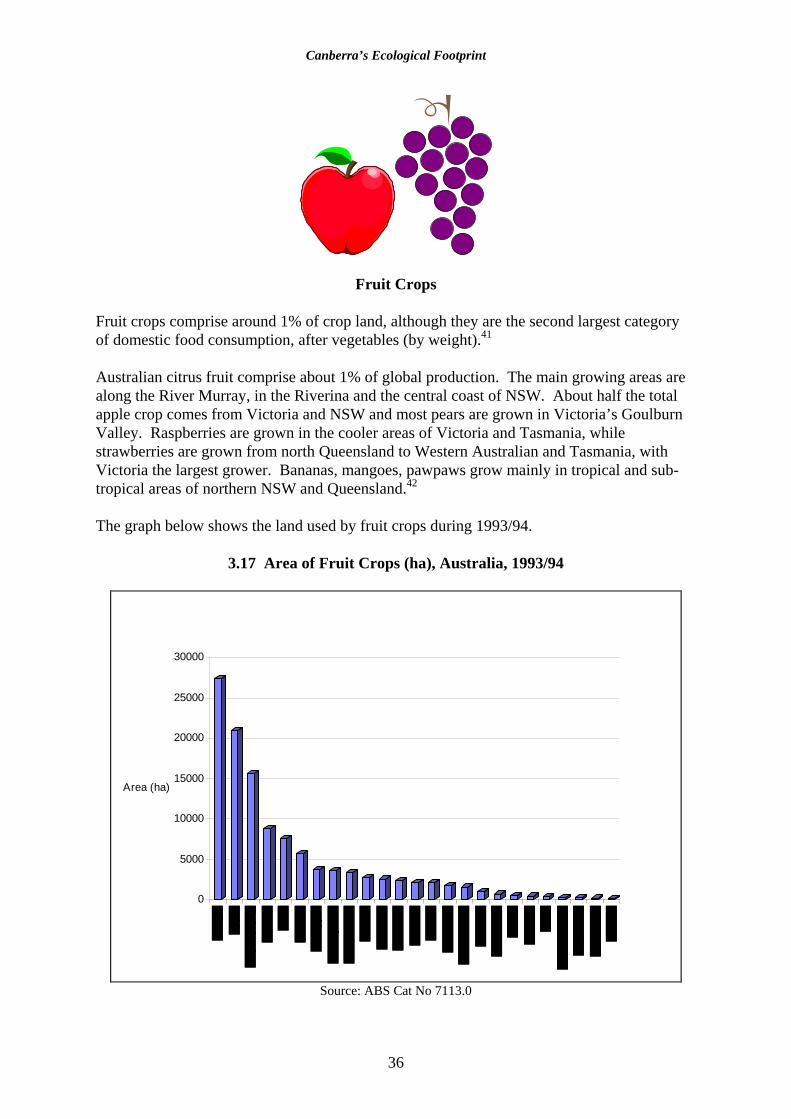
Fruit Crops
Fruit crops comprise around 1% of crop land, although they are the second largest category of domestic food consumption, after vegetables (by weight).41 Australian citrus fruit comprise about 1% of global production. The main growing areas are along the River Murray, in the Riverina and the central coast of NSW. About half the total apple crop comes from Victoria and NSW and most pears are grown in Victoria’s Goulburn Valley. Raspberries are grown in the cooler areas of Victoria and Tasmania, while strawberries are grown from north Queensland to Western Australian and Tasmania, with Victoria the largest grower. Bananas, mangoes, pawpaws grow mainly in tropical and sub-tropical areas of northern NSW and Queensland.42 The graph below shows the land used by fruit crops during 1993/94.
3.17 Area of Fruit Crops (ha), Australia, 1993/94
0
5000
10000
15000
20000
25000
30000
Area (ha)
Source: ABS Cat No 7113.0

Canberra’s Ecological Footprint
37
The table below shows production for 1993/94, the land area used and the average Australian yield.43 The average NSW yield is also shown, as this figure is used in Chapter 5 to estimate the ecological footprint for food consumption in Canberra.
3.18 Fruit Crops - Production, Area and Yields for 1993/94
Fruit Australian Production (Tonnes)
Total Area (ha)
Australian Yield (t/ha)
NSW Yield (t/ha)
Main Producing State
Oranges 582,095 27,446 21.22 17.93 NSW Apples 306,920 20,971 14.64 12.43 VIC Bananas 219,222 8,756 25.00 14.90 QLD Grapes (drying) 212,870 15,552 15.00 14.10 VIC Pears 161,087 7,488 21.50 12.98 VIC Pineapples 157,439 3,668 42.90 3.00 QLD Peaches 59,361 5,638 10.54 6.58 VIC Mandarins 57,595 2,504 22.92 10.56 QLD Grapes(table) 45,456 3,320 15.00 14.10 VIC Lemons/limes 34,328 1,529 22.44 11.38 SA Plums/prunes 26,102 3,596 7.25 8.66 NSW Apricots 21,174 2,692 7.87 5.62 SA Grapefruit 21,045 933 22.51 15.94 NSW Mangoes 19,440 2,113 9.19 1.92 QLD Avocados 16,802 1,675 10.03 9.24 QLD Nectarines 16,751 2,338 7.18 5.90 VIC Strawberries 9,375 656 14.30 6.90 VIC Cherries 6,350 2,058 3.07 3.12 NSW Pawpaws 6,201 399 15.20 3.90 QLD Kiwifruit 4,103 442 9.30 9.70 VIC Passionfruit 1,997 157 12.70 26.00 NSW Custard Apples 1,623 213 7.58 10.61 QLD Olives 936 350 2.66 1.82 SA Currants 547 135 4.10 n.a TAS Raspberries 459 191 2.40 0.90 VIC Total
1,989,278 114,820 346.50 0.90 n.a.
Source: ABS Cat No 7113.0
Canberra’s Ecological Footprint
38
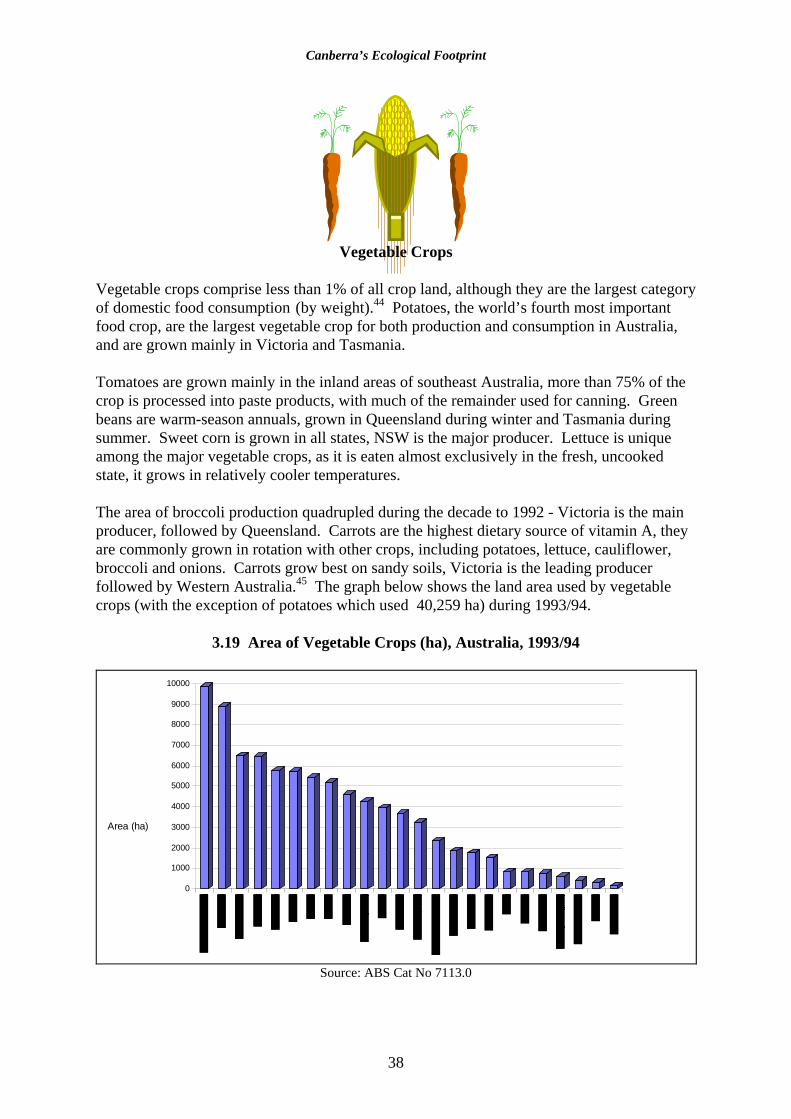
Vegetable Crops
Vegetable crops comprise less than 1% of all crop land, although they are the largest category of domestic food consumption (by weight).44 Potatoes, the world’s fourth most important food crop, are the largest vegetable crop for both production and consumption in Australia, and are grown mainly in Victoria and Tasmania. Tomatoes are grown mainly in the inland areas of southeast Australia, more than 75% of the crop is processed into paste products, with much of the remainder used for canning. Green beans are warm-season annuals, grown in Queensland during winter and Tasmania during summer. Sweet corn is grown in all states, NSW is the major producer. Lettuce is unique among the major vegetable crops, as it is eaten almost exclusively in the fresh, uncooked state, it grows in relatively cooler temperatures. The area of broccoli production quadrupled during the decade to 1992 - Victoria is the main producer, followed by Queensland. Carrots are the highest dietary source of vitamin A, they are commonly grown in rotation with other crops, including potatoes, lettuce, cauliflower, broccoli and onions. Carrots grow best on sandy soils, Victoria is the leading producer followed by Western Australia.45 The graph below shows the land area used by vegetable crops (with the exception of potatoes which used 40,259 ha) during 1993/94.
3.19 Area of Vegetable Crops (ha), Australia, 1993/94
0
1000
2000
3000
4000
5000
6000
7000
8000
9000
10000
Area (ha)
Source: ABS Cat No 7113.0

Canberra’s Ecological Footprint
39
The table below shows production for 1993/94, the land area used and the average Australian yield.46 The average NSW yield is also shown, as this figure is used in Chapter 5 to estimate the ecological footprint for food consumption in Canberra.
3.20 Vegetable Crops - Production, Area and Yields for 1993/94
Vegetables Australian
Production (Tonnes)
Total Area (ha)
Australian Yield (t/ha)
NSW Yield (t/ha)
Main Producing State
Asparagus 7,840 1,778 4.4 6 VIC Beans (french,runner)
30,969 6,499 4.8 2.8 QLD
Beetroot 25,848 812 31.8 32 QLD Broccoli 33,331 5,731 5.8 4.6 VIC Cabbage/Brus Sprt 70,434 2,341 30.1 29.9 VIC Capsicum & peppers 25,889 1,520 17.0 10.7 QLD Carrots 194,839 5,436 35.8 24.7 VIC Cauliflower 75,235 3,678 20.5 23.8 VIC Celery 40,697 814 50.0 40.8 NSW Cucumbers 11,458 767 14.9 7.9 QLD Green Peas (proc) 43,273 9,884 4.4 2.7 TAS Green peas (pod) 1,133 607 1.9 1.5 VIC Lettuce 92,965 3,955 23.5 15.8 VIC Marrow,squash,zucc 12,690 1,858 6.8 5.3 QLD Melons (water) 72,030 4,268 16.9 27.4 QLD Melons(rock) 70,783 3,252 21.8 21.7 QLD Mushrooms 38,889 155 250.9 179 VIC Onions 213,206 5,202 41.0 23.2 TAS Parsnips 6,305 352 17.9 20.4 VIC Potatoes 1,184,705 40,259 29.4 21.2 VIC Pumpkins 82,922 6,449 12.9 14.6 QLD Sweet corn 72,686 5,765 12.6 14.6 NSW Tomatoes 327,221 8,903 36.8 42.3 VIC Turnips/Swedes 6,234 423 14.7 8.9 TAS Other vegetables 4,616 n.a. n.a. n.a. Total
2,741,582 125,324 n.a. n.a. n.a.
Source: ABS Cat No 7113.0
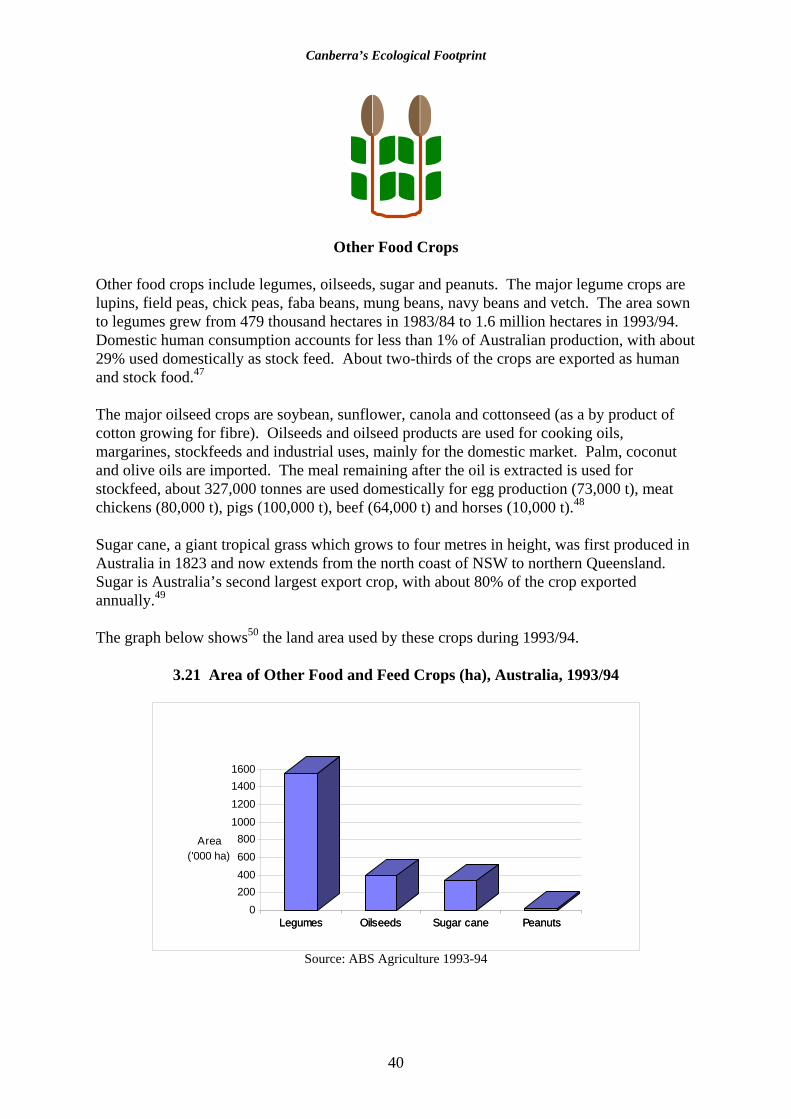
Canberra’s Ecological Footprint
40
Other Food Crops Other food crops include legumes, oilseeds, sugar and peanuts. The major legume crops are lupins, field peas, chick peas, faba beans, mung beans, navy beans and vetch. The area sown to legumes grew from 479 thousand hectares in 1983/84 to 1.6 million hectares in 1993/94. Domestic human consumption accounts for less than 1% of Australian production, with about 29% used domestically as stock feed. About two-thirds of the crops are exported as human and stock food.47 The major oilseed crops are soybean, sunflower, canola and cottonseed (as a by product of cotton growing for fibre). Oilseeds and oilseed products are used for cooking oils, margarines, stockfeeds and industrial uses, mainly for the domestic market. Palm, coconut and olive oils are imported. The meal remaining after the oil is extracted is used for stockfeed, about 327,000 tonnes are used domestically for egg production (73,000 t), meat chickens (80,000 t), pigs (100,000 t), beef (64,000 t) and horses (10,000 t).48 Sugar cane, a giant tropical grass which grows to four metres in height, was first produced in Australia in 1823 and now extends from the north coast of NSW to northern Queensland. Sugar is Australia’s second largest export crop, with about 80% of the crop exported annually.49 The graph below shows50 the land area used by these crops during 1993/94.
3.21 Area of Other Food and Feed Crops (ha), Australia, 1993/94
Legumes Oilseeds Sugar cane Peanuts0
200400600800
1000120014001600
Legumes Oilseeds Sugar cane Peanuts
Area ('000 ha)
Source: ABS Agriculture 1993-94
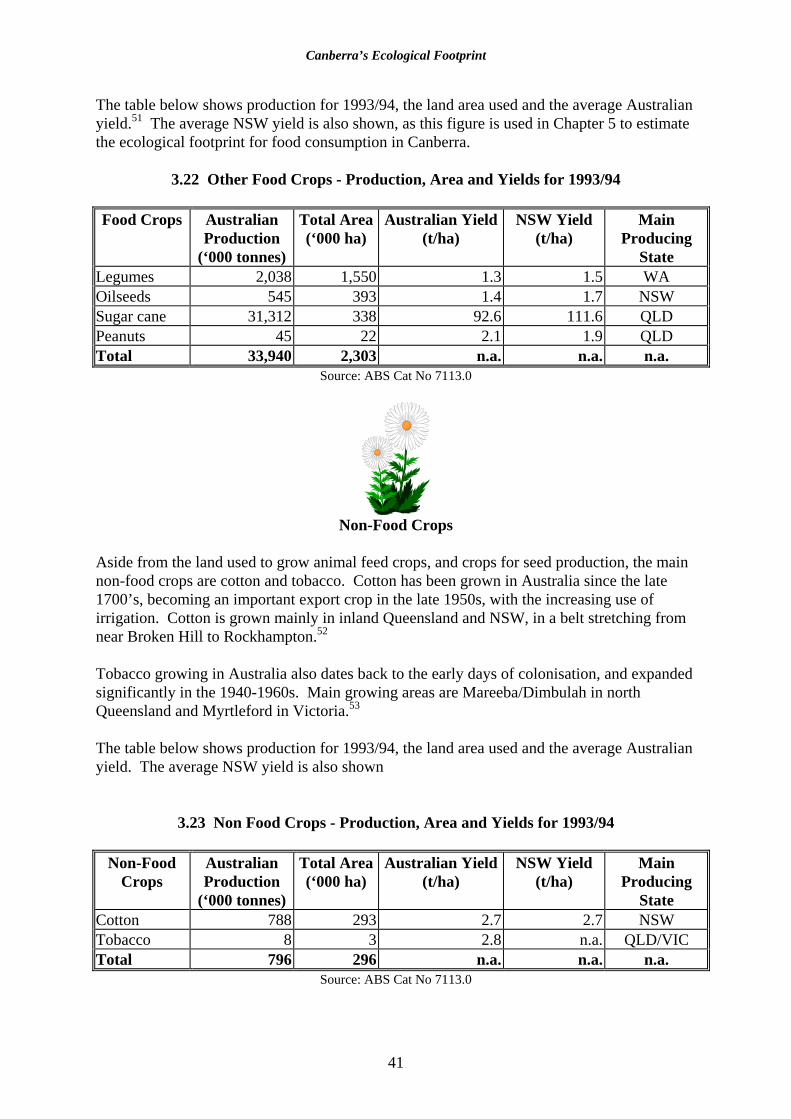
Canberra’s Ecological Footprint
41
The table below shows production for 1993/94, the land area used and the average Australian yield.51 The average NSW yield is also shown, as this figure is used in Chapter 5 to estimate the ecological footprint for food consumption in Canberra.
3.22 Other Food Crops - Production, Area and Yields for 1993/94
Food Crops Australian Production
(‘000 tonnes)
Total Area (‘000 ha)
Australian Yield(t/ha)
NSW Yield (t/ha)
Main Producing
State Legumes 2,038 1,550 1.3 1.5 WA Oilseeds 545 393 1.4 1.7 NSW Sugar cane 31,312 338 92.6 111.6 QLD Peanuts 45 22 2.1 1.9 QLD Total 33,940 2,303 n.a. n.a. n.a.
Source: ABS Cat No 7113.0
Non-Food Crops
Aside from the land used to grow animal feed crops, and crops for seed production, the main non-food crops are cotton and tobacco. Cotton has been grown in Australia since the late 1700’s, becoming an important export crop in the late 1950s, with the increasing use of irrigation. Cotton is grown mainly in inland Queensland and NSW, in a belt stretching from near Broken Hill to Rockhampton.52 Tobacco growing in Australia also dates back to the early days of colonisation, and expanded significantly in the 1940-1960s. Main growing areas are Mareeba/Dimbulah in north Queensland and Myrtleford in Victoria.53 The table below shows production for 1993/94, the land area used and the average Australian yield. The average NSW yield is also shown
3.23 Non Food Crops - Production, Area and Yields for 1993/94
Non-Food Crops
Australian Production
(‘000 tonnes)
Total Area (‘000 ha)
Australian Yield(t/ha)
NSW Yield (t/ha)
Main Producing
State Cotton 788 293 2.7 2.7 NSW Tobacco 8 3 2.8 n.a. QLD/VIC Total 796 296 n.a. n.a. n.a.
Source: ABS Cat No 7113.0

Canberra’s Ecological Footprint
42
GRAZING LAND
Sheep and cattle account for most of Australia’s grazing activity. Stocking rates vary widely, from less than 5 to more than 100 stock per square km, depending on the region. It is only the high rainfall coastal fringes and tablelands of Queensland, NSW and Victoria which support the higher stocking rates. The majority of grazing land in WA, Northern Territory, SA and the western regions of Queensland, NSW and Victoria supports stock numbers of less than 1 animal per hectare.54
This differential in stocking rates has a major impact on the measurement of the ecological footprint. In this report, we have aimed to use the productivity and land use data for production areas closest to the A.C.T. Hence, stocking rates and productivity figures are usually those for NSW. If Queensland and NT stocking rates were used, the ecological footprint for meat and meat products would be several times higher than given in this report. In many stock grazing areas of Australia, native plant and animal species coexist with the stock, this is in contrast to cropping areas, which usually involve almost exclusive use of the crop area. The following table shows the numbers of livestock in Australia in 1993/94.
3.24 Livestock Numbers, Australia, 1993/94
Livestock ‘000 Cattle (beef) 23,100 Cattle (dairy) 2,700 Sheep 132,600 Pigs 2,775 Goats 232 Deer 149 Chickens (for eggs) 12,788 Chickens (for meat) 50,153 Other poultry 1,285 Total 225,782
Source ABS Cat No 4606.0

Canberra’s Ecological Footprint
43
Meat and Meat Products Cattle are raised in all states, with dairy production chiefly confined to the higher rainfall areas, especially the southern and coastal regions. Queensland is the main cattle producing state (38%), followed by NSW (26%) and Victoria (15%). Beef cattle in the Northern Territory and Kimberley areas on very low stocking densities are grazed mainly for export and are increasingly placed in feedlots for “finishing” prior to export production. In 1993/94, 788 thousand tonnes of beef and veal meat were exported. In the south, cattle are usually grazed on improved pastures and are produced mainly for the domestic market. The majority of sheep are found in the sheep/wheat zone which extends from the Darling Down and surrounding areas in Queensland through central NSW to central Victoria and south-eastern SA. NSW is the largest sheep producing state followed by WA and Victoria. Exports of sheep and lamb meat in 1993/94 were 221 thousand tonnes.55 Poultry are produced in intensive, highly mechanised operations, using small land areas and requiring large inputs of energy and grain for feed (in excess of 1.5 million tonnes of prepared poultry feed per year). The industry has grown rapidly from production of 3 million chickens in 1950/51 to 329 million in 1993/94. Most production is consumed domestically, with only about 1.4% of dressed poultry being exported.56 The table below shows production for 1993/94, and the average NSW yield, as this figure is used in Chapter 5 to estimate the ecological footprint for food consumption in Canberra.57
3. 25 Meat and Meat Products - Production and Yields for 1993/94
Meat and Meat Products
Australian Production
(tonnes)
NSW Yield (kg/ha)
Main Producing
State Beef } 1,824,805 158 QLD Veal } 16 QLD Lamb } 674,520 77 NSW Mutton} 43 NSW Bacon, Ham, Pork 480,076 260 n.a. Poultry 503,979 2,709 NSW Other Meat 122,755 300 n.a. Total 3,606,135 n.a. n.a.
Source: ABS Cat. 4306.0
Canberra’s Ecological Footprint
44
Dairy Products and Eggs
Milk production in 1993/94 was 8,070 million litres. Australia’s dairy industry is based almost entirely on pasture, unlike much overseas production which relies on indoor sheltering and hand feeding during the winter months. An average dairy farm is about 183 hectares supporting a dairy herd of 120 milking cows, an average cow produced more than 4,750 litres per year. Victoria is the main dairying state, producing about 60% of the nation’s milk production. About one quarter of milk produced is consumed as liquid milk, the remainder is made into a range of manufactured dairy products, including cheese, butter, powdered and condensed milks, etc. The domestic market for manufactured dairy products accounts for about 30-35%, of the total produced, mainly butter and cheese. About 45% of all milk produced in Australia is exported, mainly as manufactured dairy products. During 1993/94, Australia produced around 143 thousand tonnes of butter of which about 65% was exported. Cheese exports reached 96 thousand tonnes.58 Australia has about 1,000 egg farms which supply supermarkets, grocery and other stores. An average commercial farm consists of 10,000 laying hens. Commercial egg production is about 180 million dozen or 2.34 billion individual eggs per year.59 The table below shows production for 1993/94, and the average NSW yield, as this figure is used in Chapter 5 to estimate the ecological footprint for food consumption in Canberra.60
3.26 Dairy Products & Eggs - Production and Yields for 1993/94
Dairy Products Australian
Production (tonnes)
NSW Yield(kg/ha)
Main Producing
State Whole Milk 1,812,000 12,069 VIC Condensed and Evaporated Milk
106,506 6,035 VIC
Powdered Milk 56,297 1,207 VIC Infants Milk 23,358 500 VIC Cheese 165,820 1,516 VIC Butter 210,600 602 VIC Eggs 13,585 15,228 Various Total n.a. n.a. n.a.
Source: ABS Cat. 4306.0
Canberra’s Ecological Footprint
45
LAND DEGRADATION Most food production relies on the continual extraction of nutrients from the land, this can lead to land degradation. Agricultural systems differ from natural systems, where nutrients are continually recycled through the soils, plants animals and micro-organisms. The following table contrasts agricultural and natural systems.61
3.27 Ecological Differences Between Natural and Agricultural Systems
Natural Systems Agricultural Systems Capture, covert and store energy from the sun Consume fossil fuels and solar energy Consume carbon dioxide and produce oxygen
Consume oxygen and produce carbon dioxide
Create and conserve soil Deplete and diminish soil fertility Purify water and release it gradually Contaminate water and cause excessive runoffProvide a range of wildlife habitat Reduce wildlife habitat Cycle and detoxify waste products Produce pollutants Have the capacity for self renewal Require continual expensive input
Source: Roberts (1995) From the viewpoint of measuring the ecological footprint, land degradation can be seen as land consumed through food production. Australian soils form very slowly (likely to be less than 0.5 tonnes/ha/yr), and are thin - for the most part, organic matter is found only in the top few centimetres, in contrast to nutrient rich soils in Europe and North America, where organic matter can reach to depths of a metre or more.62 Types of land degradation include: wind and water erosion; dryland and irrigation related salinity; acidity; compaction; invasion by weeds and feral animals. The 1992/1993 Agricultural Census found that farmers have estimated that over 16 million hectares of agricultural land is affected by land degradation, as shown in the table below. These figures are used in Chapter 5 to estimate the ecological footprint for food.
3.28 Estimate of Land Degradation, Australia, March 1993 Types of Land Degradation Area Affected
(‘000 ha) Water/wind erosion 3,931 Dryland salinity 1,120 Irrigation related salinity 41 Other degradation (includes acidity, compaction, scalding, weed infestation, feral animal invasion)
11,289
Total 16,381 Source: ABS Cat No 4606.0
Canberra’s Ecological Footprint
46
FOREST LAND
Australia Australia is the world’s least forested continent. Prior to European settlement, 9% of Australia was covered with forest - 40% of that area has been cleared, mainly for agriculture and a further 40% of the remaining forest is affected by logging.63 Native forest covers 41 million ha, of this 16% is in national parks and reserves, 27 % on private land, the remainder is managed by state forest agencies or on vacant or leased Crown land. Almost one million hectares are under plantation, mainly exotic pine species.64 The figure below shows the change in forest cover since 1788.65
3. 29 Change in Forested Land Area (‘000 ha) Australia, 1788-1990.
-40000
-30000
-20000
-10000
0
10000
20000
30000
Tall
clos
edfo
rest
Tall
open
fore
st
Clo
sed
fore
st
Ope
n fo
rest
Woo
dlan
d
Ope
n w
oodl
and
Low
clo
sed
fore
st
Low
ope
n fo
rest
Low
woo
dlan
d
Low
ope
nw
oodl
and
Tall
shru
blan
d
Area('000 ha)
Source: ABS Cat No 4606.0

Canberra’s Ecological Footprint
47
A.C.T. Plantation forests cover about 15,700 ha (approx 7%) of the A.C.T. 66 Most of these forests are Pinus radiata, managed for the production of softwood timber. Around 500-1,000 ha of managed forests are harvested and replanted each year. Since the mid -1970s, no native forests or woodlands have been cleared for pine plantations. Experimental areas (about 290 ha) have been planted with Eucalypts as a possible source of fuelwood. The Australian Forest Industry The Australian forest industry can be divided into three main sectors, export woodchips, domestic pulp and paper making, and sawn timber and panels, as shown below.67
3.30 Sectors of the Australian Forest Industry. EXPORT WOODCHIPS
These are produced from timber from native forests and plantations and also from sawmill wastes, they are not used for manufacture of paper in Australia, but are exported, mainly to Japan. Quantities of export chips are based on quota licences - in early 1990s the annual export quotas was 5.575 million tonnes of hardwood chips, and 400,000 tonnes of softwood chips - most of this from non-plantation native forests.
PULP & PAPER MAKING IN AUSTRALIA
There are 23 pulp and paper mills which use roundwood thinnings, low quality logs, harvesting residues and sawmill waste to produce paper. Australia imports about one-third of paper used for domestic consumption. There are four main types of paper - packaging and industrial papers; newsprint; printing and writing papers; and tissue paper.
SAWN TIMBER AND PANELS
The sawmilling sector consists of mills of various sizes that process hard softwood logs into sawn timber and other products and such as veneers, plywoods, etc About 30% of domestic consumption was from imports (mainly softwoods).
Source: RAC, 1992
Production and Consumption of Forest Products
Australia’s forest estate encompasses 15 major forest groups, including tropical rainforest, native pine forests, dry eucalypts, river red gums and more recently plantations of native and exotic species. Major forests occur along the east coast from Cape York to Tasmania, with the high rainfall, rich soils of the southeast providing the most significant stands. The southwest of WA also has significant native forest cover.
Canberra’s Ecological Footprint
48
The first commercial plantations were established in 1880. Pine plantations expanded dramatically during the 1970s due to incentive schemes provided by governments, and by the 1990s eucalypt and pine plantations are expanding at a rate of around 35,000 ha per year. Eucalypt plantation grown on short rotation (15-25 years) are used largely for producing pulp and paper.68 The table below gives estimates of production, imports, exports and consumption (national and per person) for the range of forest products. Production and consumption are fairly similar for roundwood and panel products.69 The major imports are finished paper products and sawnwood, while large quantities of woodchips are exported to be processed overseas.
3.31 Production and Consumption of Forest Products, Australia, 1993/94
Product/ Forest Type
Production Imports Exports Consumption (Australia)
Consumption (per person)
Sawnwood (‘000m3) (‘000m3) (‘000m3) (‘000m3) (m3) - Broadleaved 1,533 133 19 1,647 0.09- Coniferous 1,898 947 22 2,823 0.16
Total 3,431 1,080 41 4,470 0.25Roundwood (‘000m3) (‘000m3) (‘000m3) (‘000m3) (m3) - Broadleaved 9,793 n.a. n.a. n.a. 0.57- Coniferous 8,970 n.a. n.a. n.a. 0.53
Total 18,763 7,654 6,894 19,523 1.10Panel Products (‘000m3) (‘000m3) (‘000m3) (‘000m3) (m3) - Plywood 138 61 1 198 0.01- Particleboard 828 22 71 779 0.05- Hardboard n.a. 12 1 11 0.00- Fibreboards 421 102 134 390 0.02
Total 1,388 198 209 1,378 0.08Saw/ Veneer Log Imports
(m3) (m3) (m3) (m3)
- Broadleaved n.a. 5,834 n.a. 5,834 n.a.- Coniferous n.a. 302 n.a. 302 n.a.
Total n.a. 6,136 n.a. 6,136 n.a.Paper Products (kt) (kt) (kt) (kt) (kg) - Newsprint 426.1 206.0 0.0 632.1 38.9- Printing/writing 386.0 581.0 45.8 921.2 62.2- Household 169.8 20.3 9.4 180.7 10.5- Packaging/ industrial
1,255.0 235.2 216.4 1,273.8 75.2
Total 2,237.2 1,042.5 271.6 3,008.0 186.8Woodchip Exports
(kt) n.a. n.a. 6,085 n.a. n.a.
Source: ABARE (1995)

Canberra’s Ecological Footprint
49
Forest Land Use Calculating our consumption of forest land is based on estimates of our consumption of the different types of forest products, the forest sources of these products and the growth rates of the different forest types. Forests growth rates vary widely depending on species, topography, climate, soils, available water and nutrients. Plantations generally yield higher rates of wood production due to the input of nutrients (fertilisers), fire and pest management and the short life span or rotation of the trees. Given good conditions, Australian Pinus radiata plantations can yield up to 25 m3 of wood per hectare per year, averaged over the life of the trees. This measurement is known as the Mean Annual Increment (MAI). An average MAI for pine plantations70 is about 12-15 m3. In contrast, native forests on poor soils, with low rainfall and cold winters may have an MAI as low as 2 m3. Clements71 has reported that most of the national consumption of timber products from broadleaved (native) forests is from State Forest areas, although the increasing development of eucalypt plantations is changing this trend. An average MAI of 4 m3 has been estimated for non-plantation native forests. The forests in the Canberra locality are moderately high-yielding pine plantations within the ACT, with average MAIs of up to 20m3, while the nearby native State Forest areas, with cold, dry summers and relatively poor soils may have MAIs of 2-4 m3. The table below shows an estimate of the forest land used per person in the production of forest products. Calculations of these land areas, are based on the following assumptions about the composition of panel products: plywoods - 40% eucalypt / 60% pine; particleboards - 100% pine; hardboard - 100% eucalypt; fibreboards - 100% pine.72 Note that this table does not include the land used for export woodchips, which may be returned to Australia as paper products. These figures are used in Chapter 6 to estimate Canberra’s ecological footprint for housing.
3.32 Forest Land Use, Australia, 1993/94
Forest Type Forest Product Consumption (per person) (m3)
Land Area (ha)
Broadleaved Sawnwood 1,647 412(mainly eucalypts) Roundwood 10,152 2,538
MAI = 4m3 Plywood 79 20 Hardboard 11 3 Sawlog imports (rainf’st) 5,834 1,459 Total 17,723 4,431
Coniferous (pines) Sawnwood 2,823 141MAI = 20m3 Roundwood 9,371 469
Plywood 119 6 Particleboard 779 39 Fibreboards 390 20 Sawlog imports 302 15 Total 13,784 689
Sources: ABARE (1995), Clements (unpub)
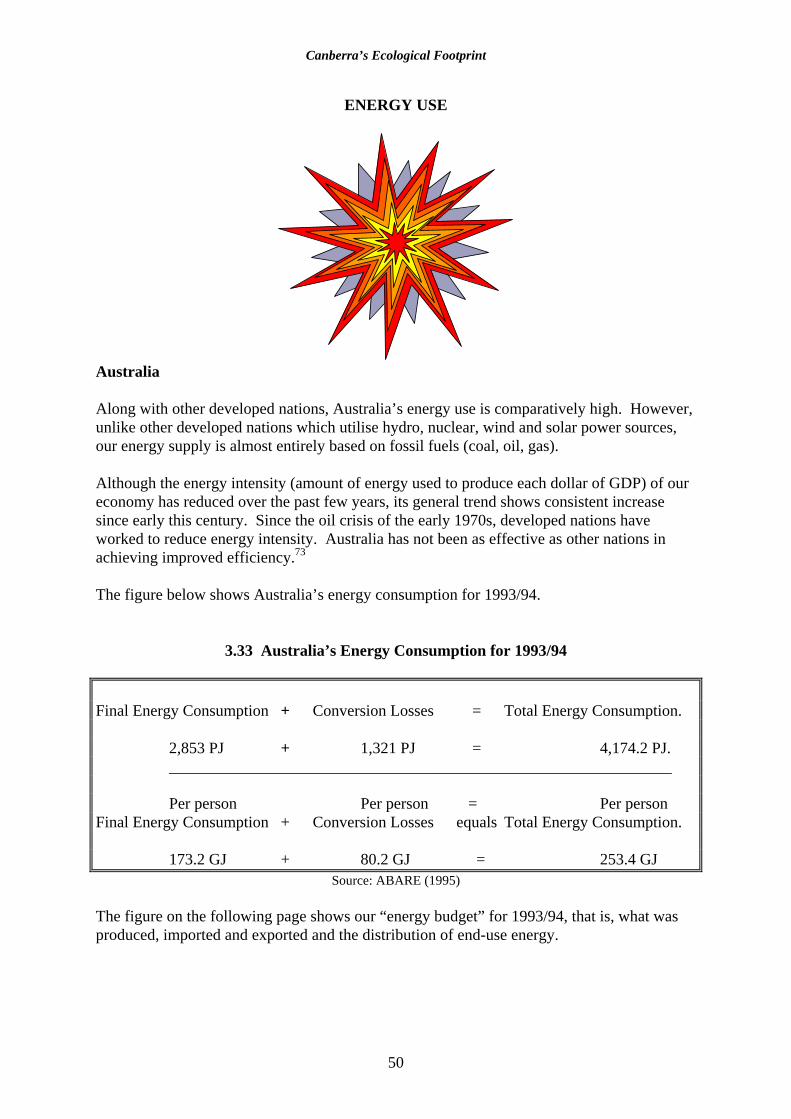
Canberra’s Ecological Footprint
50
ENERGY USE
Australia Along with other developed nations, Australia’s energy use is comparatively high. However, unlike other developed nations which utilise hydro, nuclear, wind and solar power sources, our energy supply is almost entirely based on fossil fuels (coal, oil, gas). Although the energy intensity (amount of energy used to produce each dollar of GDP) of our economy has reduced over the past few years, its general trend shows consistent increase since early this century. Since the oil crisis of the early 1970s, developed nations have worked to reduce energy intensity. Australia has not been as effective as other nations in achieving improved efficiency.73
The figure below shows Australia’s energy consumption for 1993/94.
3.33 Australia’s Energy Consumption for 1993/94
Final Energy Consumption + Conversion Losses = Total Energy Consumption. 2,853 PJ + 1,321 PJ = 4,174.2 PJ. _______________________________________________________________ Per person Per person = Per person Final Energy Consumption + Conversion Losses equals Total Energy Consumption. 173.2 GJ + 80.2 GJ = 253.4 GJ
Source: ABARE (1995) The figure on the following page shows our “energy budget” for 1993/94, that is, what was produced, imported and exported and the distribution of end-use energy.

Canberra’s Ecological Footprint
51
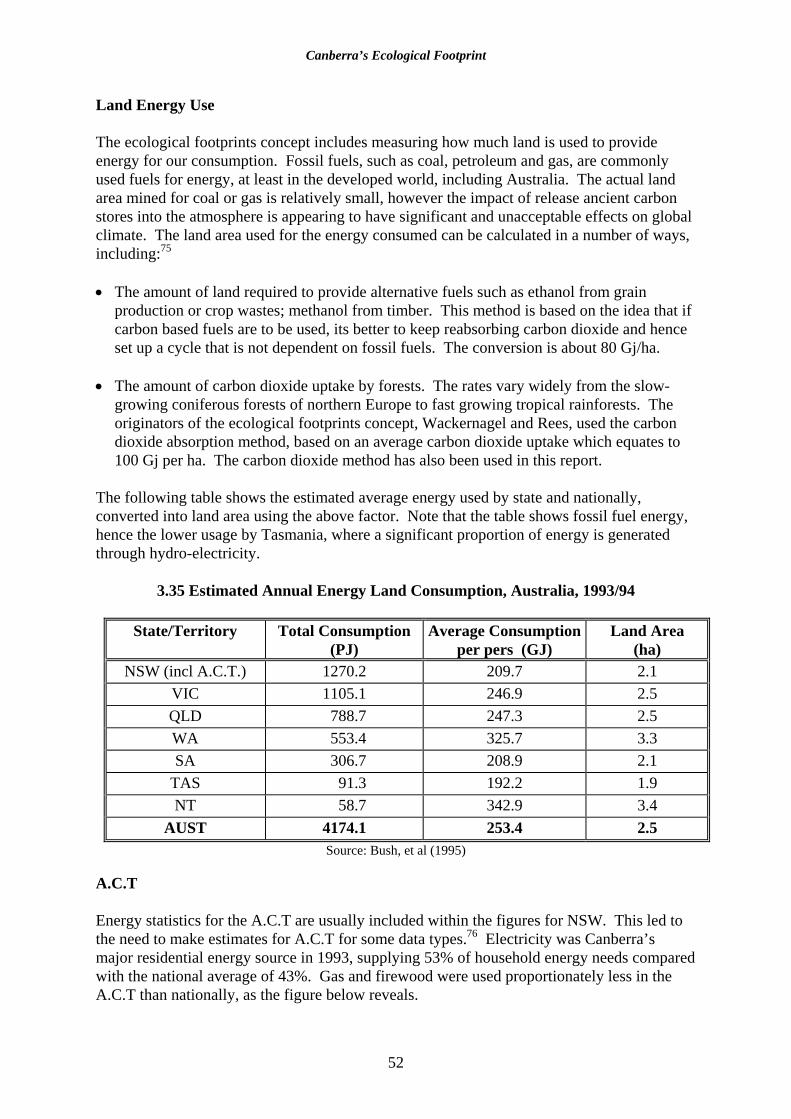
Canberra’s Ecological Footprint
52
Land Energy Use The ecological footprints concept includes measuring how much land is used to provide energy for our consumption. Fossil fuels, such as coal, petroleum and gas, are commonly used fuels for energy, at least in the developed world, including Australia. The actual land area mined for coal or gas is relatively small, however the impact of release ancient carbon stores into the atmosphere is appearing to have significant and unacceptable effects on global climate. The land area used for the energy consumed can be calculated in a number of ways, including:75 • The amount of land required to provide alternative fuels such as ethanol from grain
production or crop wastes; methanol from timber. This method is based on the idea that if carbon based fuels are to be used, its better to keep reabsorbing carbon dioxide and hence set up a cycle that is not dependent on fossil fuels. The conversion is about 80 Gj/ha.
• The amount of carbon dioxide uptake by forests. The rates vary widely from the slow-
growing coniferous forests of northern Europe to fast growing tropical rainforests. The originators of the ecological footprints concept, Wackernagel and Rees, used the carbon dioxide absorption method, based on an average carbon dioxide uptake which equates to 100 Gj per ha. The carbon dioxide method has also been used in this report.
The following table shows the estimated average energy used by state and nationally, converted into land area using the above factor. Note that the table shows fossil fuel energy, hence the lower usage by Tasmania, where a significant proportion of energy is generated through hydro-electricity.
3.35 Estimated Annual Energy Land Consumption, Australia, 1993/94
State/Territory Total Consumption (PJ)
Average Consumption per pers (GJ)
Land Area (ha)
NSW (incl A.C.T.) 1270.2 209.7 2.1 VIC 1105.1 246.9 2.5 QLD 788.7 247.3 2.5 WA 553.4 325.7 3.3 SA 306.7 208.9 2.1
TAS 91.3 192.2 1.9 NT 58.7 342.9 3.4
AUST 4174.1 253.4 2.5 Source: Bush, et al (1995)
A.C.T Energy statistics for the A.C.T are usually included within the figures for NSW. This led to the need to make estimates for A.C.T for some data types.76 Electricity was Canberra’s major residential energy source in 1993, supplying 53% of household energy needs compared with the national average of 43%. Gas and firewood were used proportionately less in the A.C.T than nationally, as the figure below reveals.
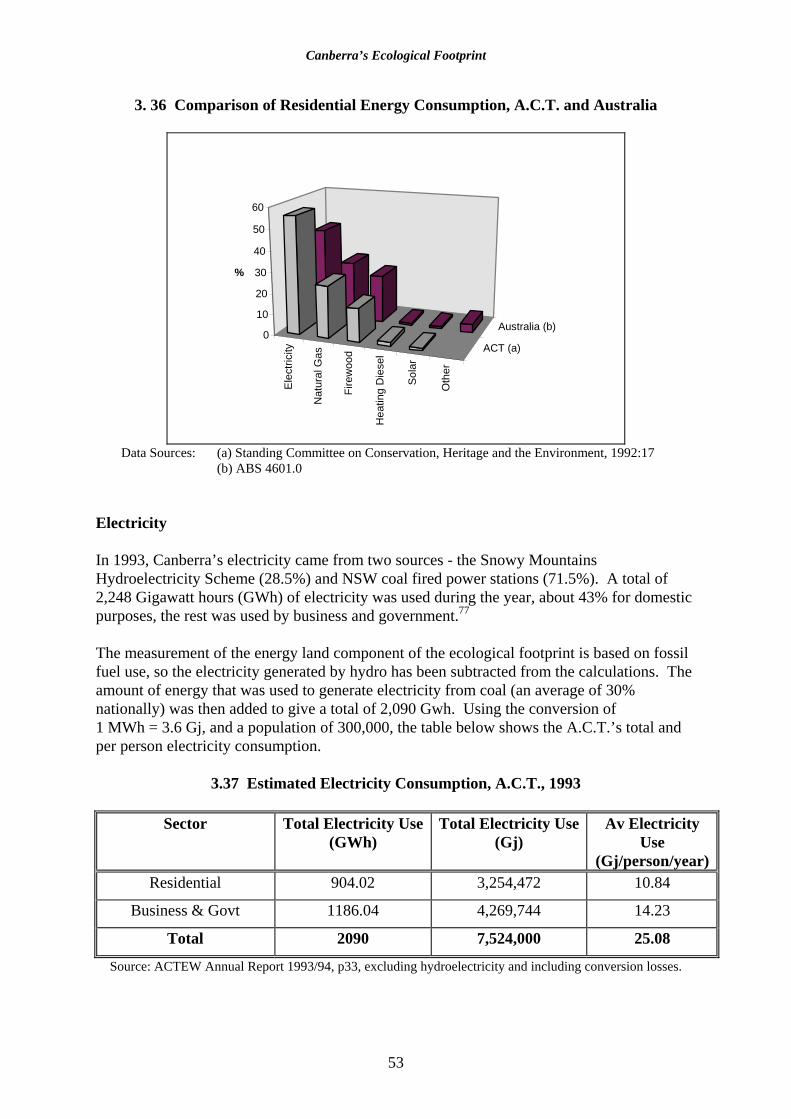
Canberra’s Ecological Footprint
53
3. 36 Comparison of Residential Energy Consumption, A.C.T. and Australia
Ele
ctric
ity
Nat
ural
Gas
Fire
woo
d
Hea
ting
Die
sel
Sol
ar
Oth
er
ACT (a)
Australia (b) 0
10
20
30
40
50
60
%
Data Sources: (a) Standing Committee on Conservation, Heritage and the Environment, 1992:17 (b) ABS 4601.0 Electricity In 1993, Canberra’s electricity came from two sources - the Snowy Mountains Hydroelectricity Scheme (28.5%) and NSW coal fired power stations (71.5%). A total of 2,248 Gigawatt hours (GWh) of electricity was used during the year, about 43% for domestic purposes, the rest was used by business and government.77
The measurement of the energy land component of the ecological footprint is based on fossil fuel use, so the electricity generated by hydro has been subtracted from the calculations. The amount of energy that was used to generate electricity from coal (an average of 30% nationally) was then added to give a total of 2,090 Gwh. Using the conversion of 1 MWh = 3.6 Gj, and a population of 300,000, the table below shows the A.C.T.’s total and per person electricity consumption.
3.37 Estimated Electricity Consumption, A.C.T., 1993
Sector Total Electricity Use(GWh)
Total Electricity Use (Gj)
Av Electricity Use
(Gj/person/year)Residential 904.02 3,254,472 10.84
Business & Govt 1186.04 4,269,744 14.23
Total 2090 7,524,000 25.08
Source: ACTEW Annual Report 1993/94, p33, excluding hydroelectricity and including conversion losses.

Canberra’s Ecological Footprint
54
Gas Natural gas is supplied to Canberra via pressurised pipes from the Momba gas fields in South Australia.78 Around 4.654 petajoules (Pj) of gas was used in the A.C.T. during 1993, about 50% for residential use and 50% was used by government, business and industry.79,80
Based on a population of 300,000, the energy use is shown below:
3.38 Estimated Gas Consumption, A.C.T., 1993
Sector Total Gas Use (Pj)
Av Gas Use (Gj/person/year)
Residential 2.327 7.76
Business & Govt 2.327 7.76
Total 4.654 15.52
Sources: The A.C.T. State of the Environment Report, 1994, p130. Mr Denis White, Natural Gas Company (pers com). Firewood Firewood continues to be burnt for residential heating in Canberra, although its adverse effects on air quality are leading to a gradual decline in use. An estimated 45,000 tonnes of firewood is brought into Canberra each year.81 With an energy component of 16.2 Gj per tonne,82 this gives a 1993 consumption amount of 729,000 Gj (2.43 Gj/per person). Transport Fuels The following table shows transport fuel use for Canberra, during 1993/94 - see Chapter 7 (transport) for the detailed breakdown of fuel types.
3.39 Estimated Transport Fuel Energy Consumption, Canberra, 1993/94
SECTOR PRIVATE PASSENGER
PUBLIC PASSENGER
FREIGHT TOTAL
Total Pj
Per Pers Gj
Total Pj
Per Pers
Total Pj
Per Pers (Gj)
Total Pj
Per PersGj
Road 10.01 33.37 0.60 2.00 3.12 10.40 13.73 45.77
Rail n.a. n.a. 0.05 0.15 n.a. n.a. 0.05 0.15
Air 0.04 0.14 2.54 8.48 0.05 0.15 2.63 8.77
Total 10.10 33.66 3.14 10.48 3.17 10.55 16.41 54.69

Canberra’s Ecological Footprint
55
References and Notes 1. State of the Environment Advisory Council (1996) State of the Environment. Australia. CSIRO
Publishing. Collingwood. Pages 2-4. 2. Australian Bureau of Statistics ABS Cat 1301.0. Canberra. 3. State of the Environment Advisory Council (1996) Pages 10,17. 4. State of the Environment Advisory Council (1996) Page 7 5. Australian Bureau of Statistics (1996) A.C.T. in Focus. ABS Cat 1307.8. Pages 1-2 6. State of the Environment Advisory Council (1996) 7. Australian Academy of Science (1994) Environmental Science. Australian Academy of Science.
Canberra. Page 314. 8. Office of the Commissioner for the Environment (1995) A.C.T. State of the Environment Report.
A.C.T. Government. Canberra. Page 120. 9. A.C.T. Planning Department - pers comm. 10. Office of the Commissioner for the Environment (1995) 11. Lukaszyk, J (unpub) Estimating Canberra’s Ecological Footprint - The Built Environment.
Canberra University Research Project. 12. Office of the Commissioner for the Environment (1995). Page 155. 13. Office of the Commissioner for the Environment (1995). 14. ABS Cat 4601.0. Pages 249-250. 15. Lukaszyk (unpub). 16. ABS Cat 1307.8 17. Lukaszyk (unpub) cites ABS Building Approval Data. 18. Australian Bureau of Statistics (1997) Australian Transport and the Environment. ABS Cat
4605.0. Canberra. Page 123. 19. ABS Cat 4605.0. Page 69. 20. ABS Cat 4605.0. Page 123, cites Engwight. 21. ABS Cat 4605.0. Page 69. 22. Mees, P “Urban Transport and Urban Form” in Diesendorf M and Hamilton C (1997) Human
Ecology, Human Economy. Allen and Unwin. Sydney. 23. Bush, et al, (1995) Australian Energy Consumption and Production: Historical Trends and
Projects to 2009-10. Australian Bureau of Agricultural and Resource Economics. Canberra. Pages 15-17.
24. Office of the Commissioner for the Environment (1995). Page 170. 25. Office of the Commissioner for the Environment (1995). Page164. 26. Mees (1997) cites Newman and Kenworthy 27. Office of the Commissioner for the Environment (1995). 28. NRMA (1997) The Open Road. Sept/Oct 1997. NRMA Open Road P/L. Sydney. 29. State of the Environment Advisory Council (1996). Page 10. 30. State of the Environment Advisory Council (1996). Page 3-34. 31. Marsden-Ballard, D (unpub) Estimating Canberra’s Ecological Footprint - Waste. Canberra
University Research Project. Page 5. 32. Marsden-Ballard, D (unpub). Page 6. 33. Marsden-Ballard, D (unpub). Page 9. 34. Australian Bureau of Statistics (1996). Australian Agriculture and the Environment. ABS Cat
4606.0. Pages22-23. 35. Australian Bureau of Statistics (1992) Australia’s Environment. ABS Cat 4140.0. Page 152. 36. Office of the Commissioner for the Environment (1995), Page 117. 37. ABS Cat 4606.0 38. ABS Cat 4606.0 Pages 28-30. 39. National Farmers Federation (1995) Australian Agriculture. Morescope Publishing P/L.
Hawthorn East. Page 319. 40. Australian Bureau of Statistics (1995) Agriculture 1993-94. ABS Cat 7113.0. Canberra. P 37.

Canberra’s Ecological Footprint
56
41. Australian Bureau of Statistics (1997) Apparent Consumption of Foodstuffs and Nutrients 1993/94, Australia. ABS Cat 4306.0. Canberra.
42. National Farmers Federation (1995) Pages 331-355. 43. ABS Cat 7113.0. Page 46-50. 44. ABS Cat 4306.0. 45. National Farmers Federation (1995). Pages 351-2, 391, 393-4, 408, 410. 46. ABS Cat 7113.0. Page 54-56. 47. National Farmers Federation (1995). Pages 277-284. 48. National Farmers Federation (1995). Pages 285-292. 49. National Farmers Federation (1995). Pages 309-314 50. ABS Cat 4306.0. 51. ABS Cat 7113.0. Page 54-56. 52. National Farmers Federation (1995). Page 258. 53. National Farmers Federation (1995). Page 315 54. ABS Cat 4606.0 55. National Farmers Federation (1995). Pages 153-162 56. National Farmers Federation (1995). Pages 179-184 57. ABS Cat 4306.0. Page 19 58. National Farmers Federation (1995). Pages 123-132. 59. National Farmers Federation (1995). Pages 142-145 60. ABS Cat 4306.0. Page 19 61. Roberts, B (1995) The Quest for Sustainable Agriculture and Land Use. UNSW Press. Sydney.
Page 33 62. ABS Cat 4606.0. Pages 99-100. 63. State of the Environment Advisory Council (1996). Pages 2-25. 64. State of the Environment Advisory Council (1996). Page ES18. 65. ABS Cat 4606.0. Page 119. 66. Office of the Commissioner for the Environment (1995). Page 114 67. Resource Asssment Commission (RAC) (1991) Forest and Timber Inquiry. Final Report. AGPS.
Canberra 68. National Farmers Federation (1995). Pages 265-270. 69. Commonwealth of Australia (1995) Australian Commodity Statistics. Australian Bureau of
Agricultural and Resource Economics. Canberra. Pages 114-132. 70. Ivan Gorman, Forrester at Walca, NSW, pers comm. 71. Clements, R (unpub) An Approximation of Canberra’s Ecological Footprint for Food and Forest
Products. University of Canberra Research Report. 72. Hillis, WE and Brown AG (1978) Eucalypts for Wood Production. CSIRO. Pages 314-321. 73. Hamilton, Neil (1996) Sustainable Energy Policy for Australia: A Resource Conserving
Viewpoint. CSIRO Resource Futures Program. Canberra. Page 4. 74. Bush, et al (1995) Australian Energy Consumption and Production: Historical Trends and
Projects to 2009-10. ABARE. Canberra. Page 48. 75. Wackernagel, M and Rees, W (1996) Our Ecological Footprint, Reducing Human Impact on the
Earth. New Society Publishers. Philadelphia. Pages 71-74 76. Close, A (unpub) Estimating Canberra’s Ecological Footprint - Energy. Canberra University
Research Project. 77. A.C.T. Electricity and Water (ACTEW) (1995) Annual Report. ACT Government. Canberra 78. Office of the Commissioner for the Environment (1994). Page 130. 79. Office of the Commissioner for the Environment (1995).Page 171. 80. Mr Denis White, Natural Gas Company, pers com. 81. Ms Allison Treweek, Canberra University, pers com. 82. Bush et al (1995) Page 48.

Canberra’s Ecological Footprint
57
4. ECONOMICS AND EXPENDITURE, AUSTRALIA AND A.C.T The ecological footprint of an individual, region or nation is closely connected with the amounts of goods and services which are produced, traded and consumed, that is, with economic interactions. Most goods and services are made of a complex combination of resources, with energy used at each stage of production. This chapter includes a range of economic and financial data which can be used to estimate how much we spend on various goods and services as well as data which are useful for comparing the A.C.T economy with that of the wider Australian community.
4.1. The Ecological Footprints Land Types
ENERGY
the energy land - embodied in consumer goods
the energy land - embodied in services
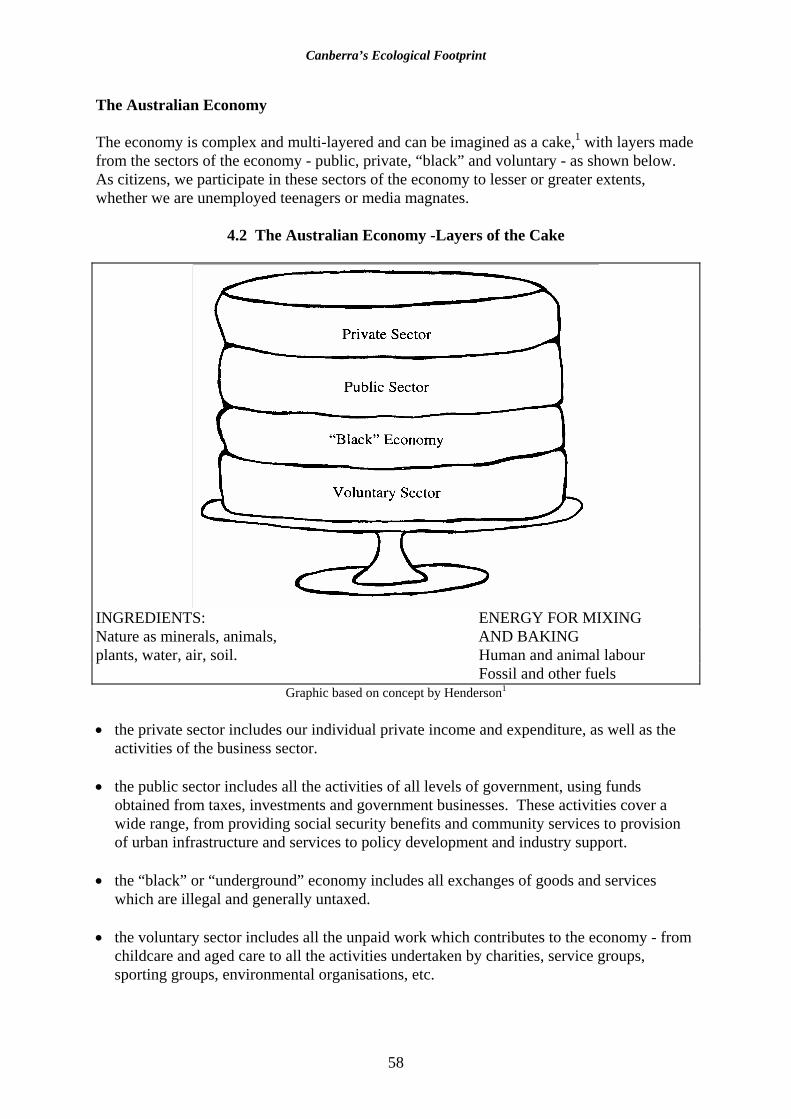
Canberra’s Ecological Footprint
58
The Australian Economy The economy is complex and multi-layered and can be imagined as a cake,1 with layers made from the sectors of the economy - public, private, “black” and voluntary - as shown below. As citizens, we participate in these sectors of the economy to lesser or greater extents, whether we are unemployed teenagers or media magnates.
4.2 The Australian Economy -Layers of the Cake
INGREDIENTS: ENERGY FOR MIXING Nature as minerals, animals, AND BAKING plants, water, air, soil. Human and animal labour Fossil and other fuels
Graphic based on concept by Henderson1
• the private sector includes our individual private income and expenditure, as well as the
activities of the business sector. • the public sector includes all the activities of all levels of government, using funds
obtained from taxes, investments and government businesses. These activities cover a wide range, from providing social security benefits and community services to provision of urban infrastructure and services to policy development and industry support.
• the “black” or “underground” economy includes all exchanges of goods and services
which are illegal and generally untaxed. • the voluntary sector includes all the unpaid work which contributes to the economy - from
childcare and aged care to all the activities undertaken by charities, service groups, sporting groups, environmental organisations, etc.

Canberra’s Ecological Footprint
59
The A.C.T Economy The following graph shows the proportional value of industries in the Australian and A.C.T economies2 for 1993/94. With the Australian Parliament and most of the Commonwealth bureaucracy based in the A.C.T, this sector and services generally, show a higher proportion of value than for the nation as a whole. Similarly, primary industries and manufacturing represent a comparatively low proportion of Canberra’s economy, compared with the national economy.
4.3 Gross State Product (%) by Industry, Australia and A.C.T, 1993/94
ACTAustralia
0
5
10
15
20
25
30
Source: ABS Cat 1307.8
The ratio between Canberra’s import and exports for consumer goods is close to 2:1, as shown in the following table. This further highlights the importance of services in the A.C.T economy.
Canberra’s Ecological Footprint
60
4.4 Imports and Exports, Canberra 1993/94 Import Commodity $’000 Export Commodity $’000 Special transactions & commodities 3,088 Electrical machinery & appliances 2,856Telecommunications & sound equip 2,619 Gold coin 2,689Misc manufactured articles 1,747 Office and data processing machines 1,173Office and data processing machines 862 Misc manufactured articles 616Textile yarn, fabrics, madeup articles 695 Crude animal & vegetable materials 369Electrical machinery & appliances 640 Textile yarn, fabrics, madeup articles 182Professional & scientific instruments 533 Telecommunications & sound equip 147General industrial machinery 436 Specialised machinery 134Clothing and accessories 365 Professional & scientific instruments 105Photographic apparatus & equipment
174 Transport equip incl road vehicles 20
Total 21,745 Total 11,406Source: ABS 1307.8 1996:22,23
Its not surprising that there is a close relationship between employment and economics, with only around 10% of Canberra employees found in the primary industries, manufacturing and construction industries; and the majority employed in services,3 as shown below.
4.5 Employment by Industry, A.C.T, August 1994 Industry Employees ‘000
Agriculture, forestry and fishing 1.2 Mining 0.1 Manufacturing 5.2 Electricity, gas and water supply 1.4 Construction 10.1 Wholesale trade 4.8 Retail trade 19.6 Accommodation, cafes, restaurants 8.0 Transport and storage 4.7 Communication services 2.8 Finance and insurance 3.7 Property and business services 15.4 Government administration and defence 38.5 Education 13.2 Health and community services 12.6 Cultural and recreational services 6.1 Personal and other services 6.8 Total 154.2
Source ABS 1307.8:72
Based on the strong contribution by the service sector to both employment and the economy in Canberra (around 90%), it was decided to include all land consumed by commercial/public buildings, into the services (Chapter 9) rather than the consumer goods (Chapter 8) part of the ecological footprint.

Canberra’s Ecological Footprint
61
Private Household Expenditure In recent years the Australian Bureau of Statistics (ABS) has conducted several national household expenditure surveys, which attempt to record all expenditure across a range of 307 expenditure items by a sample of households in all states. The following graph shows the average annual income and expenditure (per person) for each state and territory in 1993/94. The respective household size for each state has been included in the calculations, Canberra has 2.76 persons compared to the national average of 2.63 persons.4
4.6 Average Annual Income and Expenditure (per person), Australian States/Territories, 1993/94
NSW VIC QLD SA WA TAS NT ACT AUST
AVERAGE INCOME
AVERAGE EXPENDITURE0
5,000
10,000
15,000
20,000
25,000
Source: ABS Household Expenditure Survey 1993/94
The A.C.T has the highest income (36% above the national average) and the highest expenditure (26% above the national average) of all the states and territories, with Tasmania showing the lowest. Canberrans pay a correspondingly high proportion of income tax (70% above the national average) as shown in the more detailed graph on the following page. Note that all Australians appear to be living beyond our means - in all states expenditure exceeds income - by a margin of 12% for the national average. The largest gap between income and expenditure is 19% in Western Australia, while at 3%, the A.C.T has the lowest difference of all the states and territories.
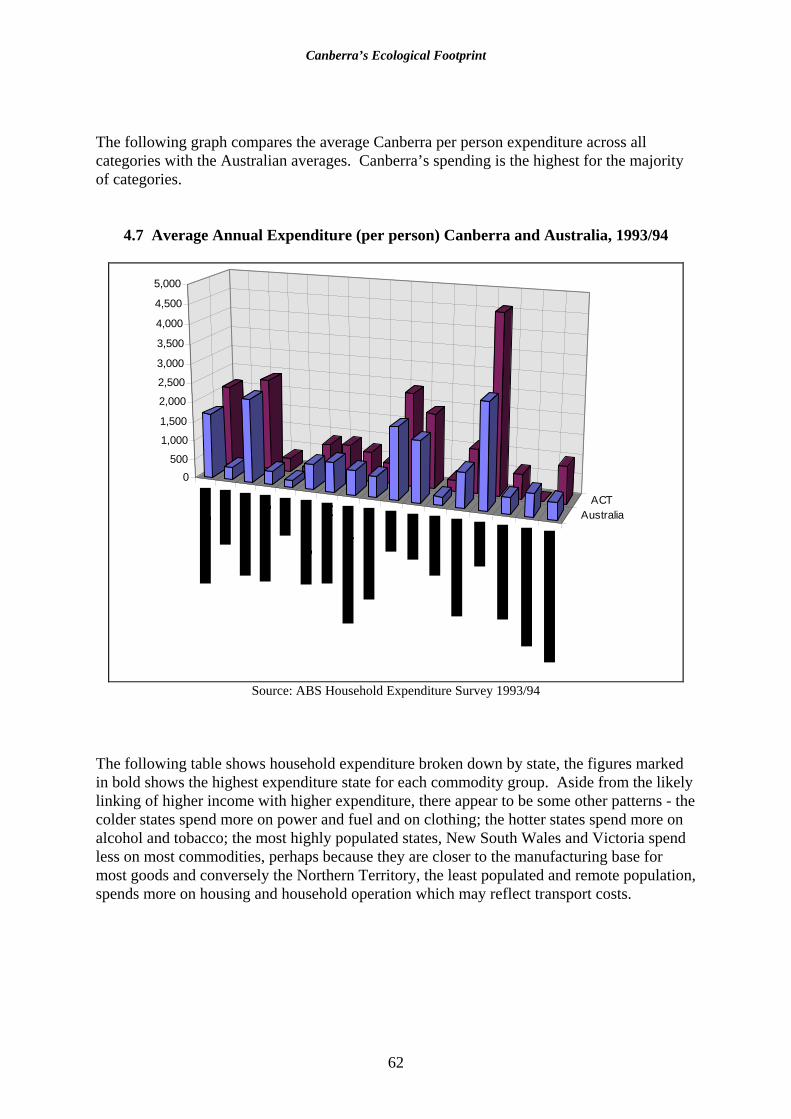
Canberra’s Ecological Footprint
62
The following graph compares the average Canberra per person expenditure across all categories with the Australian averages. Canberra’s spending is the highest for the majority of categories.
4.7 Average Annual Expenditure (per person) Canberra and Australia, 1993/94
AustraliaACT
0500
1,000
1,500
2,000
2,500
3,000
3,500
4,000
4,500
5,000
Source: ABS Household Expenditure Survey 1993/94
The following table shows household expenditure broken down by state, the figures marked in bold shows the highest expenditure state for each commodity group. Aside from the likely linking of higher income with higher expenditure, there appear to be some other patterns - the colder states spend more on power and fuel and on clothing; the hotter states spend more on alcohol and tobacco; the most highly populated states, New South Wales and Victoria spend less on most commodities, perhaps because they are closer to the manufacturing base for most goods and conversely the Northern Territory, the least populated and remote population, spends more on housing and household operation which may reflect transport costs.
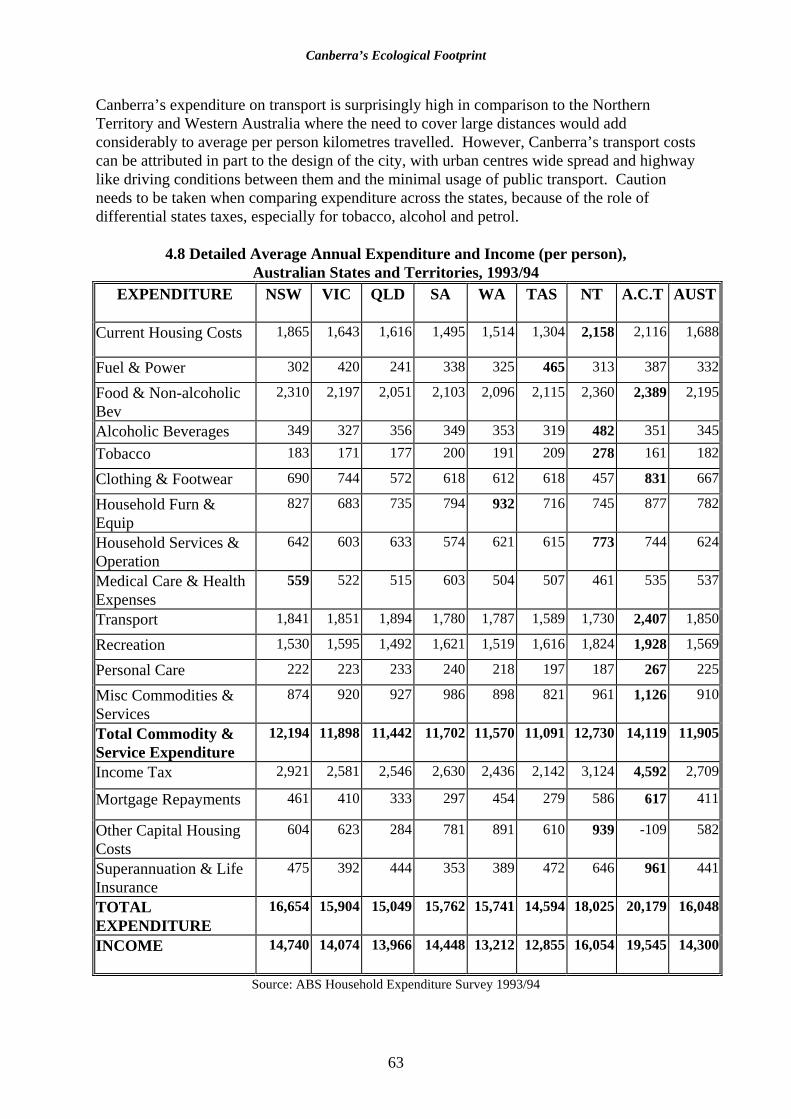
Canberra’s Ecological Footprint
63
Canberra’s expenditure on transport is surprisingly high in comparison to the Northern Territory and Western Australia where the need to cover large distances would add considerably to average per person kilometres travelled. However, Canberra’s transport costs can be attributed in part to the design of the city, with urban centres wide spread and highway like driving conditions between them and the minimal usage of public transport. Caution needs to be taken when comparing expenditure across the states, because of the role of differential states taxes, especially for tobacco, alcohol and petrol.
4.8 Detailed Average Annual Expenditure and Income (per person),
Australian States and Territories, 1993/94 EXPENDITURE
NSW VIC QLD SA WA TAS NT A.C.T AUST
Current Housing Costs 1,865 1,643 1,616 1,495 1,514 1,304 2,158 2,116 1,688
Fuel & Power 302 420 241 338 325 465 313 387 332
Food & Non-alcoholic Bev
2,310 2,197 2,051 2,103 2,096 2,115 2,360 2,389 2,195
Alcoholic Beverages 349 327 356 349 353 319 482 351 345Tobacco 183 171 177 200 191 209 278 161 182
Clothing & Footwear 690 744 572 618 612 618 457 831 667
Household Furn & Equip
827 683 735 794 932 716 745 877 782
Household Services & Operation
642 603 633 574 621 615 773 744 624
Medical Care & Health Expenses
559 522 515 603 504 507 461 535 537
Transport 1,841 1,851 1,894 1,780 1,787 1,589 1,730 2,407 1,850
Recreation 1,530 1,595 1,492 1,621 1,519 1,616 1,824 1,928 1,569
Personal Care 222 223 233 240 218 197 187 267 225
Misc Commodities & Services
874 920 927 986 898 821 961 1,126 910
Total Commodity & Service Expenditure
12,194 11,898 11,442 11,702 11,570 11,091 12,730 14,119 11,905
Income Tax 2,921 2,581 2,546 2,630 2,436 2,142 3,124 4,592 2,709
Mortgage Repayments 461 410 333 297 454 279 586 617 411
Other Capital Housing Costs
604 623 284 781 891 610 939 -109 582
Superannuation & Life Insurance
475 392 444 353 389 472 646 961 441
TOTAL EXPENDITURE
16,654 15,904 15,049 15,762 15,741 14,594 18,025 20,179 16,048
INCOME
14,740 14,074 13,966 14,448 13,212 12,855 16,054 19,545 14,300
Source: ABS Household Expenditure Survey 1993/94
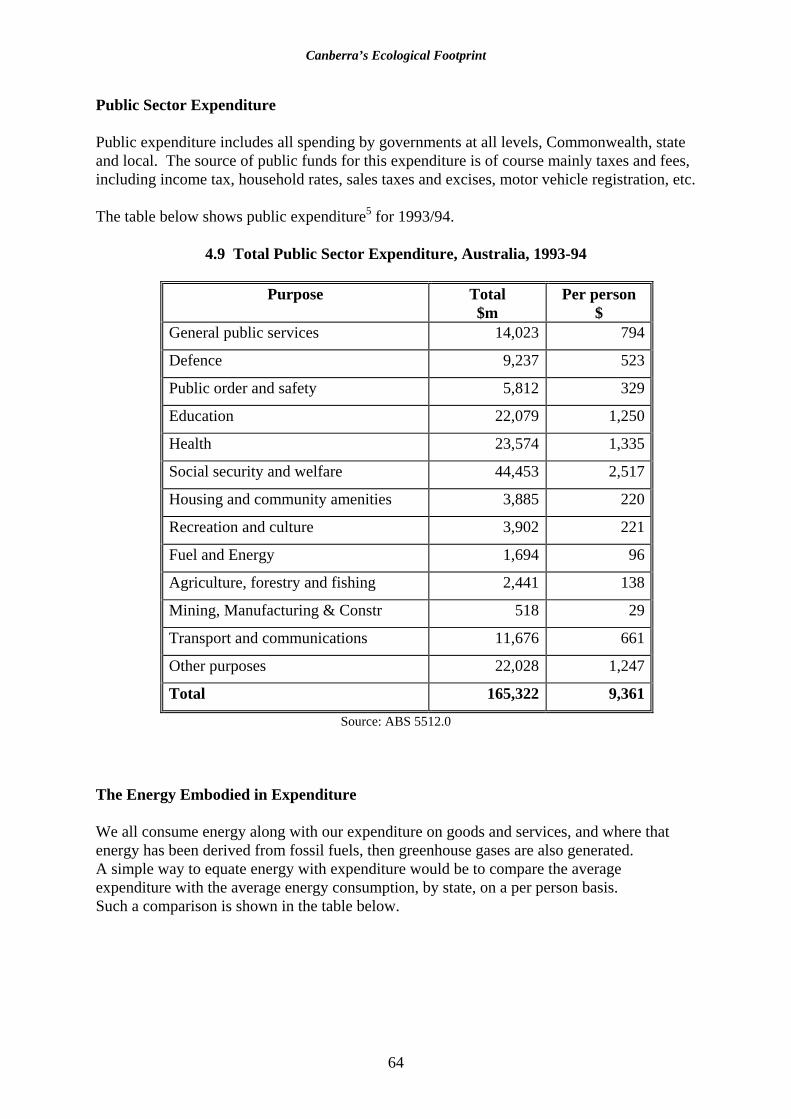
Canberra’s Ecological Footprint
64
Public Sector Expenditure Public expenditure includes all spending by governments at all levels, Commonwealth, state and local. The source of public funds for this expenditure is of course mainly taxes and fees, including income tax, household rates, sales taxes and excises, motor vehicle registration, etc. The table below shows public expenditure5 for 1993/94.
4.9 Total Public Sector Expenditure, Australia, 1993-94
Purpose Total $m
Per person $
General public services 14,023 794
Defence 9,237 523
Public order and safety 5,812 329
Education 22,079 1,250
Health 23,574 1,335
Social security and welfare 44,453 2,517
Housing and community amenities 3,885 220
Recreation and culture 3,902 221
Fuel and Energy 1,694 96
Agriculture, forestry and fishing 2,441 138
Mining, Manufacturing & Constr 518 29
Transport and communications 11,676 661
Other purposes 22,028 1,247
Total 165,322 9,361
Source: ABS 5512.0 The Energy Embodied in Expenditure We all consume energy along with our expenditure on goods and services, and where that energy has been derived from fossil fuels, then greenhouse gases are also generated. A simple way to equate energy with expenditure would be to compare the average expenditure with the average energy consumption, by state, on a per person basis. Such a comparison is shown in the table below.
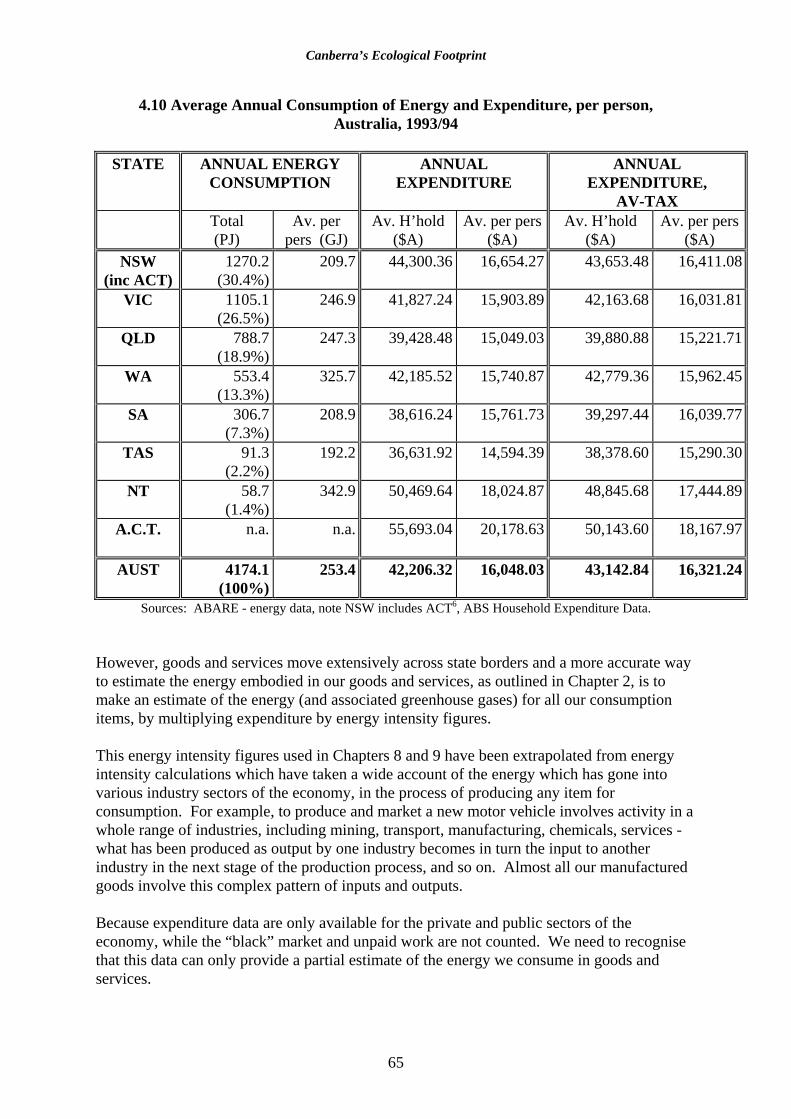
Canberra’s Ecological Footprint
65
4.10 Average Annual Consumption of Energy and Expenditure, per person, Australia, 1993/94
STATE ANNUAL ENERGY
CONSUMPTION ANNUAL
EXPENDITURE ANNUAL
EXPENDITURE, AV-TAX
Total (PJ)
Av. per pers (GJ)
Av. H’hold ($A)
Av. per pers($A)
Av. H’hold ($A)
Av. per pers($A)
NSW (inc ACT)
1270.2 (30.4%)
209.7 44,300.36 16,654.27 43,653.48 16,411.08
VIC 1105.1 (26.5%)
246.9 41,827.24 15,903.89 42,163.68 16,031.81
QLD 788.7 (18.9%)
247.3 39,428.48 15,049.03 39,880.88 15,221.71
WA 553.4 (13.3%)
325.7 42,185.52 15,740.87 42,779.36 15,962.45
SA 306.7 (7.3%)
208.9 38,616.24 15,761.73 39,297.44 16,039.77
TAS 91.3 (2.2%)
192.2 36,631.92 14,594.39 38,378.60 15,290.30
NT 58.7 (1.4%)
342.9 50,469.64 18,024.87 48,845.68 17,444.89
A.C.T.
n.a. n.a. 55,693.04 20,178.63 50,143.60 18,167.97
AUST 4174.1 (100%)
253.4 42,206.32 16,048.03 43,142.84 16,321.24
Sources: ABARE - energy data, note NSW includes ACT6, ABS Household Expenditure Data. However, goods and services move extensively across state borders and a more accurate way to estimate the energy embodied in our goods and services, as outlined in Chapter 2, is to make an estimate of the energy (and associated greenhouse gases) for all our consumption items, by multiplying expenditure by energy intensity figures. This energy intensity figures used in Chapters 8 and 9 have been extrapolated from energy intensity calculations which have taken a wide account of the energy which has gone into various industry sectors of the economy, in the process of producing any item for consumption. For example, to produce and market a new motor vehicle involves activity in a whole range of industries, including mining, transport, manufacturing, chemicals, services - what has been produced as output by one industry becomes in turn the input to another industry in the next stage of the production process, and so on. Almost all our manufactured goods involve this complex pattern of inputs and outputs. Because expenditure data are only available for the private and public sectors of the economy, while the “black” market and unpaid work are not counted. We need to recognise that this data can only provide a partial estimate of the energy we consume in goods and services.
Canberra’s Ecological Footprint
66
References and Notes 1. Henderson, H (1991) Paradigms of Progress: Life Beyond Economics. Adamantine Press
Ltd. London. Page 30. 2. Australian Bureau of Statistics (1996) A.C.T in Focus. ABS Cat No 1307.8. Canberra. 3. Australian Bureau of Statistics (1995) A.C.T in Focus. ABS Cat 1307.8. Canberra. Page 72 4. Australian Bureau of Statistics (1995) Summary of Results: 1993/94 Household
Expenditure Survey. Australia. ABS Cat No 6530.0. Canberra 5. Australian Bureau of Statistics (1996) Government Finance, 1994/95. ABS Cat 5512.0. 6. Bush, et al (1995) Australian Energy Consumption and Production: Historical Trends
and Projects to 2009-10. ABARE. Canberra. Page 11.