Embed Size (px)
Citation preview
Continuous School Improvement – Office of Post-Secondary Readiness - 2014-15 1
CONTINUOUS SCHOOL IMPROVEMENT Root Cause Analysis Primer
DRAFT v2.0

Continuous School Improvement – Office of Post-Secondary Readiness - 2014-15 2
Contents
Learning Outcomes 3
Continuous School Improvement Planning Process Map 4
Data Trends/ Checklist 5 Data Trends Template 6-7 Quality Criteria 8-9
Root Cause Analysis: Background 10-13
Levels of Root Cause 14
Root Cause: Identification Circle Map – Example 15
When is a Cause a Root Cause? 16
Criteria for Narrowing Explanations 17-18
Root Cause Analysis 19
Why … Because Activity 20
Validate Root Causes 21-22
Terminology 23-25
Root Cause Analysis: Toolbox 26-32

Continuous School Improvement – Office of Post-Secondary Readiness - 2014-15 3
Learning Outcomes
□ Identify concerns from performance trends
□ Create Circle Map from site data (listing all possible explanations)
□ Categorize/Sort causes based on the four levels of Root Cause Analysis
□ Questions/Clarify – Is this really a cause?
□ Narrow explanations
□ Why… Because Process
□ Validation of Root Causes
□ Inquiry and CSI Template

Continuous School Improvement – Office of Post-Secondary Readiness - 2014-15 4
Continuous School Improvement Planning Process Map
Review Current
Performance
Describe Performance
Trends
Prioritize Performance Concerns
Identify Root Causes
Set Performance Targets
Identify Solutions and Actions Steps
Identify Measurable Objectives
Identify Implementation Evidence
Preparing to Plan
Data Analysis
Gather and Organize Data
Target Setting
Action Planning
Ongoing: Progress Monitoring

Continuous School Improvement – Office of Post-Secondary Readiness - 2014-15 5
Data Trends/Checklist
v Review written trends:
§ Content area from School Balanced Scorecard (SBS) and data support from
Jump Drives, Growth Reports, Trend Report, or site-based data
§ Identify measures/metrics
§ Which students (grade and disaggregated group)
§ Direction of trend (increasing, decreasing, or stable)
§ Amount of increase, decrease, etc.
§ Time period (ideally at least 3 years)
§ Performance indicator: Academic Growth & Academic Achievement
v Completed Data Trends:
§ Use Quality Criteria to evaluate performance trends (pg. 7)
§ Indicate that your team is ready for a facilitator to provide feedback about your
positive and negative performance trends
v Data Trends in Progress:
§ Finalize Data Analysis
§ Use Performance Data Inventory (pg. Toolkit) to write positive/negative trend statements
§ Identify 2-4 priority concerns
Continuous School Improvement – Office of Post-Secondary Readiness - 2014-15 6
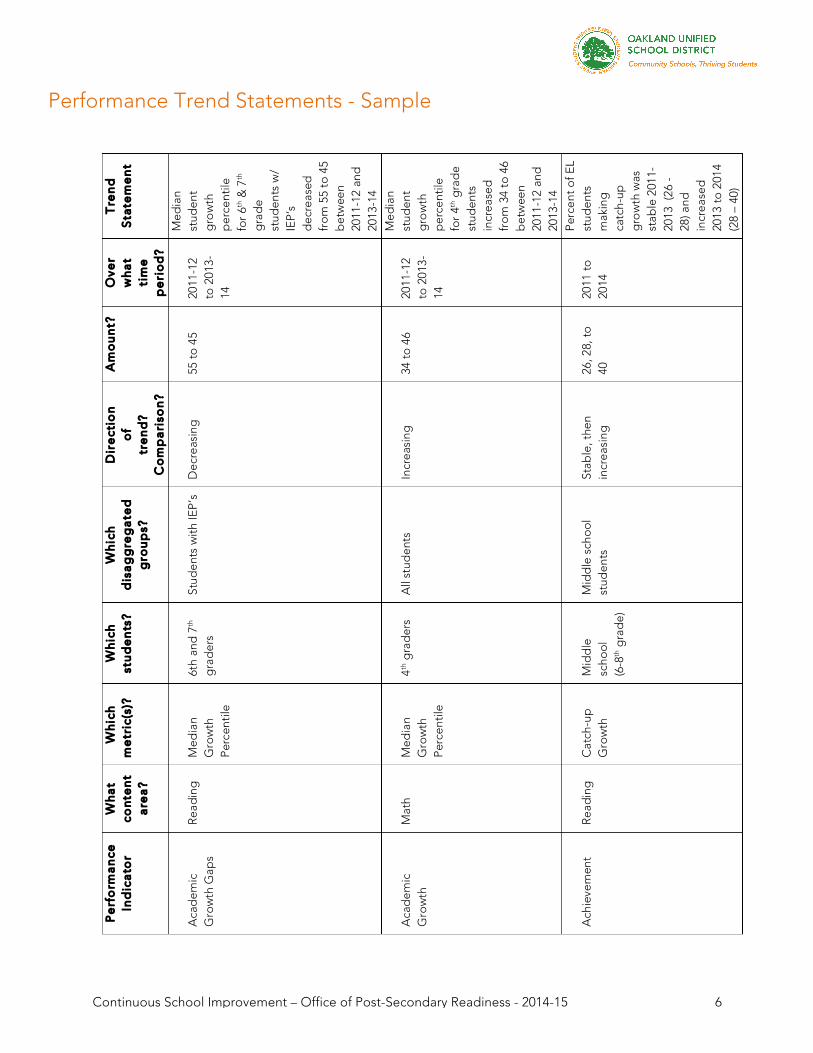
Performance Trend Statements - Sample
Pe
rfo
rma
nce
In
dic
ato
r W
ha
t
con
ten
t
are
a?
Wh
ich
m
etr
ic(s
)?
Wh
ich
st
ud
en
ts?
Wh
ich
d
isa
gg
reg
ate
d
gro
up
s?
Dir
ect
ion
o
f
tre
nd
? C
om
pa
riso
n?
Am
ou
nt?
O
ver
w
ha
t
tim
e
pe
rio
d?
Tre
nd
S
tate
me
nt
Aca
dem
ic
Gro
wth
Gap
s
Rea
din
g
Med
ian
Gro
wth
P
erce
ntile
6th
and
7th
g
rad
ers
Stud
ents
wit
h IE
P’s
D
ecre
asin
g
55 t
o 4
5 20
11-1
2 to
201
3-14
Med
ian
stud
ent
gro
wth
p
erce
ntile
fo
r 6th
& 7
th
gra
de
stud
ents
w/
IEP
’s
dec
reas
ed
fro
m 5
5 to
45
bet
wee
n 20
11-1
2 an
d
2013
-14
A
cad
emic
G
row
th
Mat
h M
edia
n G
row
th
Per
cent
ile
4th g
rad
ers
All
stud
ents
In
crea
sing
34
to
46
2011
-12
to 2
013-
14
Med
ian
stud
ent
gro
wth
p
erce
ntile
fo
r 4th
gra
de
stud
ents
in
crea
sed
fr
om
34
to 4
6 b
etw
een
2011
-12
and
20
13-1
4 A
chie
vem
ent
Rea
din
g
Cat
ch-u
p
Gro
wth
Mid
dle
sc
hoo
l (6
-8th
gra
de)
Mid
dle
sch
oo
l st
uden
ts
Stab
le, t
hen
incr
easi
ng
26, 2
8, t
o
40
2011
to
20
14
Per
cent
of E
L st
uden
ts
mak
ing
ca
tch-
up
gro
wth
was
st
able
201
1-20
13 (
26 -
28
) and
in
crea
sed
20
13 t
o 2
014
(28
– 40
)

Continuous School Improvement – Office of Post-Secondary Readiness - 2014-15 7
Performance Trend Statements - Template
Pe
rfo
rma
nce
In
dic
ato
r W
ha
t
con
ten
t
are
a?
Wh
ich
m
etr
ic(s
)?
Wh
ich
st
ud
en
ts?
Wh
ich
d
isa
gg
reg
ate
d
gro
up
s?
Dir
ect
ion
o
f
tre
nd
? C
om
pa
riso
n?
Am
ou
nt?
O
ver
w
ha
t
tim
e
pe
rio
d?
Tre
nd
S
tate
me
nt

Continuous School Improvement – Office of Post-Secondary Readiness - 2014-15 8
Quality Criteria Plan Element Definition
Criteria
Performance Trends Description of trends for every performance indicator, identified based on analysis of three years of data.
* Makes explicit to which performance indicator/sub-indicator the trend applies, and the direction of the trend (i.e., strengths and challenges). * Specifies performance indicator areas where the school failed to meet district (academic achievement, academic growth, academic gaps, college/career readiness), state/federal targets, or school performance expectations. * Includes analysis of data at a more detailed level than that presented in the Weekly Engagement Report, for example, patterns over time:
o for cohorts of students (3rd grade in one year, 4th grade in the next year, 5th grade in the third year);
o within a grade level (per content area, disaggregated group); o within a disaggregated group of students; and/or o within a content strand (e.g. number sense in mathematics).
* Includes analysis of relevant local performance data. * To the degree that data are available, includes analysis of the performance of all students in the school (e.g., preK-2), and includes performance in subjects not tested by the state.
Priority Concerns (performance challenges) Specific statements about the school’s performance challenges (not statements about budgeting, staffing, curriculum, instruction, etc.), with at least one priority identified for each performance indicator where the school did not meet federal, state and/or local expectations.
* Identifies at least one priority concern (performance challenge) for every indicator (achievement, growth, growth gaps, post- secondary/workforce readiness) for which minimum expectations were not at least met. * Specifies priority-disaggregated groups. Required for LCAP targets or ESEA Federal Waiver targets; recommended for all others. * Identifies priority performance challenges based on analysis of performance trends. * Specifies needs at a more detailed level than that presented in the Weekly Engagement report, for example:
o for cohorts of students (3rd grade in one year, 4th grade in the next year, 5th grade in the third year);
o within a grade level over time (e.g. consistently not meeting expectations in 4th grade mathematics for three years);
o within a disaggregated group of students; and/or o within a content strand (e.g. number sense in mathematics).
* Priority concerns describe the strategic focus for the school considering every sub-indicator for which the school did not meet expectations. Priority concerns do not need to be identified for every sub-indicator (e.g., math achievement, ELL student growth in reading) for which the school did not meet expectations.

Continuous School Improvement – Office of Post-Secondary Readiness - 2014-15 9
Plan Element Definition
Criteria
Root Causes Statements describing the deepest underlying cause, or causes, of performance challenges, that, if dissolved, would result in elimination, or substantial reduction, of the performance challenge(s).
* Identifies one root cause for each priority performance concern (the same root cause could apply to multiple priority performance challenges, and should be listed next to each priority performance challenge to which it applies). * Specifies causes the school can control (e.g., the school does not provide additional support/interventions for students performing at the unsatisfactory level) rather than describing characteristics of students (e.g., race, poverty, student motivation). * Reflects analysis of multiple types of data (in addition to performance data and including local data sources) in the identification of root causes. * For schools with performance that does not meet expectations on a large number, or all of the performance indicators/sub-indicators, explicitly considers broad, systemic root causes.
Priority Concern Examples
• For the past three years, English language learners (making up 60% of the student population)
have had median growth percentiles below 30 in both content areas.
• The percent of fifth grade students scoring proficient or better in mathematics has declined
from 45% three years ago, to 38% two years ago, to 33% in the most recent school year.
• For the past three years, the median growth percentiles in grades 4 through 6 in reading have
been 39 or below, which is less than the minimum District expectation of 46.
Apply Quality Criteria • Use the Quality Criteria for Performance Trends and Priority Concerns (Page 6-7).
• Consider:
o How are the trends and priority concerns similar and/or different from that reflected in
quality criteria?
o How could these sections be improved upon?

Continuous School Improvement – Office of Post-Secondary Readiness - 2014-15 10
Root Cause Analysis: Background Excerpted from: Preuss, P.G. (2003). School Leader’s Guide to Root Cause Analysis: Using Data to dissolve Problems. Larchmont, NY: Eye on Education.
What is “Root Cause”? Rather than assume knowledge of what a root cause is, let’s first look at several definitions:
o From the Savannah River Project (a nuclear power station): Root Cause is “the most basic cause that can reasonably be identified, that we have control to fix, and for which effective recommendations for prevention can be implemented.”
o From Medical Risk Management Associates: Root Causes are “the underlying cause of adverse out comes.”
o From the Joint Commission on Accreditation of Healthcare Organizations: Root Causes are “the basic or casual factors that under lie variation in performance, including the occurrence or possible occurrence of a sentinel (major) event.”
o From Business Solutions—The Positive Way: Root Causes are the “basic cause or causes” of the problem or symptoms.
o From “Total Quality Schools,” by Joseph C. Fields: A Root Cause is “the most basic reason the problem occurs.”
Other organizations differentiate between contributory or proximate causes and root causes. Often, the most immediate or obvious cause is mistakenly identified as the root cause when, instead, it is simply the most proximate contributory cause, which itself has much deeper roots.
Example: Often, blame is first centered on an individual. Although an individual may have indeed committed an error that resulted in a problem, a deeper cause may be found in areas such as: training of the individual, scheduling of the individual, assignment of duties, clarification of duties, supervision, work environment, or anyone of a host of other issues. Most people involved in root cause analysis understand that the vast majority of root causes are system-based rather than individual-based.

Continuous School Improvement – Office of Post-Secondary Readiness - 2014-15 11
For purposes of this primer, the following definition suffices:
Root Cause—the deepest underlying cause, or causes, of positive or negative symptoms within any process that, if dissolved, would result in elimination, or substantial reduction, of the symptom.
Let’s look at this definition again, this time highlighting and commenting on its various essential components:
Root Cause—the deepest underlying cause, or causes, of positive or negative symptoms within any process that, if dissolved, would result in elimination, or substantial reduction, of the symptom.
Deepest—this means that we really have to dig deep to find most roots. They usually are not the most immediate, obvious, or proximate causes. Often, they are three, four, or five layers down into the system.
Example: A high school has a high number of local (general) diploma graduates. However, the state is requiring that 100 percent of graduates have A-G diplomas within a few years. Taking a detailed look at the local diploma recipients, it is found that fully two-thirds either had exceeded A-G diploma requirements or were close to them. Upon further investigation, it is found that guidance counselors, and even the high school principal, communicate to parents and students that the A-G diploma is not necessary for college acceptance or future success. Emphasis is placed on SAT scores instead. In discussions with the counselors and principal, it is found that the system has never placed emphasis on A-G diplomas, and, in fact, the school’s personnel felt they were doing their duty in accordance with what they believed the school system and the community wanted. The district (system) had not communicated this change in goals to its staff.
A few people take issue with the use of the term “root cause” and prefer instead the concept of “causal analysis”. Their reasoning is that the concept of “root cause” came out of an industrial mechanical environment that is not suited to education and that there are usually multiple causes rather than a single root. Obviously, we have chosen to stick with the concept of “root cause”. Regardless of where it was first used, the metaphor works in any context. The concept of “root” implies that we must dig deeply to find cause. The term “causal analysis” facilitates the easy, knee-jerk response of “I know the cause—here it is”, rather than demanding the deep search that is typically required. Cause or causes—School systems are social systems. They are far more complex than either mechanical or biological systems. For this reason, it is often impossible to isolate a single root cause, and often it is possible to identify several causes that in combination bring about a symptom. The good news is that often, by dissolving any one of the multiple root causes, the symptoms can be reduced or even eliminated.

Continuous School Improvement – Office of Post-Secondary Readiness - 2014-15 12
Models and examples: Think of the fire triangle. It takes three elements to make a fire: a source of combustion, oxygen, and a source of fuel. Take any one of the three away and a fire cannot start or continue to burn. Often, an air crash is the result of the convergence of separate events that in and of themselves would not have caused an accident but when placed in combination result in a disaster. It has been found, in some instances, that a student can “survive” any one deficient process within a school but that when faced with two, three, or more, the student quickly falls behind.
Positive or negative—Our successes, as well as our failures, have root causes. By studying the roots for our successes, we may find strategies that can be applied to improving all of our processes.
Example: A school district successfully implements the IBM program “Writing to Read.” In looking back at its experience, the district identifies the following strategies as contributory to the program’s success: direct faculty involvement and agreement in adopting the program; “by the book” training, staffing, and assignment of resources in support of the program; benchmarking and adaptation of a model from another successful school; thorough parent information; and continuous administrative involvement and encouragement. Can these strategies be applied to future programs? You bet!
Symptoms—In dealing with problems, symptoms are found at the surface. They are the red flag that draws attention to the issue. A symptom is usually a noticeable gap between expectations and reality.
Example: A school district has a very high failure rate in ninth grade. Expectations are that most students will successfully transition from middle school to high school. The reality is that over 50 percent of all freshmen fail at least one course during the year. The failure rate is the “red flag” as well as a symptom of deeper underlying causes. In order to eliminate the symptom, the deeper underlying root causes have to be dissolved.
Process—All work is process. A simple process has a minimum of three elements: a) input, b) added value, and c) output.
Example: Writing (and mailing) a letter is a process. It has certain elements of input, such as blank paper, a blank envelope, a pen, a stamp, a source for the address as well as concepts to be placed in the letter as content. Then there is the value added process of actually composing and writing the letter followed by the physical mailing of the previously isolated elements as a single product. The output is both the physically completed letter and the communication it contains. Once we can identify the input, value added, and the output, we can identify the process. Schools are composed of hundreds of processes—two of the large umbrella processes are teaching and learning.

Continuous School Improvement – Office of Post-Secondary Readiness - 2014-15 13
Dissolve—We have to concentrate on dissolving the root rather than “fixing” the symptom with a patch. Once the root is dissolved, the symptom will go away of its own accord. Patches just add complexity and cost to the system. Some people think that much of what we do in school is patching.
Example: A school district was faced with a very high number of out-of-school suspensions. Its solution to the problem was to implement an in-school suspension program. This resulted in space, staff and energy being assigned to what essentially was a patch on the system. They never looked at causes for the suspensions in order to substantially reduce or eliminate them.
Perhaps this is more than you ever wanted to know about the definition of root cause. Hopefully, however, it provides an adequate foundation upon which to move forward and will make some of what follows easier to understand. One more time:
Root Cause—the deepest underlying cause, or causes, of positive or negative symptoms within any process that, if dissolved, would result in elimination, or substantial reduction, of the symptom.

Continuous School Improvement – Office of Post-Secondary Readiness - 2014-15 14
Levels of Root Cause Root Causes can be found at any one of the following levels:
Incident or procedural level: Example: A fight in the cafeteria, fifth period on Wednesday. • The student
• The test
• The teacher
• The incident
Programmatic level: Example: There are always fights in the cafeteria, every day, every period. • Instructional processes
• Materials
• Setting
• Time
• Alignment
• Grouping
• Scheduling
• Training and staff development
• Administrative procedures
• Curriculum assessments
Systemic level: Example: There are fights everywhere in the school. • Leadership
• Mission / Vision
• Priorities
• Morale
• Planning
• Budget
• Policies
• Values / Beliefs
• Organizational Structure
• Allocation of culture
• Staff
• Facilities
• Technologies
• Competencies
• Collaboration
• Evaluation
• History
• Capacity
External level: Example: The whole community is fighting. • Family
• Community
• Gangs
• Wealth / Poverty
• Health
• Partnerships and supporting agencies
• The media
• Youth culture
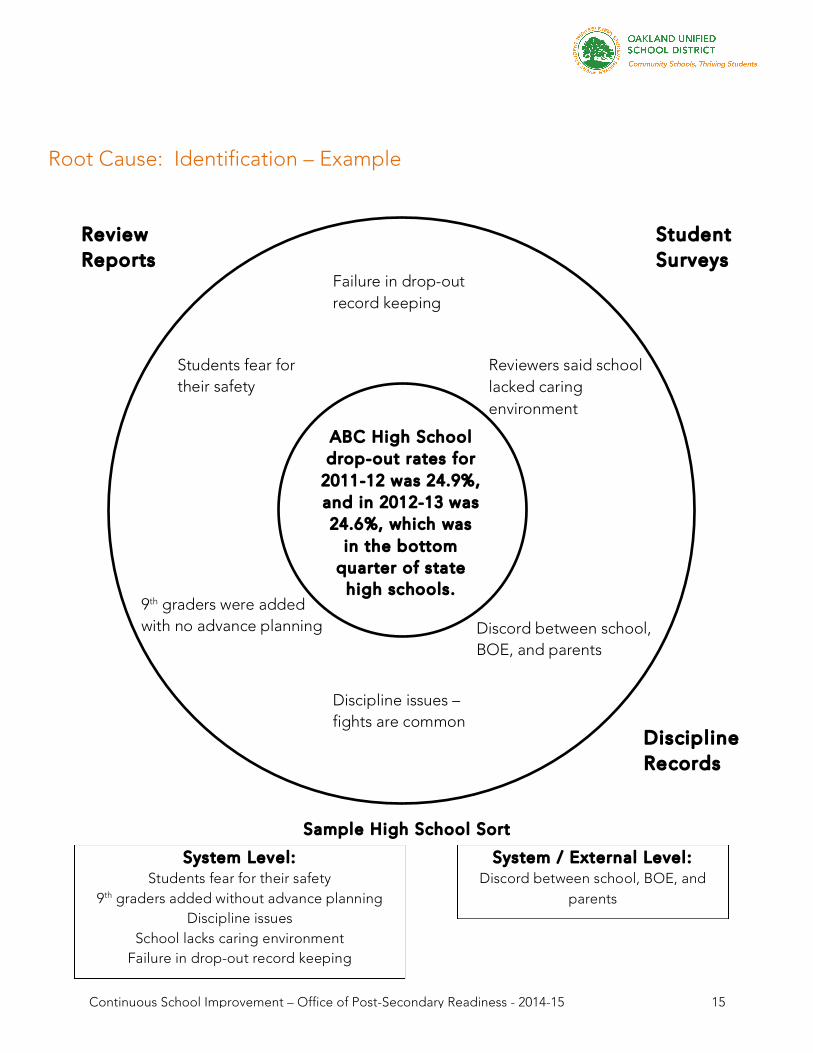
Continuous School Improvement – Office of Post-Secondary Readiness - 2014-15 15
Root Cause: Identification – Example
Sample High School Sort
Students fear for their safety
9th graders were added with no advance planning
Reviewers said school lacked caring environment
Discord between school, BOE, and parents
Discipline issues – fights are common
Failure in drop-out record keeping
Review Reports
Student Surveys
Discipline Records
ABC High School drop-out rates for
2011-12 was 24.9%, and in 2012-13 was 24.6%, which was
in the bottom quarter of state
high schools.
System Level: Students fear for their safety
9th graders added without advance planning Discipline issues
School lacks caring environment Failure in drop-out record keeping
System / External Level : Discord between school, BOE, and
parents

Continuous School Improvement – Office of Post-Secondary Readiness - 2014-15 16
When is a Cause a Root Cause? In complex social systems, such as schools, it may be difficult, if not impossible, to identify a single, specific, root cause. Often, there are clusters of causal factors that each contributes to the problem. Sometimes, dissolution of any one of the casual factors is sufficient to substantially reduce or totally eliminate the problem. The following concepts provide some direction in identifying root causes or clusters of causal factors.
Ammerman has identified three criteria to determine if each identified cause is a root cause or if it is a
contributing cause. They are:
1 . Would the problem have occurred if the cause had not been present?
If no, then it is a root cause. If yes, then it is a contributing cause.
2. Will the problem reoccur as the result of the same cause if the cause is
corrected or dissolved?
If no, then it is a root cause. If yes, then it is a contributing cause.
3 . Will correction or dissolution of the cause lead to similar events?
If no, then it is a root cause. If yes, then it is a contributing cause. Other indicators that you have found the root cause are: • You run into a dead end asking what caused the proposed root cause.
• Everyone agrees that this is a root cause.
• The cause is logical, makes sense, and provides clarity to the problem.
• The cause is something that you can influence and control.
• If the cause is dissolved, there is realistic hope that the problem can be reduced or prevented in
the future. School improvement teams and others using root cause analysis often wonder when to stop seeking cause and make the decision that sufficient data and effort have been used to arrive at a reasonable root. This is often a judgment call that will improve with experience. Often, the lack of data and the pressures of time frustrate the effort and force it to halt at a level below the surface symptom, but perhaps not as deep as it must ultimately go. This is the reality of life in a less-than-perfect world. Using the above guidance and common sense, however, teams can usually arrive at a proximate area of cause or causes that if dissolved, or reduced, will remedy or reduce the symptom. Teams, however, should not allow timidity or fear to block deeper discovery of issues that may be related to culture or deeper organizational elements.

Continuous School Improvement – Office of Post-Secondary Readiness - 2014-15 17
Criteria for Narrowing Explanations
After your planning team has generated explanations of the performance data, and before you
begin planning next steps, it’s a good idea to check your thinking again. Below are indicators
and critical questions to help you get to the best possible explanations.
Step 1: El iminate explanations that are not within our control First, your team needs to eliminate explanations that do not lie within the control of your
school/district and put these explanations aside. The following questions could help with this
process.
• Over what do we believe we have control (e.g., students completing homework, parents
supporting their students, etc.)?
• What factors are beyond our influence?
• Would others agree? Are we thinking too broadly, too narrowly, or accurately?
Step 2: Evaluate the quality of your explanations (reach consensus on which ones to keep)
The following criteria can be applied by your team to evaluate the current list of explanations and to
whittle your list down to the best thinking available across the team. Use the questions below each
criterion to help check the thinking of your team. Eliminate explanations that fail to meet these
criteria. Criterion: The explanation derives logically from the data • Can we articulate the connection(s) we see between the data and our explanation(s)?
• Does our explanation reflect a genuine situation, but one that is not related to this data?
• Can we tell the story of how our explanation could lead to the patterns we see in our data?
Criterion: The explanation is specif ic enough to be testable • Is the language specific enough to be clear to someone who was not part of our discussion?
• Are there any vague terms?
• Can we describe how we would test the explanation?
Criterion: The explanation is plausible • Does any research support this thinking?
• If we base any planning steps on this explanation, do we anticipate meaningful results?

Continuous School Improvement – Office of Post-Secondary Readiness - 2014-15 18
Step 3: Clarify the language used in your explanations Consider the following questions to clarify remaining explanations.
• Do our explanations make sense to someone else reading or hearing them for the first time?
• Is our explanation complex enough to help us to better understand a complex situation?
• What other questions do our explanations lead us to in order to make the picture more complete?
• Does this explanation identify an area of concern?

Continuous School Improvement – Office of Post-Secondary Readiness - 2014-15 19
Root Cause Analysis A critical stage of the inquiry process focuses on root causes and solutions for the performance concerns and key strengths. This stage begins with root causes analysis , which is the single most important element in the planning process as it correctly identif ies the reasons behind the performance concerns and key strengths. A well-written plan that is not based on accurate reasons for identified concerns and key strengths will not provide the staff with the necessary map to identify appropriate solutions and create action plans designed to increase achievement. Root Cause Analysis (RCA) is a method of problem solving designed to uncover the deepest root and most basic reasons for identified concerns. RCA helps schools to correctly identify the true problems rather than addressing symptoms. The most challenging aspect of RCA is the abil ity of the staff and its administration to be open and honest in a safe, collaborative environment. This climate will foster true examination of causes, which may be uncomfortable, including issues of climate, organization, and instructional quality. This is an important step in reaching the root of the problem impacting student achievement and the achievement gap between subgroups. RCA, in combination with performance concern and key strength identification, is the most critical component in school improvement. It is the foundation for the School Site Planning. Although time constraints are a reality for school improvement teams, data analysis and the process of inquiry are well worth the time. Rather than relying on assumptions, anecdotal information, and/or teacher perceptions that name symptoms of problems, the true root causes must be identified. The climate and culture in a school is critical to the staff’s ability to delve into deeper levels of analysis like RCA. A school where staff members are supported and encouraged to take responsibility for success and failure empowers all key stakeholders to take risks and work as a team to create effective solutions to address student learning. Schools that have had a lack of student achievement for several years wil l more than l ikely need to address school culture issues through some form of team building before they can let go of the past and move forward with a fresh new approach. The first step in this process is to identify performance concerns based on analysis of multiple data sources. It is important that teams analyze multiple sources of data, data tr iangulation , to val idate concerns. Data triangulation is one methodology that can be used to determine the root cause of the problem. Ideally, planning teams should use at least three sources of data to identify each concern.

Continuous School Improvement – Office of Post-Secondary Readiness - 2014-15 20
How to Identify Roots Causes:
• Focus on closely related performance concerns.
• If an external review (i.e., SQR) has been done in the school, then consider the findings of the review. If not, consider the categories of factors that typically cause performance concerns.
• Brainstorm possible explanations (causes) for the performance concerns using the fishbone chart. (See below)
• Categorize like causes together.
• Narrow the explanations to those that are actionable, which includes removing items outside of the school’s control.
• Deepen the thinking to ensure the causes are “root causes” by using the “Why… Because” chart or the enhanced questions below.
• Verify root causes with multiple data sources to ensure improvement strategies and action steps align with the root cause of performance concerns. They should be the deepest and most basic reason, within the school’s control, evidence based, and focused on the adult actions of the leaders and teachers.

Continuous School Improvement – Office of Post-Secondary Readiness - 2014-15 21
Questions to Help Validate Root Causes:
1. What is the proof that this cause exists? Is it concrete? Is it measurable? Are there more than two data elements that provide evidence?
2. What is the proof that this cause could lead to the stated effect? Am I merely asserting causation?
(Ex. If a program is identified as the reason students are not achieving, is there evidence that it is not aligned to tested and taught curriculum? Have students spent the majority of the allotted instructional time using this program?)
3. What proof is there that this cause actually contributed to the problem? Given that it exists and could lead to this problem, how do I know it was not actually something else?
4. Is anything else needed, along with this cause, for the stated effect to occur? Is it self-sufficient? Is something else needed?
(Ex. Are Special Education student schedules the only problem that prevents them from grade level curriculum exposure, or is there another key factor, perhaps the level of experience of teacher to scaffold instruction to meet the needs of all learners?)
5. Can anything else, besides this cause, lead to the stated effect? Are there alternative explanations that fit better? What other risks are there?

Continuous School Improvement – Office of Post-Secondary Readiness - 2014-15 22
Continuous School Improvement – Office of Post-Secondary Readiness - 2014-15 23
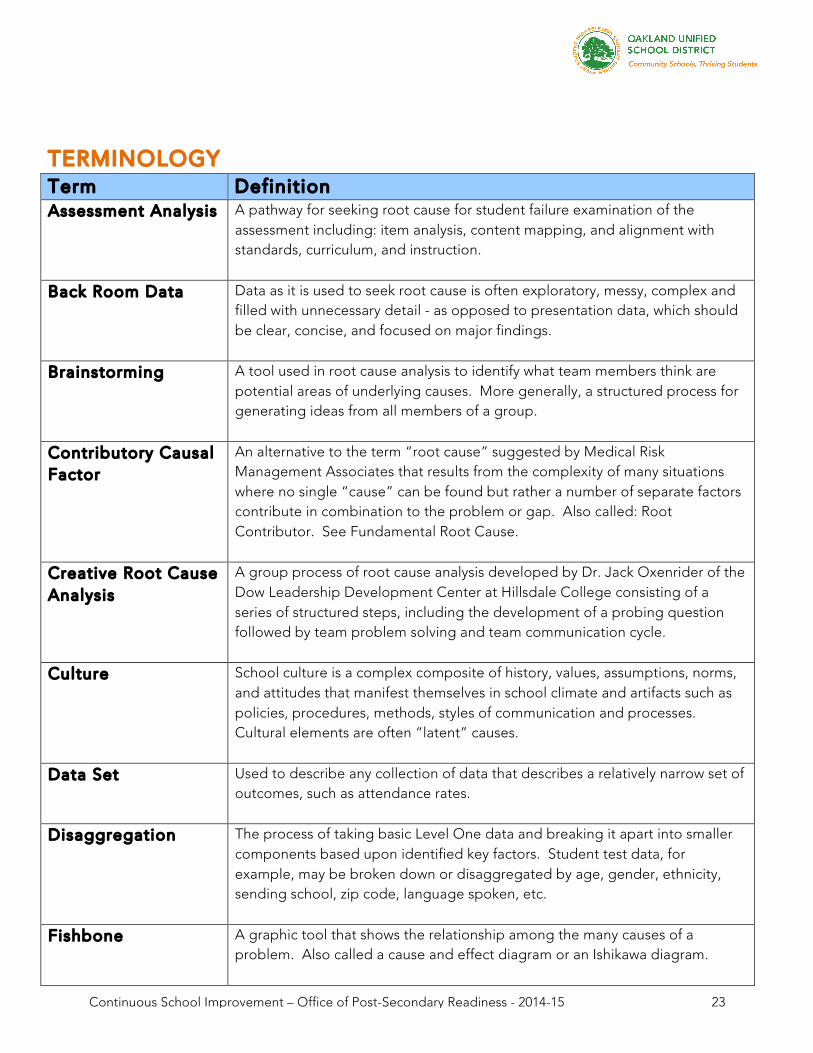
TERMINOLOGY Term Definition Assessment Analysis A pathway for seeking root cause for student failure examination of the
assessment including: item analysis, content mapping, and alignment with standards, curriculum, and instruction.
Back Room Data Data as it is used to seek root cause is often exploratory, messy, complex and filled with unnecessary detail - as opposed to presentation data, which should be clear, concise, and focused on major findings.
Brainstorming A tool used in root cause analysis to identify what team members think are potential areas of underlying causes. More generally, a structured process for generating ideas from all members of a group.
Contributory Causal Factor
An alternative to the term “root cause” suggested by Medical Risk Management Associates that results from the complexity of many situations where no single “cause” can be found but rather a number of separate factors contribute in combination to the problem or gap. Also called: Root Contributor. See Fundamental Root Cause.
Creative Root Cause Analysis
A group process of root cause analysis developed by Dr. Jack Oxenrider of the Dow Leadership Development Center at Hillsdale College consisting of a series of structured steps, including the development of a probing question followed by team problem solving and team communication cycle.
Culture School culture is a complex composite of history, values, assumptions, norms, and attitudes that manifest themselves in school climate and artifacts such as policies, procedures, methods, styles of communication and processes. Cultural elements are often “latent” causes.
Data Set Used to describe any collection of data that describes a relatively narrow set of outcomes, such as attendance rates.
Disaggregation The process of taking basic Level One data and breaking it apart into smaller components based upon identified key factors. Student test data, for example, may be broken down or disaggregated by age, gender, ethnicity, sending school, zip code, language spoken, etc.
Fishbone A graphic tool that shows the relationship among the many causes of a problem. Also called a cause and effect diagram or an Ishikawa diagram.

Continuous School Improvement – Office of Post-Secondary Readiness - 2014-15 24
Term Definition Five Whys, The A simple process used to seek root cause by asking “Why” five times in
succession.
Fundamental Root Cause
The deepest cause or causes that can be found—most often located at the systems level.
Immediate Cause The most immediate, obvious or superficial cause of a problem. Usually located close to the event. A “proximate cause.”
Levels of Roots Cause
Root causes can be found at ever deeper layers of the school. Levels include: the incident, program, whole system, and external causes.
Level One Data The initial aggregated data set, prior to disaggregation or further analysis. Used to identify “red-flag” issues. Exp: Weekly Engagement Report
Level Two Data A deeper data set, usually a disaggregation of an initial set of aggregated data. As Level Two Data is further disaggregated and analyzed, it becomes Level Three Data, etc.
Modalities of Root Cause
Although root cause analysis is most frequently used in a negative reactive mode (looking back to find out why something went wrong), it can also be used in at least three other modalities. In the positive reactive mode, one looks back to find out what went right. In the positive proactive mode, one looks forward to learn what has to be in place for a new process to be successful. In the negative proactive mode, one looks forward to learn what has to be dissolved for a new process to be successful.
Multiple Measures of Data
Dr. Victoria Bernhardt has provided this very useful model of the multiple types of data that are used in Root Cause Analysis. They are: student achievement data, student demographic data, school system and process data, and stakeholder perception data. Often, a single data set, such as student grades, can be used both as a measure of student achievement and also of the school system and its processes.
Need Needs are gaps in student learning (achievement) between where students should be and where they actually are.
Non-Contributory Factors
Factors that, upon investigation, seem not to have contributed to the problem or gap but that are noted in order to document that they have been explored.
Problem A situation where performance does not meet expectation.
Process All work is process. A process consists of input, value-added action, and

Continuous School Improvement – Office of Post-Secondary Readiness - 2014-15 25
Term Definition output. Once one can identify all three components, the process can be defined. The term “process” is used to define a mini-system nested within a larger system (e.g., instructional processes within the school system).
Questioning Data A process used to seek root cause by “seeing” what data has to tell and then identifying “questions” about what is seen as a basis for further investigation.
Root Cause The deepest underlying cause or causes of positive or negative symptoms within any process, which, if dissolved, would result in elimination, or substantial reduction, of the symptoms.
Triangulation A process of gathering multiple data sets to focus in on understanding an issue rather than relying upon a single form of evidence. Multiple forms of data provide a more distinct and valid picture or reality.
Verif ication The process by which a team product is publicly disseminated and reviewed for the purpose of using the input generated to modify the product before it becomes finalized.

Continuous School Improvement – Office of Post-Secondary Readiness - 2014-15 26
Root Cause Toolbox
Root Cause Analysis: Toolbox Contents
• Multiple Measures of Data • Continuous School Improvement Flow Chart: Root Cause Analysis • Circle Map (Blank) • Getting to Root Causes – Why? Because Flow Map • Fishbone Sample/Explanation • Fishbone Template • Developing Trend Statements

Continuous School Improvement – Office of Post-Secondary Readiness - 2014-15 27

Continuous School Improvement – Office of Post-Secondary Readiness - 2014-15 28

Continuous School Improvement – Office of Post-Secondary Readiness - 2014-15 29

Continuous School Improvement – Office of Post-Secondary Readiness - 2014-15 30

Continuous School Improvement – Office of Post-Secondary Readiness - 2014-15 31
Fishbone Diagram A common graphic organizer to assist with root cause analysis is the f ishbone diagram. The following illustration demonstrates the process. Select a performance concern and list all factors and suggested causes related to the problem. It is important in the group process to validate all responses.
1. Label each one either ―S if it is a student generated cause or ―A if it is an adult generated cause. Cross out all the ―S causes.
2. Label each remaining adult cause ―I for In Our Control or ―O for Out of Our Control. Cross out all the ―O factors.
3. Be sure that the remaining causes are supported by at least three data sources. The data may tell a different story than what the team perceived and it may create another cause to add to the fishbone.
4. Use the enhanced 5 Why Questions to determine which of the remaining causes are root causes. If a question cannot be answered completely, then that factor is NOT the root cause, and should be removed.

Continuous School Improvement – Office of Post-Secondary Readiness - 2014-15 32