Embed Size (px)
Citation preview

1
Synthesizing and Communicating Data - Science Institute 2013-2014
+
Grade Level: 5-12 Activity Duration: Warm-Up: 10 minutes Activities: 60 minutes Wrap-up: 10 minutes Overview: Warm-Up: Department Brief Part 1: Number Detective Part 2: Signal Development Wrap Up: Expert Witness Testimony
Summary: Students take on the role of an expert witness in a lake sturgeon poaching trial. As a number detective, they will learn how to find trends in data and use the signals they see to connect a fish to its home body of water. Additional data manipulation will allow them to develop signals for both the St. Louis and the St. Croix Rivers. Finally, they must be prepared to communicate their findings in court to show whether the Lake Sturgeon in question was poached from the St. Louis River or taken legally from the St. Croix River.
Topic: Making Sense of Data
Theme: Vital to the process of science is the ability to understand the data that is collected and the need to appropriately communicate the findings (avoiding over simplifications and misinterpretations).
Objectives:
The students will: 1. Identify the need to visually represent data in order to find
trends and make predictions. 2. Categorize a data set in order to build a histogram. 3. Compare peaks on histograms to determine signal value. 4. Predict which range a given data point would fall within
(or outside). 5. Provide evidence based reasoning to explain their findings
in a fish poaching case study.
Pre-Lesson Idea: Help students connect the nitrogen cycle and human activity to the use of nitrogen isotopes used in this CSI: Fish case. Try our Nitrogen Cycle Game: http://glaquarium.org/wp-content/uploads/2013/02/Nitrogen-Cycle-Lesson-Plan.pdf
CSI: Fish - Synthesizing and Communicating Data
Tools for teachers and Students - Understanding the Nature of
Science http://undsci.berkeley.edu/
Want your students using more real world data?
Check out this Source with Lesson Plans
http://www2.vims.edu/bridge/search/archives.cfm

2
Synthesizing and Communicating Data - Science Institute 2013-2014
Suggested MN Science Standards: This lesson may partially or fully address the following standards.
Grade 5: 5.1.1.2.2 - Identify and collect relevant evidence, make systematic observations and accurate measurements, and identify variables in a scientific investigation. 5.1.1.2.3 - Conduct or critique an experiment, noting when the experiment might not be fair because some of the things that might change the outcome are not kept the same, or that the experiment is not repeated enough times to provide valid results. 5.1.3.4.1 - Use appropriate tools and techniques in gathering, analyzing and interpreting data. For example: Spring scale, metric measurements, tables, mean/median/range, spreadsheets, and appropriate graphs Grade 7: 7.1.1.1.2 – Understand that when similar investigations give different results, the challenge is to judge whether the differences are significant, and if further studies are required. Use mean and range to analyze the reliability of experimental results. 7.1.1.2.3 - Generate a scientific conclusion from an investigation, clearly distinguishing between results (evidence) and conclusions (explanation). 7.4.4.1.2 - Describe ways that human activities can change the populations and communities in an ecosystem. Grade 8 8.1.1.2.1 – Use logical reasoning and imagination to develop descriptions, explanations, predictions, and models based on evidence. Grades 9-12: 9.1.1.1.2 - Understand that scientists conduct investigations for a variety of reasons, including: to discover new aspects of the natural world, to explain observed phenomena, to test the conclusions of prior investigations, or to test the predictions of current theories. 9.1.3.3.2 - Communicate, justify, and defend the procedures and results of a scientific inquiry or engineering design project using verbal, graphic, quantitative, virtual, or written means. 9.1.3.4.3 – Select and use appropriate numeric, symbolic, pictorial, or graphical representation to communicate scientific ideas, procedures and experimental results. Math Standards 7.4.1.1 – Design simple experiments and collect data. Determine mean, median and range for quantitative data and from data represented in a display. Use these quantities to draw conclusions about the data, compare different data sets, and make predictions. 7.4.2.1 – Use reasoning with proportions to display and interpret data in circle graphs (pie charts) and histograms. Choose the appropriate data display and know how to create the display using a spreadsheet or other graphing technology.

3
Synthesizing and Communicating Data - Science Institute 2013-2014
Environmental Literacy Scope and Sequence
Benchmarks: In social and natural systems that consist of many parts, the parts usually influence
one another. (3-5) Social and natural systems may not function as well if parts are missing, damaged,
mismatched, or misconnected. (3-5) Social and natural systems can include processes as well as things. (6-8) The output from a social or natural system can become the input to other parts of
social and natural systems. (6-8) Social and natural systems are connected to each other and to other larger and
smaller systems. (6-8) Interaction between social and natural systems is defined by their boundaries,
relation to other systems, and expected inputs and outputs. (9-adult) It is not always possible to predict accurately the result of changing some part of
connection between social and natural systems.
Concepts partially or fully addressed in this lesson: abiotic factors, biotic factors, properties, similarities and differences, cause and effect, communication, ecosystem, patterns, population, probability, structure, boundary, habitat, scale
For the full Environmental Literacy Scope and Sequence, see: www.seek.state.mn.us/eemn_c.cfm
Great Lakes Literacy Principles Only the bolded Great Lakes Literacy Principles are addressed in this lesson.
The Great Lakes, bodies of fresh water with many features, are connected to each other and the world ocean.
Natural forces formed the Great Lakes; the lakes continue to shape the features of their watershed.
The Great Lakes influence local and regional weather and climate. Water makes the earth habitable; fresh water sustains life on land. The Great Lakes support a diversity of life and ecosystems. The Great Lakes and humans in their watersheds are inextricably interconnected. Much remains to be learned about the Great Lakes. The Great Lakes are socially, economically, and environmentally significant to the
region, the nation, and the planet.
For more information about the Great Lakes Literacy Principles, visit: http://greatlakesliteracy.net/

4
Synthesizing and Communicating Data - Science Institute 2013-2014
Materials:
Number Detectives: Whole Department Brief – 1 copy (background to be read to class) Graph Paper A –Number Detectives: Carbon, 1 copy per student Graph Paper A Answer Key – 1 copy Graph Paper B –Number Detectives: Nitrogen, 1 copy per student Graph Paper B Answer Key – 1 copy Calculators – Not included
Signal Developer: 10 Lake Sturgeons from St. Croix – Rural Sample Site 10 Lake Sturgeons from St. Croix – Urban Sample Site 2 Fish Nets 2 Fish Holding Tubs Graph Paper C – Signal Development, 1 copy per group, up to 10 copies Graph Paper C Answer Key – 1 copy
CSI – Expert Witness Testimony Prep: 10 Evidence Bags with potentially poached lake sturgeon 10 Case Files (Folder with Conservation Officer’s Report, Transcription from the TIP Call if
available) Worksheet: Investigator Final Report (1 copy per group/individual) Teacher Answer Key to Case Files

5
Synthesizing and Communicating Data - Science Institute 2013-2014
Vocabulary: atomic number: the number of protons in the nucleus of an atom, which determines the chemical properties of an element and its place in the periodic table
average: the descriptive statistic that identifies a single value as representative of an entire distribution
expert witnesses: a person who is permitted to testify at a trial because of special knowledge or proficiency in a particular field that is relevant to the case
extirpated: the organism is no longer found in a location that is part of its historical range but is not entirely extinct
extinct: a species, or other group having no living members
frequency: the number of times a particular value (or data point) occurs
histogram: a diagram that indicates the frequency of a variable; a graphical representation showing the distribution of data, best used for quantitative data
isotope: any of two or more forms of a chemical element, having the same number of protons in the nucleus, or the same atomic number, but having different numbers of neutrons in the nucleus, or different atomic weights – dictionary.com
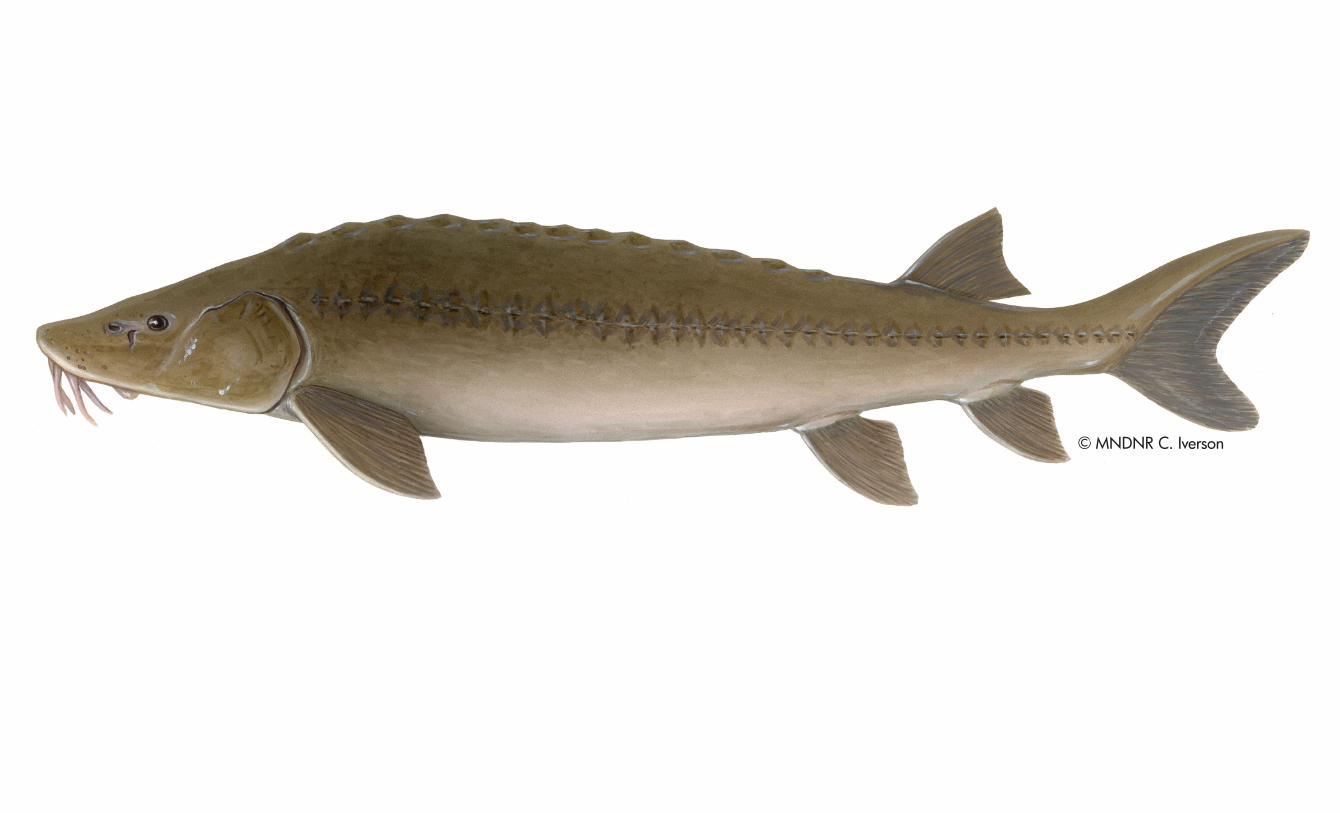
lake sturgeon: ancient and primitive species of freshwater fish that have cartilaginous skeletons and bony plates in their skin
maximum: the greatest value in a set of values
minimum: the lowest value in a set of values
mode: number which appears most often within a given series of numbers
neutrons: a subatomic particle of about the same mass as a proton but without an electric charge, present in all atomic nuclei except those of ordinary hydrogen
normal distribution: curved shape in a graph that shows increased frequencies centered around a single mean and fewer frequencies on either side
poacher: one who kills or takes wild animals (as game or fish) illegally
restitution: financial compensation to help cover the costs to replace the item or revert it back to the original state
unimodal histogram: This means there is one clear mode, or peak, in the data

6
Synthesizing and Communicating Data - Science Institute 2013-2014
Instructor Background Information:
Scientists and Data
Excerpted from the “Introduction to Chapter 1” of The Basics of Data Literacy: helping your students (and you) make sense of data by Michael Bowen and Anthony Bartley, NSTA Press 2014. Complete chapter introduction is attached.
The claims and arguments made in science almost always extend from data that scientists have collected. Usually, not always, that data involves counts, measurements, or some other quantitative determination. Scientists then analyze their data using tables, graphs, or statistical analyses – or all of these.
So why do scientists use graphs? Why don’t they just look at the data tables? First, graphs often represent a summary of numbers so that you’re not (usually, anyways) looking at as much information. Second, it can be difficult to see patterns in large sets of numbers, but easier to see in graphs. Basically, graphs make understanding patterns of relationships between variables easier.
Using histograms to understand data
Excerpted from “Chapter 8: Graphical Representations” STEM Student Research Handbook by Darci J. Harland, NSTA Press 2011. Complete copy of chapter 8 is attached.
A histogram is a graphical representation showing the distribution of data (McDonald 2009). [A histogram tells you how often values occur, and it displays the minimum and maximum values. (inserted by author)] At first glance, histograms may look just like what you have always called bar graphs. Although both types of graphs are constructed with horizontal or vertical bars, a histogram's bars are called bins, and these bins touch, with no spaces between them. In addition, the numerical data represented by the axis at the base of the bins are on a numeric continuum, with frequency being indicated by the height of each bin. Also, histograms are best used for quantitative data; bar graphs are better used for qualitative data. For example, a histogram should be used if you need to construct a graph comparing the number of M&Ms in 23 different bags. But a bar graph would be used to compare the number of different color candies found in the bags of M&Ms.
Let's explore histograms further. Suppose the number of M&Ms in 23 separate bags are counted. Listed below are the raw data results with the amount of M&Ms in each bag of candy.
22, 23, 23, 23, 22, 24, 25, 21, 23, 24, 24, 23, 22, 21, 23, 23, 20, 24, 26, 22, 23, 22, 22

7
Synthesizing and Communicating Data - Science Institute 2013-2014
The numbers listed this way make it difficult to determine how many M&Ms are most frequently (commonly) found, or least likely to be found, in a bag of M&Ms. Therefore, the first task is to arrange the data in order from least to greatest.
20, 21, 21, 22, 22, 22, 22, 22, 22, 2 3, 23, 23, 23, 23, 23, 23, 23, 24, 24, 24, 24, 25, 26
These data are perfect for a histogram. If we make it using vertical bins, our horizontal axis will be labeled with the varying quantities of M&Ms. This data is best displayed by constructing bins that are one unit wide, starting with 20 and going up to 26 (see Figure 8.1). The vertical axis will be labeled frequency, or the number of bags that contained that quantity. Therefore, frequency represents the numbers that fall within the interval of that bin. There is only one bag that had 20 pieces of candy, so the first bin is one high. There are two bags that had 21 pieces so the next bin is two high, and so forth.
Figure 8.1 is an example of a unimodal histogram with bars on the left and the same data with connecting lines on the right. This means there is one clear mode, or peak, in the data. [ The mode of a data set is the most frequently occurring value in the histogram. (inserted by author)] This histogram can also be called roughly symmetric because both sides of the histogram look similar. Since this distribution has the largest bins at 22 and 23, it seems that 22 and 23 are the most common quantities of M&Ms that will appear in the bag. The bins are the smallest at the tails, or ends, of the histogram. It appears as if 20 and 26 are uncommon quantities of M&Ms. This curved shape that shows increased frequencies centered around a single mean and fewer frequencies on either side is known as a normal distribution. Because

8
Synthesizing and Communicating Data - Science Institute 2013-2014
this sample of M&Ms has no bin that goes outside this curve, we can say the sample is normally distributed.
In this lesson, we’re looking at how frequently different abundances of specific nitrogen and carbon isotopes occur in fish. When an element has different numbers of neutrons and the same number of protons; each variation of the element is called an isotope. Based on the different abundances of these isotopes found in fish from different rivers, we will determine if a particular isotope of a nutrient can be used as a unique indicator for the specific rivers fish live in. If a specific isotope of a nutrient has a unique abundance in each river we can call it a signal. We will focus on two isotopes in particular, nitrogen 15 (15N) and carbon 13 (13C), because they can be helpful in determining where a fish spent most of its time. This lesson will ask students to use isotope abundance data to investigate a case study of possibly poached sturgeon.
Background on Sturgeon & Poaching
Excerpted from “Species Profile: Close-up on the Lake Sturgeon” MinnAqua Moments eNewsletter. August 2011 Issue. http://www.dnr.state.mn.us/minnaqua/speciesprofile/lake_sturgeon.html
Lake sturgeon, sometimes called a living dinosaur of the fish world, are a remnant of an ancient and primitive group of fish that have cartilaginous skeletons and bony plates in their skin. Lake Sturgeon are one of three species of sturgeon that live exclusively in freshwater, the other two species are shovel nosed sturgeon (found in Minnesota) and pallid sturgeon (Federally listed as an endangered species, not found in Minnesota). There are twenty-seven species of sturgeon worldwide, all of them found in the Northern Hemisphere.
Historically lake sturgeon were found in all of the Great Lakes and most of the St. Lawrence Seaway, throughout the Mississippi River and its tributaries including the Missouri and Ohio rivers from Minnesota to Louisiana, the Red River from Minnesota to Hudson Bay, and many tributaries of Hudson Bay. 19 of the 20 states in which lake sturgeon have historically been found have Lake Sturgeon listed as a threatened, endangered, or species of special concern. Lake sturgeon is considered extirpated from Louisiana, Alabama, and Arkansas. Extirpated means the organism is no longer found in that location but is not entirely extinct.
Why the concern?
Lake Sturgeon almost disappeared from Minnesota in the early 1900's. During the 1800's sturgeon were considered a nuisance fish because they easily broke through commercial fishing nets. They were taken out of the rivers and lakes they inhabited and stacked on the shorelines like logs; sturgeon was also used to power steam boats because their meat has high oil content. In the late 1800's sturgeon eggs were recognized as a dining delicacy. They were harvested by the 1000's for their caviar until the population crashed in the early 1900's. This dramatic

9
Synthesizing and Communicating Data - Science Institute 2013-2014
harvest along with significant habitat changes around the sturgeon's spawning areas nearly drove the entire population in the United States to extinction.
Rules and regulations regarding fishing and harvest of Lake Sturgeon
Lake Sturgeon is listed as a species of special concern in Minnesota. In order to protect Lake Sturgeon, fishing for them is heavily regulated in Minnesota and in Minnesota’s border waters. A poacher, someone who illegally kills or takes wild animals, can face a fine of $385 for taking a Lake Sturgeon in closed season plus restitution, financial compensation to help cover the costs to replace the item or revert it back to the original state. If a fish cannot be returned to the water and a fine of $385 for taking a Lake Sturgeon of illegal length plus possible restitution if the fish cannot be returned to the water. Restitutions for Lake Sturgeon taken illegally in Minnesota are:
4” to <40” in length fish = $500
40” to <50” in length fish = $1000
50” fish and over = $1000 plus $100 per inch for every inch over 50”
So a poached Lake Sturgeon that is 60” and cannot be returned to the water would have a restitution of $2000 and a $385 fine if the sturgeon was taken during a closed season, and/or a fine of $385 if the fish was an illegal length. (Habermann, Heaton)
The commercial harvest of lake sturgeon in Minnesota was closed in the 1930s. Today, sport fishing harvest requires a special tag and is limited to one fish each year from the St. Croix River or Canada-Minnesota border waters (Rainy Lake and Rain River). Fishing for Lake Sturgeon is not allowed in Minnesota’s Lake Superior waters, the St. Louis River, or any inland lake in Minnesota. Additionally, harvest is not allowed in the Minnesota border waters of North Dakota, South Dakota, and some Wisconsin waters. For more information regarding these and other fishing regulations, visit: http://www.dnr.state.mn.us/regulations/fishing/index.html
Rules and regulations like these can be tricky to enforce. Imagine you are a conservation officer, whose duty it is to enforce such regulations. What tools can be used to determine what water a fish came from? That’s where a little fish “CSI” comes into play, where you (and your students) can serve as expert witnesses.

10
Synthesizing and Communicating Data - Science Institute 2013-2014
Conclusion
“Being able to collect and use your own data to examine the world for patterns is an important skill for anyone to have, even if they're not a scientist. Whether it's learning to cook a steak perfectly by keeping a cooking diary or figuring out how to get the best mileage from your car by keeping a gasoline consumption and distance log, making structured observations and understanding the patterns in them uses the same data literacy tools that scientists use.” (Bowen, Michael & Anthony Bartley. The Basics of Data Literacy: helping your students (and you) make sense of data. NSTA Press. 2014. Pg. 3.) This activity will use sturgeon poaching as the real-world example in a hypothetical situation. Suggesting you can use scientific data to predict where fish lived is helpful in the case of poaching, when laws differ from one body of water to the next, and across state and national borders. The ability to predict the actual habitat of a fish could help stop poaching.
Students will analyze real data collected by US EPA scientists about carbon and nitrogen isotope ratio abundance in fish found in the Amnicon and St. Louis Rivers. The initial analysis will help students understand how elements can be used to trace fish to their original habitats. The case study uses fabricated data from the St. Croix River so students can make logical predictions about where a sturgeon lived and submit expert testimony in a simulated poaching case. The data used throughout this lesson has been simplified for use by middle school students as the focus of this lesson is on data analysis, rather than understanding chemistry and upper level math.

11
Synthesizing and Communicating Data - Science Institute 2013-2014
Lesson Activities:
Warm Up:
Set the stage with your students:
1. Check out this news story of a similar poaching threat to another species of sturgeon in California. http://www.youtube.com/watch?v=kZoazltuRb0 – Preventing sturgeon poaching in CA. Today conservation officers are aided by people who call the TIP(Turn In Poachers) hotline and report illegal fishing. Just like the people working hard in California to prevent poaching, we are working hard along the St. Louis River to prevent poaching of Lake Sturgeon.
2. Show one of the fish in an evidence bag.
a. Do they know what kind of fish this is representing? b. What do they know about Lake Sturgeon? c. Explain that this fish was taken from someone that is possibly going to trial on
poaching charges. The defendants (anglers) claim that their sturgeon was caught in the St. Croix River. A DNR Conservation Officer intercepted the fish while the anglers were at a boat landing on the St. Louis River, in Duluth, Minn. It is illegal to take sturgeon from the St. Louis as their population is still in critical condition and is the reason for questioning these anglers. If the students find in their investigation that the confiscated sturgeon was from the St. Louis River, charges will be brought against the anglers.
i. The consequence for defendants charged for a 50” fish and over = $1000 plus $100 per inch for every inch over 50”
ii. Removing even one fish from the St. Louis can dramatically affect the population due to their slow growth rate.
3. Today students will be taking on the role of a Crime Scene Investigator (CSI) who will appear in court as an expert witness. They will prepare testimony to shed light on where these Lake Sturgeon were most likely caught.
a. Have they heard of an “Expert Witness”? (a person who is asked to testify in court in regards to their field of expertise and must be able to defend their findings)
b. Have they seen any CSI shows or are they otherwise familiar with using scientific research in court?

12
Synthesizing and Communicating Data - Science Institute 2013-2014
Part 1: Number Detectives
** The data used throughout this lesson has been simplified for use by middle school students as the focus of this lesson is on data analysis, rather than understanding chemistry and upper level math.
1. Read the “Whole Department Brief” to your students to give them background on the upcoming cases. Take on the role of the station captain and brief your ‘agents.’
2. Hand out Graph Paper A to each student.
3. Looking at the data table in the top left corner, ask: can we see any distinct differences in the data sets?
No, a list of numbers is difficult to interpret. We need to create a visual representation to help us see if the data sets are unique for each river.
4. Explain: In order to see the differences in the data, we are going to make a visual representation in the form of a histogram.
5. Demonstrate with the whole class how to make a histogram:
a. Take a look at your graph paper (Graph Paper A). Along the bottom x-axis is a label for abundance of C-13 found in fish.
b. On the y-axis is a label for frequency, or how often the abundance appears in fish. This type of graph is called a histogram.
For a visual demo of how to develop a histogram check: https://www.youtube.com/watch?v=KCH_ZDygrm4

13
Synthesizing and Communicating Data - Science Institute 2013-2014
c. In order to graph points, we will first need to group the data into “bins.” For example, how many times did data fall into 24.0 – 25.99 range? If there are 6 data points that fall into this range, the frequency would be 6.
d. In the data table, your values are already ordered from lowest to highest. e. Looking at the range for each bin, count the
number of abundance values that fit in that range for the St. Louis River and record them in the chart. (See figure to the right for the answer key.)
f. Now you can plot the frequencies on the graph. For example, the St. Louis River, has no data points in the 24-25.55 bin, so make a point at zero on the y-axis (24,0). There are 2 data points that fall in the 26 bin, so make a point on y-axis at 2 (26, 2). And so on.
g. Connect each point to create a curve. Note: Histograms can be made with bars or connected lines. Connected lines will help show clear peaks and data ranges useful in this investigation.
h. Demonstrate how to determine the min (lowest value), max (highest value) to
determine range of data. i. Demonstrate how to calculate the mode (value that appears most often) to show
where the majority of data points will fall for this river system.

14
Synthesizing and Communicating Data - Science Institute 2013-2014
j. Have students work individually or in pairs to bin and graph the data for the
Amnicon River. They should also calculate the min, max, and mode. k. Hold on to your completed Carbon-13 histogram while you develop the histograms
for Nitrogen-15.
6. Hand out Graph Paper B. Students can work individually or in pairs to develop the frequency curves for N-15 in the St. Louis River and the Amnicon River.
7. Now have students compare the two graphs.
a. Describe the difference in the appearance of the nitrogen histograms and the carbon histograms. Carbon curves greatly overlap, and the peaks are very close. nitrogen curves do not overlap much, and the peaks are well separated.
b. Does either C-13 or N-15 show a unique pattern for each river?

15
Synthesizing and Communicating Data - Science Institute 2013-2014
N-15 has a unique signal or pattern in each river! We can use N-15 to help us identify where fish lived.
c. How can we use this in our case? N-15 abundance can be measured in the potentially poached Lake Sturgeon and compared to abundance found in fish that live in the St. Louis River and the St. Croix River. We will now need to determine the signal or patternfor the St. Croix River.
Part 2: Signal Developer - CSI: Fish
1. We have N-15 data for the St. Louis River, but not the St. Croix River. Your students will need to conduct a study sample on the fish in the St. Croix River to determine if the abundance of N-15 in fish is different from the St. Louis River. (Alternatively, you can provide the data and skip the data collection portion.)
2. Divide students into investigation teams (up to 10 teams).
3. Hand out Graph Paper C and the Worksheet: Investigator Final Report to each group.
4. Show the map of the St. Croix River to help students visualize where the new data is coming from.
5. Direct students to record ten samples from each setting as they take their fish sample. You may also choose to project or write the following chart on the board:
6. Set out the basin labeled Rural with the 10 Rural Fish Samples.
7. Show the tools the students will use to collect their samples:
a. A net to scoop up a fish (Science Institute Kit version only) b. Tag with a N-15 abundance reading attached to the fish (or on the back of printed
fish) c. Chart on the board to fill in the abundance

16
Synthesizing and Communicating Data - Science Institute 2013-2014
8. Assign/have each group identify, a member to do the following tasks:
a. collect samples and record N-15 data for their fish on the board (class record) b. record data on Graph Paper C as samples are being taken (group record) c. graph the data once the sample is complete
9. Send one group member up to pull a sample fish from the population and record the N-15 abundance on the board. Once all the data is on the board, group members should record the data for their own use and graph the frequencies.
10. Following the same method for creating a histogram that was used to graph the data for the St. Louis River, have each group graph the data from the rural collection site.
11. How does the St. Croix peak compare to the St. Louis River peaks? The rural site on the St. Croix falls below the St. Louis peak.
12. As we prep for court, we have to plan for the defense questioning the validity of our data. The St. Croix River flows through a mix of rural and urban settings while the section of the St. Louis River flows through a predominantly urban setting (we are focusing on the portion of the St. Louis River below the Thomson Dam). Is one sample from the St. Croix River’s rural setting enough data to be defensible? No….so we need a bigger range of data.
13. What other data do we need? A sample from an urban setting on the St. Croix River is needed.
14. Send a second student from each group to sample a fish from the urban setting site and record the N-15 abundance on the board.
15. Have each group graph the urban data on the same Graph Paper C.
16. Calculate the average for both the St. Croix River and the St. Louis River.
17. What range (min, max) of N-15 abundance do you expect to find in Lake Sturgeon in each river?
18. Is there a unique signal for the St. Croix River? There is a small overlap, but most Lake Sturgeon will fall within the two unique ranges.
19. How SURE can we be? Science is about predictability not absolute certainty, but we can strongly predict the habitat of fish that fall within the signal. Fish occurring in the signal overlap would have the same probability of coming from the St. Louis as they do from the St. Croix. In cases where data falls in the overlap, we are unable to predict with certainty.

17
Synthesizing and Communicating Data - Science Institute 2013-2014
Wrap Up:
Expert witness on a poaching trial
1. Hand out one evidence bag and corresponding Case File (Conservation Officer Report, TIP Line Recording, possible avatar of defendant in the case and sturgeon picture) to each group.
2. Have the group review the information in the Case File.
3. What information do they need now in order to determine where the Lake Sturgeon came from?
4. Keeping your Lake Sturgeon in the evidence bag, read the N-15 abundance on the evidence tag.
5. Can you determine if your fish came from the St. Croix River or the St. Louis River? Please justify your answer in your report.
6. Have the groups present their findings. The audience should ask probing questions and require scientific data to justify answers.
Extensions:
1. Get Active! Join your students in a service learning opportunity during a local Sturgeon Watch event.
a. Learn more about events happening around the St. Louis River: http://www.stlouisriver.org/Sturgeon%20Restoration/sturgeon.html
b. Find resources to guide you on a service learning project here: http://gsn.nylc.org/clearinghouse
2. Have student research the role genetic testing is having on the fish market. The next time they eat fish they may think twice about how it was labeled and if it was actually an endangered animal (like Bluefin tuna), a fraud (over charged) or a health hazard (causing diarrhea and other complications)! Run a jigsaw with current news articles or hold a debate on who (buyer, seller, dealer, restaurant owner, etc.) should be held accountable for “proof of species” and how will DNA testing allow for more accurate results.
3. Connect with a civics class to run a mock trial with students as the expert witnesses, jury, attorney, and defendants.

18
Synthesizing and Communicating Data - Science Institute 2013-2014
4. Contact your local DNR fisheries and wildlife office to invite a biologist to share how they put data collect/analysis into action. Connect here: http://www.dnr.state.mn.us/fishwildlife/index.html
5. Have students calculate additional statistical analysis: standard deviation, % error, etc. to strengthen their argument in court.
6. Using the same data in this lesson, have students develop their histograms in excel or other graphing technology.
7. Check out this great resource to get your students working with more real data: http://www2.vims.edu/bridge/search/archives.cfm
References
1. Bowen, Michael & Anthony Bartley. 2014. “Introduction to Chapter 1” The Basics of Data Literacy: helping your students (and you) make sense of data. NSTA Press.
2. Habermann, Robert. 2014. Water Resources Conservation Officer, Minnesota Department
of Natural Resources. Pers. Comm.
3. Harland, Darci J. 2011. “Chapter 8: Graphical Representations“ STEM Student Research Hadbook. NSTA Press.
4. Heaton, Dustie. 2014. Conservation Officer, Minnesota Department of Natural Resources.
Personal Communcation.
5. Meyer, Nadine. “Species Profile: Close-up on the Lake Sturgeon” MinnAqua Moments eNewsletter. August 2011 Issue. http://www.dnr.state.mn.us/minnaqua/speciesprofile/lake_sturgeon.html
Brought to you by Great Lakes Aquarium, MN DNR MinnAqua Program, Minnesota Sea Grant, and Wolf Ridge ELC. This project is funded in part by the Coastal Zone Management Act, by NOAA’s Office of Ocean and Coastal Resource Management, in conjunction with Minnesota’s Lake Superior Coastal Program.
19
Synthesizing and Communicating Data - Science Institute 2013-2014
Conservation and Law Enforcement Unit Sturgeon Poaching Case Update
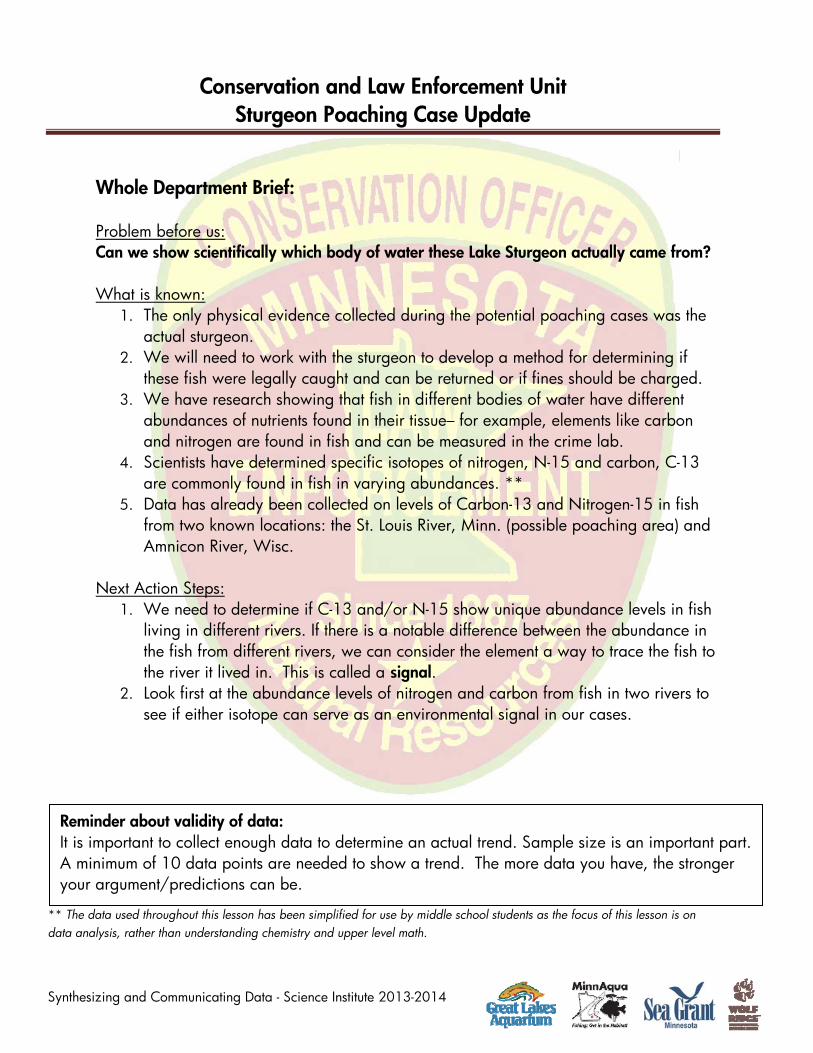
Whole Department Brief: Problem before us: Can we show scientifically which body of water these Lake Sturgeon actually came from? What is known:
1. The only physical evidence collected during the potential poaching cases was the actual sturgeon.
2. We will need to work with the sturgeon to develop a method for determining if these fish were legally caught and can be returned or if fines should be charged.
3. We have research showing that fish in different bodies of water have different abundances of nutrients found in their tissue– for example, elements like carbon and nitrogen are found in fish and can be measured in the crime lab.
4. Scientists have determined specific isotopes of nitrogen, N-15 and carbon, C-13 are commonly found in fish in varying abundances. **
5. Data has already been collected on levels of Carbon-13 and Nitrogen-15 in fish from two known locations: the St. Louis River, Minn. (possible poaching area) and Amnicon River, Wisc.
Next Action Steps: 1. We need to determine if C-13 and/or N-15 show unique abundance levels in fish
living in different rivers. If there is a notable difference between the abundance in the fish from different rivers, we can consider the element a way to trace the fish to the river it lived in. This is called a signal.
2. Look first at the abundance levels of nitrogen and carbon from fish in two rivers to see if either isotope can serve as an environmental signal in our cases.
** The data used throughout this lesson has been simplified for use by middle school students as the focus of this lesson is on data analysis, rather than understanding chemistry and upper level math.
Reminder about validity of data: It is important to collect enough data to determine an actual trend. Sample size is an important part. A minimum of 10 data points are needed to show a trend. The more data you have, the stronger your argument/predictions can be.

St. Louis River Amnicon River26.9 26.827.4 27.728.3 27.928.4 28.028.9 28.429.8 28.930.3 29.730.7 30.131.2 30.333.0 30.8
Abundance of C-13 in fish samples in parts per thousand (0/00) **
Label Bin St. Louis Amnicon24 24-25.9926 26-27.9928 28-29.9930 30-31.9932 32-33.9934 34-34.99
Frequency of C-13 Abundance
Graph Paper A
Key
St. Louis River
Amnicon River
Abundance of C-13 in Fish
Freq
uenc
y
Comparison of C-13 Abundances in fish samples from the St. Louis River and the Amnicon River
St. Louis River
Min ________________
Max ________________
Mode _____________
Amnicon River
Min ________________
Max ________________
Mode _____________
Names: _________________________________________ _________________________________________
Science Institute for Educators Becoming a Scientist: CSI: Fish
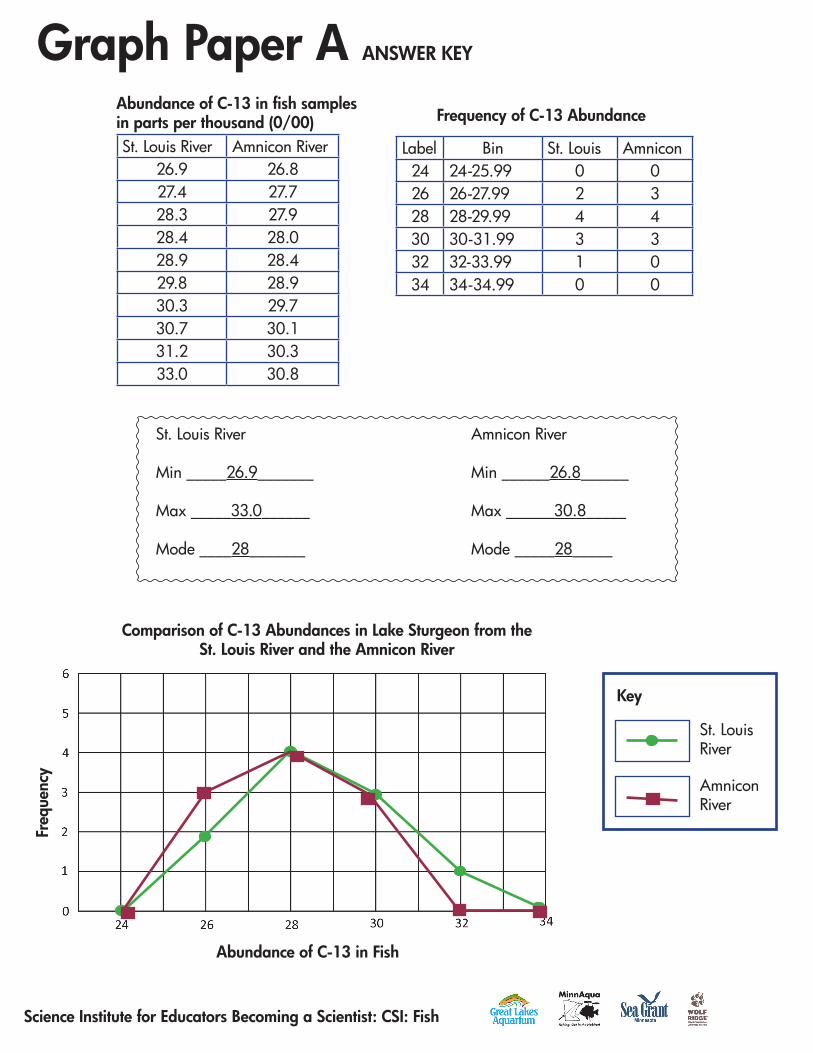
St. Louis River Amnicon River26.9 26.827.4 27.728.3 27.928.4 28.028.9 28.429.8 28.930.3 29.730.7 30.131.2 30.333.0 30.8
Abundance of C-13 in fish samples in parts per thousand (0/00)
Label Bin St. Louis Amnicon24 24-25.99 0 026 26-27.99 2 328 28-29.99 4 430 30-31.99 3 332 32-33.99 1 034 34-34.99 0 0
Frequency of C-13 Abundance
Graph Paper A ANSWER KEY
Key
St. Louis River
Amnicon River
Abundance of C-13 in Fish
Freq
uenc
y
Comparison of C-13 Abundances in Lake Sturgeon from the St. Louis River and the Amnicon River
St. Louis River
Min _____26.9_______
Max _____33.0______
Mode ____28_______
Amnicon River
Min ______26.8______
Max ______30.8_____
Mode _____28_____
Science Institute for Educators Becoming a Scientist: CSI: Fish

St. Louis River Amnicon River8.1 5.28.4 6.08.5 6.08.5 6.28.6 6.29.6 6.49.7 6.7
10.0 7.010.4 7.411.1 8.3
Abundance of N-15 in fish samples in parts per thousand (0/00) **
Label Bin St. Louis Amnicon4 4.0-4.995 5.0-5.996 6.0-6.997 7.0-7.998 8.0-8.999 9.0-9.99
10 10.0-10.9911 11.0-11.9912 12.0-12.99
Frequency of N-15 Abundance
Graph Paper B
Key
St. Louis River
Amnicon River
Abundance of N-15 in Fish
Freq
uenc
y
Comparison of N-15 Abundances in fish samples from the St. Louis River and the Amnicon River
St. Louis River
Min ________________
Max ________________
Mode _______________
Amnicon River
Min ________________
Max ________________
Mode _______________
Names: _________________________________________ _________________________________________
Science Institute for Educators Becoming a Scientist: CSI: Fish

St. Louis River Amnicon River8.1 5.28.4 6.08.5 6.08.5 6.28.6 6.29.6 6.49.7 6.7
10.0 7.010.4 7.411.1 8.3
Abundance of N-15 in fish samples in parts per thousand (0/00)
Label Bin St. Louis Amnicon4 4.0-4.99 0 05 5.0-5.99 0 16 6.0-6.99 0 67 7.0-7.99 0 28 8.0-8.99 5 19 9.0-9.99 2 0
10 10.0-10.99 2 011 11.0-11.99 1 012 12.0-12.99 0 0
Frequency of N-15 Abundance
Graph Paper B ANSWER KEY
Abundance of N-15 in Fish
Freq
uenc
y
Comparison of N-15 Abundances in Lake Sturgeon from the St. Louis River and the Amnicon River
St. Louis River
Min _____8.1______
Max _____11.1_______
Mode ____8_______
Amnicon River
Min _____5.2________
Max _____8.3________
Mode ____6________
Science Institute for Educators Becoming a Scientist: CSI: Fish
Key
St. Louis River
Amnicon River

Lake Sturgeon Fish Samples from the St. Croix River, Urban and Rural Settings
Science Institute for Educators Becoming a Scientist: Fish CSI

Lake Sturgeon Fish Samples from the St. Croix River, Urban and Rural Settings
Science Institute for Educators Becoming a Scientist: Fish CSI
St. Croix Urban Sample Fish
N-15 = 7.9 parts per thousand
St. Croix Urban Sample Fish
N-15 = 7.2 parts per thousand
St. Croix Urban Sample Fish
N-15 = 8.2 parts per thousand
St. Croix Urban Sample Fish
N-15 = 6.7 parts per thousand
St. Croix Urban Sample Fish
N-15 = 7.1 parts per thousand
St. Croix Urban Sample Fish
N-15 = 6.3 parts per thousand
St. Croix Urban Sample Fish
N-15 = 7.8 parts per thousand
St. Croix Urban Sample Fish
N-15 = 6.6 parts per thousand
St. Croix Urban Sample Fish
N-15 = 6.5 parts per thousand
St. Croix Urban Sample Fish
N-15 = 5.8 parts per thousand
Lake Sturgeon Fish Samples from the St. Croix River, Urban and Rural Settings
Science Institute for Educators Becoming a Scientist: Fish CSI
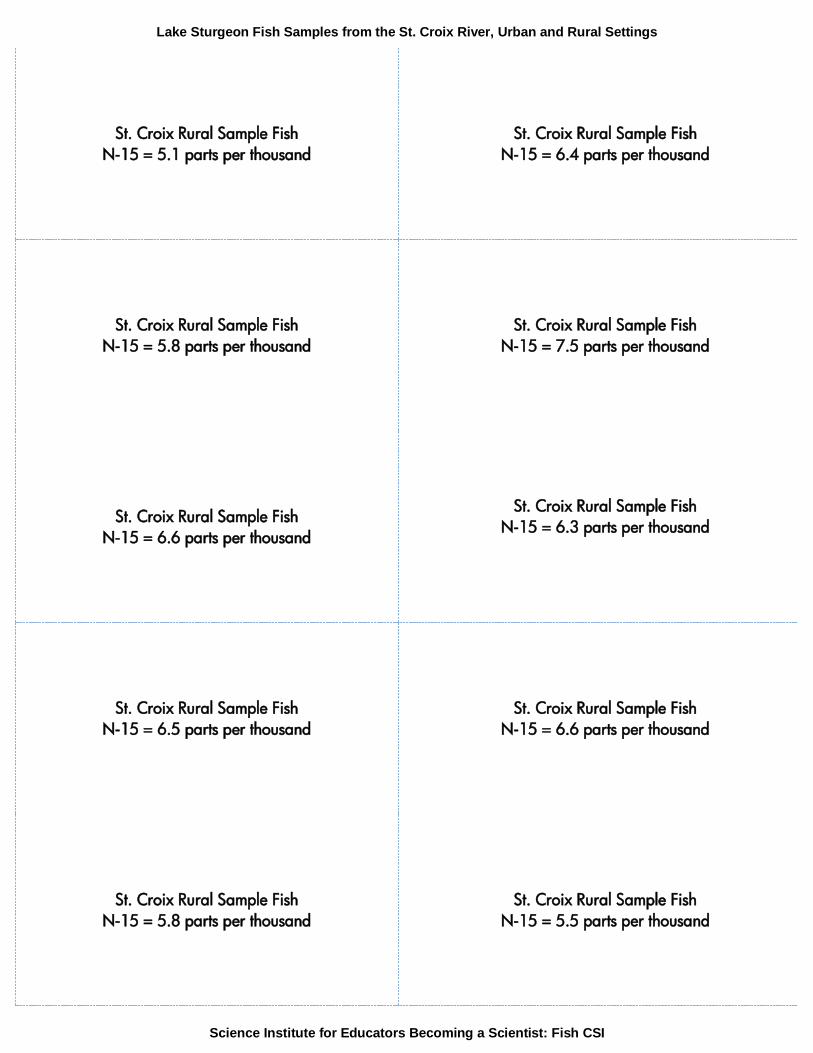
St. Croix Rural Sample Fish
N-15 = 5.1 parts per thousand
St. Croix Rural Sample Fish
N-15 = 6.4 parts per thousand
St. Croix Rural Sample Fish
N-15 = 5.8 parts per thousand
St. Croix Rural Sample Fish
N-15 = 7.5 parts per thousand
St. Croix Rural Sample Fish
N-15 = 6.6 parts per thousand
St. Croix Rural Sample Fish
N-15 = 6.3 parts per thousand
St. Croix Rural Sample Fish
N-15 = 6.5 parts per thousand
St. Croix Rural Sample Fish
N-15 = 6.6 parts per thousand
St. Croix Rural Sample Fish
N-15 = 5.8 parts per thousand
St. Croix Rural Sample Fish
N-15 = 5.5 parts per thousand

Lake Sturgeon Fish Samples from the St. Croix River, Urban and Rural Settings
Science Institute for Educators Becoming a Scientist: Fish CSI

St. Louis River St. Croix River Rural Site
St. Croix RiverUrban Site
8.18.48.58.58.69.69.7
10.010.411.1
Abundance of N-15 in fish samples in parts per thousand (0/00) **
Label Bin St. Louis St. Croix Rural
St. Croix Urban
4 4.0-4.995 5.0-5.996 6.0-6.997 7.0-7.998 8.0-8.999 9.0-9.99
10 10.0-10.9911 11.0-11.9912 12.0-12.99
Frequency of N-15 Abundance
Graph Paper C
Abundance of N-15 in Fish
Freq
uenc
y
Comparison of N-15 Abundances in fish samples from the St. Louis River and the St. Croix River
St. Louis River
Min ________________
Max ________________
Mode _______________
St. Croix River
Min ________________
Max ________________
Mode _______________
Names: _________________________________________ _________________________________________
Key
St. Louis River
St. Croix River Rural
St. Croix River Urban
Science Institute for Educators Becoming a Scientist: CSI: Fish

St. Louis River St. Croix River Rural Site
St. Croix RiverUrban Site
8.1 5.1 5.88.4 5.5 6.38.5 5.8 6.58.5 5.8 6.68.6 6.3 6.79.6 6.4 7.19.7 6.5 7.2
10.0 6.6 7.810.4 6.6 7.911.1 7.5 8.2
Abundance of N-15 in fish samples in parts per thousand (0/00)
Label Bin St. Louis St. Croix Rural
St. Croix Urban
4 4.0-4.99 0 0 05 5.0-5.99 0 4 16 6.0-6.99 0 5 47 7.0-7.99 0 1 48 8.0-8.99 5 0 19 9.0-9.99 2 0 0
10 10.0-10.99 2 0 011 11.0-11.99 1 0 012 12.0-12.99 0 0 0
Frequency of N-15 Abundance
Graph Paper C ANSWER KEY
Abundance of N-15 in Fish
Freq
uenc
y
Comparison of N-15 Abundances in Lake Sturgeon from the St. Louis River and the St. Croix River
St. Louis River
Min _____8.1______
Max _____11.1_______
Mode ____8_______
St. Croix River
Min _____5.1________
Max _____8.2________
Mode ____6________
Science Institute for Educators Becoming a Scientist: CSI: Fish
Key
St. Louis River
St. Croix River Rural
St. Croix River Urban

Investigator Final Report
Report Completed by: _____________________________________________________________________
Case Number: _______________________ Defendant(s): _____________________________________
1. Why was N-15 abundance used instead of C-13 abundance as a signal?
2. How does the N-15 signal compare between the St. Louis and the St. Croix Rivers?
3. What is the N-15 abundance of the sturgeon in evidence: ___________________________
4. Were you able to determine the river of origin for the sturgeon in evidence? YES/NO
a. If so, which river: ______________________________
5. Imagine you were asked to appear in court as an expert witness. How would you clearly, and
in a step by step manner answer the following question from the lawyer representing the
defendant (angler) in the case?
“Please explain how the origin of the sturgeon was determined.”
(Cite the histograms using the terms isotope abundance, habitat, fish, signal, range, mode, probability)
Based on the evidence examined in this case, the defendant should be charged with “Fishing or
collecting within a protected area” _____Yes ____No

Lake Sturgeon Evidence Tags
Science Institute for Educators Becoming a Scientist: CSI: Fish
Case No: 14DNR.0020
Defendant: Hanes, Jim & Deb
N-15: 5.4 parts per thousand
Case No: 14DNR.0021
Defendant: Xiong, Kao
N-15: 6.2 parts per thousand
Case No: 14DNR.0023
Defendant: Smith, Hal; Grimes, Alex
N-15: 10.4 parts per thousand
Case No: 14DNR.0024
Defendant: Crumb, Angela
N-15: 8.6 parts per thousand
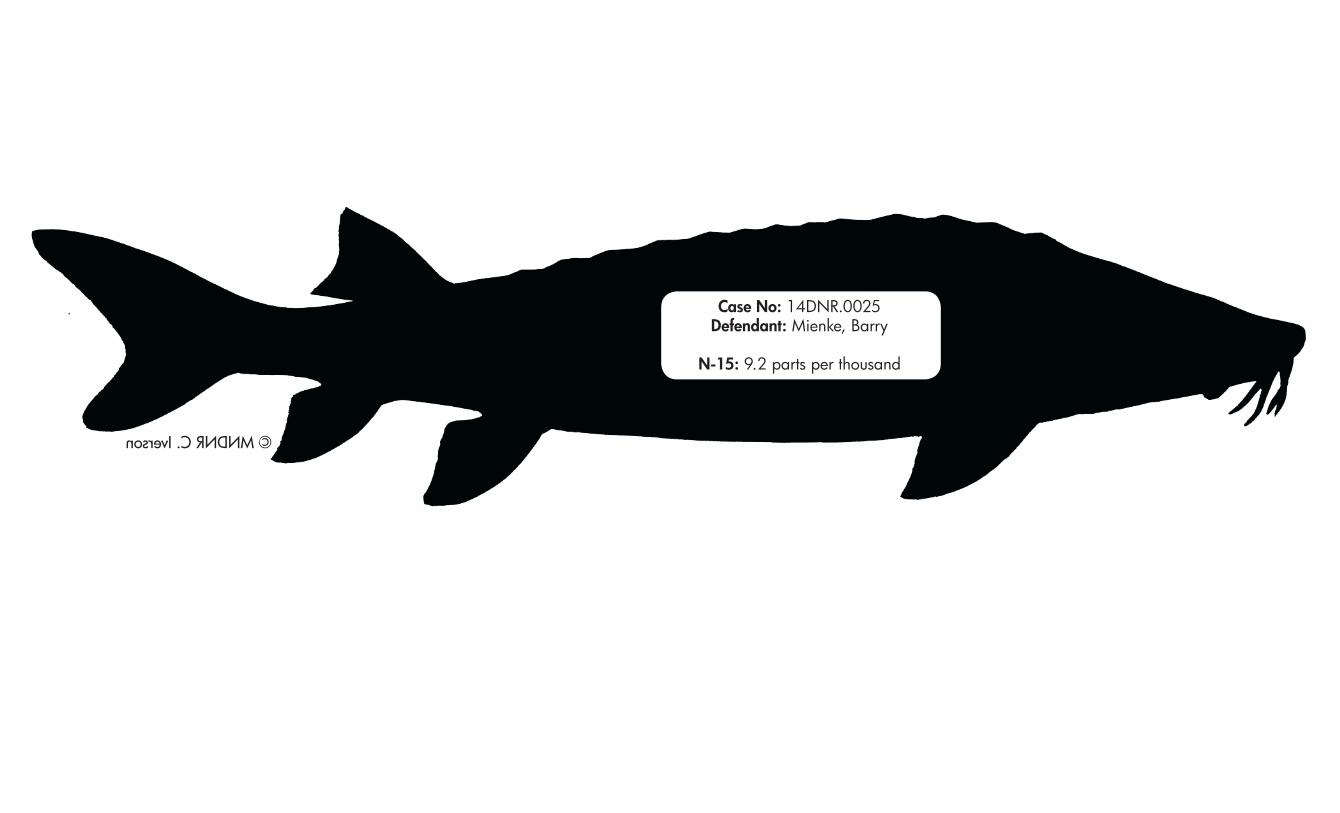
Case No: 14DNR.0025
Defendant: Mienke, Barry
N-15: 9.2 parts per thousand
Case No: 14DNR.0026
Defendant: Johnson, Karl
N-15: 6.3 parts per thousand
Case No: 14DNR.0027
Defendant: Zimmerman, Josh & Anna
N-15: 7.7 parts per thousand
Case No: 14DNR.0028
Defendant: Peterson, Abe
N-15: 7.2 parts per thousand
Case No: 14DNR.0029
Defendant: Mayer, Jose
N-15: 7.2 parts per thousand
Case No: 14DNR.0030
Defendant: Timms, Arne & Stacy
N-15: 7.2 parts per thousand

Lake Sturgeon Evidence Tags Answer Key
Science Institute for Educators Becoming a Scientist: CSI: Fish
Case No: 14DNR.0020
Defendant: Hanes, Jim & Deb
N-15: 5.4 parts per thousand
St. Croix River
Case No: 14DNR.0021
Defendant: Xiong, Kao
N-15: 6.2 parts per thousand
St. Croix River
Case No: 14DNR.0023
Defendant: Smith, Hal; Grimes, Alex
N-15: 10.4 parts per thousand
St. Louis River
Case No: 14DNR.0024
Defendant: Crumb, Angela
N-15: 8.6 parts per thousand
Ambiguous/Unknown
Case No: 14DNR.0025
Defendant: Mienke, Barry
N-15: 9.2 parts per thousand
St. Louis River
Case No: 14DNR.0026
Defendant: Johnson, Karl
N-15: 6.3 parts per thousand
St. Croix River
Case No: 14DNR.0027
Defendant: Zimmerman, Josh & Anna
N-15: 7.7 parts per thousand
St. Croix River
Case No: 14DNR.0028
Defendant: Peterson, Abe
N-15: 7.2 parts per thousand
St. Croix River
Case No: 14DNR.0029
Defendant: Mayer, Jose
N-15: 7.2 parts per thousand
St. Croix River
Case No: 14DNR.0030
Defendant: Timms, Arne & Stacy
N-15: 7.2 parts per thousand
St. Croix River

© MNDNR C. Iverson

© MNDNR C. Iverson
Case No: 14DNR.0020Defendant: Hanes, Jim & Deb
N-15: 5.4 parts per thousand

© MNDNR C. Iverson

© MNDNR C. Iverson
Case No: 14DNR.0021Defendant: Xiong, Kao
N-15: 6.2 parts per thousand

© MNDNR C. Iverson

© MNDNR C. Iverson
Case No: 14DNR.0023Defendant: Smith, Hal; Grimes, Alex
N-15: 10.4 parts per thousand

© MNDNR C. Iverson

© MNDNR C. Iverson
Case No: 14DNR.0024Defendant: Crumb, Angela
N-15: 8.6 parts per thousand

© MNDNR C. Iverson
© MNDNR C. Iverson
Case No: 14DNR.0025Defendant: Mienke, Barry
N-15: 9.2 parts per thousand

© MNDNR C. Iverson

© MNDNR C. Iverson
Case No: 14DNR.0026Defendant: Johnson, Karl
N-15: 6.3 parts per thousand

© MNDNR C. Iverson

© MNDNR C. Iverson
Case No: 14DNR.0027Defendant: Zimmerman, Josh & Anna
N-15: 7.7 parts per thousand
© MNDNR C. Iverson

© MNDNR C. Iverson
Case No: 14DNR.0028Defendant: Peterson, Abe
N-15: 7.2 parts per thousand

© MNDNR C. Iverson

© MNDNR C. Iverson
Case No: 14DNR.0029Defendant: Mayer, Jose
N-15: 7.2 parts per thousand

© MNDNR C. Iverson

© MNDNR C. Iverson
Case No: 14DNR.0030Defendant: Timms, Arne & Stacy
N-15: 7.2 parts per thousand