Embed Size (px)
Citation preview
CSE217
INTRODUCTION TO DATA SCIENCE
Spring 2019
Marion Neumann
LECTURE 7: CLUSTERING
Contents in these slides may be subject to copyright. Some of there materials are derived from (c) Eamonn Keogh, [email protected].
.

RECAP: LEARNING FROM DATA
• Regression
2

RECAP: LEARNING FROM DATA
• Classification
3

RECAP: LEARNING FROM DATA
• Clustering
4

CLUSTERING – FORMAL DEFINITION
• Definition (clustering):Organizing data into groups such that there is• high similarity within each group
• low similarity across the groups
à difference to classification:• we find the class labels directly from the data • no supervision:
• no predefined set of labels
• no labeled data points
5

HOW TO GROUP?
• different groupings:
6

CLUSTERING – FORMAL DEFINITION
• Definition (clustering):Organizing data into groups such that there is• high similarity within each group• low similarity across the groups
• What is the key concept in this definition?à Similarity!
7

WHAT IS SIMILARITY?
• Definition: (similarity)The quality or state of being similar; likeness; resemblance; as, a similarity of features. (Webster's Dictionary)
8

DISTANCE MEASURES• Let’s use our knowledge from math:
distance measures
• Desired properties:• d(A,B) = d(B,A) Symmetry • d(A,A) = 0 Constancy of Self-Similarity• d(A,B) = 0 ⟺ A= B Positivity (Separation)• d(A,B) £ d(A,C) + d(B,C) Triangular Inequality
• Distance measure depends on the data representation!
• Examples:• edit distance• Euclidean distance• Manhattan distance
9
distance between two objects O1 and O2 is a
real numberd(O1, O2)
math & statistics
Peter Piotr

DISTANCE MEASURES
• Definition: (Euclidean Distance)
• Definition: (Manhattan Distance)
10

TYPES OF CLUSTERING
• Partitional algorithms:à construct various
partitions and then evaluate them by some criterion
• Hierarchical algorithms:à create a hierarchical
decomposition of the set of objects using some criterion(not our focus…)
11

WHAT IS A GOOD PARTITIONING?
à minimize objective function12
10
1 2 3 4 5 6 7 8 9 10
1
2
3
4
5
6
7
8
9
This is hard!Brute-force is veeeeryinefficient…

K-MEANS ALGORITHM
1) Decide on a value for k.
2) Initialize the k cluster centers • randomly, or • smartly
3) Decide the class memberships of the N objects by assigning them to the nearest cluster center
4) Re-estimate the k cluster centers, by assuming the memberships found above are correct
5) If none of the n objects changed membership in the last iteration à EXIT. Otherwise GOTO 3)
13
Efficient approximation(heuristic solution)

K-MEANS VISUALIZATION
14
16#42%©%Copyright%2010=2015%Cloudera.%All%rights%reserved.%Not%to%be%reproduced%or%shared%without%prior%wri(en%consent%from%Cloudera.%
Clustering%(1)%
K-MEANS VISUALIZATION
15
16#43%©%Copyright%2010=2015%Cloudera.%All%rights%reserved.%Not%to%be%reproduced%or%shared%without%prior%wri(en%consent%from%Cloudera.%
Clustering%(2)%
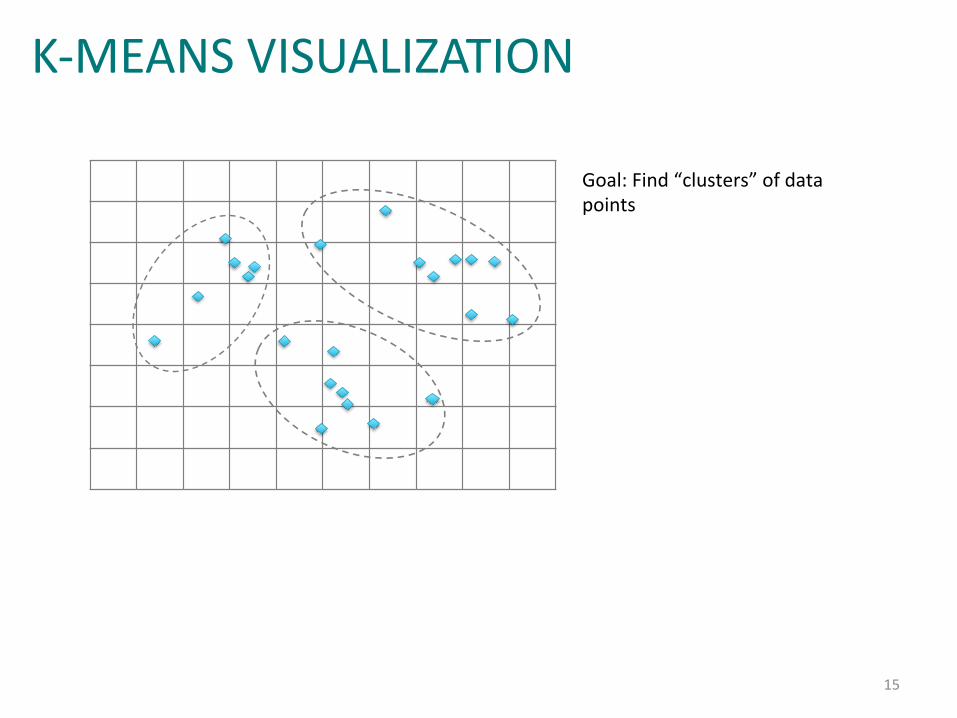
Goal:%Find%“clusters”%of%data%points%

K-MEANS VISUALIZATION
16
16#44%©%Copyright%2010=2015%Cloudera.%All%rights%reserved.%Not%to%be%reproduced%or%shared%without%prior%wri(en%consent%from%Cloudera.%
Example:%k=means%Clustering%(1)%
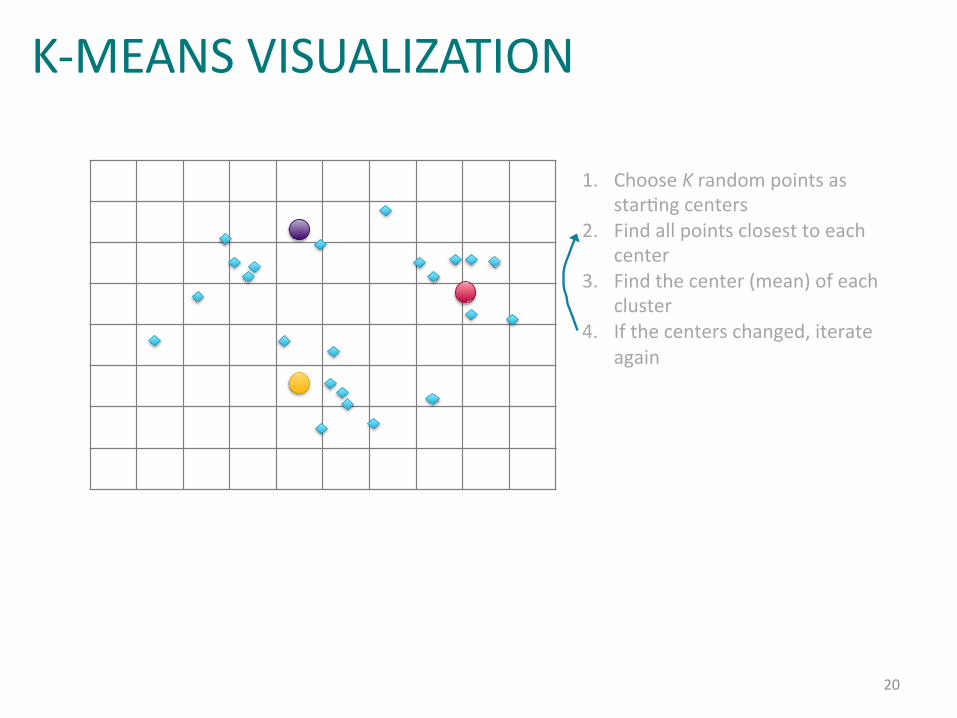
1. Choose%K%random%points%as%starIng%centers%

17
16#45%©%Copyright%2010=2015%Cloudera.%All%rights%reserved.%Not%to%be%reproduced%or%shared%without%prior%wri(en%consent%from%Cloudera.%
Example:%k=means%Clustering%(2)%
1. Choose%K%random%points%as%starIng%centers%
2. Find%all%points%closest%to%each%center%
K-MEANS VISUALIZATION
18
16#46%©%Copyright%2010=2015%Cloudera.%All%rights%reserved.%Not%to%be%reproduced%or%shared%without%prior%wri(en%consent%from%Cloudera.%
Example:%k=means%Clustering%(3)%
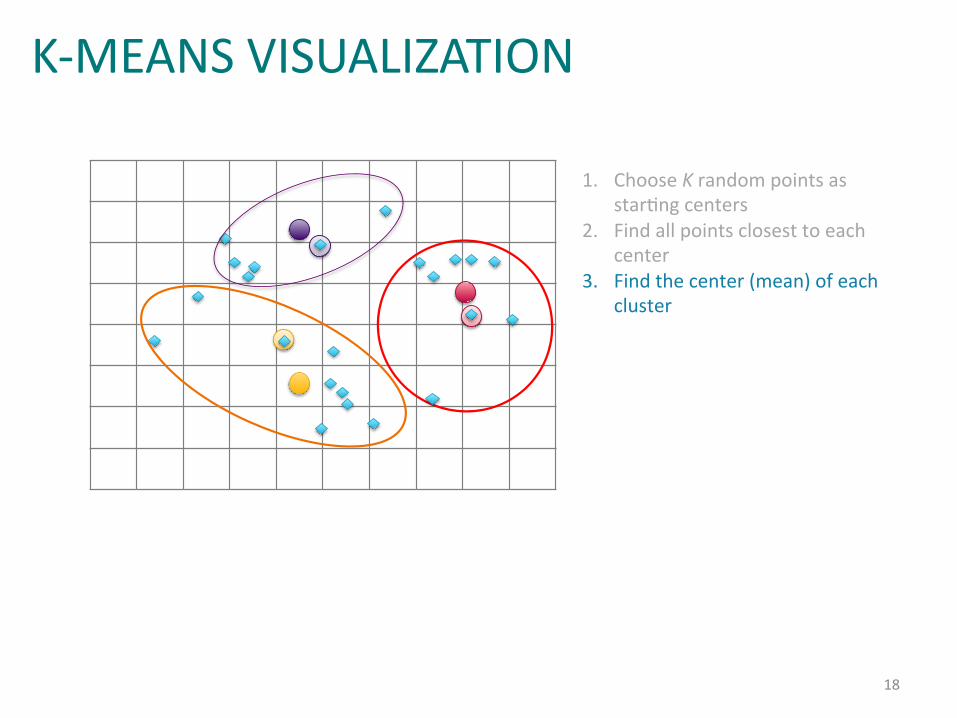
1. Choose%K%random%points%as%starIng%centers%
2. Find%all%points%closest%to%each%center%
3. Find%the%center%(mean)%of%each%cluster%
K-MEANS VISUALIZATION
19
16#47%©%Copyright%2010=2015%Cloudera.%All%rights%reserved.%Not%to%be%reproduced%or%shared%without%prior%wri(en%consent%from%Cloudera.%
Example:%k=means%Clustering%(4)%
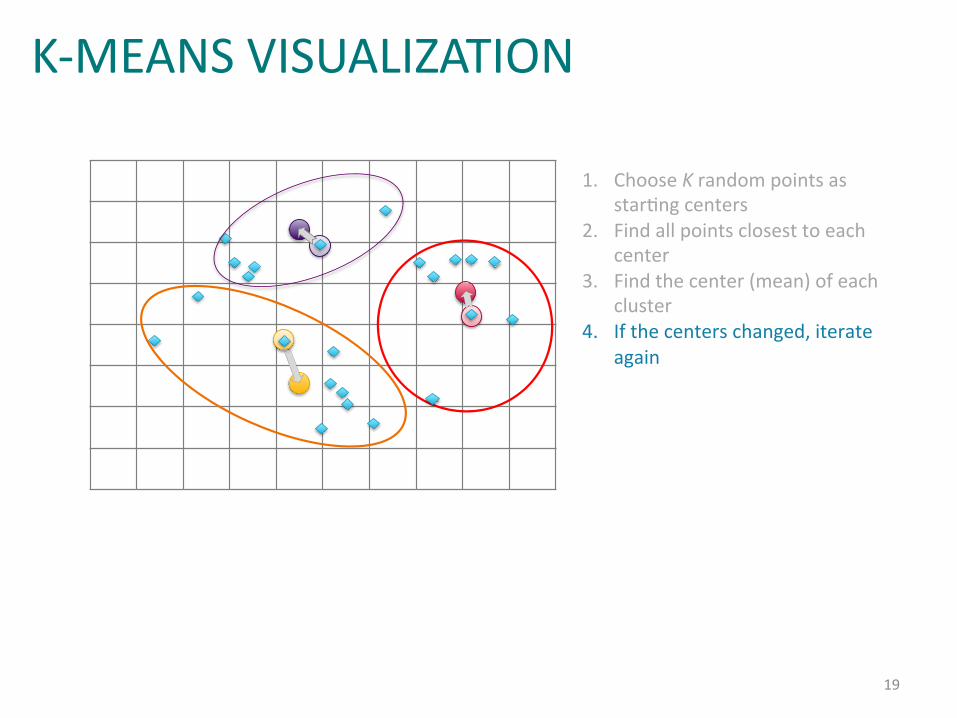
1. Choose%K%random%points%as%starIng%centers%
2. Find%all%points%closest%to%each%center%
3. Find%the%center%(mean)%of%each%cluster%
4. If%the%centers%changed,%iterate%again%
K-MEANS VISUALIZATION
20
16#48%©%Copyright%2010=2015%Cloudera.%All%rights%reserved.%Not%to%be%reproduced%or%shared%without%prior%wri(en%consent%from%Cloudera.%
Example:%k=means%Clustering%(5)%
1. Choose%K%random%points%as%starIng%centers%
2. Find%all%points%closest%to%each%center%
3. Find%the%center%(mean)%of%each%cluster%
4. If%the%centers%changed,%iterate%again%
K-MEANS VISUALIZATION

21
16#49%©%Copyright%2010=2015%Cloudera.%All%rights%reserved.%Not%to%be%reproduced%or%shared%without%prior%wri(en%consent%from%Cloudera.%
Example:%k=means%Clustering%(6)%
1. Choose%K%random%points%as%starIng%centers%
2. Find%all%points%closest%to%each%center%
3. Find%the%center%(mean)%of%each%cluster%
4. If%the%centers%changed,%iterate%again%
K-MEANS VISUALIZATION

22
16#50%©%Copyright%2010=2015%Cloudera.%All%rights%reserved.%Not%to%be%reproduced%or%shared%without%prior%wri(en%consent%from%Cloudera.%
Example:%k=means%Clustering%(7)%
1. Choose%K%random%points%as%starIng%centers%
2. Find%all%points%closest%to%each%center%
3. Find%the%center%(mean)%of%each%cluster%
4. If%the%centers%changed,%iterate%again%
K-MEANS VISUALIZATION

23
16#51%©%Copyright%2010=2015%Cloudera.%All%rights%reserved.%Not%to%be%reproduced%or%shared%without%prior%wri(en%consent%from%Cloudera.%
Example:%k=means%Clustering%(8)%
1. Choose%K%random%points%as%starIng%centers%
2. Find%all%points%closest%to%each%center%
3. Find%the%center%(mean)%of%each%cluster%
4. If%the%centers%changed,%iterate%again%
K-MEANS VISUALIZATION

24
16#52%©%Copyright%2010=2015%Cloudera.%All%rights%reserved.%Not%to%be%reproduced%or%shared%without%prior%wri(en%consent%from%Cloudera.%
Example:%k=means%Clustering%(9)%
1. Choose%K%random%points%as%
starIng%centers%
2. Find%all%points%closest%to%each%center%
3. Find%the%center%(mean)%of%each%
cluster%
4. If%the%centers%changed,%iterate%again%
…%
5. Done!%
K-MEANS VISUALIZATION

25
16#53%©%Copyright%2010=2015%Cloudera.%All%rights%reserved.%Not%to%be%reproduced%or%shared%without%prior%wri(en%consent%from%Cloudera.%
Example:%Approximate%k=means%Clustering%
1. Choose%K%random%points%as%starIng%centers%
2. Find%all%points%closest%to%each%center%
3. Find%the%center%(mean)%of%each%cluster%
4. If%the%centers%changed%by%more%than%c,%iterate%again%…%
5. Close%enough!%
K-MEANS VISUALIZATION
K-MEANS – STRENGTHS & WEAKNESSES
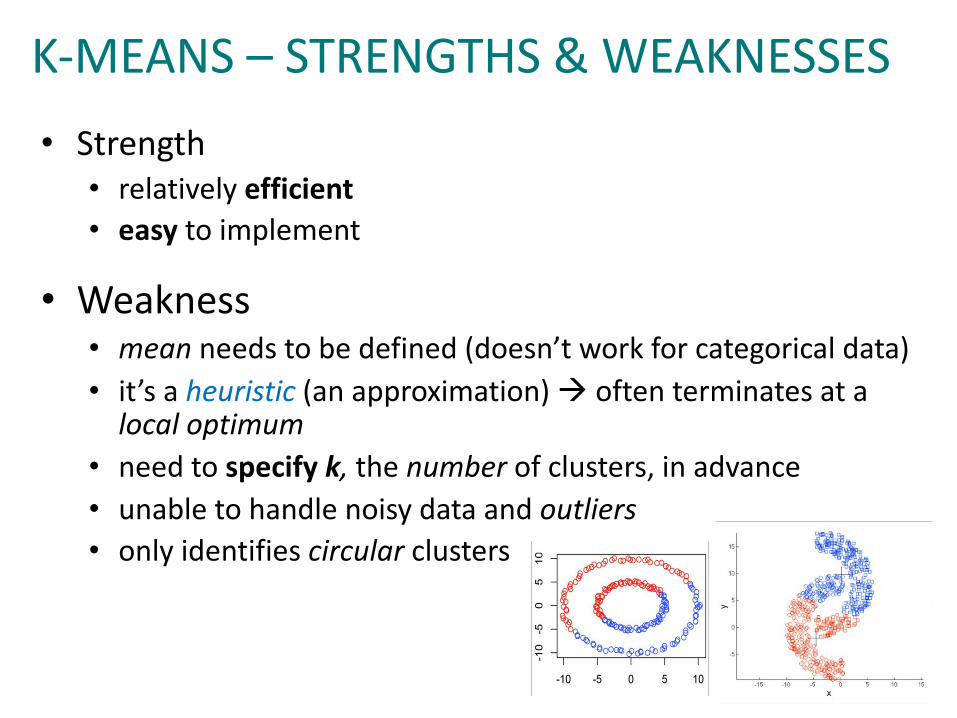
• Strength • relatively efficient• easy to implement
• Weakness• mean needs to be defined (doesn’t work for categorical data)• it’s a heuristic (an approximation) à often terminates at a
local optimum• need to specify k, the number of clusters, in advance• unable to handle noisy data and outliers• only identifies circular clusters
26

NUMBER OF CLUSTERS• required as input to k-means• unclear how many to use
Example: • katydid/grasshopper dataset• imagine that we do not know
the class labels
à use objective function to find k
27
10
1 2 3 4 5 6 7 8 9 10
123456789

1
0.8
0.6
0.4
0.2
103
NUMBER OF CLUSTERSà use objective function to find k
Find k1) plug in different values for k2) compute clustering3) compute value of objective
function4) plot5) look for elbow
281 2 3 4 5 6 7 8 9 10
When k = 1, the objective function is 873.0
1 2 3 4 5 6 7 8 9 10
When k = 2, the objective function is 173.1
1 2 3 4 5 6 7 8 9 10
When k = 3, the objective function is 133.6

APPLICATIONS
• EDA: Explore and Understand data• Color compression• Find distribution centers• Make recommendations
29

SUMMARY & READING
• Clustering requires similarity/distance measure.• Clustering is used to reveal groupings of data points.• We don’t have labels, but we still learn from the
data à unsupervised learning
30
• DSFS• Ch19: Clustering (p225-232)
• PDSH• Ch5: ML – k-Means Clustering (p462-476) SciKit
Learn
understandthe model use the
model in practice
![CSE217 INTRODUCTION TO DATA SCIENCEm.neumann/sp2019/cse217/slides/00_Logistics.pdfREADING AND SETUP No real course book. Reference books: • [PDSH]Python Data Science Handbookby VanderPlas,](https://img.pdfslide.us/doc/110x75/6056ef8111115f41e73ee44b/cse217-introduction-to-data-science-mneumannsp2019cse217slides00-reading-and.jpg)


![SoK: Security and Privacy in Machine Learningcse914/Sp2019/Papers/Paper7-Paper... · object recognition in images [6], machine translation [7], and spam filtering [8]. Unsupervised](https://img.pdfslide.us/doc/110x75/5f7ad14be221d451951c84ce/sok-security-and-privacy-in-machine-cse914sp2019paperspaper7-paper-object.jpg)