Embed Size (px)
Citation preview

Project BlueHat – Final Report
CSE 145 Embedded Systems Design Project – Professor Kastner
Moiz Qureshi – A13182780 Ye Huang – A92424950 Aymane Chafik – A13222663 Eduardo Rosales – A12010890
BlueHat Team:
Moiz Qureshi, Ben Chafik
Eduardo Rosales, Ye Huang
2
Abstract Project BlueHat aims to improve the safety of personnel at outdoor facilities via localized personnel tracking. By adopting bluetooth low energy technology we remove the need for expensive hi-gain RFID antennas which existing solutions use. Project BlueHat trilaterates personnel using an advertising bluetooth low energy device embedded into the top of safety hard-hats where RSSI (received signal strength indicator) data used to determine distances to many observer bluetooth low energy devices that are placed throughout a facility. These observer devices relay data of scanned nearby advertiser devices to our backend server, where RSSI values of scanned advertiser devices are Kalman filtered for conversion to distance values. These distance values are then used to perform a trilateration of that advertiser device. By knowing the location of personnel in a facility during an emergency situation, we can determine who is moving to a designated safe zone or not, and also potentially determine the state of an individual depending on their bio-sensor data.
Introduction Our inspiration for Project BlueHat stems from the desire to develop a creative, but cost-effective solution for personnel localization and tracking, especially in unfortunate emergency situations at potentially hazardous and dangerous facilities. In the very recent past we have seen numerous examples of such situations take place throughout the world. In 2015 an Exxon-Mobile refinery in Torrance, CA had a large explosion that registered a 1.7 magnitude tremor and left four people injured. A nearby and very large tank of hydrofluoric acid, “a gas so toxic it corrodes bone” was luckily left unaffected [1]. In 2011 the Japanese Fukushima Daiichi reactors underwent a meltdown due to a fifteen-meter tsunami (caused by the Tohoku earthquake) disabling the power supply and cooling of three nuclear reactors [2]. These examples of emergency situations at facilities such as oil refineries and rigs, power-plants, and industrial manufacturing facilities are perfect use-case scenarios where a Project BlueHat system can be implemented. Currently there are personnel localization systems in place at these facilities that utilize passive and active RFID (radio frequency identification) technology embedded in ID badges, however these RFID based-systems are very costly where “badges cost about $40 each... and stationary readers at a cost of about $3000 a piece” [3]. Furthermore, some RFID badges cannot be read reliably in emergency situations when there is a large group of people moving through the same exit. Instead of innovating on an RFID-based system, Project BlueHat forgoes RFID technology completely replacing it with bluetooth low energy. By using bluetooth low energy we can implement a very cost effective and super low energy solution that avoids these problems facing RFID. Bluetooth low energy also brings a plethora of additional features that RFID lacks, such as a dynamic data payload. When RFID ID badges are polled or read, they only carry a static data payload containing a specific badge identifier which is used to relate to an individual. RFID systems are not extensible for multipurpose use due to this, therefore no integration with external sensors for motion, pulse, or hazardous gas can be made with an RFID system. If the hydrofluoric acid tanker was affected during the Exxon-Mobil Torrance incident, an RFID system would only relay location information under “ideal” conditions and be incapable of relaying any other vital information especially hazardous gas content in the air surrounding an individual. The BlueHat system is comprised of three major components, two of them being actual hardware and the third being cloud-based. The two hardware components are the BlueHat Advertisers and BlueHat Observers. The cloud-based component is our webserver implemented in Python-Flask. A BlueHat Advertiser is a small form-factor circuit with a bluetooth low energy chipset powered by a coin cell battery that is embedded in a hard-hat or can be attached to a hard-hat. The BlueHat Advertiser

3
device broadcasts packets specific to a universally unique identifier (UUID), where only BlueHat Observer devices that are scanning for broadcasts identified by that UUID can receive those advertised packets. The packet payload will initially contain information regarding which BlueHat Advertiser device is broadcasting that packet (specific UUID identifier), as well as a received signal strength indication (dbm represented in one byte as a two’s complement integer value). However, there is plenty of room to advertise additional data for applications integrating bio-sensors into the BlueHat Advertiser circuit. A BlueHat Observer is simply any bluetooth low energy device that can be programmed to scan for BlueHat Advertisers, collect their advertisement data, and send this data via a web-socket connection to our backend Python-Flask webserver. BlueHat Observer devices can be thought of as WiFi access-points or nodes where many of these devices would be installed throughout a facility at known locations, to provide enough wireless bluetooth coverage. Ideally these BlueHat observer devices would be placed at a maximum of 15m-20m apart for reasons discussed later in the technical portion of this paper. By having a nodal-network of BlueHat Observer devices placed throughout a facility, each Observer device will be constantly scanning for Advertising devices (BlueHat hard-hats), reading and parsing their advertised packet data, and then periodically sending a list of scanned BlueHat Advertiser devices and their data to our backend server over a direct web-socket connection. The backend Python-Flask webserver receives this data from numerous BlueHat Observer devices at a facility in order to process BlueHat Advertiser data. Using direct RSSI to distance conversion would result in very erroneous and noisy data that would be extremely unsuitable for a localization application. Therefore, the Python-Flask webserver implements a Kalman Filter to statistically “smooth” out each BlueHat Advertiser’s RSSI to remove any statistical aberrations that don’t make any sense (i.e. moving 30m on-foot in the span of a second). Once a BlueHat Advertiser’s RSSI is filtered, it can be converted to distance where we can now trilaterate a BlueHat Advertiser’s position from the three closest BlueHat Observers that had scanned it. This trilateration is achieved using the known locations of BlueHat Observer devices and the three calculated, shortest distances mentioned previously. Once trilateration is complete, the location data (xy-coordinates or lat-long) for a BlueHat Advertiser is sent to a connected browser client logged in to our web-dashboard so that it can be used to update the presentation of location tracking and movement of all BlueHat wearing personnel. The Python-Flask webserver application also hosts our web-based dashboard where we can display the present state of a BlueHat ecosystem in a user-friendly way. From the web-based dashboard users can register a BlueHat Observer and Advertiser device using their hardcoded UUID’s so that an ID will be related to an actual individual wearing a BlueHat Advertiser hard-hat. Users can monitor the movements and locations of BlueHat Advertisers on a map of a facility which already displays the location of installed BlueHat Observers. From this we can display and list which BlueHat Advertiser hard-hats have made it to a designated safe zone, are moving towards one, or are completely immobile in case of an emergency.
4
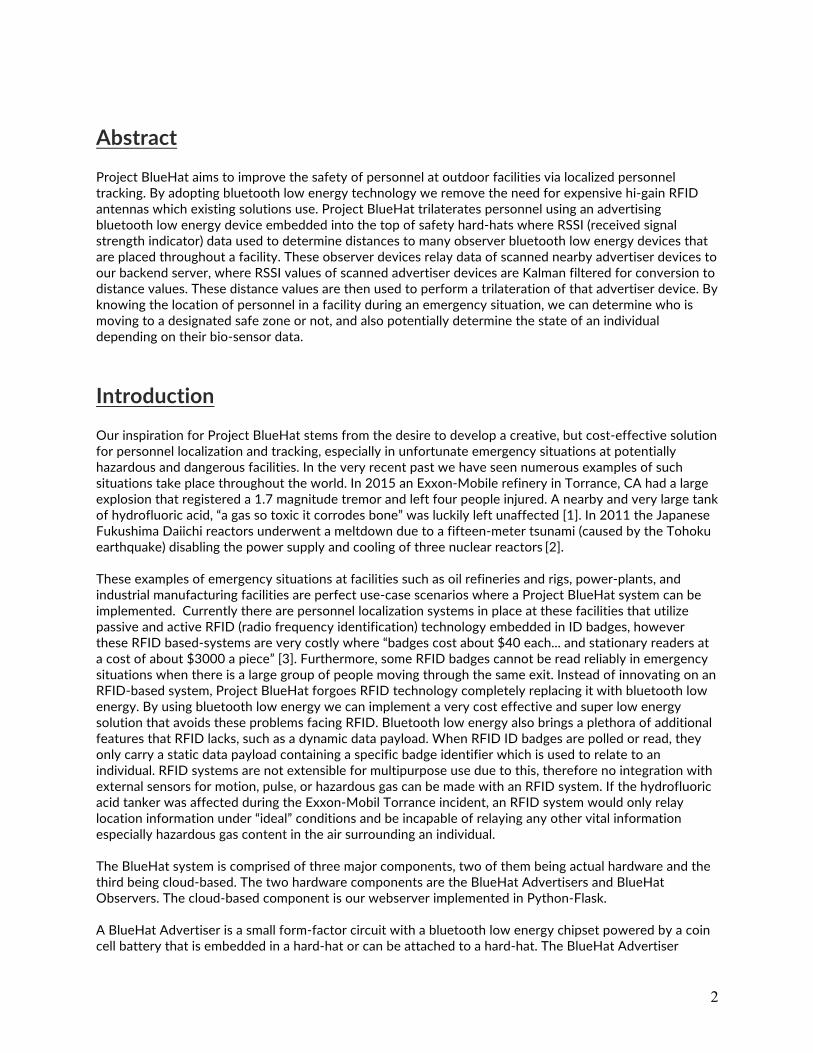
The Tech The objective of Project BlueHat is to provide a working system of BlueHat Advertiser and Observer devices where each BlueHat Observer is periodically sending a JSON array of scanned nearby BlueHat Advertiser devices and their respective advertisement data to our backend Python-Flask webserver via a web-socket connection. The backend Python-Flask webserver is where we offload Kalman Filtering and trilateration of BlueHat Advertiser devices, which we can then present this personnel location information on our web-dashboard in a user-friendly manner. BlueHat Advertiser: Having previous experience with Nordic Semiconductor’s bluetooth low energy chipsets, we initially developed our BlueHat Advertiser using their nRF52 development kit. The nRF52 development kit is mainly comprised of a nRF52832 chipset and an on-board JTAG debugger and programmer. The nRF52832 chipset has the following features that make it very suitable to implement the BlueHat Advertiser with: Nordic Semiconductor nRF52832:
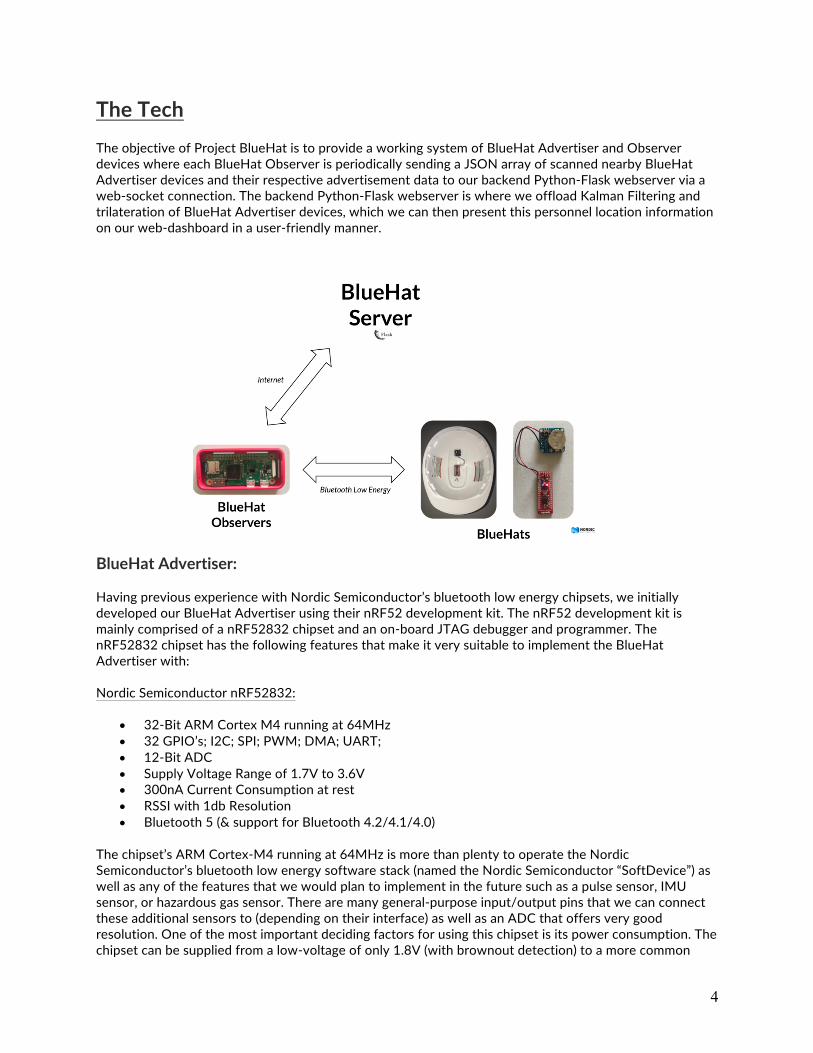
• 32-Bit ARM Cortex M4 running at 64MHz • 32 GPIO’s; I2C; SPI; PWM; DMA; UART; • 12-Bit ADC • Supply Voltage Range of 1.7V to 3.6V • 300nA Current Consumption at rest • RSSI with 1db Resolution • Bluetooth 5 (& support for Bluetooth 4.2/4.1/4.0)
The chipset’s ARM Cortex-M4 running at 64MHz is more than plenty to operate the Nordic Semiconductor’s bluetooth low energy software stack (named the Nordic Semiconductor “SoftDevice”) as well as any of the features that we would plan to implement in the future such as a pulse sensor, IMU sensor, or hazardous gas sensor. There are many general-purpose input/output pins that we can connect these additional sensors to (depending on their interface) as well as an ADC that offers very good resolution. One of the most important deciding factors for using this chipset is its power consumption. The chipset can be supplied from a low-voltage of only 1.8V (with brownout detection) to a more common
5
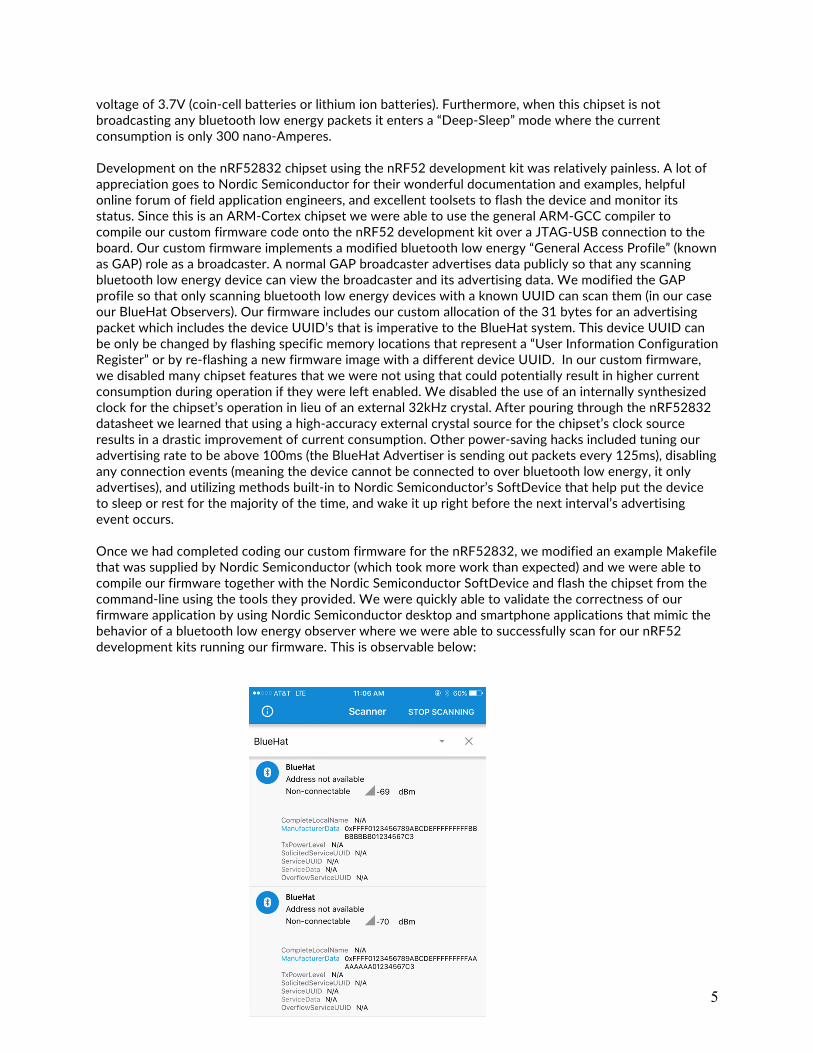
voltage of 3.7V (coin-cell batteries or lithium ion batteries). Furthermore, when this chipset is not broadcasting any bluetooth low energy packets it enters a “Deep-Sleep” mode where the current consumption is only 300 nano-Amperes. Development on the nRF52832 chipset using the nRF52 development kit was relatively painless. A lot of appreciation goes to Nordic Semiconductor for their wonderful documentation and examples, helpful online forum of field application engineers, and excellent toolsets to flash the device and monitor its status. Since this is an ARM-Cortex chipset we were able to use the general ARM-GCC compiler to compile our custom firmware code onto the nRF52 development kit over a JTAG-USB connection to the board. Our custom firmware implements a modified bluetooth low energy “General Access Profile” (known as GAP) role as a broadcaster. A normal GAP broadcaster advertises data publicly so that any scanning bluetooth low energy device can view the broadcaster and its advertising data. We modified the GAP profile so that only scanning bluetooth low energy devices with a known UUID can scan them (in our case our BlueHat Observers). Our firmware includes our custom allocation of the 31 bytes for an advertising packet which includes the device UUID’s that is imperative to the BlueHat system. This device UUID can be only be changed by flashing specific memory locations that represent a “User Information Configuration Register” or by re-flashing a new firmware image with a different device UUID. In our custom firmware, we disabled many chipset features that we were not using that could potentially result in higher current consumption during operation if they were left enabled. We disabled the use of an internally synthesized clock for the chipset’s operation in lieu of an external 32kHz crystal. After pouring through the nRF52832 datasheet we learned that using a high-accuracy external crystal source for the chipset’s clock source results in a drastic improvement of current consumption. Other power-saving hacks included tuning our advertising rate to be above 100ms (the BlueHat Advertiser is sending out packets every 125ms), disabling any connection events (meaning the device cannot be connected to over bluetooth low energy, it only advertises), and utilizing methods built-in to Nordic Semiconductor’s SoftDevice that help put the device to sleep or rest for the majority of the time, and wake it up right before the next interval’s advertising event occurs. Once we had completed coding our custom firmware for the nRF52832, we modified an example Makefile that was supplied by Nordic Semiconductor (which took more work than expected) and we were able to compile our firmware together with the Nordic Semiconductor SoftDevice and flash the chipset from the command-line using the tools they provided. We were quickly able to validate the correctness of our firmware application by using Nordic Semiconductor desktop and smartphone applications that mimic the behavior of a bluetooth low energy observer where we were able to successfully scan for our nRF52 development kits running our firmware. This is observable below:
6
Later on, when we began to test our system indoors and outdoors to collect necessary data to correctly implement a Kalman filter and RSSI-distance conversion, we decided to use the SparkFun nRF52832 Breakout kit which is essentially just the nRF52832 chipset and its required passive and active components, but on a much smaller PCB form-factor compared to the nRF52 development kit. The SparkFun nRF52832 Breakout is about 25mmx38mm, whereas the nRF52 development kit is 100mmx65mm. BlueHat Observer: The BlueHat Observer, to put it simply, searches for nearby BlueHat Advertisers, reads their advertisement data, then creates a list of all scanned BlueHat advertisers and their respective advertisement data as a JSON array, and finally sends this JSON array to the backend Python-Flask webserver. In summary, an Observer scans and reports back to server. Using a Raspberry-Pi-0, we were able to achieve this activity. The Raspberry-Pi-0 is a feature packed piece of hardware that enabled us to connect to a server while also scanning for BlueHat Advertisers. There are three different parts to the BlueHat Observer’s functionality and each part uses a different and independent library. a. Scanning:
This part is where we scan for nearby BlueHat Advertisers. Raspberry-Pi-0 comes with Bluetooth Low-Energy capability already built-in and so using the BluePy library we were able to write a program in Python to scan for our BlueHat Advertisers within range by a specific UUID. The BluePy library itself is written in Python but it sometimes offered more than what we wanted and so we modified the library a tad to accommodate our needs. The program we wrote simply ran a 750ms window of scanning. Within this window we receive information about all and any bluetooth devices within range, even if it’s just a cellphone’s bluetooth, then place within a list. When the 750m window is over we stop and parse our list. Since we have a unique identifier for our Peripherals then we know what we are looking for so we make a new list of only the devices that match our unique identifier.
b. Reporting:
This part deals with reporting back to the server. Every time (or every 1.5 seconds) we run the scanning Python program we receive information from our BlueHat Observers such as their unique ID, their RSSI value, and any advertised data. All this information is necessary for our web client. Fortunately, our Raspberry-Pi-0 is able to connect to and communicate with our server through a web-socket connection. To implement web-socket capability we used the socket.io-client library, which acts as a client to our server which implements a socket.io server. When we get our information from our scanning program, we rewrite this data into a JSON array. To be specific, we wrap each BlueHat Advertiser’s information within a JSON object and then add that JSON object to a JSON array that holds other JSON objects of other scanned BlueHat Advertisers. For example, let’s say our scanning program spat out a list of scanned BlueHat Advertisers as follows:
7
Element 1:
Advertiser_ID = aaaaaaaa Data = 1234567C3 RSSI = -58
Element 2: Advertiser_ID = bbbbbbbb Data = 1234567C3 RSSI = -63
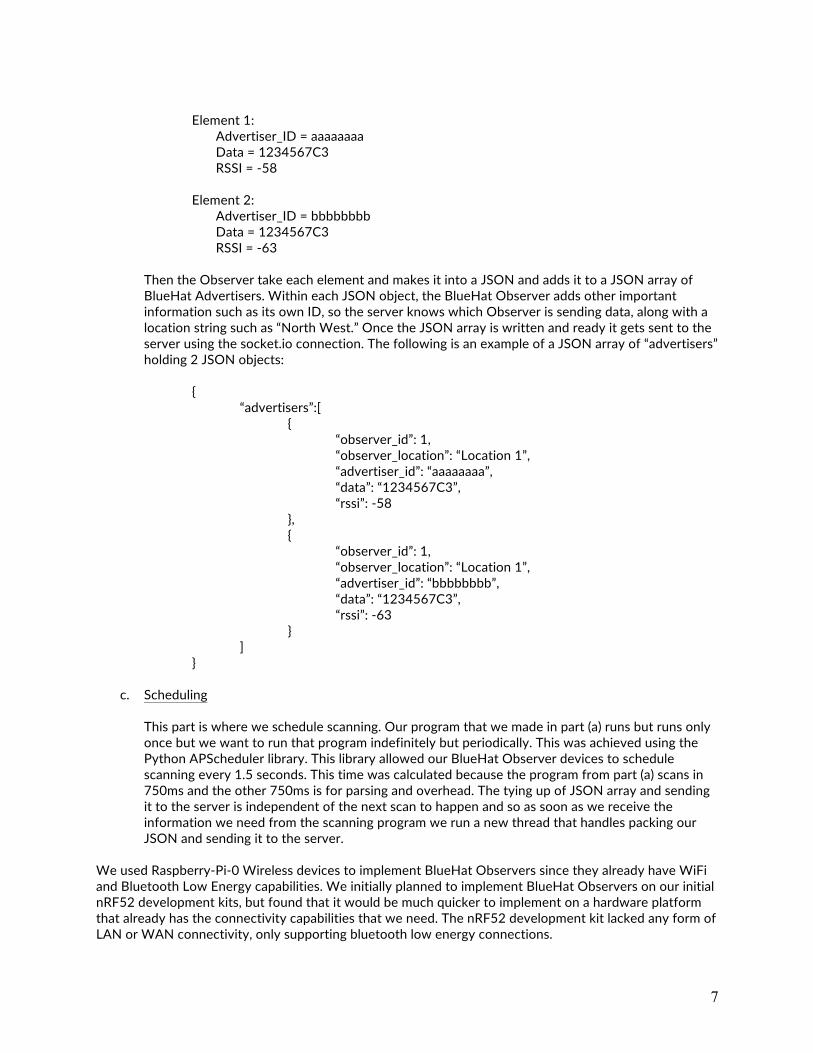
Then the Observer take each element and makes it into a JSON and adds it to a JSON array of BlueHat Advertisers. Within each JSON object, the BlueHat Observer adds other important information such as its own ID, so the server knows which Observer is sending data, along with a location string such as “North West.” Once the JSON array is written and ready it gets sent to the server using the socket.io connection. The following is an example of a JSON array of “advertisers” holding 2 JSON objects:
{ “advertisers”:[ { “observer_id”: 1, “observer_location”: “Location 1”, “advertiser_id”: “aaaaaaaa”, “data”: “1234567C3”, “rssi”: -58 }, { “observer_id”: 1, “observer_location”: “Location 1”, “advertiser_id”: “bbbbbbbb”, “data”: “1234567C3”, “rssi”: -63 }
] }
c. Scheduling This part is where we schedule scanning. Our program that we made in part (a) runs but runs only once but we want to run that program indefinitely but periodically. This was achieved using the Python APScheduler library. This library allowed our BlueHat Observer devices to schedule scanning every 1.5 seconds. This time was calculated because the program from part (a) scans in 750ms and the other 750ms is for parsing and overhead. The tying up of JSON array and sending it to the server is independent of the next scan to happen and so as soon as we receive the information we need from the scanning program we run a new thread that handles packing our JSON and sending it to the server.
We used Raspberry-Pi-0 Wireless devices to implement BlueHat Observers since they already have WiFi and Bluetooth Low Energy capabilities. We initially planned to implement BlueHat Observers on our initial nRF52 development kits, but found that it would be much quicker to implement on a hardware platform that already has the connectivity capabilities that we need. The nRF52 development kit lacked any form of LAN or WAN connectivity, only supporting bluetooth low energy connections.
8 Ticks Ticks
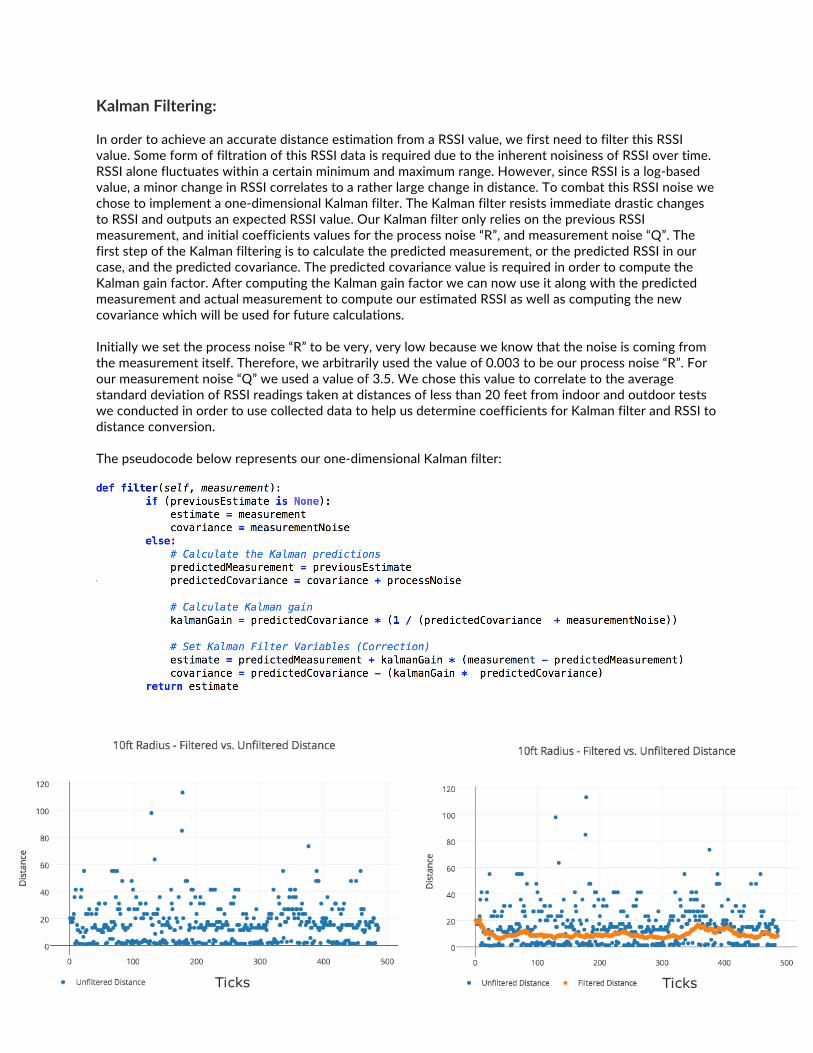
Kalman Filtering: In order to achieve an accurate distance estimation from a RSSI value, we first need to filter this RSSI value. Some form of filtration of this RSSI data is required due to the inherent noisiness of RSSI over time. RSSI alone fluctuates within a certain minimum and maximum range. However, since RSSI is a log-based value, a minor change in RSSI correlates to a rather large change in distance. To combat this RSSI noise we chose to implement a one-dimensional Kalman filter. The Kalman filter resists immediate drastic changes to RSSI and outputs an expected RSSI value. Our Kalman filter only relies on the previous RSSI measurement, and initial coefficients values for the process noise “R”, and measurement noise “Q”. The first step of the Kalman filtering is to calculate the predicted measurement, or the predicted RSSI in our case, and the predicted covariance. The predicted covariance value is required in order to compute the Kalman gain factor. After computing the Kalman gain factor we can now use it along with the predicted measurement and actual measurement to compute our estimated RSSI as well as computing the new covariance which will be used for future calculations. Initially we set the process noise “R” to be very, very low because we know that the noise is coming from the measurement itself. Therefore, we arbitrarily used the value of 0.003 to be our process noise “R”. For our measurement noise “Q” we used a value of 3.5. We chose this value to correlate to the average standard deviation of RSSI readings taken at distances of less than 20 feet from indoor and outdoor tests we conducted in order to use collected data to help us determine coefficients for Kalman filter and RSSI to distance conversion. The pseudocode below represents our one-dimensional Kalman filter:
9
The image above to the left clearly shows how inconsistent and noisy RSSI data can be without any filtering. The image above to the right shows that a Kalman filter can greatly reduce the noise of RSSI data, and therefore reduce the standard deviation of calculated distance values. However, we do notice at the beginning of the graph of the image to the right that it took the Kalman filter a short amount of time to adjust to the correct and known distance. From this we can determine that although the Kalman filter works very well with removing noisy RSSI data, it lacks a small amount in responsiveness, meaning how quickly the Kalman filter can adapt to rapidly changing distances (i.e. a running person). RSSI to Distance Conversion: In order to convert filtered RSSI value to a distance we use the following equation below which is the generic Friis equation rearranged to use RSSI value as an input.
This equation however depends on two values, specifically the “RSSI at 1m” and the “Path-Loss Coefficient”. These values were determined experimentally by collecting RSSI data of our BlueHat Advertisers and Observer devices at known distances in various environments. The “RSSI at 1m” value is unaffected in indoor versus outdoor environments, however, the “Path-Loss Coefficient” is. To determine the “RSSI at 1m” we average the RSSI readings from our BlueHat Observer and Advertiser distanced one meter apart. We collected over 700 RSSI samples at this distance, ran them through our Kalman filter, and averaged the estimated RSSI readings. Our “RSSI at 1m” with this method was estimated to be -53.4 dbm. Now that we have a value for “RSS at 1m” we conducted the rest of our experimental tests of our Observers and Advertisers at incremental distances of one foot from 1ft. to 75ft. in both indoor and outdoor environments. Solving for the “Path-Loss Coefficient” this way since it is the only unknown variable from the RSSI-to-distance equation above, we computed the average of the “Path-Loss Coefficient” at various distances. For indoor environments, we found the “Path-Loss Coefficient” to be 2.2 and for outdoor environments to be 1.5 for distances less than 30ft. We intentionally ignored “Path-Loss Coefficient” values at distances greater than 30ft. because we determined that this is the maximum distance between BlueHat Observer devices, since distances greater than 30ft result in an increase of standard deviation of RSSI readings. However, it is worth noting that the “Path-Loss Coefficients” calculated for distances greater than 30ft were still in agreement with those coefficient values calculated for distances less than 30ft. Trilateration: Redis is an open source, in-memory data structure store, used as a database. We used it as a cache database along with our main database in order to get fast speed to store and load the time-based location related data on the server. We also utilized a featured data structure of Redis, sorted set, to sort the Observer devices by the distances from them to a particular Advertiser device in order to quickly and easily obtain the information of closest three Observer devices for calculating the location coordinates of the Advertiser device later on. We integrated Redis into our Flask platform by using the Flask-Redis Python library. When the server receives the JSON array data from observer devices and after RSSI values have been filtered and converted to distance, we add all this distance data to the sorted set while also timestamping it. We collect the top three rows of the sorted set to do the triangulation of each Advertiser device and combine the result together into a new JSON array. Then we emit this JSON array data to
𝐷𝑖𝑠𝑡𝑎𝑛𝑐𝑒 = 10-../@123-../4567895:1;∗=6>?@A77BA5CCDED5F>
10
connected browser clients every second so that they can have updated location data for every scanned BlueHat Advertiser. Triangulation is done on the server side. Since the calculation of the coordinates are purely arithmetic computation without any loop needed, it's running time would be so small that would not even affect the server side's efficiency. The algorithm for the triangulation is simply using the truth from geometry that we can determine the location of the point by drawing the circle from three known points using corresponding known distances as the radius', then the location of the point will be the intersect point of those three circles. But the biggest issue we were facing here is that our distance's data may not be accurate enough. That means either the intersect points of the circles may be more than one or the circles may not even have any intersect points. We solved this problem by implementing a method we discovered from Jeongyeup Paek et al [4]. This method divides the problem into three situations: first situation is that when two circles have no intersection and one of the circles is in another one's range. For this scenario, we incrementally increase the radius of the inner circle until it intersects with the outer circle. The second situation is when two circles have no intersection and the two are separated, Here, we incrementally increase the radii of both circles until they intersect each other. The third situation is when two circles have at least one intersecting point which is exactly what we want. The first two situations turn into the third one after we increase the radius respectively. Here we need to check if there are two intersect points of two circles, we will choose the one that closer to the center of the third circle. After iterating through each pair of the circles using this method, we get at most three intersecting points that would form a triangular region. To garner more accuracy for this trilateration method, we discovered in Chai et al that in order to reduce the error, we can take the centroid of the region bounded by the three intersecting points (found from the previous step) as our estimate location for the peripheral device [5]. Browser Client: Drawing Map: Once the server receives all the information needed it is then sent over a web-socket to the browser (acting as a web-socket client) page to present the data within it. We did not use any external libraries for this part. Instead we built two libraries. We needed some sort of graph to represent the floorplan and the BlueHat Advertisers within it and represent the movements of personnel. After many searches of a library that would help us we ended up using a simple HTML tag called “canvas.” This is a tag that comes with the HTML language and is not a library, much like calling a “printf” function in some language. We then wrote a library that handles many functionalities that we needed to draw on our website. For example, we wrote a function that takes a list of coordinates and then draw a shape out of those coordinates. This function was particularly helpful when we want to draw the floorplan. Given known vertices of any polygon floorplan we simply enter the various coordinates of each vertex and let the library draw it for us. Two other useful functions we wrote were drawing a marker and deleting a marker within our canvas. This allowed for showing of ‘movement’ of BlueHat Advertisers. Every time we receive a new coordinate of a specific BlueHat Advertiser we simply delete their old marker and then make a new one and it happens simultaneously that it gives the illusion of the marker moving. Other functions that we wrote include adding and changing displayed names on the marker and the coloring of the markers/shapes/lines.
The second library we wrote helped us dynamically create new markers representing BlueHat Advertisers as they are scanned and their location is calculated. The floorplan and BlueHat Observers devices all have known positions and thus are all static within our canvas. Therefore, drawing them was very easy. However, BlueHat Advertisers move and there is no telling where within the canvas they will start. The web page that displays all of that receives all the information needed in order to draw these BlueHat
11
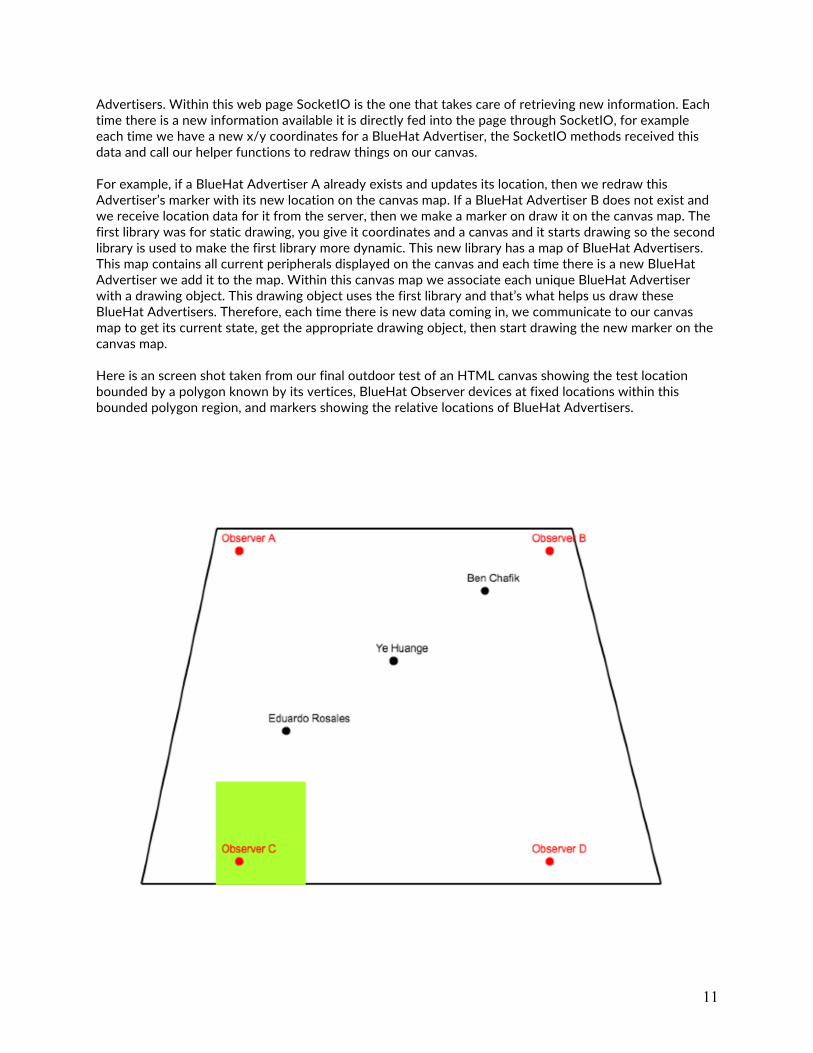
Advertisers. Within this web page SocketIO is the one that takes care of retrieving new information. Each time there is a new information available it is directly fed into the page through SocketIO, for example each time we have a new x/y coordinates for a BlueHat Advertiser, the SocketIO methods received this data and call our helper functions to redraw things on our canvas.
For example, if a BlueHat Advertiser A already exists and updates its location, then we redraw this Advertiser’s marker with its new location on the canvas map. If a BlueHat Advertiser B does not exist and we receive location data for it from the server, then we make a marker on draw it on the canvas map. The first library was for static drawing, you give it coordinates and a canvas and it starts drawing so the second library is used to make the first library more dynamic. This new library has a map of BlueHat Advertisers. This map contains all current peripherals displayed on the canvas and each time there is a new BlueHat Advertiser we add it to the map. Within this canvas map we associate each unique BlueHat Advertiser with a drawing object. This drawing object uses the first library and that’s what helps us draw these BlueHat Advertisers. Therefore, each time there is new data coming in, we communicate to our canvas map to get its current state, get the appropriate drawing object, then start drawing the new marker on the canvas map. Here is an screen shot taken from our final outdoor test of an HTML canvas showing the test location bounded by a polygon known by its vertices, BlueHat Observer devices at fixed locations within this bounded polygon region, and markers showing the relative locations of BlueHat Advertisers.
12
Milestones Milestone 1 Deliverable 1A: Originally, we were making the Observer device with an nRF52 development kit and have it communicate with a Raspberry Pi-0 through UART then have the Pi-0 send the information to the server. However, that changed when learned we could easily use the Raspberry Pi-0 as the observer device. The scanning and response were fast enough so we decided to go with a Pi-0 as our BlueHat Observer devices instead and so in this deliverable we implemented it and tested. No other changes were made to the original deliverable statement. Deliverable 1B: In this deliverable, we used the nRF52 development kit to develop a bluetooth low energy advertising device. We developed the firmware and flashed it to the nRF52 development kits. We tested and validated proper operation and functionality of this by testing with the Nordic Semiconductor desktop and smartphone applications. No changes were made to the original deliverable statement. Deliverable 1C: In this deliverable, we created the boilerplate for our backend server application using the Python-Flask framework. In addition, we implemented base API endpoints for user registration and login, Observer and Advertiser registration, and SocketIO communication routes to be used consumed by BlueHat Observers and browser clients logged into our dashboard. No changes were made to the original deliverable statement. Deliverable 1D: In this deliverable, we tested socket communication between BlueHat Observers and our backend Python-Flask server. To achieve this, we mocked JSON array data so that the BlueHat Observer Raspberry-Pi-0’s can send this mocked data to our backend servers. We confirmed the correct operation of this deliverable by monitor and printing out any data received by our backend server over specific web-socket routes. We correctly received the mocked JSON array data unchanged. No changes were made to the original deliverable statement.
Milestone 2 Deliverable 2A: In this deliverable, we did various indoor and outdoor field tests of collecting RSSI data from our BlueHat Advertisers being scanned by BlueHat Observers at known distances. We repeated these tests numerous times at incremental distances in order to collect a sizeable data set. From this data set we were able to determine the coefficients for Kalman filtering and RSSI to distance conversion. Here we faced some issues due to testing in different environments, specifically indoors versus outdoors. However, testing in indoor and outdoor environments allowed us to discover that the path-loss coefficient, which is required for RSSI to distance conversion, differs greatly in both environments. Using the data collected from both environments we were able to properly tune our system to accommodate outdoor versus indoor distance estimation. No changes were made to the original deliverable statement. Deliverable 2B: In this deliverable. we Implemented and tested our RSSI Kalman filtering algorithm and RSSI to distance conversion. The data and trained RSSI data collected from “Deliverable 2A” were also used here to configure measurement noise and process noise coefficients for the Kalman filter, as well as appropriately setting the path-loss coefficient for RSSI to distance conversion depending on the environment. In addition to this we configured and tested the Redis datastore for backend Python-Flask webserver. Using

13
Redis sorted-sets, we are able to determine the closest 3 Observers to an Advertiser by distance. No changes were made to the original deliverable statement. Deliverable 2C In this deliverable, we implemented trilateration algorithm using Kalman filtered RSSI readings to get coordinates of BlueHat Advertiser devices from three nearest Observers. We then developed the code to send these new coordinates to connected browser clients so and updated location of a person can be displayed. No changes were made to the original deliverable statement. Deliverable 2D In this deliverable, we designed and developed a user-friendly web-dashboard to view overall BlueHat system status of Observer and Advertiser devices. This dashboard is simply used to report on personnel tracking, updates and alerts. We searched tirelessly for a Javascript or web-based library that we could use to draw an indoor or outdoor map of a facility, but could not find any open-source solutions. There were closed-source solutions for which we got a quote on, but were shocked by the price they were asking for. Instead, we developed our own rudimentary, but very functional library for this using HTML canvases. With HTML canvases, we were able to overlay numerous canvas drawings on top of each other; facility floorplan, then markers for Observer devices at specific coordinates with respect to the facility floorplan, then finally markers for any BlueHat Advertisers. No other changes were made to the original deliverable statement. Deliverable 3 This was our last and final deliverable which included the testing of the project, testing with multiple Advertiser and Observer devices. We also recorded our video of the BlueHat system in action. No changes were made to the original deliverable statement.
Conclusion The objective of Project BlueHat was to develop a localized personnel tracking system utilizing bluetooth low energy technology. We developed the Project BlueHat system where we implemented two hardware devices, the BlueHat Observer and Advertiser, along with a backend Python-Flask webserver. The BlueHat Advertiser devices are coin-battery powered bluetooth low energy circuit that are embedded into standard hard-hats that periodically advertises a 31-byte packet containing a unique ID related to the individual wearing the hard-hat and any potential sensor data. The BlueHat Advertiser devices were implemented on custom Nordic Semiconductor nRF52832 chipset based boards. BlueHat Observer devices are stationary devices that are installed throughout a facility where personnel localization is required, and they continuously scan for BlueHat advertisers and their data. This scanned data is then sent to our backend webserver where it can be Kalman filtered to remove RSSI noise, converted to distance, and then run through a trilateration algorithm to determine the relative location of an individual wearing a BlueHat Advertiser hard-hat. This calculated location data is then sent to a browser client that is logged in to our web-based dashboard so they can monitor the location and movement of personnel at a given facility. We believe that we have succeeded in this objective in tracking personnel using bluetooth low energy technology alone. From our experiments with good coverage of BlueHat Observer devices places at a maximum of 30ft apart, we achieved a location accuracy of +/- 8.2ft. (2.5m) for both stationary and non-stationary personnel. However, we did observe a latency of location estimation of non-stationary personnel (individual is running) due to our one-dimensional Kalman filter not being as responsive. There was about a five second delay for the Kalman filter to adjust to rapidly changing RSSI values as the individual moved farther or closer away from BlueHat Observer devices. With the addition of an IMU and including its sensor data in our advertised bluetooth low energy packet, and the incorporation of some form of a simultaneous location and mapping algorithm that would use this data, we believe that the
14
BlueHat system can be extended for far greater accuracy and responsiveness. Furthermore, the one-dimensional Kalman filter that we have now could also be extended to incorporate IMU sensor data as well. Additionally, we did not have the time to incorporate biosensors into our BlueHat advertisers, but we knew this from the beginning of the project. Our main focus and goal was to implement a localization system first that could potentially be used in industrial facilities as noted previously. Also, using a Raspberry-Pi-0 (~$15) as a BlueHat Observer device is not very cost effective. Although it is still much, much cheaper than a $3000 RFID reader, a whole Raspberry-Pi-0 is completely unnecessary. Moving forward, we would forgo the Raspberry-Pi-0 completely and move towards a completely custom solution. A proposed solution would be to utilize the Nordic Semiconductor nRF52832 chipset in unison with a WiFi connectivity chipset (i.e. ESP8266 from Espressif Tech. or a TI-CC32XX) and have a completely custom firmware that would implement BlueHat Observer functionality using these components. The calculated cost of our BlueHat advertiser (including components, PCB, and assembly) equates to about $9. That is nearly one-fourth of the cost of RFID badges which are $40 and offer far less functionality. Potentially life-saving and injury-preventative technology, especially personnel localization and tracking at hazardous facilities, does not need to come with a hefty price-tag. The price of such a system should not deter a company or organization, large or small, from implementing personnel localization system at their facilities. Using new and emerging technologies, problems like personnel localization in such situations can be easily solved with very cost-effective solutions utilizing bluetooth low energy.
15
References
[1] J. J. Zhou and S. McNary, "Enviornment & Science," 10 2 2017. [Online]. Available:
http://www.scpr.org/news/2017/02/10/68923/new-look-at-near-disaster-at-torrance-refinery-rai/. [Accessed 12 6 2017].
[2] World Nuclear Association, "Fukushima Accident," World Nuclear Association, 1 4 2017. [Online]. Available: http://www.world-nuclear.org/information-library/safety-and-security/safety-of-plants/fukushima-accident.aspx . [Accessed 12 6 2017].
[3] C. Swedburg, "BP Refinery Uses RFID for Evacuation System," 5 6 2006. [Online]. Available: http://www.rfidjournal.com/articles/view?2389. [Accessed 12 6 2017].
[4] J. Paek, J. Ko and H. Shin, "A Measurement Study of BLE iBeacon and Geometric Adjustment Scheme for Indoor Location-Based Mobile Applications," Mobile Information Systems, vol. 2016, no. 8367638, p. 13.
[5] S. Chai, R. An and Z. Du, "An Indoor Positioning Algorithm Using Bluetooth Low Energy RSSI," in International Conference on Advanced Material Science and Environmental Engineering (AMSEE 2016).