Embed Size (px)
Citation preview
Csaba Weiner1
ENERGY ONCE AGAIN IN THE SPOTLIGHT: NEW FORMS OF RUSSIAN INVESTMENT PRESENCE IN HUNGARY2
1. Introduction
Recently, increasing attention has focused on Russian attempts at developing their political but also economic influences on other countries. The latter mostly refers to trade and investment. Russian investments in Hungary, however, have attracted considerable inter-est on only a few occasions. Possibly the first time this happened was at the turn of the century when Gazprom was to acquire major-ity stakes in two Hungarian (petro)chemical plants, TVK (now Mol Petrochemicals) and BorsodChem. At the turn of the 2010s, the acquisition of shares in the Hungarian oil and gas company Mol by Surgutneftegaz, Russia’s third-largest oil producer, was deserving of serious scrutiny. And in the mid-2010s, the project for the con-struction of two new reactors at the Paks nuclear power plant (the Paks-2 project) is worthy of special attention. In the first two cases, Russian attempts ultimately proved to be unsuccessful, and thus became examples legitimizing fear of Russian capital. Contrary to these two, Paks-2 is not a foreign direct investment (FDI) issue; however, there are many uncertainties surrounding the project.
In this paper, we measure Russian presence in Hungary in terms of foreign direct investment. To achieve a more compre-hensive view, on the one hand, we look at what the various offi-cial statistics portray, and, on the other, by using company data and case studies, we determine the extent to which the former 1 Вейнер Чаба — кандидат экономических наук, старший научный сотрудник Института
мировой экономики Центра экономических и региональных исследований ВАН. 2 This paper was supported by the János Bolyai Research Scholarship of the Hungarian Academy of Sciences. The research was also partially funded by Hungary’s National Research, Development and Innovation Office under Grant No. K-120053.
194
sources provide an accurate depiction of the real picture. Also, we offer an explanation for the current size of Russian FDI in Hungary. Finally, we show that a new form of Russian investment presence may arise through Paks-2, which will be a much larger project than any Russian FDI in Hungary so far or expected in the future. Paks-2 is not only a game changer for Hungary’s energy policy, but it will have considerable impact on Hungary and Hun-garian–Russian relations.
2. Russian FDI presence in Hungary according to the official statistics
The central banks of Hungary and Russia (MNB and CBR, respectively) provide official data on the size of Russian FDI in Hungary. The Russian Federal State Statistics Service (Rosstat) offers only minimal support in this respect. However, standard FDI statistics are organized on the basis of the immediate host and investing country, and not on the ultimate host and investing country. This is particularly problematic in the case of Russia, as third countries, largely de jure or de facto tax havens and offshore centres, play a significant role in intermediating Russian FDI. Nat-urally, one does not necessarily need to assume suspicious trans-actions behind all investments through a third country. However, ultimately FDI statistics on the immediate host/investing country do not provide a complete image of Russian FDI. Notwithstand-ing, significant changes have been initiated in Hungary recently. In September 2016, the MNB started publishing inward FDI posi-tions according to the country of the ultimate investor.1 The first data is for the end of 2014. For other years, there is no existing
1 FDI statistics on the immediate owners use the 10 per cent threshold of ownership/voting power, while FDI statistics on an ultimate investing country basis identify only one ultimate investor as the ultimate controlling parent of the resident (i.e. Hungarian) company, and allocate the entire stock of foreign direct investment to this one ultimate investor.
195
data, making a comparison across years impossible. In addition, the MNB is not in an easy position, because in many cases it is not easy to credibly identify the ultimate owner.
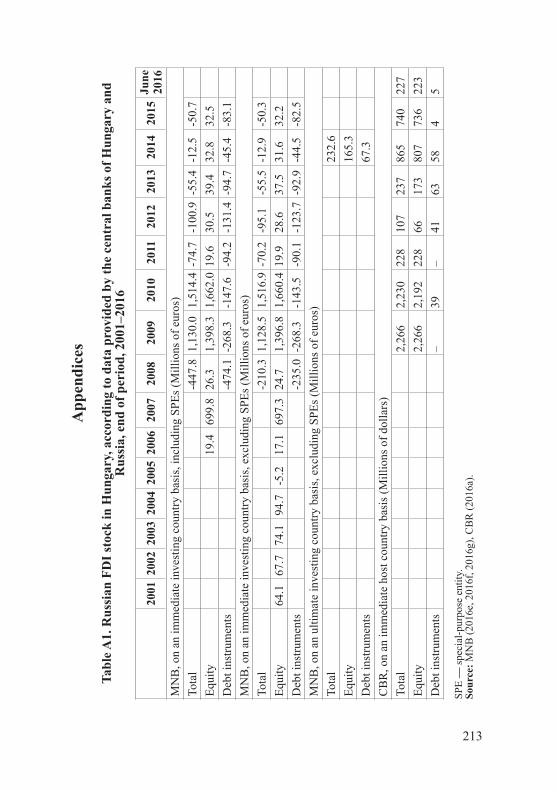
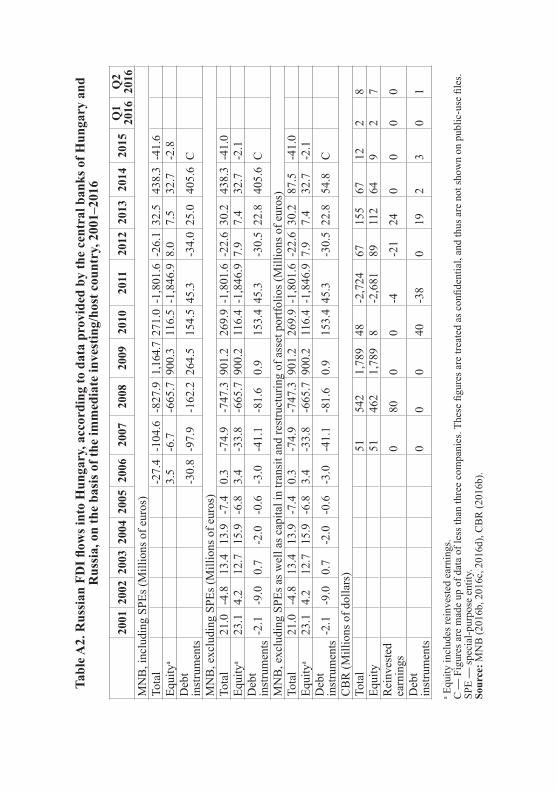
Taking all this into consideration, it is not surprising that offi-cial FDI statistics on the basis of the immediate host/investing country provided by the MNB and the CBR provide different per-spectives of the 2010s (see Tables A1 and A2 in the Appendices). Similarly, it comes as no surprise that according to the MNB, at the end of 2014 Russian FDI stock in Hungary by the ulti-mate owner was larger (EUR 232.6 million) than that of the data measured by the immediate investing country (EUR -12.9 mil-lion1)2. The latter MNB figure, similarly as throughout the 2010s, was negative (see the reasons below). For comparison, the CBR shows USD 865 million for end-2014, though this figure has since been reduced considerably. For the 2010s, the CBR first exhibited a slight rise (at the end of 2013), and then a significant increase (at the end of 2014), followed by a sharp drop (in 2016), return-ing to the level of end-20133. There is, however, no information as to what changes these CBR stock data reflect. The flow data remained low throughout these years4.
Nevertheless, based on the flow and stock data by the MNB, it is clear that the statistics on Russian FDI in Hungary present only a few major transactions, including the unsuccessful takeover attempt by Surgutneftegaz, and a few changes connected to the Rakhimkulov family, namely Megdet Rakhimkulov and his two sons (see below).
1 It is calculated without special-purpose entities.2 MNB (2016a) Breakdown of inward FDI positions according to the country of the ultimate
investor. Central Bank of Hungary (MNB). http://www.mnb.hu/letoltes/en-a-kozvetlentoke-befektetes-allomany-vegso-befektetore-allokallasa-h.pdf
3 CBR (2016a) Russian Federation: Outward foreign direct investment positions by geographical allocation in 2009–2016. Central Bank of Russia (CBR). http://cbr.ru/Eng/statistics/credit_statistics/direct_investment/15e-dir_inv.xlsx
4 CBR (2016b) Russian Federation: Outward foreign direct investments by Russian residents, by geographical allocation, 2007–2015, Q1–Q2 2016. http://cbr.ru/Eng/statistics/credit_statistics/direct_investment/18e-dir_inv.xls
196
In terms of Russian FDI inflows into Hungary, there are three years, i.e. 2008, 2009 and 2011, with exceptionally high data, both negative and positive1 (Being more familiar with what major transactions stand behind the MNB data, we rely on official data from this Hungarian source in the following). High negative value for 2008 is related to a change in the ownership of the Rakhimku-lovs’ large family business (i.e. only a reorganization of the cor-porate ownership structure), followed by a divestment. The high figures for the years 2009 (positive) and 2011 (negative) reflect Surgutneftegaz’s acquisition and sale of shares in Mol. This 21.2 per cent stake is considered to be the single largest item of Rus-sian FDI in Hungary. The deal occupied the sixth place among the top outward merger and acquisition (M&A) transactions from Russia between 2007 and 20092. But due to local resistance to the 2009 takeover, Surgutneftegaz sold the stake to the Hun-garian government in 2011. Even if Surgutneftegaz’s move was threatening in many respects, it is no longer of any relevance. The MNB data show that aside from these three years, a relatively large amount of Russian FDI inflows was received in 20143. This was mostly related to “debt instruments”, a component of FDI alongside “equity” (including reinvested earnings). Furthermore, in this case, transactions are included in the “capital in transit and restructuring of asset portfolios”, a category developed by
1 MNB (2016b) Direct investment flows in Hungary, including SPE’s. https://www.mnb.hu/letoltes/aifdiflowinclspeeuren.xlsx; MNB (2016c) Direct investment flows in Hungary, excluding SPE’s and capital in transit. https://www.mnb.hu/letoltes/aifdiflowexclciteuren.xlsx; MNB (2016d) Direct investment flows in Hungary, excluding SPE’s. https://www.mnb.hu/letoltes/aifdiflowexclspeeuren.xlsx
2 Kuznetsov, A., Chetverikova, A., Toganova, N. (2011) Investment from Russia stabilizes after the global crisis. EMGP Report, IMEMO — Vale Columbia Center on Sustainable International Investment, 23 June. http://ccsi.columbia.edu/files/2013/10/Russia_2011.pdf
3 MNB (2016b) Direct investment flows in Hungary, including SPE’s. https://www.mnb.hu/letoltes/aifdiflowinclspeeuren.xlsx; MNB (2016c) Direct investment flows in Hungary, excluding SPE’s and capital in transit. https://www.mnb.hu/letoltes/aifdiflowexclciteuren.xlsx; MNB (2016d) Direct investment flows in Hungary, excluding SPE’s. https://www.mnb.hu/letoltes/aifdiflowexclspeeuren.xlsx
197
the MNB to separate the distortive effects of inflows and outflows arriving in and leaving Hungary within a short period.
In terms of Russian FDI stock in Hungary, in addition to the high values of end-2009 and end-2010 linked to the Surgutneft-egaz deal, end-2007 also witnessed a noticeable increase in Rus-sian FDI stock1. This was only due to a change in the residency status of Megdet Rakhimkulov, from Hungarian to Russian, thus transforming some of his investments from domestic into Russian ones without the conducting of any real transactions.
Except for the above-listed transactions significantly affecting Russian FDI flow and/or stock data, in statistical terms Russian presence has remained low both from the point of view of Russia and that of Hungary since Vladimir Putin came to power more than one and a half decades ago. Even in the best years Russian FDI in Hungary ever had (at the end of 2009 and 2010), Hunga-ry’s share in total Russian outward FDI stock did not exceed 0.8 per cent. At the end of June 2016, it was only 0.06 per cent, put-ting Hungary in 11th place among the 16 Central and East Euro-pean (CEE) countries, with only USD 227 million2.3
From the Hungarian point of view, some difficulties arise when calculating the share of Russia in the total inward FDI stock held by Hungary as except for the two temporary years with Surgutneft-egaz’s investment, MNB provides negative total Russian FDI stock data (“negative net liabilities”). However, if Russian FDI stock data are disaggregated into equity and debt instruments, one will see that these negative total data are recorded simply because of negative debt instrument stocks, i.e. the negative stocks of debt instruments 1 MNB (2016e) Foreign direct investment position in Hungary, excluding SPE’s. https://www.
mnb.hu/letoltes/aifdistockexclspeeuren.xlsx; MNB (2016f) Foreign direct investment position in Hungary, including SPE’s. https://www.mnb.hu/letoltes/aifdistockinclspeeuren.xlsx
2 CBR (2016a) Russian Federation: Outward foreign direct investment positions by geographical allocation in 2009–2016. Central Bank of Russia (CBR). http://cbr.ru/Eng/statistics/credit_statistics/direct_investment/15e-dir_inv.xlsx
3 At the end of 2015, it still reached USD 740 million, taking 6th place with a share of 0.2 per cent.
198
(“negative net liabilities”) are larger than the positive stocks of equity (“positive net liabilities”).1 In the case of positive total Russian FDI stocks in Hungary, i.e. at the end of 2009 and 2010, Russia’s share accounted for only 1.6 and 2.2 per cent of Hungary’s total inward FDI stock, respectively (if special-purpose entities are excluded) (MNB, 2016e). Measured as a share of GDP, Russia reached a share of 1.2 and 1.5 per cent, accordingly, although one of the highest FDI flows that Hungary received in 2009 came from Russia.
Assessing the sectoral distribution of Russian FDI stock in Hungary is problematic, not only because of the years with a neg-ative FDI stock, but also because in many cases, the figures are made up of data of less than three companies, which should be treated as confidential, and thus are not shown on public-use files. Therefore, in order to have at least more data with a positive value, we should subtract the debt instruments from the total. The results confirm our observation that Russian equity FDI in Hungary are fairly concentrated (i.e. there are a lot of confidential cells). The bulk of them are related to one or two industries and companies. And in the remaining industries, “other capital” transactions (debt instruments) between members of foreign MNEs dominate.
Eurostat’s Foreign AffiliaTes Statistics (FATS) are compiled according to the ultimate controlling institutional unit (UCI) con-cept.2 Inward FATS data show that in 2013, 3,100 Russian-con-1 The stocks of debt instruments are negative mainly because of trade-credit claims (more precisely,
claims are larger than liabilities). These are trade credits among corporate group members in a direct investment relationship. Specifically, foreign (i.e. non-Hungarian) multinational enterprises (MNEs) have subsidiaries both in Hungary and Russia, and these Hungarian subsidiaries trade with the Russian subsidiaries. Most notably, Hungarian subsidiaries supply goods and services to the Russian subsidiaries, reflected in the higher stocks of claims (assets) than those of the liabilities.
2 This means that the ultimate controlling institutional unit (enterprise, branch or natural person) is not controlled by another institutional unit. The words “subsidiary” and “affiliate” can be misleading because these Russian-controlled enterprises can be controlled by either natural persons or companies. As already emphasized, standard FDI statistics (reported according to the immediate owners) use the 10 per cent threshold of ownership/voting power, while FATS statistics are based on the country of the ultimate controlling institutional unit, but do not report the value of the foreign investment stocks.
199
trolled enterprises operated in the EU, compared to 257,000 for-eign-controlled enterprises1. According to this methodology, there were only 134 Russian-controlled enterprises in Hungary. The majority of Russian-controlled enterprises were located in Central and Eastern Europe, including 767 in Latvia, 624 in Bul-garia, 495 in Slovenia and 329 in Croatia. These data, natural-ly, do not include all the companies with Russian involvement. The share of Russian-controlled enterprises in the number of for-eign-controlled enterprises in Hungary was only 0.76 per cent in 2013, making an almost invisible 0.03 per cent contribution in terms of the total number of enterprises in Hungary. The shares of Russian affiliates in the total turnover and employment (the number of persons employed) of all foreign affiliates in Hungary in 2013 were of similarly low proportions, amounting to 0.59 and 0.23 per cent, respectively. Meanwhile, their weight in the turno-ver and employment of all enterprises in Hungary were only 0.31 and 0.06 per cent, accordingly2.
In the case of Hungary, there is no publicly available accurate data on the total number of companies with Russian capital. The Hungarian company registration database is in place, but various important factors — aside from the issue of investments through a third country (a problem already discussed above)3 — prevent executing automatic searches for companies with Russian own-ers. Firstly, regarding the ownership held by Russian natural per-sons, company registries do not require citizenship data (only the owners’ permanent address).4 Secondly, joint-stock compa-
1 Eurostat (2016) Foreign control of enterprises by controlling countries (from 2008 onwards) (fats_g1b_08). http://appsso.eurostat.ec.europa.eu/nui/show.do?dataset=fats_g1b_08&lang=en
2 KSH (n.a.) Activity of foreign affiliates (FATS). Hungarian Central Statistical Office (KSH). http://statinfo.ksh.hu/Statinfo/themeSelector.jsp?page=2&szst=QTD&lang=en
3 One does not necessarily need to think of a third-country company as a special-purpose entity (including/or a holding company). It has happened, for example, that a foreign manufacturing company with a Hungarian subsidiary was taken over by Russian owners.
4 It is important to note, however, that FDI statistics are based on the person’s country of residence rather than his/her country of citizenship.
200
nies, which are typically larger companies in Hungary, are also not required to disclose their ownership structure. Thirdly, mul-ti-layered investments may hide the nationality of the ultimate owners.1 Therefore, any numbers for Russian-interest companies (both with direct or indirect Russian ownership) are approximate. Citing unnamed Russian sources — but essentially just reiterat-ing information that had already been circulated by its predeces-sor, ITD Hungary –, the Hungarian Investment and Trade Agency (HITA) claimed that over 2,000 joint ventures with Russian own-ership were operating in Hungary.2 The Russian trade representa-tion in Hungary also has information about some 2,000 compa-nies with Russian shareholders, mainly small and medium-sized enterprises3. Nonetheless, we suppose that both estimates are based on the Hungarian company registration database.
Due to various methodological and other reasons, there are several important (or more or less important) Russian investments which — either on the basis of the immediate investing country or on an ultimate investing country basis — have certainly not been recorded as Russian FDI by the MNB. Thus, in order to evaluate the whole picture, one also needs to assess company data.
3. Russian presence as observed via company data/case studies
3.1. The case of the RakhimkulovsFor almost 20 years after 1989, Russian corporate presence in
Hungary was facilitated through Megdet Rakhimkulov’s activ-ities. He played a significant role in Hungary — both as a top
1 A simple case is that of a company in Hungary that is set up or acquired by a Hungarian-registered company with a Russian background.
2 HITA’s legal successor is the Hungarian Investment Promotion Agency (HIPA) established in 2014.
3 Hvg.hu (2012) Egyre dinamikusabb a magyar–orosz kereskedelem. 9 March. http://hvg.hu/gazdasag/20120309_magyar_orosz_kereskedelem
201
Russian investor on his own account and as an intermediary for other investors. He was listed as Hungary’s richest businessman in 2005. Rakhimkulov established his fortune in the first half of the 1990s as a senior manager at Gazprom and its Hungarian representative. In those years, Budapest was by far Gazprom’s biggest export destination in the CEE region and the company’s management tried to maintain some of its revenues in Hungary. Not surprisingly, Gazprombank (at that time, Gazprom’s subsid-iary) purchased a Hungarian bank, General Banking and Trust (ÁÉB), as early as in 1996. Later, the bank was gradually tak-en over by the Rakhimkulov family’s companies. Rakhimkulov allegedly played an important role in the attempts of Vyakhirev’s management to outsource Gazprom’s assets into private proper-ty in the late 1990s. Rakhimkulov was involved in facilitating the purchase of stakes in TVK and BorsodChem.1 Rakhimkulov was also associated with Surgutneftegaz’s 2009 attempt at the hostile takeover of Mol. Despite the end of Rakhimkulov’s influ-ence in Gazprom following the arrival of Alexey Miller, the Rus-sian businessman preserved control over his affiliated Hungarian assets such as ÁÉB. Thus, Rakhimkulov became an independent actor with a broad nexus within the Hungarian elite and consider-able financial and institutional capabilities. In spite of his contro-versial track record, many Russian businessmen and politicians allegedly trusted him in their dealings with Hungary. Hence, it has often been difficult to decide whether he made his investment decisions independently or whether they were indirectly linked to third-party Russian interests. He was also an intermediary, and, in some alleged cases, a shadow owner who could accumulate ownership in companies without being noticed and would then later resell it to the real Russian owners. His influence reached its zenith in the mid-2000s. Over the next years, he gradually retired
1 Since 2003, Gazprom has not held any stakes in either company.
202
and formally moved back to Moscow. His two sons took over much of the family’s business activities in Hungary and Cyprus. In the 2000s, the Rakhimkulov family rationalized its portfolio, decreasing their shares of some sectoral assets. All the chemical and machine-industry plants and even ÁÉB were sold to various Austrian companies in the mid-2000s. Today, the Rakhimkulov family primarily seems to be a financial investor. The 8.5 per cent stake (with a voting power of 8.6 per cent) of the Rakhimkulov family in Hungary’s leading retail bank, OTP Bank, considered a portfolio investment and estimated at 0.5 per cent of Hungary’s GDP, constitutes by far the biggest item on the list of Russian investments in Hungary. According to the participants’ narrative, their share is only a financial asset without any relevance for the decision-making process1.
3.2. Investment in gas and oil Gazprom’s main ownership interest in Hungary is Panrusgáz,
an intermediary joint venture for Russian gas imports via Hun-gary’s major long-term gas supply contract. Currently, Gazprom Export, Gazprom’s export arm, has two long-term gas supply contracts with Hungary, including their major one with Hungari-an Gas Trade through Panrusgáz, and a small contract with Cen-trex Hungary, an affiliate of the Gazprombank-owned and Vien-na-based Centrex Europe Energy & Gas AG.2 Panrusgáz sells all the gas it imports to Hungarian Gas Trade. The original motiva-tion behind this complicated scheme was likely Gazprom’s desire to keep the gas sale revenues abroad, outside Russia (see above). 1 Weiner, Cs. (2015) Tracking Russian FDI in Hungary. In Deák, A. (ed.): The End of an Era in
Eurasia? Conflict in Eastern Ukraine and Economic Downturn in the Post-Soviet Space. East European Studies, No. 6. Institute of World Economics, Centre for Economic and Regional Studies, Hungarian Academy of Sciences, Budapest, pp. 120–168; Deák, A., Weiner, Cs. (2016) Country Report: Hungary. Unpublished manuscript prepared for the project “Russian economic influence in new Europe”, Center for the Study of Democracy (Sofia) and Center for Strategic and International Studies (Washington D.C.).
2 Gazprom has not had control over Gazprombank for many years.
203
But whatever rationale was behind the intermediary, today it hard-ly seems to be reasonable. It does not pursue any practical activi-ties except for transferring wholesale gas with relatively low mar-gins. Panrusgáz established a small office in Hungary, which also functions as Gazprom’s local office.
Among the Hungarian gas traders, three have Russian owners. Gazprom has stakes in two of these three. One is the above-men-tioned Centrex Hungary, and the other company is the Russo–German WIEE Hungary. However, the third trader, MET Hunga-ry, is much more important for this discussion. MET Hungary and the Swiss-based MET Holding are the most obscure companies in the current Hungarian gas landscape, especially due to their high political entrenchment. MET’s story is directly linked to cheap-er gas imports from the West. In 2011, the Hungarian legislation established a favourable environment, primarily taken advantage of by MET Hungary, to reap huge profits from gas trading activi-ties in Hungary. Originally, MET Hungary was set up by Mol, and became half-owned by the Belize-based Normeston in late 2009. The only released information stated that Normeston had been owned by a Russian national that year. In 2012, Normeston’s stake was sold to a company registered in the Cayman Islands. Since then, perhaps due to the domestic scandals, the ownership structure has been made public. The present Russian owner of MET Group is Ilya Trubnikov, a Russian–Canadian citizen, with a 12.7 per cent stake. But the beneficiaries of the high profitability years remain only partially clarified.
Gazprom’s other plans and projects in Hungary include fail-ures. After those involving the BorsodChem and TVK transac-tions, Gazprom did not obtain any interest in Mol’s gas business, and neither underground gas storage facilities nor gas pipelines have been built.1 After the cancellation of South Stream, Hunga-1 However, there were pipeline plans already in the 1990s. Also, already in the 1990s, Gazprom
had been present, albeit indirectly, in Hungary’s regional gas distribution.
204
ry elaborated the Tesla gas pipeline (from Turkey across Greece, Macedonia, Serbia, Hungary, ending in Austria), supposedly not independently of behind-the-scene Russian suggestions. Appar-ently, Budapest would like to remain a policy shaper in this issue. In addition, the Hungarian government is keen to bring gas tran-sit to Hungary and fears being left out if any pipelines are built. But the Russian pipeline projects remain attractive predominant-ly as a bargaining chip in Hungary’s gas supply talks. Further, Hungary hopes for better utilization of its idle storage capacities. But even if Hungarian pipeline politics is often characterized as Russia-friendly, this assessment is not fully justified. As a result of so many disappointing projects, enthusiasm for Russian-led pipelines remains rather low in Budapest. Most domestic stake-holders approach any prospective projects with care and caution. Pipeline projects, including non-Russian ones, have lost much of their credibility. But Hungary keeps the Russian connection alive because Moscow is still considered a major policymaker in pipe-line projects1.
Investment in Hungary’s oil industry has also included plenty of failed efforts, including those of Yukos, Surgutneftegaz, Lukoil and Gazprom Neft2.3
3.3. Corporate presence in other sectorsApart from Russia’s presence in the energy sector, there are
only a limited number of important assets in Russian ownership. Hungary’s non-energy/utility and non-telecom infrastructure-re-
1 Deák, A., Weiner, Cs. (2016) Country Report: Hungary. Unpublished manuscript prepared for the project “Russian economic influence in new Europe”, Center for the Study of Democracy (Sofia) and Center for Strategic and International Studies (Washington D.C.).
2 Weiner, Cs. (2015) Tracking Russian FDI in Hungary. In Deák, A. (ed.): The End of an Era in Eurasia? Conflict in Eastern Ukraine and Economic Downturn in the Post-Soviet Space. East European Studies, No. 6. Institute of World Economics, Centre for Economic and Regional Studies, Hungarian Academy of Sciences, Budapest, pp. 120–168.
3 Yet, Gazprom Neft, Gazprom’s oil arm and Russia’s fourth-largest crude producer, is still active in Hungary via Serbia’s NIS oil company, the majority of which is owned by Gazprom Neft.
205
lated industries have also been at the forefront of Russian inves-tors’ interest, though on the whole their investment efforts have not been successful thus far.1 In Hungary, there have only been two Russian-owned banks, including, in the past, ÁÉB, and, now, a subsidiary of Sberbank. Additionally, there is a strong indirect Russian presence in Hungarian metallurgy, and there have also been a few Russian capital-related projects in Hungary’s machin-ery worth mentioning.
One large Russian (and also Ukrainian) industrial investment in Hungary is the ISD Dunaferr steel plant. By the end of the 1990s, Hungarian metallurgy was struggling, due to their low scale of economy, lack of capital and inefficient management. In light of approaching EU accession, privatization was the only feasible way to save the factory. The government had neither the money nor the legal possibilities to subsidize it further. For exter-nal producers, especially those from the former Soviet Union, these capacities offered a means of bypassing EU protectionism of the steel market. But due to the changes in world steel market dynamics, these synergies have since lost much of their relevance, once again reemphasizing the strategic weaknesses of these fac-tories. At the end of 2003, Dunaferr was tendered and bought by a consortium, consisting of Ukraine’s Industrial Union of Don-bass (ISD) and the Swiss Duferco International Trading Hold-ing Ltd. The Russian Severstal also submitted a bid. Nonethe-less, ISD gradually lost the power struggle in the Ukrainian steel industry and its owners were forced to sell their controlling stake of 50 per cent plus two shares in the metallurgical assets of ISD to Russian investors2. Now, as a creditor, Russia’s state-owned Vne-sheconombank (VEB) practically controls ISD. In 2016, there 1 Among others, these have included a project to set up and operate an international warehouse
and logistics centre in Záhony in Eastern Hungary; the plans suggested by Magnit, Russia’s largest grocery retailer by revenue and number of stores, to build a logistics centre and a transport department near Záhony; and the Russian involvement in Malév Hungarian Airlines.
2 Deák, A., Weiner, Cs. (2016) Country Report: Hungary.
206
were reports in the media that VEB was actively seeking a buy-er for ISD 1. In early 2017, media sources suggested that Duna-ferr might get a new Russian owner2. The European steel industry and in particular Dunaferr have been struggling since the 2008–2009 crisis. In 2013, a cost optimisation program was announced. Reacting to this news, the Hungarian government offered to buy ISD Dunaferr, but the proposal was refused. Consequently, the fate of the company has become a sensitive political issue.
Much of the Hungarian machine-building capacity was lost during the transition. Nevertheless, in some cases, past relations with Russian partners could save some capacities, and there are also some examples of newly established, greenfield plants and cooperations.3 In light of the Paks-2 project, the most relevant is the joint venture called Ganz Engineering and Energetics Machin-ery, between Ganz Machinery Works Holding and its Russian state-owned partner. Ganz Engineering and Energetics Machin-ery is involved, among others, in the manufacture and installation of hydromachines, nuclear power station machinery and oil drill-ing equipment4.
1 Kommersant (2016) VEB rasstayetsya s samym dorogim. 6 May. http://www.kommersant.ru/doc/2980313
2 Világgazdaság (2017) Dunaferr: Orosz milliárdos a képben. 24 January. http://www.vg.hu/vallalatok/dunaferr-orosz-milliardos-a-kepben-481414
3 Two agricultural machinery factories in Hungary were owned by a Russian group (Concern Tractor Plants/Agromash Holding B.V.) via Austria’s Vogel & Noot. Concern Tractor Plants/Agromash Holding B.V. took over Vogel & Noot in 2009, but the latter went bankrupt. Since the autumn of 2016, both Hungarian subsidiaries have had German owners.
4 Weiner, Cs. (2015) Tracking Russian FDI in Hungary. In Deák, A. (ed.): The End of an Era in Eurasia? Conflict in Eastern Ukraine and Economic Downturn in the Post-Soviet Space. East European Studies, No. 6. Institute of World Economics, Centre for Economic and Regional Studies, Hungarian Academy of Sciences, Budapest, pp. 120–168; Deák, A., Weiner, Cs. (2016) Country Report: Hungary. Unpublished manuscript prepared for the project “Russian economic influence in new Europe”, Center for the Study of Democracy (Sofia) and Center for Strategic and International Studies (Washington D.C.).
207
4. The Paks-2 project
In January 2014, Prime Minister Viktor Orbán concluded a huge nuclear deal with Russia so that Russia’s State Atomic Ener-gy Corporation Rosatom could participate in the design and con-struction of the future fifth and sixth blocks of the Paks nuclear power plant. The new nuclear blocs will be owned by Hungary and are planned to cost around EUR 12.5 billion, accounting for more than 12 per cent of the Hungarian GDP. The Russian budget will also provide a EUR 10-billion credit line for the project, and VEB will act as an agent for the Russian government.1 The two new units are expected to be commissioned in the middle of the 2020s, with a slightly higher combined capacity than that of the four old blocs. Concurrently, the four old blocs shall be phased out in the 2030s. Undoubtedly, the replacement of the existing nuclear reactors has been a major policy challenge, but the politi-cal motivations behind the sudden decision to implement a major nuclear construction project remain unclear. One of the funda-mental shortcomings of Paks-2 is that, even on the policy level, plans for any alternative solutions have been ruled out. Russia’s offer had a single major financial advantage, namely the size-able loan and its conditions. Without the loan, Budapest likely would not have opted for Paks-2, due to its high short- and medi-um-term political and budgetary costs. The deal was negotiated in total secrecy, without proper policy and political preparation and
1 Five documents have been signed regarding Paks-2. The first, signed on 14 January 2014, establishing the legal basis for Paks-2, is the Hungarian–Russian intergovernmental agreement on cooperation in the peaceful use of nuclear energy. This was followed by the financial intergovernmental agreement (on the intergovernmental loan to be provided to Hungary for financing the construction of the project) concluded on 28 March 2014. On 9 December 2014, Hungary’s MVM Paks II Nuclear Power Plant Development and Rosatom’s NIAEP signed (1) the engineering, procurement and construction (EPC) contract, (2) the operation and maintenance (O&M) contract and (3) the fuel supply contract. Officially, these three documents are called implementation agreements. The only two documents publicly available are the intergovernmental agreement and the loan agreement.
208
without the involvement of state administration. Prime Minister Viktor Orbán was personally involved in the discussions, taking much of the accompanied political risks. Thus, it is not surprising that the contractual regime has serious deficiencies. If we ignore nuclear security and technology aspects, two major types of issues may derail the Paks-2 project: regulatory and management defi-cits. The regulatory deficit is related to the EU regulatory level, and includes technological, energy security, public procurement, financial and competition aspects. The critical management risks for a nuclear power investment and those who bear responsibili-ty are unknown. The major questions here are who will bear the responsibility if the construction is halted or delayed and how will the penalties to be paid by Russia relate to the due interests of the loan instalments, already provided to Hungary. The article in the loan agreement on dispute settlement is just as vague, as it does not incorporate a mechanism for international arbitration. This is complicated by another article in the loan agreement, stat-ing that if the Hungarian party is in financial arrears for over 180 days, then Moscow is entitled to ask for an immediate repayment of the total unpaid debt in a lump sum. As the Hungarian side would obviously be unable to fulfil this condition, the Russian party would, therefore, always have the upper hand in any dis-pute resolution procedures. Understandably, there are many other problems which may arise in the next couple of years1.
5. Summary and conclusions: explaining the low Russian FDI presence
Statistics offer limited help in establishing a real picture of Russian FDI in Hungary. In many cases, indirect FDI have been observed. Consequently, the size and variety of Russian presence
1 Deák, A., Weiner, Cs. (2016) Country Report: Hungary.
209
can only be estimated by analysing company and media sources in meticulous detail. But although the presence of Russian inves-tors in Hungary is more significant than official statistics indicate, the overall picture is not much altered. Not only do the official statistics say that Russian FDI plays a limited role in Hungary but company data suggest the same. Our research shows that among the top 20 non-financial Russian MNEs, only a few companies are active investors in Hungary. Due to the inflow of large-scale Western FDI, Russian FDI has remained minuscule within the total inward FDI stock in Hungary. Russia’s visible or alleged presence also remains relatively humble if compared with some CEE countries. As it was limited to the end of both 2009 and 2010, Hungary’s leading position − in statistical terms − in Cen-tral and Eastern Europe in terms of attracting Russian FDI proved to be temporary, and was only due to the Surgutneftegaz deal.
The reasons for the low Russian FDI activity are manifold. Hungary had a relatively swift economic transformation and an extensive privatization process, including in some major seg-ments of the energy sector in the 1990s. Key positions in the national economy had already been occupied by private compa-nies by the late 1990s when, with a couple of exceptions,1 the first Russian actors capable of investing abroad consolidated them-selves. By the late 1990s, Hungary had almost fully privatized its economy. In the energy sector, the emergence of a domestic private company, Mol, played a crucial role in fighting back Rus-sian investment efforts. In turn, Prime Minister Orbán’s recent drive for renationalization partly explains his limited openness to new Russian FDI. The Hungarian government has recently bought back a high number of energy assets from Western inves-tors, and it would like to keep these for the long term. In certain cases, EU regulatory issues also work in ways that run counter 1 Until 2000, Gazprom and Lukoil accounted for around 90 per cent of Russia’s assets abroad
(RUSAL–EIU, 2006, p. 17).
210
to Russian FDI expectations. For example, the EU’s Third Ener-gy Package for an internal gas and electricity market in the EU limits Russia’s abilities. Furthermore, the Russian capabilities for new investments have been diminished by the 2008–2009 finan-cial crisis and, more recently, by low oil prices and Western sanc-tions against Russia over its actions in Ukraine. Consequently, FDI may now even constitute a less accentuated part of Russian influence in CEE than prior to 2008. In recent years, the invest-ment climate in Hungary has also been unfavourable. It is clear that the controversial “crisis tax” has negatively affected Russian players. The so-called “Robin Hood” tax is a burden on energy firms, while a tax on public utility pipelines and cables has also been introduced. Furthermore, cultural gaps, the non-Slavic lan-guage and the lack of a sizeable Russian diaspora have limited the Russian outreach for many individuals and smaller companies1.
Company data and our case studies demonstrate that the activ-ities of Russian investors in Hungary analysed here have been paved with failures. These have been evident in both divestments and unrealised plans. Kalotay et al.2 suggest that the low share of Russian investment in the Visegrád countries may be referred to as business opportunities that the Russian parties failed to exploit. Our case studies confirm this assumption in the case of Hungary.
As for future Russian investments, FDI projects similar in scope to the Surgutneftegaz deal are not likely in Hungary in the near future. Instead, Hungary might have Paks-2, with an inter-
1 Weiner, Cs. (2015) Tracking Russian FDI in Hungary. In Deák, A. (ed.): The End of an Era in Eurasia? Conflict in Eastern Ukraine and Economic Downturn in the Post-Soviet Space. East European Studies, No. 6. Institute of World Economics, Centre for Economic and Regional Studies, Hungarian Academy of Sciences, Budapest, pp. 120–168; Deák, A., Weiner, Cs. (2016) Country Report: Hungary. Unpublished manuscript prepared for the project “Russian economic influence in new Europe”, Center for the Study of Democracy (Sofia) and Center for Strategic and International Studies (Washington D.C.).
2 Kalotay, K., Éltető, A., Sass, M., Weiner, Cs. (2014) Russian capital in the Visegrád countries. Working Papers, No. 210. Institute of World Economics, Centre for Economic and Regional Studies, Hungarian Academy of Sciences, Budapest, December.
211
governmental loan to be recorded as “other investment” in the financial account of the balance of payments. The Paks-2 deals represent an unexpected turn regarding Hungary’s energy depend-ence. The deals will increase Hungary’s reliance both on Rus-sian nuclear technology and financial support, and raises many questions related to the future of Hungarian–Russian political and economic relations.
Чаба ВейнерЕЩЕ РАЗ ОБ ЭНЕРГЕТИКЕ: НОВЫЕ ФОРМЫ РОССИЙСКОГО ИНВЕСТИЦИОННОГО ПРИСУТСТВИЯ В ВЕНГРИИ
В Центральной и Восточной Европе всегда уделялось особое вни-мание политическому и экономическому влиянию России. Последнее относится главным образом к торговле и инвестициям. В данной статье автор измеряет присутствие российского капитала в Венгрии через пря-мые иностранные инвестиции (ПИИ). Отмечается, что российские ПИИ в Венгрии играют ограниченную роль, хотя в реальности они больше, чем указывает официальная статистика. Автор довольно скептически относится к росту российских ППИ в Венгрии в будущем, но при этом указывает на новый канал присутствия российского капитала: крупный кредит, который будет предоставлен российской стороной на реализацию проекта по строительству новых блоков венгерской АЭС «Пакш». Этот проект представляет собой непредсказуемый поворот в деле энергетиче-ской зависимости Венгрии. Соглашение усилит зависимость Венгрии от России как в сфере атомных технологий, так и в области финансовой под-держки. В этой связи возникает много вопросов, касающихся будущего венгеро–российских политических и экономических отношений.
212
App
endi
ces
Tabl
e A1.
Rus
sian
FD
I sto
ck in
Hun
gary
, acc
ordi
ng to
dat
a pr
ovid
ed b
y th
e ce
ntra
l ban
ks o
f Hun
gary
and
R
ussi
a, e
nd o
f per
iod,
200
1–20
16
2001
2002
2003
2004
2005
2006
2007
2008
2009
2010
2011
2012
2013
2014
2015
June
20
16M
NB
, on
an im
med
iate
inve
stin
g co
untry
bas
is, i
nclu
ding
SPE
s (M
illio
ns o
f eur
os)
Tota
l-4
47.8
1,13
0.0
1,51
4.4
-74.
7-1
00.9
-55.
4-1
2.5
-50.
7Eq
uity
19.4
699.
826
.31,
398.
31,
662.
019
.630
.539
.432
.832
.5D
ebt i
nstru
men
ts-4
74.1
-268
.3-1
47.6
-94.
2-1
31.4
-94.
7-4
5.4
-83.
1M
NB
, on
an im
med
iate
inve
stin
g co
untry
bas
is, e
xclu
ding
SPE
s (M
illio
ns o
f eur
os)
Tota
l-2
10.3
1,12
8.5
1,51
6.9
-70.
2-9
5.1
-55.
5-1
2.9
-50.
3Eq
uity
64.1
67.7
74.1
94.7
-5.2
17.1
697.
324
.71,
396.
81,
660.
419
.928
.637
.531
.632
.2D
ebt i
nstru
men
ts-2
35.0
-268
.3-1
43.5
-90.
1-1
23.7
-92.
9-4
4.5
-82.
5M
NB
, on
an u
ltim
ate
inve
stin
g co
untry
bas
is, e
xclu
ding
SPE
s (M
illio
ns o
f eur
os)
Tota
l23
2.6
Equi
ty16
5.3
Deb
t ins
trum
ents
67.3
CB
R, o
n an
imm
edia
te h
ost c
ount
ry b
asis
(Mill
ions
of d
olla
rs)
Tota
l2,
266
2,23
022
810
723
786
574
022
7Eq
uity
2,26
62,
192
228
6617
380
773
622
3D
ebt i
nstru
men
ts–
39–
4163
584
5
SPE
— sp
ecia
l-pur
pose
ent
ity.
Sour
ce: M
NB
(201
6e, 2
016f
, 201
6g),
CB
R (2
016a
).
213
Tabl
e A2.
Rus
sian
FD
I flow
s int
o H
unga
ry, a
ccor
ding
to d
ata
prov
ided
by
the
cent
ral b
anks
of H
unga
ry a
nd
Rus
sia,
on
the
basi
s of t
he im
med
iate
inve
stin
g/ho
st c
ount
ry, 2
001–
2016
20
0120
0220
0320
0420
0520
0620
0720
0820
0920
1020
1120
1220
1320
1420
15Q
1 20
16Q
2 20
16M
NB
, inc
ludi
ng S
PEs (
Mill
ions
of e
uros
)To
tal
-27.
4-1
04.6
-827
.91,
164.
727
1.0
-1,8
01.6
-26.
132
.543
8.3
-41.
6Eq
uity
a3.
5-6
.7-6
65.7
900.
311
6.5
-1,8
46.9
8.0
7.5
32.7
-2.8
Deb
t in
stru
men
ts-3
0.8
-97.
9-1
62.2
264.
515
4.5
45.3
-34.
025
.040
5.6
C
MN
B, e
xclu
ding
SPE
s (M
illio
ns o
f eur
os)
Tota
l21
.0-4
.813
.413
.9-7
.40.
3-7
4.9
-747
.390
1.2
269.
9-1
,801
.6-2
2.6
30.2
438.
3-4
1.0
Equi
tya
23.1
4.2
12.7
15.9
-6.8
3.4
-33.
8-6
65.7
900.
211
6.4
-1,8
46.9
7.9
7.4
32.7
-2.1
Deb
t in
stru
men
ts-2
.1-9
.00.
7-2
.0-0
.6-3
.0-4
1.1
-81.
60.
915
3.4
45.3
-30.
522
.840
5.6
C
MN
B, e
xclu
ding
SPE
s as w
ell a
s cap
ital i
n tra
nsit
and
rest
ruct
urin
g of
ass
et p
ortfo
lios (
Mill
ions
of e
uros
)To
tal
21.0
-4.8
13.4
13.9
-7.4
0.3
-74.
9-7
47.3
901.
226
9.9
-1,8
01.6
-22.
630
.287
.5-4
1.0
Equi
tya
23.1
4.2
12.7
15.9
-6.8
3.4
-33.
8-6
65.7
900.
211
6.4
-1,8
46.9
7.9
7.4
32.7
-2.1
Deb
t in
stru
men
ts-2
.1-9
.00.
7-2
.0-0
.6-3
.0-4
1.1
-81.
60.
915
3.4
45.3
-30.
522
.854
.8C
CB
R (M
illio
ns o
f dol
lars
)To
tal
5154
21,
789
48-2
,724
6715
567
122
8Eq
uity
5146
21,
789
8-2
,681
8911
264
92
7R
einv
este
d ea
rnin
gs0
800
0-4
-21
240
00
0
Deb
t in
stru
men
ts0
00
40-3
80
192
30
1
a Equ
ity in
clud
es re
inve
sted
ear
ning
s.C
— F
igur
es a
re m
ade
up o
f dat
a of
less
than
thre
e co
mpa
nies
. The
se fi
gure
s are
trea
ted
as c
onfid
entia
l, an
d th
us a
re n
ot sh
own
on p
ublic
-use
file
s.SP
E —
spec
ial-p
urpo
se e
ntity
.So
urce
: MN
B (2
016b
, 201
6c, 2
016d
), C
BR
(201
6b).


![[Susan a. weiner]_introduction_to_chemical_principles](https://img.pdfslide.us/doc/110x75/55b3231cbb61ebb2798b47ab/susan-a-weinerintroductiontochemicalprinciples.jpg)