Embed Size (px)
Citation preview

INTRODUCTION TO MACHINE LEARNING
DATA REPRESENTATION
Mingon Kang, PhD
Department of Computer Science @ UNLV

Data Representation?
How does a computer represent data?
0 and 1 in the aspect of “general” computer science
Vector/Matrix in the aspect of “Machine Learning”
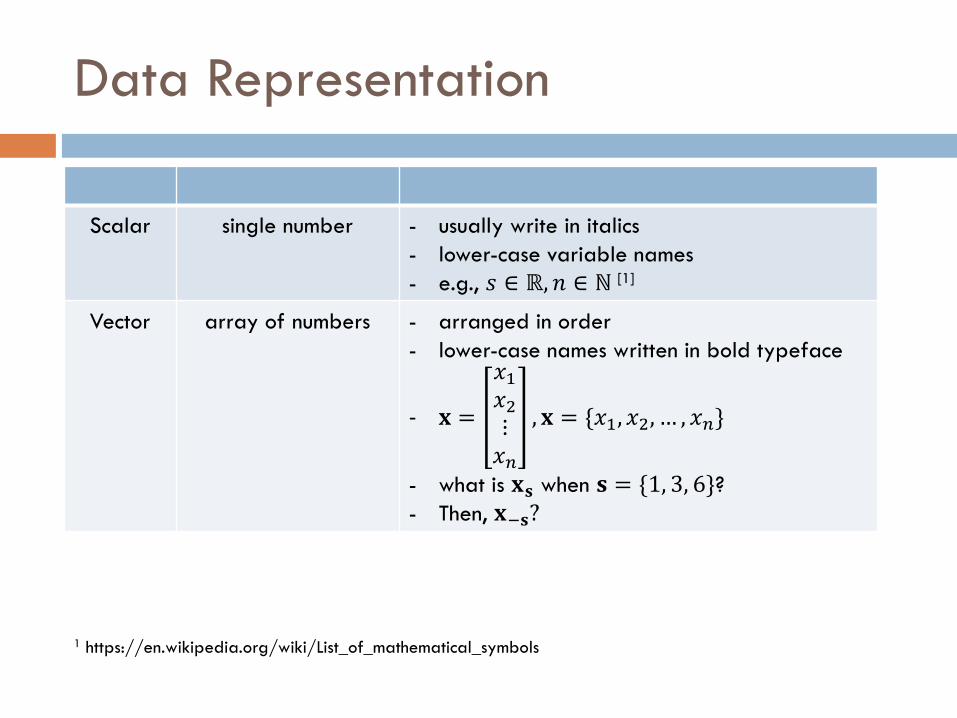
Data Representation
Scalar single number - usually write in italics
- lower-case variable names
- e.g., 𝑠 ∈ ℝ, 𝑛 ∈ ℕ [1]
Vector array of numbers - arranged in order
- lower-case names written in bold typeface
- 𝐱 =
𝑥1𝑥2⋮𝑥𝑛
, 𝐱 = {𝑥1, 𝑥2, … , 𝑥𝑛}
- what is 𝐱𝐬 when 𝐬 = {1, 3, 6}?- Then, 𝐱−𝐬?
1 https://en.wikipedia.org/wiki/List_of_mathematical_symbols
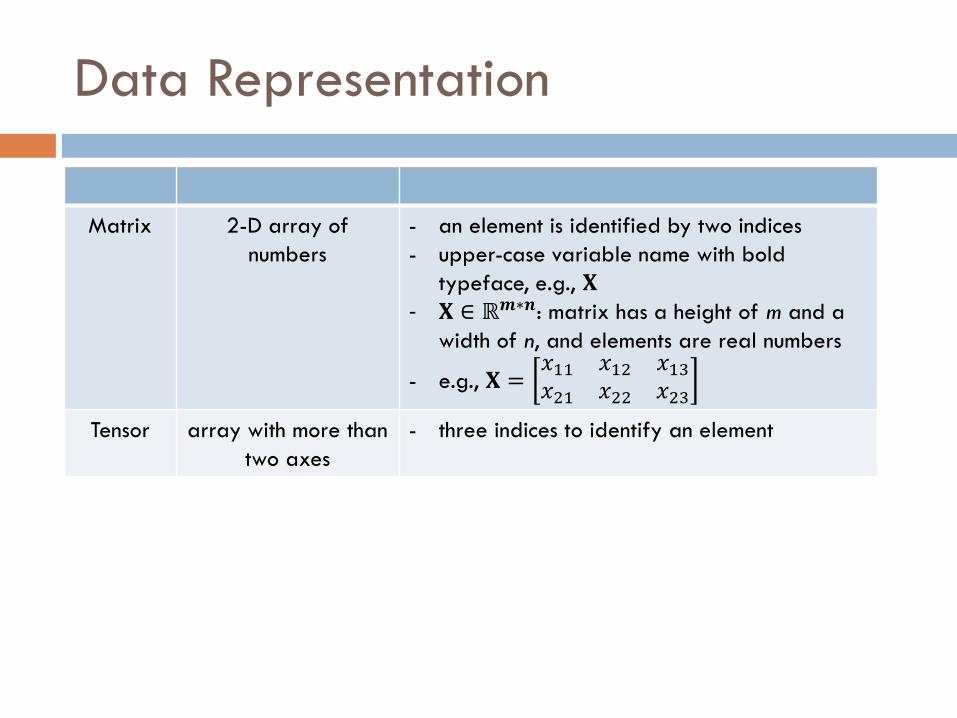
Data Representation
Matrix 2-D array of
numbers
- an element is identified by two indices
- upper-case variable name with bold
typeface, e.g., 𝐗- 𝐗 ∈ ℝ𝒎∗𝒏: matrix has a height of m and a
width of n, and elements are real numbers
- e.g., 𝐗 =𝑥11 𝑥12 𝑥13𝑥21 𝑥22 𝑥23
Tensor array with more than
two axes
- three indices to identify an element
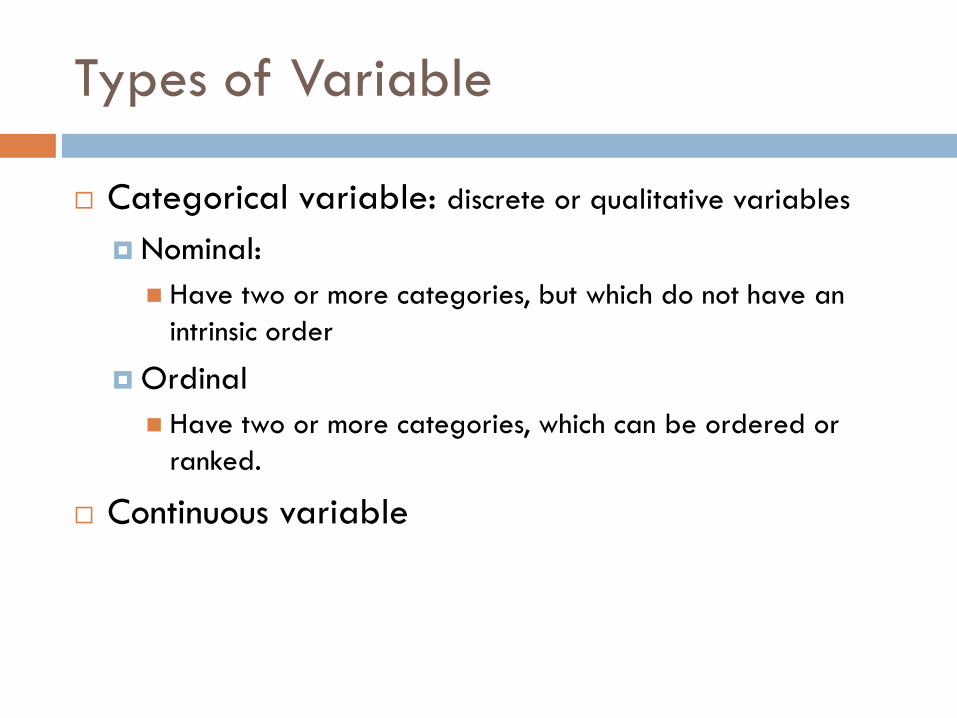
Types of Variable
Categorical variable: discrete or qualitative variables
Nominal:
◼ Have two or more categories, but which do not have an
intrinsic order
Ordinal
◼ Have two or more categories, which can be ordered or
ranked.
Continuous variable
Data Representation
Features
An individual measurable property of a phenomenon
being observed
The number of features or distinct traits that can be
used to describe each item in a quantitative manner
May have implicit/explicit patterns to describe a
phenomenon
Reference: https://en.wikipedia.org/wiki/Feature_(machine_learning)
Data Representation
Feature Examples:
Speech recognition
◼ noise ratios, length of sounds, relative power
Spam detection
◼ presence or absence of certain email headers, email
structure, frequency of specific terms
Image recognition
◼ Edges, curves, ..

Data Representation
Samples
Items to process (classify or cluster)
Can be a document, a picture, a sound, a video, or a
patient
Features are characteristics of a sample
Reference: https://en.wikipedia.org/wiki/Feature_(machine_learning)
Data Representation
Feature vector
An N-dimensional vector of numerical features that
represent some objects
A sample consists of feature vectors
Feature extraction (feature selection)
Preparation of feature vector
Transforms the data in the high-dimensional space to a
space of fewer dimensions
Reference: http://www.slideshare.net/rahuldausa/introduction-to-machine-learning-38791937

Example - Survey
Convert Data to a feature vector/sample matrix
𝑡𝑖𝑚𝑒 = 𝑎𝑔𝑟𝑒𝑒𝑎𝑢𝑑𝑖𝑜 = 𝑦𝑒𝑠
⋮

Example – Structured data
Convert Data to a feature vector/sample matrix
𝐹𝑖𝑛𝑎𝑛𝑐𝑒𝑀𝑎𝑟𝑘𝑒𝑡𝑖𝑛𝑔
⋮

Example – Image data
Ref: https://ai.stanford.edu/~syyeung/cvweb/tutorial1.html
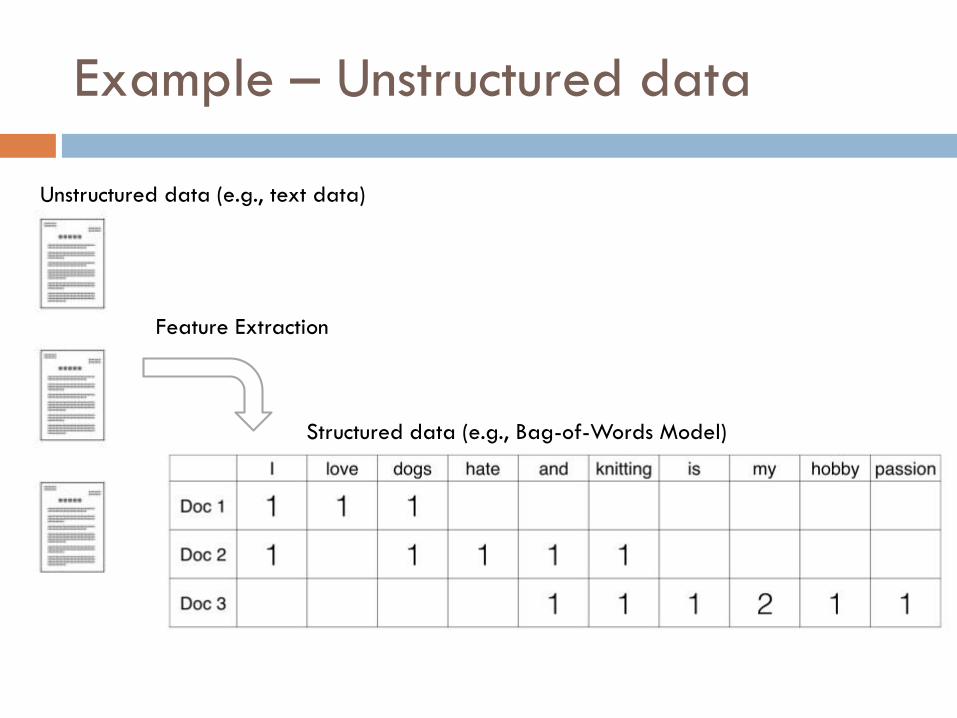
Example – Unstructured data
Feature Extraction
Unstructured data (e.g., text data)
Structured data (e.g., Bag-of-Words Model)
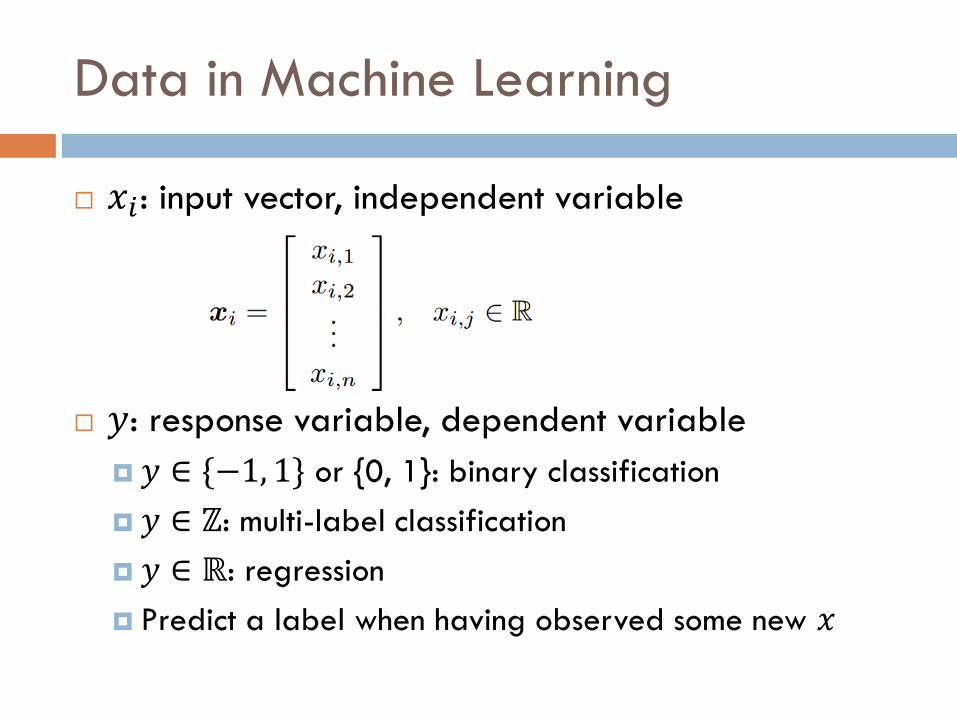
Data in Machine Learning
𝑥𝑖: input vector, independent variable
𝑦: response variable, dependent variable
𝑦 ∈ {−1, 1} or {0, 1}: binary classification
𝑦 ∈ ℤ: multi-label classification
𝑦 ∈ ℝ: regression
Predict a label when having observed some new 𝑥
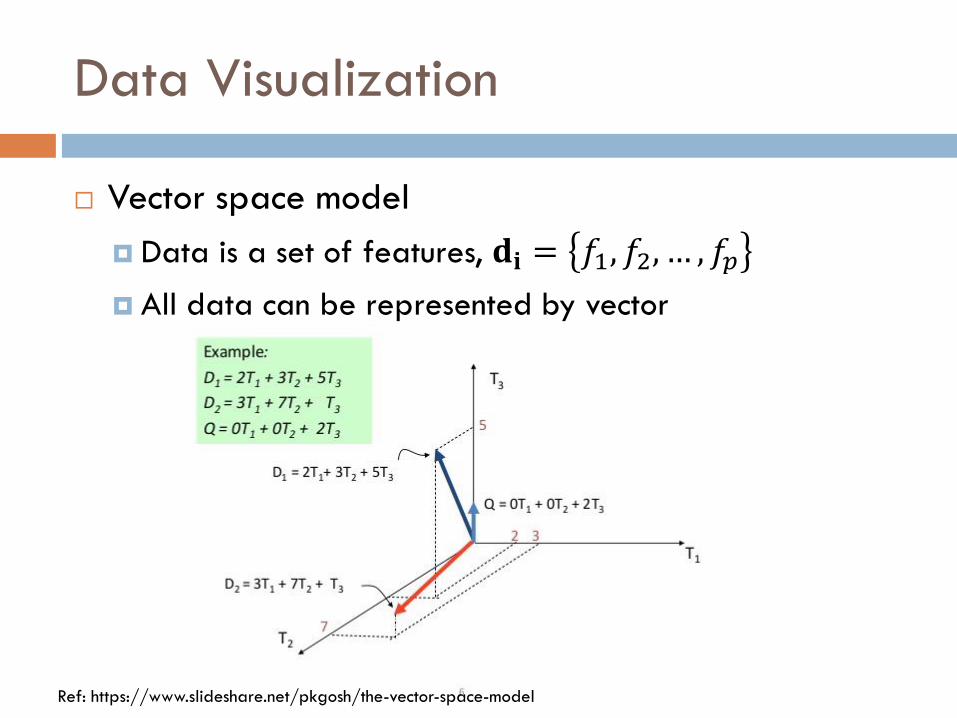
Data Visualization
Vector space model
Data is a set of features, 𝐝𝐢 = 𝑓1, 𝑓2, … , 𝑓𝑝
All data can be represented by vector
Ref: https://www.slideshare.net/pkgosh/the-vector-space-model
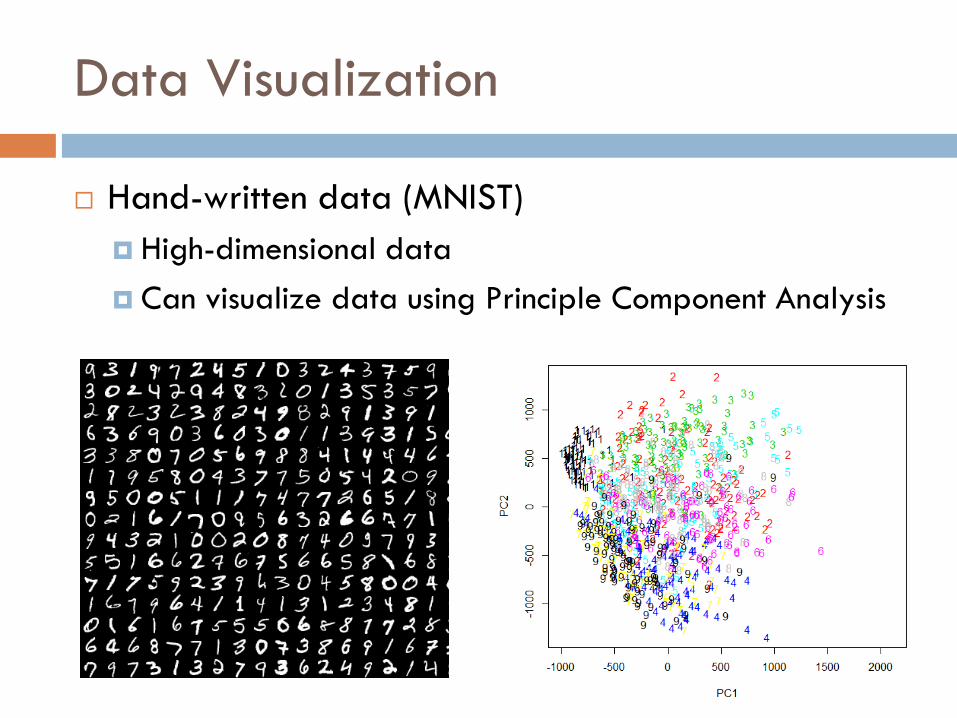
Data Visualization
Hand-written data (MNIST)
High-dimensional data
Can visualize data using Principle Component Analysis
Ref: https://towardsdatascience.com/5-quick-and-easy-data-visualizations-in-python-with-code-a2284bae952f
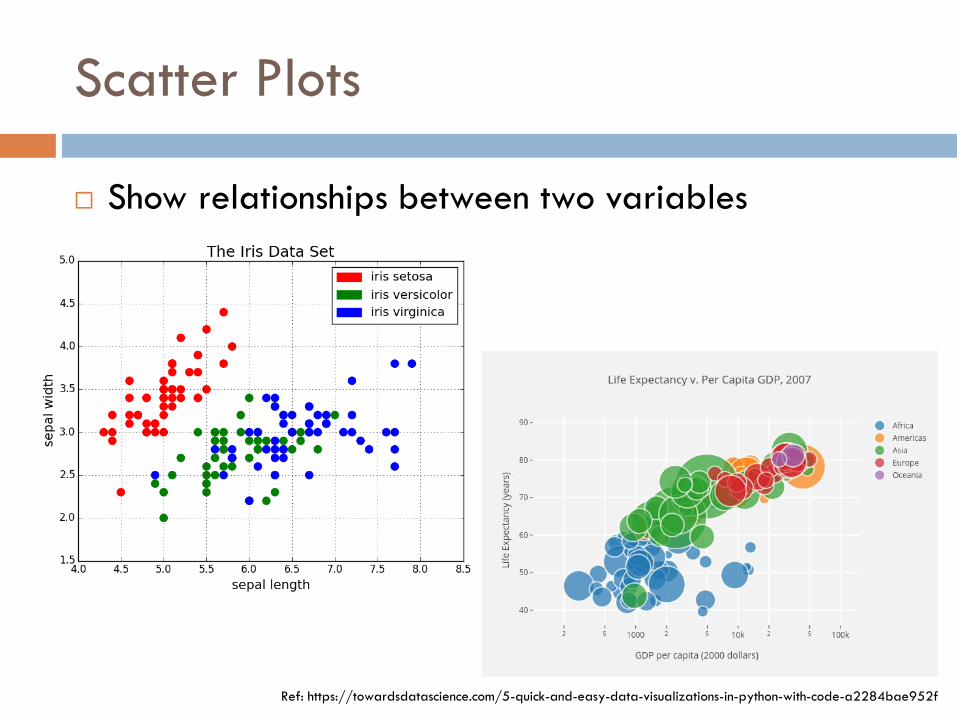
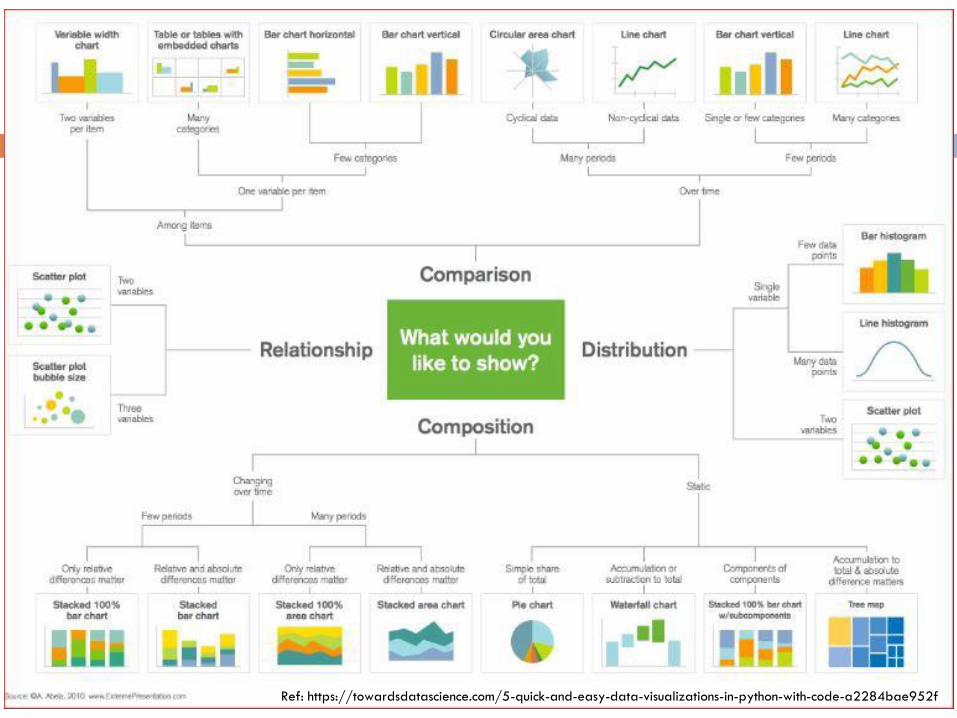
Scatter Plots
Show relationships between two variables
Ref: https://towardsdatascience.com/5-quick-and-easy-data-visualizations-in-python-with-code-a2284bae952f
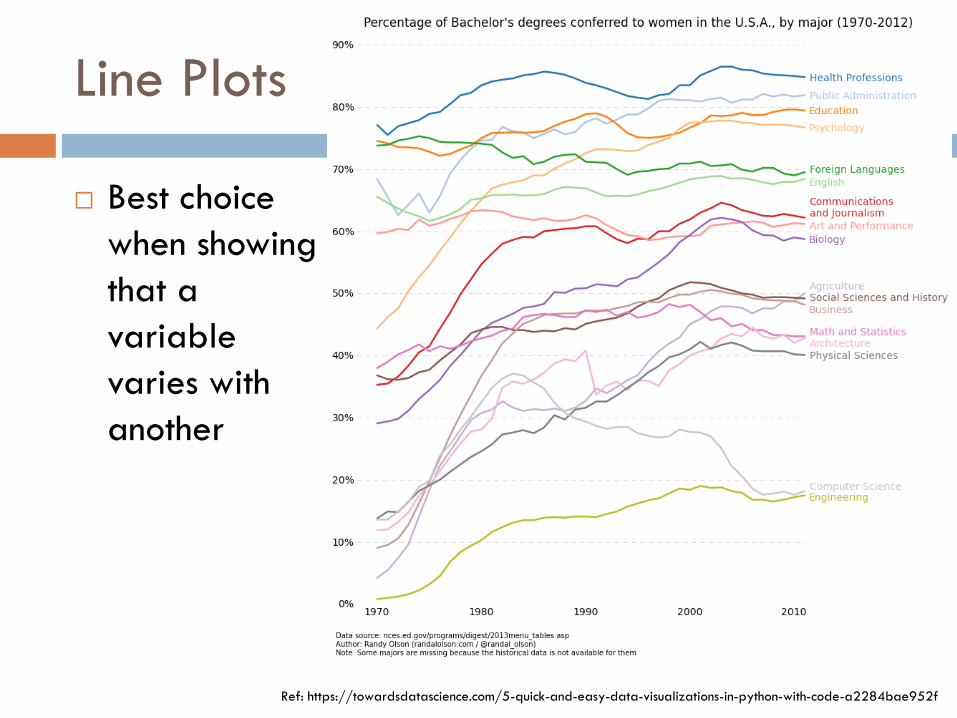
Line Plots
Best choice
when showing
that a
variable
varies with
another
Ref: https://towardsdatascience.com/5-quick-and-easy-data-visualizations-in-python-with-code-a2284bae952f

Histograms
Showing a distribution of data points
Ref: https://towardsdatascience.com/5-quick-and-easy-data-visualizations-in-python-with-code-a2284bae952f

Bar Plots
Effective to visualize categorial data (<10)
Ref: https://towardsdatascience.com/5-quick-and-easy-data-visualizations-in-python-with-code-a2284bae952f
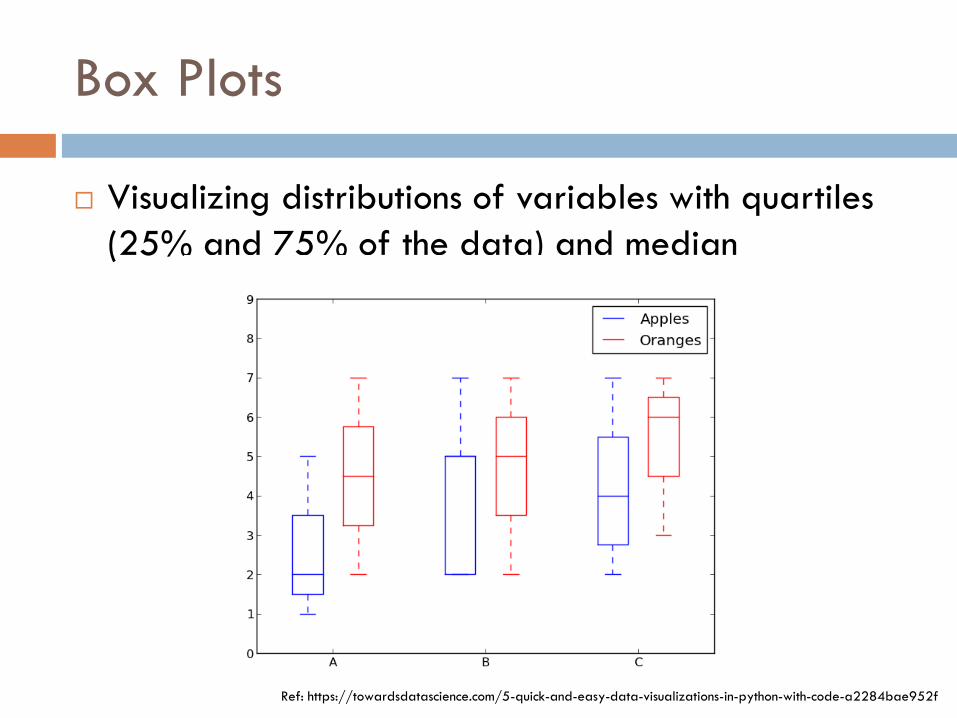
Box Plots
Visualizing distributions of variables with quartiles
(25% and 75% of the data) and median
Ref: https://towardsdatascience.com/5-quick-and-easy-data-visualizations-in-python-with-code-a2284bae952f
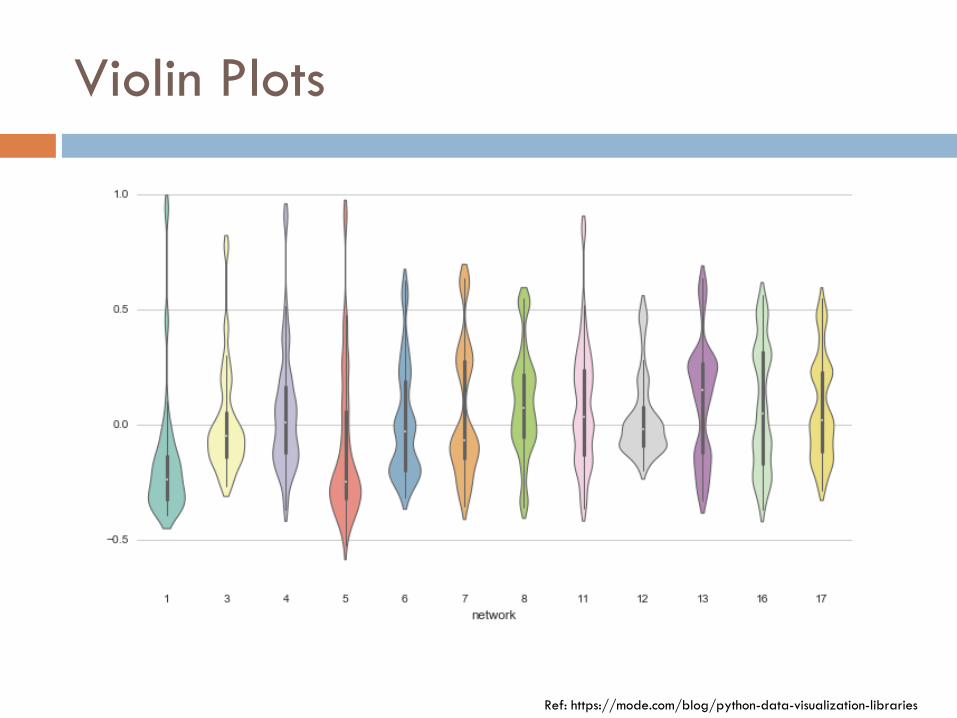
Violin Plots
Ref: https://mode.com/blog/python-data-visualization-libraries

Let’s look at Python codes for data representation
and visualization