Embed Size (px)
Citation preview

CS224W: Social and Information Network Analysis Jure Leskovec, Stanford University
http://cs224w.stanford.edu
How to characterize networks? Degree distribution P(k) Clustering Coefficient C Diameter (avg. shortest path length) h
How to model networks? Erdös-Renyi Random Graph [Erdös-Renyi, ‘60] Gn,p: undirected graph on n nodes where each
edge (u,v) appears independently with prob. P Degree distribution: Binomial(n, p) Clustering coefficient: Diameter: (next)
10/4/2011 Jure Leskovec, Stanford CS224W: Social and Information Network Analysis, http://cs224w.stanford.edu 2
k
P(k)
1 2 3 4 0.1 0.2 0.3 0.4 0.5 0.6
Ci=1/3 i
nkpC =≅

Assume each node has d spokes (half-edges): k=1:
k=2:
k=3:
Randomly pair them up
Jure Leskovec, Stanford CS224W: Social and Information Network Analysis, http://cs224w.stanford.edu 10/4/2011 3
Graph is a set of pairs
Graph is a set of cycles
Arbitrarily complicated graphs

Graph G(V, E) has expansion α: if∀ S⊆ V: # of edges leaving S ≥ α⋅ min(|S|,|V\S|)
Or equivalently:
10/4/2011 Jure Leskovec, Stanford CS224W: Social and Information Network Analysis, http://cs224w.stanford.edu 4
|)\||,min(|#min SVS
SleavingedgesVS⊆
=α
S V \ S

10/4/2011 Jure Leskovec, Stanford CS224W: Social and Information Network Analysis, http://cs224w.stanford.edu 5
S nodes α·S edges
S’ nodes α·S’ edges
(A big) graph with “good” expansion

Expansion is measure of robustness: To disconnect l nodes, we need to cut ≥ α⋅ l edges
Low expansion:
High expansion:
Social networks: “Communities”
10/4/2011 Jure Leskovec, Stanford CS224W: Social and Information Network Analysis, http://cs224w.stanford.edu 6
|)\||,min(|#min SVS
SleavingedgesVS⊆
=α
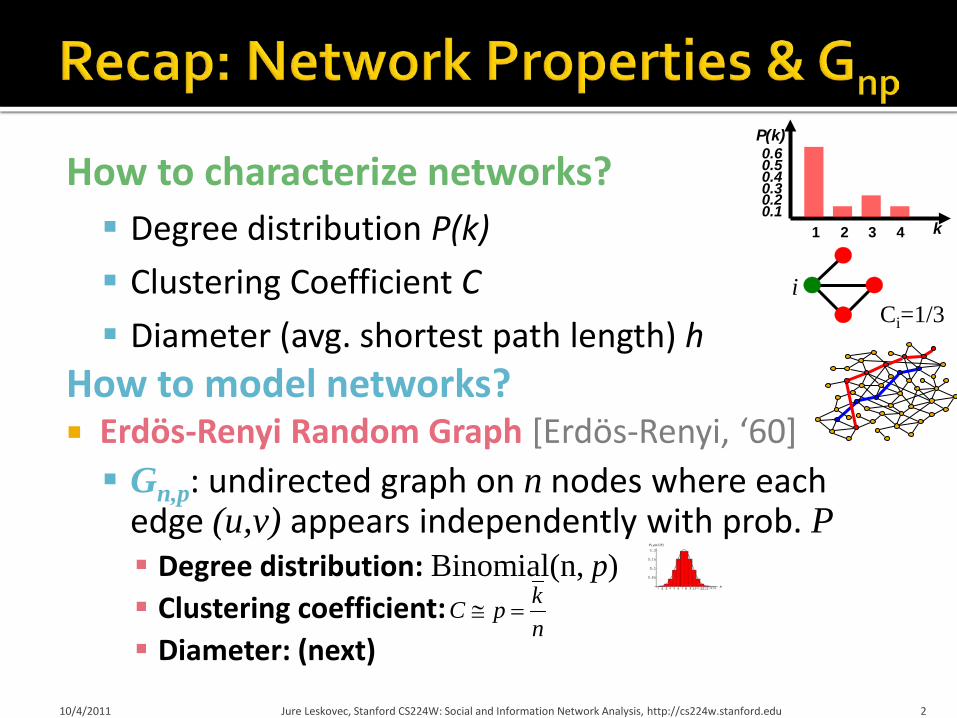
k-regular graph (every node has degree k): Expansion is at most k (when S is 1 node)
Is there a graph on n nodes (n→∞), of fixed max deg. k, so that expansion α remains const?
Examples: n×n grid: k=4: α =2n/(n2/4)→0
(S=n/2 × n/2 square in the center)
Complete binary tree: α →0 for|S|=(n/2)-1
Fact: For a random 3-regular graph on n nodes, there is some const α (α>0, independent. of n) such that w.h.p. the expansion of the graph is ≥ α
10/4/2011 Jure Leskovec, Stanford CS224W: Social and Information Network Analysis, http://cs224w.stanford.edu 7
S
S
|)\||,min(|#min SVS
SleavingedgesVS⊆
=α

Fact: In a graph on n nodes with expansion α for all pairs of nodes s and t there is a path of O((log n) / α) edges connecting them.
Proof: Proof strategy: We want to show that from any
node s there is a path of length O((log n)/α) to any other node t
Let Sj be a set of all nodes found within j steps of BFS from s. How does Sj increase as a function of j?
10/4/2011 Jure Leskovec, Stanford CS224W: Social and Information Network Analysis, http://cs224w.stanford.edu 8
s
S0
S1
S2

Proof (continued): Let Sj be a set of all nodes found within j steps of
BFS from s. Then:
10/4/2011 Jure Leskovec, Stanford CS224W: Social and Information Network Analysis, http://cs224w.stanford.edu 9
=+≥+ kS
SS jjj
α1
Edges can “collide”
Expansion
1
11+
+=
+=
j
j kkS αα
s
S0
S1
S2

Proof (continued): In how many steps of BFS
we reach >n/2 nodes? Need j so that:
Let’s set: Then:
In O(2k/α·log n) steps |Sj| grows to Θ(n).
So, the diameter of G is O(log(n)/ α) 10/4/2011 Jure Leskovec, Stanford CS224W: Social and Information Network Analysis, http://cs224w.stanford.edu 10
s
21 n
k
j
≥
+
α t
αnkj 2log
=
221 2
2
log
log
nnk
n
nk
>=≥
+
αα n
nk
k2
2
log
log
21 ≥
+
αα
Note
Remember n 0, α ≤ k then:
In log(n) steps, we reach >n/2 nodes
In log(n) steps, we reach >n/2 nodes
( )
nnnx
nn
ex
xk
22
2
22
logloglog
loglog11
211 and
: then 0 if
211:k if
>=
+
∞→=→
=+=
αα
α
In j steps, we reach >n/2 nodes
In j steps, we reach >n/2 nodes
⇒ Diameter = 2·j
⇒ Diameter = 2log(n)

10/4/2011 Jure Leskovec, Stanford CS224W: Social and Information Network Analysis, http://cs224w.stanford.edu 11
Degree distribution:
Path length: O(log n)
Clustering coefficient: C=p=k/n
knk ppk
nkP −−−
−= 1)1(
1)(

What happens to Gnp when we vary p?

Remember, expected degree We want E[Xv] be independent of n So let: p=c/(n-1) Observation: If we build random graph Gnp
with p=c/(n-1) we have many isolated nodes Why?
10/4/2011 Jure Leskovec, Stanford CS224W: Social and Information Network Analysis, http://cs224w.stanford.edu 13
c
n
nn e
ncpvP −
∞→
−− →
−−=−=
11
11)1(]0 degree has [
c
cx
x
cxn
ne
xxnc −
−
∞→
⋅−−
∞→
=
−=
−=
−−
11111
1 limlim1
11
−=
nc
xUse substitution e
x
x xe
−=
∞→
11lim
By definition:
pnXE v )1(][ −=
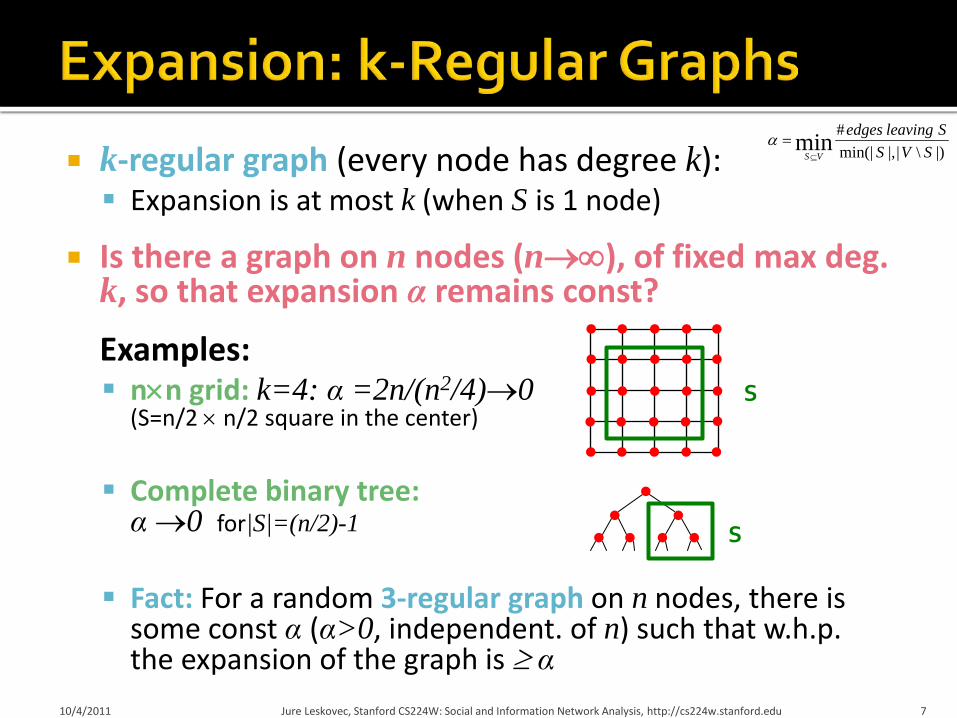
How big do we have to make p before we are likely to have no isolated nodes?
We know: P[v has degree 0] = e-c
Event we are asking about is: I = some node is isolated where Iv is the event that v is isolated
We have:
10/4/2011 Jure Leskovec, Stanford CS224W: Social and Information Network Analysis, http://cs224w.stanford.edu 14
Nv
vII∈
=
( ) ( )∑∈∈
−=≤
=
Nvv
Nvv
cneIPIPIP Union bound
∑≤i
ii
i AA
Ai

We just learned: P(I) = n e-c
Let’s try: c = ln n then: n e-c = n e-ln n =n⋅1/n= 1 c = 2 ln n then: n e-2 ln n = n⋅1/n2 = 1/n
So if: p = ln n then: P(I) = 1 p = 2 ln n then: P(I) = 1/n → 0 as n→∞
10/4/2011 Jure Leskovec, Stanford CS224W: Social and Information Network Analysis, http://cs224w.stanford.edu 15
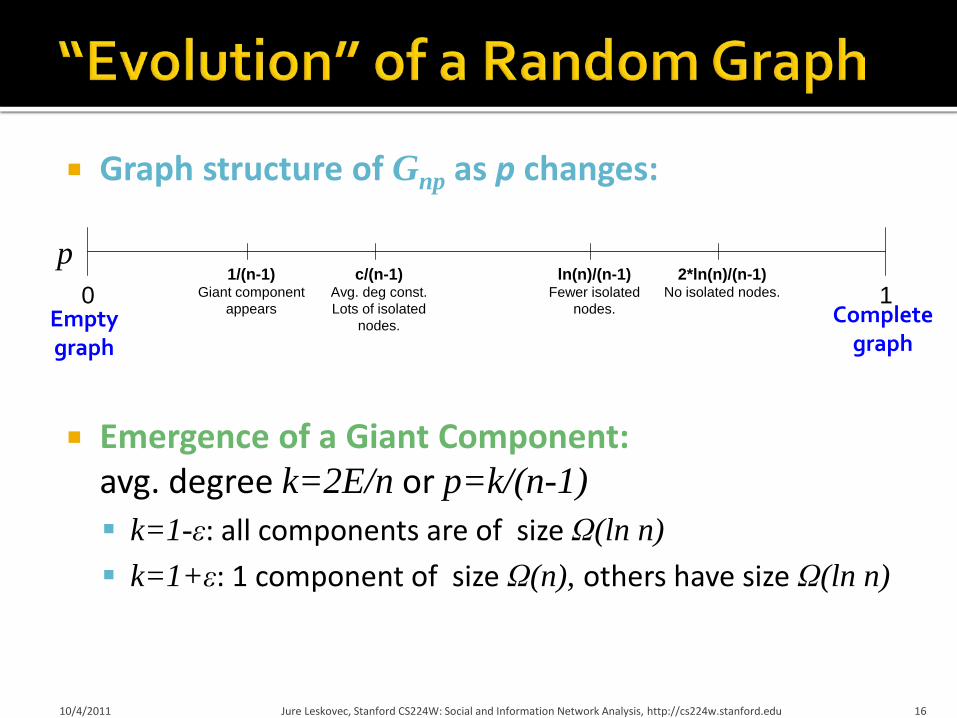
Graph structure of Gnp as p changes:
Emergence of a Giant Component: avg. degree k=2E/n or p=k/(n-1) k=1-ε: all components are of size Ω(ln n) k=1+ε: 1 component of size Ω(n), others have size Ω(ln n)
10/4/2011 Jure Leskovec, Stanford CS224W: Social and Information Network Analysis, http://cs224w.stanford.edu 16
0 1 p
1/(n-1) Giant component
appears
c/(n-1) Avg. deg const. Lots of isolated
nodes.
ln(n)/(n-1) Fewer isolated
nodes.
2*ln(n)/(n-1) No isolated nodes.
Empty graph
Complete graph

Gnp, n=100k, p(n-1) = 0.5 … 3
10/4/2011 Jure Leskovec, Stanford CS224W: Social and Information Network Analysis, http://cs224w.stanford.edu 17
Fraction of nodes in the largest component


Activity in June 2006: 245 million users logged in 180 million users engaged in
conversations More than 30 billion
conversations More than 255 billion
exchanged messages
10/4/2011 Jure Leskovec, Stanford CS224W: Social and Information Network Analysis, http://cs224w.stanford.edu 22
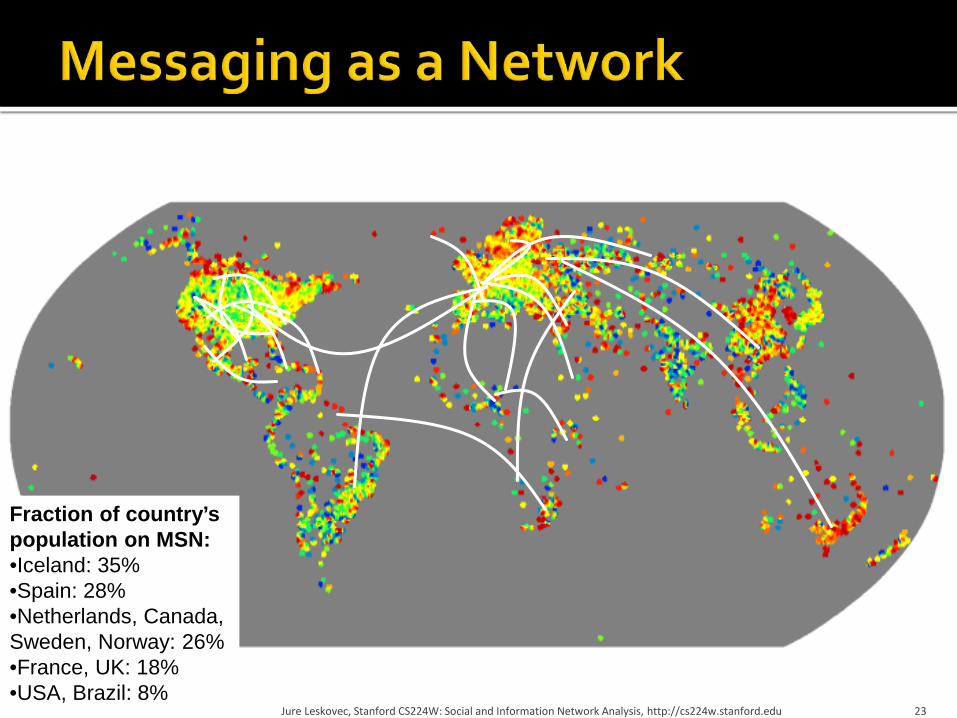
Jure Leskovec, Stanford CS224W: Social and Information Network Analysis, http://cs224w.stanford.edu 10/4/2011 23
Fraction of country’s population on MSN: •Iceland: 35% •Spain: 28% •Netherlands, Canada, Sweden, Norway: 26% •France, UK: 18% •USA, Brazil: 8%

Buddy Conversation Jure Leskovec, Stanford CS224W: Social and Information Network Analysis, http://cs224w.stanford.edu 10/4/2011 24
Communication graph • Edge (u,v) if users u and v
exchanged at least 1 msg • N=180 million people • E=1.3 billion edges

10/4/2011 Jure Leskovec, Stanford CS224W: Social and Information Network Analysis, http://cs224w.stanford.edu 25

10/4/2011 Jure Leskovec, Stanford CS224W: Social and Information Network Analysis, http://cs224w.stanford.edu 26
Degree distribution of the MSN looks nothing like the Gnp:
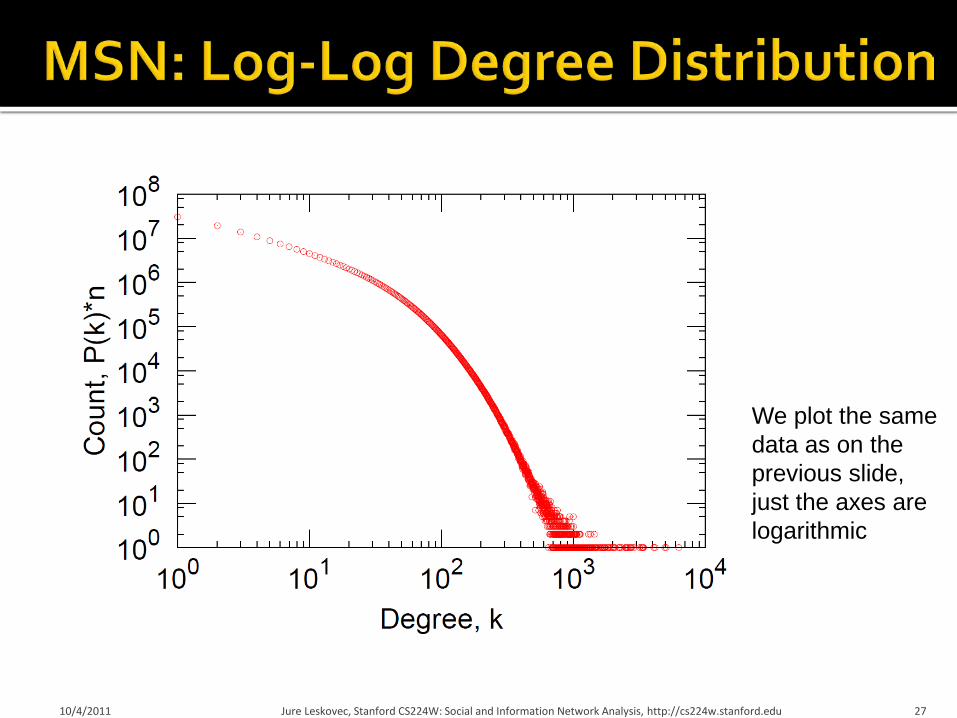
10/4/2011 Jure Leskovec, Stanford CS224W: Social and Information Network Analysis, http://cs224w.stanford.edu 27
We plot the same data as on the previous slide, just the axes are logarithmic

10/4/2011 Jure Leskovec, Stanford CS224W: Social and Information Network Analysis, http://cs224w.stanford.edu 28
k
k
∑=
=kki
ik
ki
CN
C:
1Ck: average Ci of nodes of degree k
Avg. clustering of the MSN: C = 0.1140 Avg. clustering of corresponding Gnp: C = k/n ≈ 8·10-8

10/4/2011 Jure Leskovec, Stanford CS224W: Social and Information Network Analysis, http://cs224w.stanford.edu 29
MSN Messenger network
Number of steps between pairs of
people
Avg. path length 6.6 90% of the people can be reached in < 8 hops
Hops Nodes 0 1
1 10
2 78
3 3,96
4 8,648
5 3,299,252
6 28,395,849
7 79,059,497
8 52,995,778
9 10,321,008
10 1,955,007
11 518,410
12 149,945
13 44,616
14 13,740
15 4,476
16 1,542
17 536
18 167
19 71
20 29
21 16
22 10
23 3
24 2
25 3

Are real networks like random graphs? Average path length: Clustering Coefficient: Degree Distribution:
Problems with the random network model: Degreed distribution differs from that of real networks Giant component in most real network does NOT
emerge through a phase transition No local structure – clustering coefficient is too low
Most important: Are real networks random? The answer is simply: NO 10/4/2011 Jure Leskovec, Stanford CS224W: Social and Information Network Analysis, http://cs224w.stanford.edu 30
If Gnp is wrong, why did we spend time on it? It is the reference model for the rest of the class. It will help us calculate many quantities, that can
then be compared to the real data It will help us understand to what degree is a
particular property the result of some random process
10/4/2011 Jure Leskovec, Stanford CS224W: Social and Information Network Analysis, http://cs224w.stanford.edu 31
So, while Gnp is WRONG, it will turn out to be extremly USEFUL!


Origins of a small-world idea: Bacon number: Create a network of Hollywood actors Connect two actors if they co-
appeared in the movie Bacon number: number of steps to
Kevin Bacon As of Dec 2007, the highest (finite)
Bacon number reported is 8 Only approx. 12% of all actors
cannot be linked to Bacon
10/4/2011 Jure Leskovec, Stanford CS224W: Social and Information Network Analysis, http://cs224w.stanford.edu 33
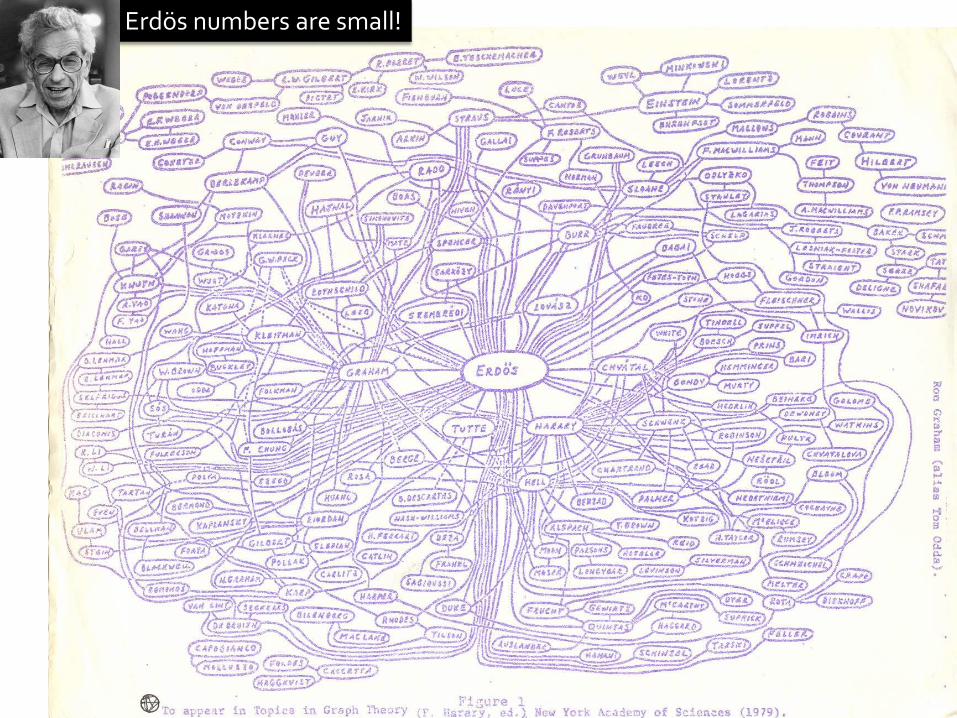
10/4/2011 Jure Leskovec, Stanford CS224W: Social and Information Network Analysis, http://cs224w.stanford.edu 34
Erdös numbers are small!

What is the typical shortest path length between any two people? Experiment on the global friendship
network Can’t measure, need to probe explicitly
Small-world experiment [Milgram ’67]
Picked 300 people in Omaha, Nebraska and Wichita, Kansas Ask them to get a letter to a stock-
broker in Boston by passing it through friends
How many steps did it take?
10/4/2011 Jure Leskovec, Stanford CS224W: Social and Information Network Analysis, http://cs224w.stanford.edu 35

64 chains completed: (i.e., 64 letters reached the target)
It took 6.2 steps on the average, thus “6 degrees of separation”
Further observations: People what owned stock
had shortest paths to the stockbroker than random people: 5.4 vs. 5.7 People from the Boston area have even closer
paths: 4.4
10/4/2011 Jure Leskovec, Stanford CS224W: Social and Information Network Analysis, http://cs224w.stanford.edu 36
Milgram’s small world experiment

Boston vs. occupation networks: Criticism: Funneling: 31 of 64 chains passed through 1 of 3 people
ass their final step Not all links/nodes are equal Starting points and the target were non-random People refused to participate (25% for Milgram) Some sort of social search: People in the experiment
follow some strategy (e.g., geographic routing) instead of forwarding the letter to everyone. They are not finding the shortest path! There are not many samples (only 64) People might have used extra information resources
10/4/2011 Jure Leskovec, Stanford CS224W: Social and Information Network Analysis, http://cs224w.stanford.edu 37

In 2003 Dodds, Muhamad and Watts performed the experiment using email: 18 targets of various backgrounds 24,000 first steps (~1,500 per target) 65% dropout per step 384 chains completed (1.5%)
10/4/2011 Jure Leskovec, Stanford CS224W: Social and Information Network Analysis, http://cs224w.stanford.edu
[Dodds-Muhamad-Watts, ’03]
Avg. chain length = 4.01 Problem: People stop participating Correction factor:
Path length, h 38
∏−
=
−= 1
0
*
)1(
)()( h
iir
hnhn
ri …. drop-out rate at hop i
n(h)
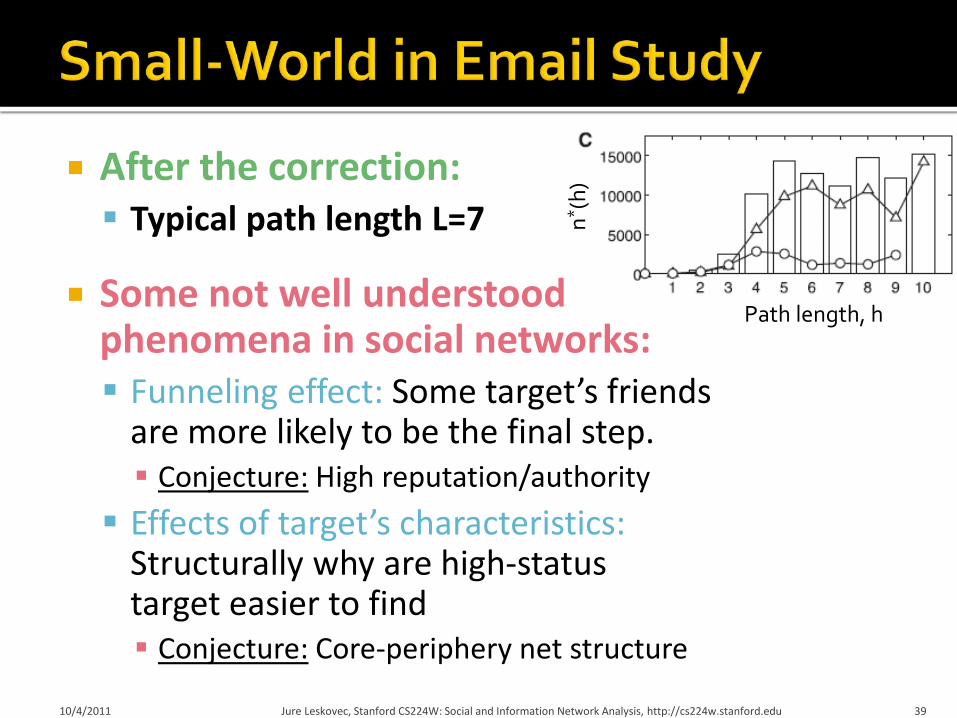
After the correction: Typical path length L=7
Some not well understood phenomena in social networks: Funneling effect: Some target’s friends
are more likely to be the final step. Conjecture: High reputation/authority Effects of target’s characteristics:
Structurally why are high-status target easier to find Conjecture: Core-periphery net structure
10/4/2011 Jure Leskovec, Stanford CS224W: Social and Information Network Analysis, http://cs224w.stanford.edu 39
Path length, h
n* (h)
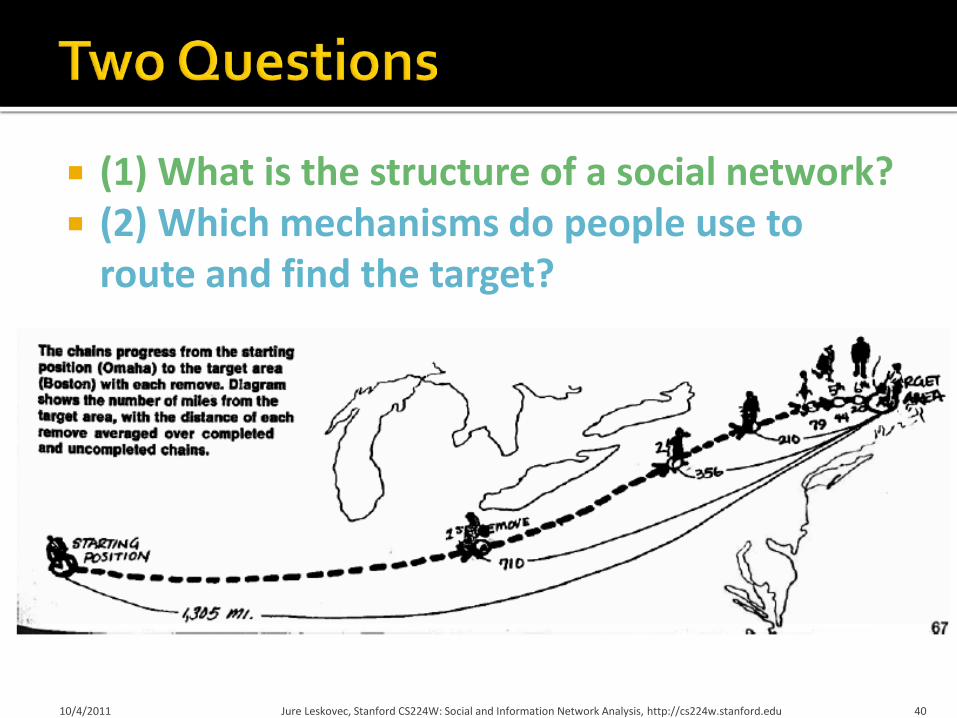
(1) What is the structure of a social network? (2) Which mechanisms do people use to
route and find the target?
10/4/2011 Jure Leskovec, Stanford CS224W: Social and Information Network Analysis, http://cs224w.stanford.edu 40

Assume each human is connected to 100 other people. Then: Step 1: reach 100 people Step 2: reach 100*100 = 10,000 people Step 3: reach 100*100*100 = 1,000,000 people Step 4: reach 100*100*100*100 = 100M people In 5 steps we can reach 10 billion people
What’s wrong here? 92% of new FB friendships are to a friend-of-a-friend
10/4/2011 Jure Leskovec, Stanford CS224W: Social and Information Network Analysis, http://cs224w.stanford.edu 41

10/4/2011 Jure Leskovec, Stanford CS224W: Social and Information Network Analysis, http://cs224w.stanford.edu 42

MSN network has 7 orders of magnitude larger clustering than the corresponding Gnp!
Other examples:
10/4/2011 Jure Leskovec, Stanford CS224W: Social and Information Network Analysis, http://cs224w.stanford.edu 43
L ... Average shortest path length C ... Average clustering coefficient
Actor Collaborations (IMDB): 225,226 nodes, avg. degree k=61 Electrical power grid: 4,941 nodes, k=2.67 Network of neurons 282 nodes, k=14

10/4/2011 Jure Leskovec, Stanford CS224W: Social and Information Network Analysis, http://cs224w.stanford.edu 44
Pure exponential growth
Triadic closure reduces growth rate
Consequence of expansion: Short paths: O(log n) This is the “best” we can
do if the graph has constant degree and n nodes
But networks have local structure: Triadic closure:
Friend of a friend is my friend How can we have both?

10/4/2011 Jure Leskovec, Stanford CS224W: Social and Information Network Analysis, http://cs224w.stanford.edu 45
Where should we place social networks?
Clustered? Random?

Could a network with high clustering be at the same time a small world? How can we at the same time have
high clustering and small diameter? Clustering implies edge “locality” Randomness enables “shortcuts” 10/4/2011 Jure Leskovec, Stanford CS224W: Social and Information Network Analysis, http://cs224w.stanford.edu 46
High clustering High diameter
Low clustering Low diameter

Small-world Model [Watts-Strogatz ‘98]: 2 components to the model: (1) Start with a low-dimensional regular lattice Has high clustering coefficient
Now introduce randomness (“shortucts”)
(2) Rewire: Add/remove edges to create
shortcuts to join remote parts of the lattice For each edge with prob. p move
the other end to a random node
10/4/2011 Jure Leskovec, Stanford CS224W: Social and Information Network Analysis, http://cs224w.stanford.edu 47
[Watts-Strogatz Nature ‘98]

10/4/2011 Jure Leskovec, Stanford CS224W: Social and Information Network Analysis, http://cs224w.stanford.edu 48
High clustering High diameter
High clustering Low diameter
Low clustering Low diameter
[Watts-Strogatz Nature ‘98]
43
2== C
kNh
NkCNh ==
loglog
α
Rewiring allows us to interpolate between regular lattice and a random graph

10/4/2011 Jure Leskovec, Stanford CS224W: Social and Information Network Analysis, http://cs224w.stanford.edu 49
Clu
ster
ing
coef
ficie
nt, C
= 1
/n ∑
Ci
Prob. of rewiring, p
Parameter region of high clustering and low diameter
It takes a lot of randomness to ruin the clustering, but a very small amount to overcome locality.
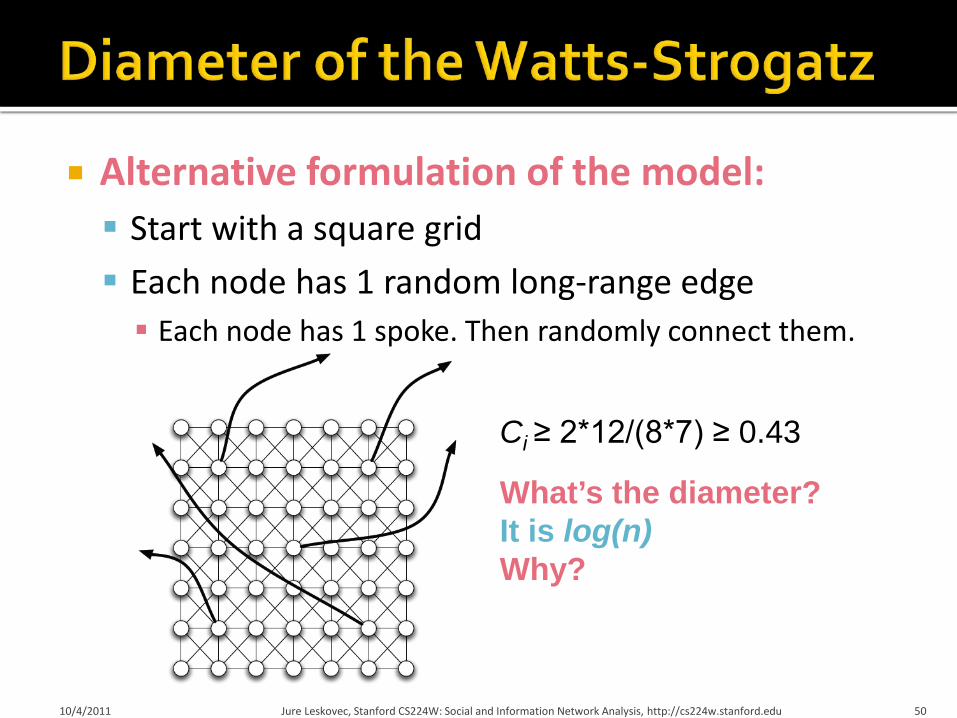
Alternative formulation of the model: Start with a square grid Each node has 1 random long-range edge Each node has 1 spoke. Then randomly connect them.
10/4/2011 Jure Leskovec, Stanford CS224W: Social and Information Network Analysis, http://cs224w.stanford.edu 50
Ci ≥ 2*12/(8*7) ≥ 0.43
What’s the diameter? It is log(n) Why?

Proof: Consider a graph where we
contract 2x2 subgraphs into supernodes Now we have 4 edges sticking
out of each supernode 4-regular random graph!
From Thm. we have short paths between super nodes We can turn this into a path in a
real graph by adding at most 2 steps per hop
⇒Diameter of the model is O(2 log n)
10/4/2011 Jure Leskovec, Stanford CS224W: Social and Information Network Analysis, http://cs224w.stanford.edu 51
4-regular random graph

Could a network with high clustering be at the same time a small world? Yes. You don’t need more than a few random links.
The Watts Strogatz Model: Provides insight on the interplay between
clustering and the small-world Captures the structure of many realistic networks Accounts for the high clustering of real networks Does not lead to the correct degree distribution Does not enable navigation (next lecture)
10/4/2011 Jure Leskovec, Stanford CS224W: Social and Information Network Analysis, http://cs224w.stanford.edu 52

(1) What is the structure of a social network? (2) Which mechanisms do people use to
route and find the target?
10/4/2011 Jure Leskovec, Stanford CS224W: Social and Information Network Analysis, http://cs224w.stanford.edu 53


![Stanford University - CS224w: Social and Information ...snap.stanford.edu/class/cs224w-2013/slides/01-intro.pdfuniversity [Kossinets-Watts, Science ‘06] 4.4-million-node network](https://img.pdfslide.us/doc/110x75/5f508d81fd6a3e134c5a2a04/stanford-university-cs224w-social-and-information-snap-university-kossinets-watts.jpg)


![web.stanford.eduweb.stanford.edu/class/archive/cs/cs224w/cs224w... · connectome [Wor16]. Although simple, the neural network of the C. Elegans has demonstrated surprisingly complex](https://img.pdfslide.us/doc/110x75/5fefec4bf6449b305017274e/web-connectome-wor16-although-simple-the-neural-network-of-the-c-elegans-has.jpg)