Embed Size (px)
Citation preview

CS120 Visibility
Sensor Arrives p. 3
p. 2 President’s Message: Just So
p. 3 LiDAR System Now Available
p. 4 Campbell Scientifi c Gets a New Look
p. 4 New Operating Systems for RF500 Radios
p. 4 SP85 Solar Panel Replaces SP70
p. 5 New RTMC Pro 4.0 and CSI Web Server 1.0
p. 6 Case Study: Flood Irrigation
p. 6 SDM-CANHelper Simplifi es CANBus
p. 7 Case Study: SCADA Water System
p. 7 UL-Listed Data-Acquisition Systems
p. 8 Tips & Tricks: Details, Details, Details!
www.campbellsci.com/newsletters
First Quarter 2012

“ . . . till they had done and drawn all
the sound-pictures that they wanted,
and there was the Alphabet, all
complete. And after thousands and
thousands and thousands of years,
and after Hieroglyphics and Demot-
ics, and Nilotics, and Cryptics, and
Cufi cs, and Runics, and Dorics, and
Ionics, and all sorts of other ricks and
tricks (because the Woons, and the
Neguses, and the Akhoonds, and the
Repositories of Tradition would never
leave a good thing alone when they
saw it), the fi ne old easy, understand-
able Alphabet—A, B, C, D, E, and the
rest of ’em—got back into its proper
shape again for all Best Beloveds to
learn when they are old enough.”
‘How the Alphabet Was Made’
2
Just SoPresident’s Messagesagsagsagsagsagsagsagsagsagsagsaggagggggggeeeeeeeeeeeeeeee
It dates me, but I remember when comput-
ers were without a graphical user interface
(GUI). I have always had some diffi culty
reconciling modern man’s development of
GUIs with our history, especially as artisti-
cally expressed by Rudyard Kipling over
100 years ago in one of his Just So Stories.
Scientists extol the virtues of graphics as
capitalizing on the capacity of the human
mind to immediately comprehend mean-
ing from an image that, if left to words,
would be incomplete or require more time
to fully explain. A combination of text and
images off ers the most visual communica-
tion. To that end, Campbell Scientifi c, Inc.,
recently upgraded its website with an intro-
duction on the home page of six graphics
that represent, in broad terms, the markets
we serve.
Weather observation with
automatic weather stations
was one of the fi rst markets
served by Campbell
Scientifi c, with dataloggers,
sensors, and systems that included digital
recording beginning in the 1970s. We
continue to off er new products for weather
observation, and one of those included in
this newsletter is the CS120 Visibility Sensor
developed by the Campbell Scientifi c
group company in the UK. The weather
symbol also relates to some of our work in
biogeochemistry, supporting customers
who measure the exchange of gases at the
earth’s surface to better understand carbon
and nitrogen cycles.
Water is related to weather,
usually through precipita-
tion and evaporation, but
in its own right has some
needs apart to measure
level, fl ow, temperature, turbidity, and
a host of other parameters. This basic
resource will be stretched even more in
years to come, and the key to careful plan-
ning, use, and peace between competing
interests begins with measurement.
Energy, and in particular
renewable energy, is
maturing and expanding
with developments of wind
and solar farms to harvest
electrons. While siting relates directly to
climate and weather conditions, some of
the technical challenges have to do with
machines and materials and how they
perform or withstand certain conditions of
wind, sun, and frozen precipitation.
Machines are nearly as old
as the alphabet, and one
of the benefi ts of modern
electronics is using them
to test the performance of
modern, sophisticated machines. Whether
it’s endurance testing, noise from brakes,
hot spots from an exhaust, or the pressure
pulse from actuating a solenoid, Campbell
Scientifi c dataloggers help make measure-
ments that improve our understanding and
the design of machines.
Structures can bridge
obstacles and space to
support machines and
surfaces, divert water, and
perform other functions.
With longer and more complex structures
built where they must withstand ice,
fl oods, wind, corrosion, and the dynam-
ics of earthquakes or extraordinary loads,
monitoring is needed to characterize risks
and deterioration. Sensors that measure
strain, pressure, or change in position pro-
vide useful assistance to warn of a problem
before a catastrophic collapse.
Earth is the last symbol
introduced on our new
website. Campbell Scientifi c
off ers sensors and systems
to measure soil moisture,
electrical conductivity, and temperature,
all important parameters aff ecting plant
growth. Our understanding of soils and
concrete used in construction is enhanced
with measurements of water content, slope
stability, and other dynamics.
The application engineers at Campbell
Scientifi c are organized into groups that
correspond to the above market identifi ca-
tion. This helps us better understand your
problems and how we can help you solve
them. When you contact Campbell Scien-
tifi c, it is helpful if you can identify where
you fi t in this market schema. That way, it
is more likely that an application engineer
that understands your world can serve you.
Executive Editor Neal Israelsen
Managing Editor Lex Shakespear
Assistant Editors Linda Worlton
Patrick Burt
Anthony Bodily
Brian Clark
Contributors Paul Campbell
Dana Worley

3
We now off er the ZephIR 300, a continu-
ous-wave, remote sensing LiDAR system.
It provides wind measurements across ten
user-defi ned heights from 10 m to 200 m.
The ZephIR 300 can be used throughout
the life cycle of a wind project, includ-
ing site prospecting, wind-fl ow model
verifi cation, power-curve assessment,
permanent wind-farm anemometry, and
operational wind-farm analysis.
Continuous-wave technology off ers
unique benefi ts for the wind industry. One
benefi t is the ability to provide fast sample
rates (50 data points per second across a
full 360° scan). This is especially advanta-
geous for complex and rapidly changing
air fl ows. Another benefi t is the ability to
make accurate measurements across the
entire wind turbine rotor diameter, down
to just 10 m above ground level. The Zeph-
IR 300 provides a wind speed accuracy
of better than 0.5% as measured against
a calibrated moving target, and a wind
direction accuracy of better than 0.5°.
The ZephIR 300 uses an infrared beam to
illuminate natural atmospheric aerosols
such as dust, pollen, or water droplets.
When the infrared beam hits these aero-
sols, some light is backscattered into a
receiver. Wind aff ects the motion of these
aerosols, and changes the backscattered
light’s frequency. This frequency shift is
measured by a photo-detector, and from
these measurements, wind speed and
direction are calculated.
To ensure accurate measurements, the
ZephIR 300 is calibrated to an industry-
approved standard, and rigorously tested
via IEC-equivalent power-performance
measurements.
The ZephIR 300 is a rugged device, and
is designed to operate autonomously
in remote locations. It features a wide
operating-temperature range of -40° to
+50° C and has an IP67-rated enclosure,
sealed against moisture and ingress. The
ZephIR 300 is compatible with Campbell
Scientifi c dataloggers, allowing easy
integration of meteorological mast data
with remote measurements obtained by
the ZephIR 300.
Remote Sensing LiDAR System Now Available
New Product
Visibility is an important meteorological
measurement, especially for road, airport,
and marine applications. Instruments to
measure visibility have, until now, been
expensive and fragile, with lots of design
obstacles. Recently, engineers at Camp-
bell Scientifi c Europe have developed a
high-performance visibility sensor that
overcomes these diffi culties, at a competi-
tive price.
The CS120 uses infrared, forward-scatter
technology to develop accurate estimates
of meteorological observable distance
(MOR). Its design uses the proven 42°
scatter angle. The design includes a sturdy
body shaped to avoid interfering with
airfl ow, resulting in a clean, undisturbed
sample volume. The optics face downward
to reduce contamination by dust or dirt
and blockage by snow. The sensor even
checks the source and detector lenses
every second and adjusts its calibration to
compensate for contamination.
Low-power heaters to prevent dew and
higher-power heaters to de-ice are built
into the body, adding reliability to the
measurements. The heaters are auto-
matically controlled, simplifying use in
all types of weather.
Since the sensor is used in various
weather conditions, it incorporates
high-speed sampling, assuring ac-
curacy when mixtures of rain, snow, and
hail make measurements more compli-
cated. And the light source is monitored
and corrected every second for stability to
compensate for variations in temperature
and for sensor age.
The CS120 can be used in stand-alone
applications or as part of a system. The core
sensor is power-effi cient, drawing just
3 W during normal operation, including the
dew heaters. In addition, the heaters and
sampling rates can be adjusted to further
save power. This makes it ideal for remote
locations. It can be calibrated in the fi eld
with the optional calibration kit.
Besides reporting measurements, the
sensor reports its own status. It features
two user-confi gurable alarm outputs
for solid-state output to audio or
visual alarms.
CS120 Visibility Sensor Arrives
New Product
campbellsci.com/cs120
campbellsci.com/zephir-lidar

4
Updated Product
Campbell Scientifi c now off ers a choice
of three operating systems (OS) for our
RF500M UHF/VHF radio modem and
RF500B UHF/VHF base station. This choice
allows these RF devices to be used with
most of our dataloggers (both current and
retired), and better supports various com-
munication needs.
The PakBus® OS is considered the standard
for the RF500M and RF500B. It uses polling
(RF-TD) to quickly and effi ciently move data
through a network. Additionally, each sta-
tion can be individually dialed by Logger-
Net. The PakBus OS is compatible with our
current generation of PakBus dataloggers,
as well as with retired dataloggers that
have a –TD or –PB datalogger OS.
The ALERT (Automated Local Evaluation
in Real Time) OS for our RF500M and
RF500B allows for transmission, repeating,
and reception of binary ALERT-formatted
data. It is a derivative of the PakBus OS,
and therefore supports both ALERT and
PakBus communications, providing true
two-way communication with a station.
The ALERT OS is compatible with our
CR200(X) series, CR800 series, CR1000, and
CR3000 dataloggers.
Our newest option, the Dial OS, works
with mixed-array and most PakBus data-
loggers. With this OS, each station can be
dialed by LoggerNet for downloading data
and sending programs. The Dial OS also
allows stations to create point-to-point
networks for sharing of measurement and
control tasks.
Three Operating Systems for RF500-Series Radios
Campbell Scientifi c Gets a New LookCompany News
If you recently visited our website or saw us
at a trade show, you probably noticed that
we’ve made a few changes. Not only have
we tweaked our logo, but we’ve adopted
new colors and redesigned many of the
materials used to deliver information to
you. This includes our website, newsletters,
exhibit panels, and more. Some changes
have already been implemented; others are
forthcoming.
This change has come about as we’ve
worked with the Campbell Scientifi c of-
fi ces around the world to come together
under a single image. We are also taking
advantage of the opportunity to streamline
many of our behind-the-scenes processes
to help customers worldwide have access
to the latest information. Over the next
several months we’ll be syncing up all of
the websites and completing the eff ort.
We still have more to do, but are liking
what we see and hope you do too.
New Product
Our biggest solar panel just got bigger.
The new SP85 solar panel has an 85 W
typical peak power; its predecessor, the
SP70, had a 70 W typical peak power. This
new solar panel recharges the large-
capacity battery used in systems with
large power requirements, such as eddy-
covariance systems. An external regulator
(either the CH200 or 18529) connects
the SP85 to the battery. Two SP85 solar
panels can be attached to one 18529
regulator to provide 170 W of power.
SP85 Solar Panel Replaces SP70
campbellsci.com/rf500m-support campbellsci.com/sp85
5
New Product
In our last newsletter we reported on the
web API supported by CR1000, CR3000,
CR800, and CR850 dataloggers, and
hinted that we were working on some
exciting new features for RTMC Pro and
our PC-based web server. In December,
we released RTMC Pro 4.0 and a new web
server that we’ve named CSI Web Server.
There are many small enhancements that
have been made to RTMC Pro 4.0, but
the changes we’re most excited about
are CSI Web Server, Web Publisher, and a
new HTTP datalogger data source.
CSI Web Server for Elegant, Interac-tive Data Displays on the WebOur previous PC web server, RTMC Web
Server, is a nice product, but it has some
limitations. For one, RTMC Web Server is
not interactive; thus, components that
enable control of the datalogger or data
displays that are set up for browsing
historical data do not work.
CSI Web Server is fully interactive, and it’s
also secure—CSI Web Server uses basic
access authentication with a user name
and password to control what a user can
do on a website. Multiple user accounts
can be set up, providing full access, no
access, read/write access, or read-only
access. This enables the creation of a
website that allows any visitor to the site
to view the data, but only certain users
who log in can make changes using the
control components.
CSI Web Server supports HTTPS, uses
HTML 5, and runs as a service. Since it
runs as a service, you’re guaranteed more
up time for your web server displays.
Creating Websites With Web PublisherThe new Web Publisher makes it easier
than ever to publish your RTMC Pro
project to a web server. After your project
is created in RTMC, launch Web Publisher
from the toolbar, enter the IP address,
user name, and password of the device
that is set up to run the web server, speci-
fy a directory in which to publish the fi les,
and press the Publish Website button.
Web Publisher generates Javascript and
other fi les for the project and saves them
to the specifi ed directory. You can then
press the View Website button to see the
data display in action.
HTTP Datalogger Data SourceRTMC Pro has a new data source that can
be used to populate components—an
HTTP datalogger source. This means that
an RTMC project can be set up to display
data directly from a CR800, CR850, CR1000,
or CR3000 datalogger that is connected to
the Internet*, without that data fi rst hav-
ing to be collected using LoggerNet.
A Winning Pair—Web Publisher and HTTP Datalogger Data SourceWhen you couple the new HTTP datalog-
ger source with Web Publisher, you really
have something exciting. You can gener-
ate a data display using RTMC that can
run directly on the datalogger. Gone are
the days of writing tedious WebPageBe-
gin/WebPageEnd and HTTPOut state-
ments in CRBasic to create web pages for
your datalogger to display. We think this
is really something to cheer about!
The DetailsRTMC Pro 4.0 includes CSI Web Server
and Web Publisher. Upgrade pricing is
available for users who have an earlier
version of RTMC Pro. CSI Web Server and
Web Publisher can be purchased sepa-
rately. Upgrade pricing is also available
for users who would like to upgrade from
RTMC Web Server to CSI Web Server.
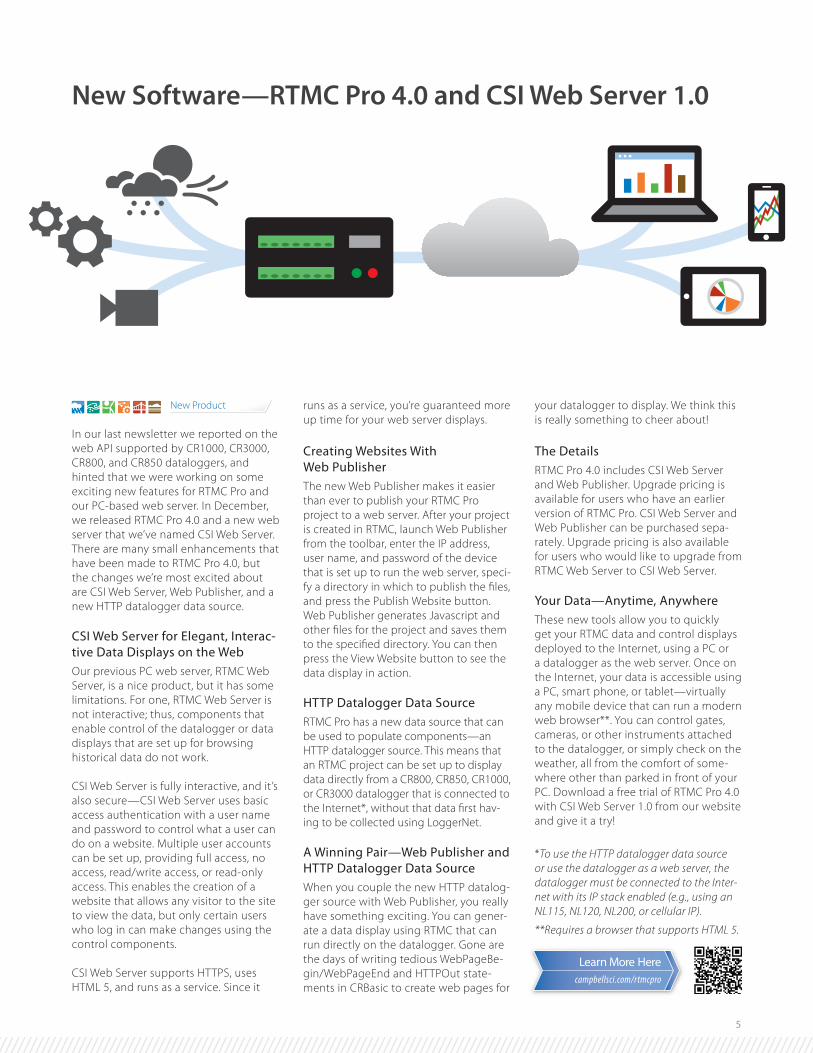
Your Data—Anytime, AnywhereThese new tools allow you to quickly
get your RTMC data and control displays
deployed to the Internet, using a PC or
a datalogger as the web server. Once on
the Internet, your data is accessible using
a PC, smart phone, or tablet—virtually
any mobile device that can run a modern
web browser**. You can control gates,
cameras, or other instruments attached
to the datalogger, or simply check on the
weather, all from the comfort of some-
where other than parked in front of your
PC. Download a free trial of RTMC Pro 4.0
with CSI Web Server 1.0 from our website
and give it a try!
*To use the HTTP datalogger data source
or use the datalogger as a web server, the
datalogger must be connected to the Inter-
net with its IP stack enabled (e.g., using an
NL115, NL120, NL200, or cellular IP).
**Requires a browser that supports HTML 5.
New Software—RTMC Pro 4.0 and CSI Web Server 1.0
campbellsci.com/rtmcpro
6
Alfalfa is a thirsty crop. It uses more than
20 percent of all of the irrigation water in
California. The primary way of watering
alfalfa is by fl ood irrigation. This normally
results in heavy runoff , which wastes water
and sends nutrients from the fi eld into the
water supply. To overcome this problem, a
group of researchers from MBK Engineer-
ing, Indian Institute of Technology, and UC
Davis recently sought to develop a more
effi cient way to fl ood irrigate.
Alfalfa fi elds are divided by low berms
into long bays called “checks” . Each check
is fl ooded from the highest end, and the
water fl ows in a sheet to the lower end. It
is diffi cult to estimate when to shut off the
water to prevent runoff . During the course
of the project, the current practice for
determining when to cut off the water sup-
ply was compared to a more automated
method using dataloggers and sensors.
The checks tested in this project are about
220 m (720 ft) long and 15 m (50 ft) wide.
The conventional method for determining
water shutoff time requires the irrigation
personnel to make several trips to the fi eld.
When testing the outcome of this practice,
6,000 to 10,000 l (1,600 to 2,600 gal) was
wasted from each check every time.
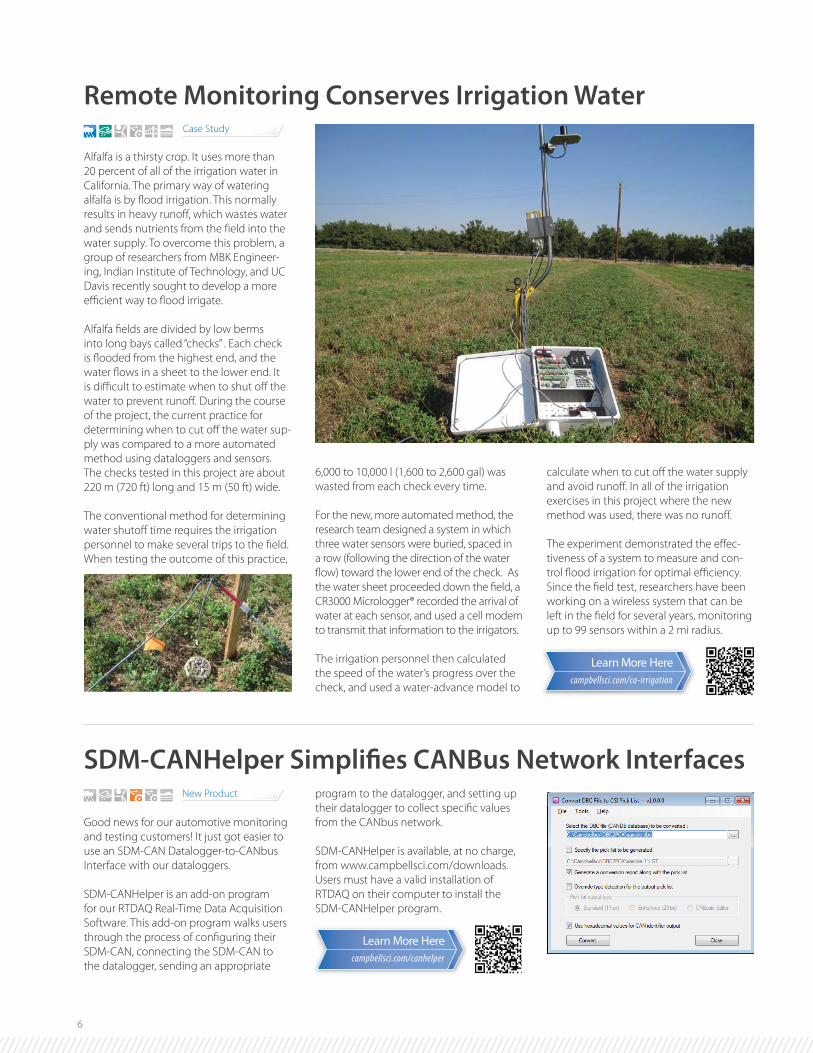
For the new, more automated method, the
research team designed a system in which
three water sensors were buried, spaced in
a row (following the direction of the water
fl ow) toward the lower end of the check. As
the water sheet proceeded down the fi eld, a
CR3000 Micrologger® recorded the arrival of
water at each sensor, and used a cell modem
to transmit that information to the irrigators.
The irrigation personnel then calculated
the speed of the water’s progress over the
check, and used a water-advance model to
calculate when to cut off the water supply
and avoid runoff . In all of the irrigation
exercises in this project where the new
method was used, there was no runoff .
The experiment demonstrated the eff ec-
tiveness of a system to measure and con-
trol fl ood irrigation for optimal effi ciency.
Since the fi eld test, researchers have been
working on a wireless system that can be
left in the fi eld for several years, monitoring
up to 99 sensors within a 2 mi radius.
Remote Monitoring Conserves Irrigation WaterCase Study
New Product
Good news for our automotive monitoring
and testing customers! It just got easier to
use an SDM-CAN Datalogger-to-CANbus
Interface with our dataloggers.
SDM-CANHelper is an add-on program
for our RTDAQ Real-Time Data Acquisition
Software. This add-on program walks users
through the process of confi guring their
SDM-CAN, connecting the SDM-CAN to
the datalogger, sending an appropriate
program to the datalogger, and setting up
their datalogger to collect specifi c values
from the CANbus network.
SDM-CANHelper is available, at no charge,
from www.campbellsci.com/downloads.
Users must have a valid installation of
RTDAQ on their computer to install the
SDM-CANHelper program.
SDM-CANHelper Simplifi es CANBus Network Interfaces
campbellsci.com/ca-irrigation
campbellsci.com/canhelper

7
Case Study
In 2010, Trenton and Amalga, two northern
Utah towns separated by only a few
miles, created a plan to design and build
an interconnection between their two
municipal water systems. The interconnect
system would automatically allow water
from Trenton to fl ow to Amalga and vice
versa, allowing the two towns to share
water during emergency situations. To ac-
complish this, the towns worked with JUB
Engineers of Logan, who contracted with
Intermountain Environmental (IEI), also
of Logan, to install a supervisory control
and data-acquisition (SCADA) system to
allow each town to view the status of their
water system and control the interconnect
system as needed.
Each town has separate water sources,
pump tanks, and distribution systems, so
the challenge was to connect them in a
way that would easily allow sharing of
water. Intermountain Environmental used
the CR1000 Measurement and Control
System (manufactured by Campbell
Scientifi c) and VTScada software (by
Trihedral) as the foundation for the SCADA
system. The outcome was independent
systems in each town.
The systems connect with numerous sen-
sors via a Campbell multiplexer to monitor
parameters such as fl ow and pressure from
water sources into tanks, fl ow and pressure
from tanks into the towns, tank level, and
fl ood conditions at the building housing
the system. The CR1000 uses a Campbell
SDM-CD8S dc device controller to control
pumps and valves, with each town control-
ling the valves to allow or disallow the
water fl owing to the other.
VTScada allows the town water managers
to view the status of pumps, water levels,
and door and hatch alarms. The software
can send out alarms, and allows users to
access their system information and control
devices over the Internet as if they were
sitting at the main PC at the town hall.
Each town received similar equipment
and the systems are independent of each
other. The CR1000 was used as a remote
terminal unit (RTU) at each site and also as
the programmable logic controller (PLC) at
each base station. The dataloggers com-
municate with each other using Campbell’s
RF450 spread-spectrum radio. At each town
hall there is a master station that consists of
a CR1000 and an NL120 Ethernet interface.
LoggerNet and VTScada run on Windows
7 PCs and communicate with the CR1000
master unit over Ethernet connections.
The system has been in operation since
May of 2011.
SCADA Systems Help Connect Water Supplies
New Product
Campbell Scientifi c now off ers UL-
listed data-acquisition systems bearing the
UL508A listing for enclosed, industrial,
control panels. These preconfi gured
systems use ac power (solar-powered
systems are not covered by the
UL508A standard), contain
one of our current
dataloggers (e.g., CR800,
CR850, CR1000,
CR3000), and
are housed in
a 14 by 16, 16 by 18, or 24 by 30 in.
enclosure. The UL listing pertains to the
preconfi gured system as a whole, rather
than to the individual components.
To receive the UL508A listing, a preconfi g-
ured system is inspected to ensure compli-
ance with Underwriters Laboratories (UL)
requirements for grounding, overcurrent
protection, wiring, labeling, and documen-
tation. The system is then labeled with a
UL mark, indicating compliance to USA
and Canadian standards, and shipped with
documentation per the UL standards.
UL-Listed Data-Acquisition Systems
campbellsci.com/utah-scada

When you send a program to your datalogger through Logger-
Net’s Connect screen, you get a familiar Compile Results box.
There is really good stuff here. First, check to make sure the
datalogger compiled the program without any errors, messages,
or warnings. The CRBasic editor can’t catch them all. Next make at
least a mental note of the operating system (OS) version running
in the datalogger. Is it fairly up to date? OS version 24 is the latest
and greatest.
LoggerNet 4.1 introduced a Details button. You are probably fa-
miliar with the old saying, “The devil is in the details,” but there’s no
catch here—just a lot of information you might fi nd useful. Let’s
take a moment to get acquainted with it. Pressing Details brings
up the Program File Summary window. It has a lot of information
about the fi les and tables stored on your datalogger.
The File System tab lists the fi les stored on the datalogger.
The Table Fill Times tab lists the tables in the datalogger, along
with the maximum number of records each table can hold,
and the estimated time it will take each table to fi ll.
So, remember! Before you okay-away a pop-up window,
check the details. You never know who might be hiding there!
Devilishly yours,
Details, Details, Details!
Upcoming Trade Shows
MARCH12-15 WSWS Reno, NV
14-16 TRWA 43rd Annual Convention Fort Worth, TX
25-28 GEO Congress 2012 Oakland, CA
APRIL
20 RMATA Exhibit Mesa, AZ
23-27 USSD Annual Conference New Orleans, LA
29-02 APWA Snow Conference Milwaukee, WI
30-04 NWQMC Portland, OR
MAY15-17 ASES 2010 Denver, CO
15-18 ALERT Conference Reno, NV
20-24 EWRI Congress Albuquerque, NM
JUNE03-06 Windpower 2012 Atlanta, GA
03-10 9th Int’l Wetlands Conference Orlando, FL
10-13 WEDA San Antonio, TX
10-13 IBC 2012 Pittsburgh, PA
19-22 Air & Waste Management San Antonio, TX
JULY10-12 Inter Solar 2012 San Francisco, CA
AUGUST05-10 ESA 9th Annual Meeting Portland, OR
20-22 StormCon Denver, CO
Visit our website for training class schedules and additional listings.
[email protected] 435.227.9000
815 W 1800 NLogan, UT 84321
Tips and Tricks