Embed Size (px)
Citation preview
Rising Cesarean Section Rate
Dr Waled abohatab MDConsultant OBS & GYN
Nasser Medical Complex6th annual scientific day – april-2014

Contents:
• Introduction
• Study design
• Results and discussion
• Recommendations

Introduction:
• C. Section on the Rise
• Cesarean section rates have risen worldwide. Studies from industrial countries show that the indications for CS have changed over the last decades.
• Our study will focus on the indications that are dominant in our hospital today.
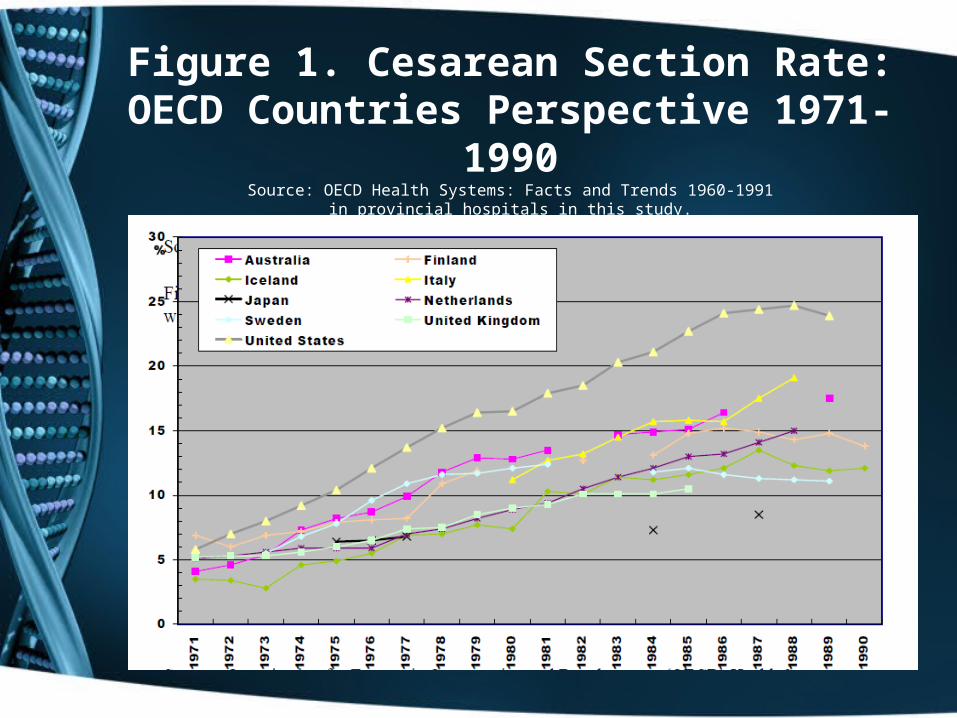
Figure 1. Cesarean Section Rate: OECD Countries Perspective 1971-1990
Source: OECD Health Systems: Facts and Trends 1960-1991in provincial hospitals in this study.
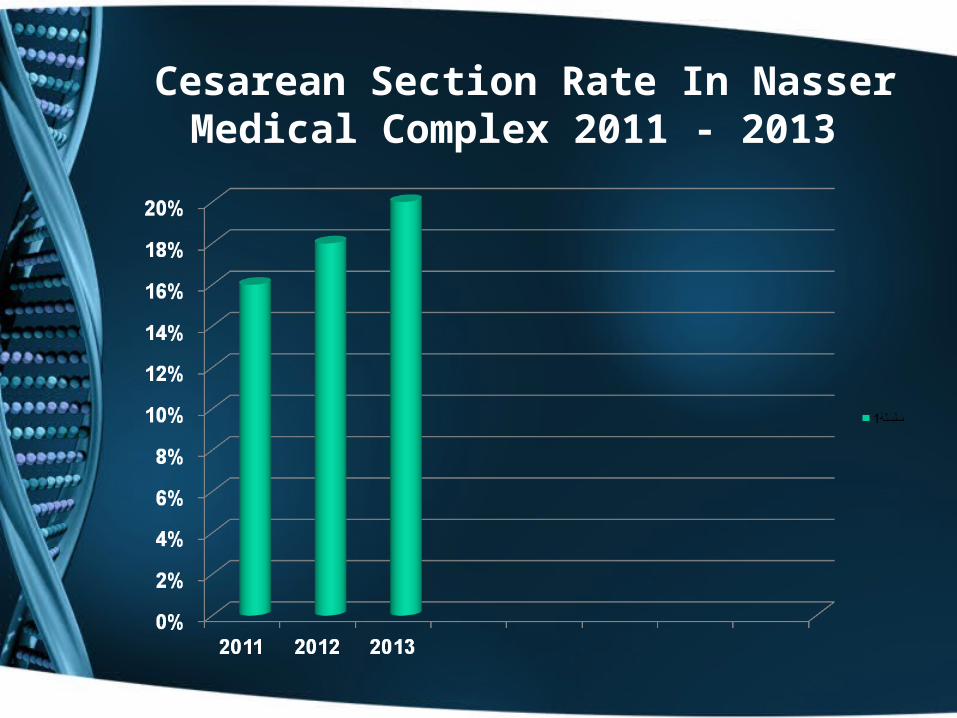
Cesarean Section Rate In Nasser Medical Complex 2011 - 2013
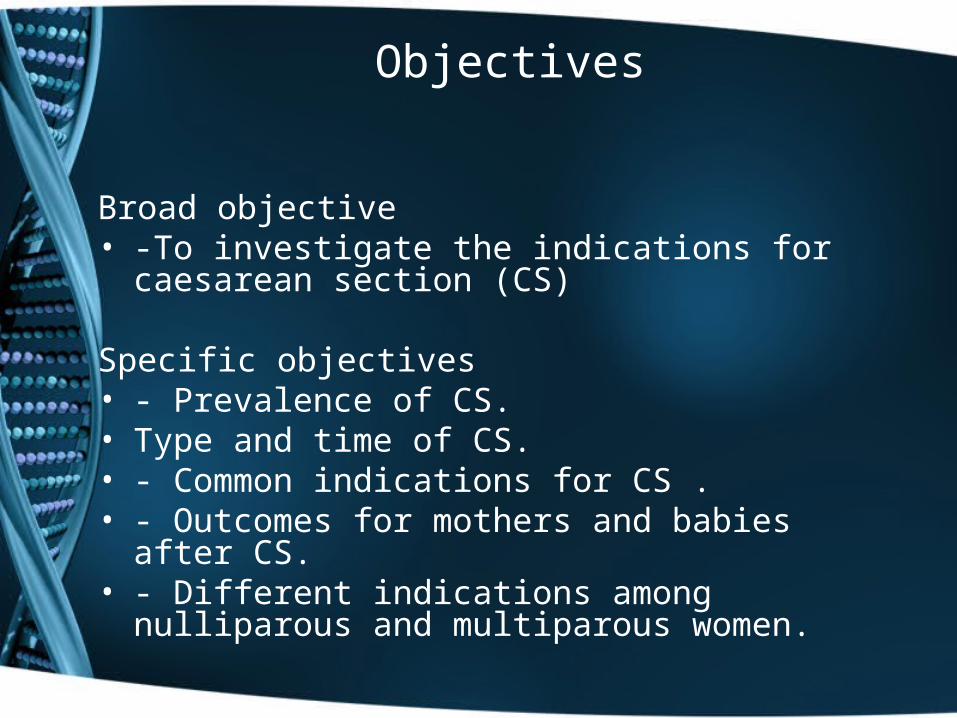
Objectives
Broad objective• -To investigate the indications for caesarean section
(CS)
Specific objectives• - Prevalence of CS.• Type and time of CS.• - Common indications for CS . • - Outcomes for mothers and babies after CS.• - Different indications among nulliparous and
multiparous women.
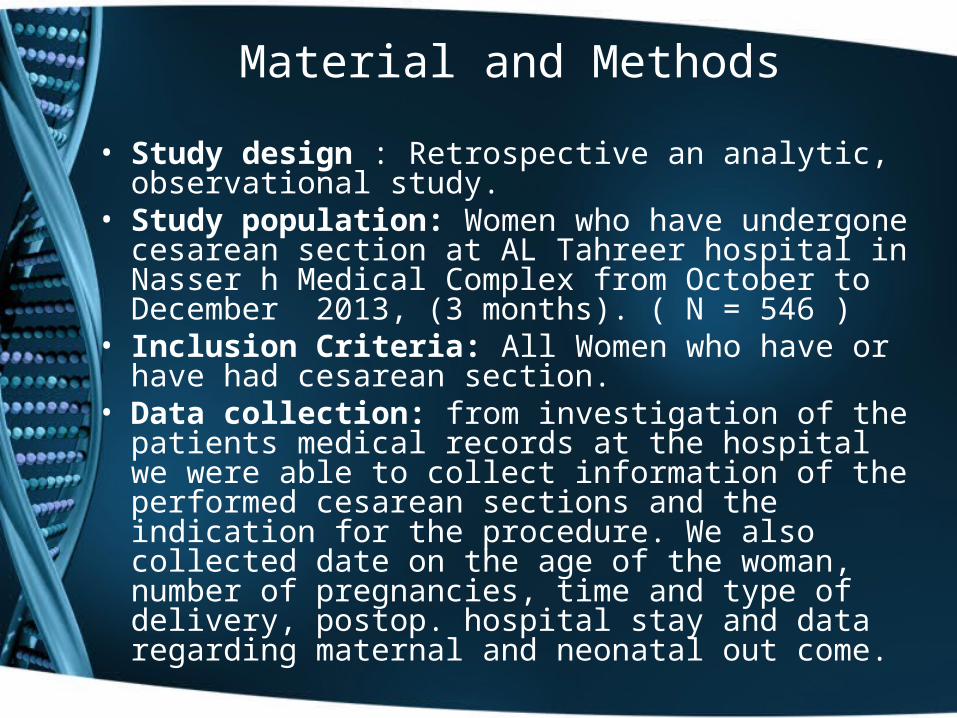
Material and Methods
• Study design : Retrospective an analytic, observational study.
• Study population: Women who have undergone cesarean section at AL Tahreer hospital in Nasser h Medical Complex from October to December 2013, (3 months). ( N = 546 )
• Inclusion Criteria: All Women who have or have had cesarean section.
• Data collection: from investigation of the patients medical records at the hospital we were able to collect information of the performed cesarean sections and the indication for the procedure. We also collected date on the age of the woman, number of pregnancies, time and type of delivery, postop. hospital stay and data regarding maternal and neonatal out come.
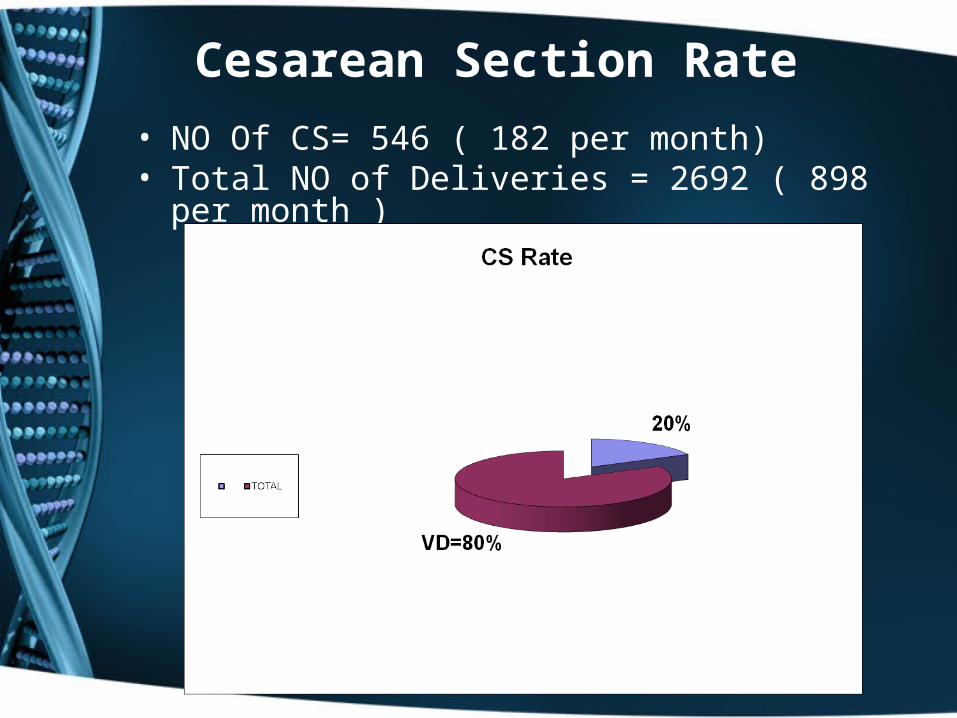
Cesarean Section Rate
• NO Of CS= 546 ( 182 per month)• Total NO of Deliveries = 2692 ( 898 per month )
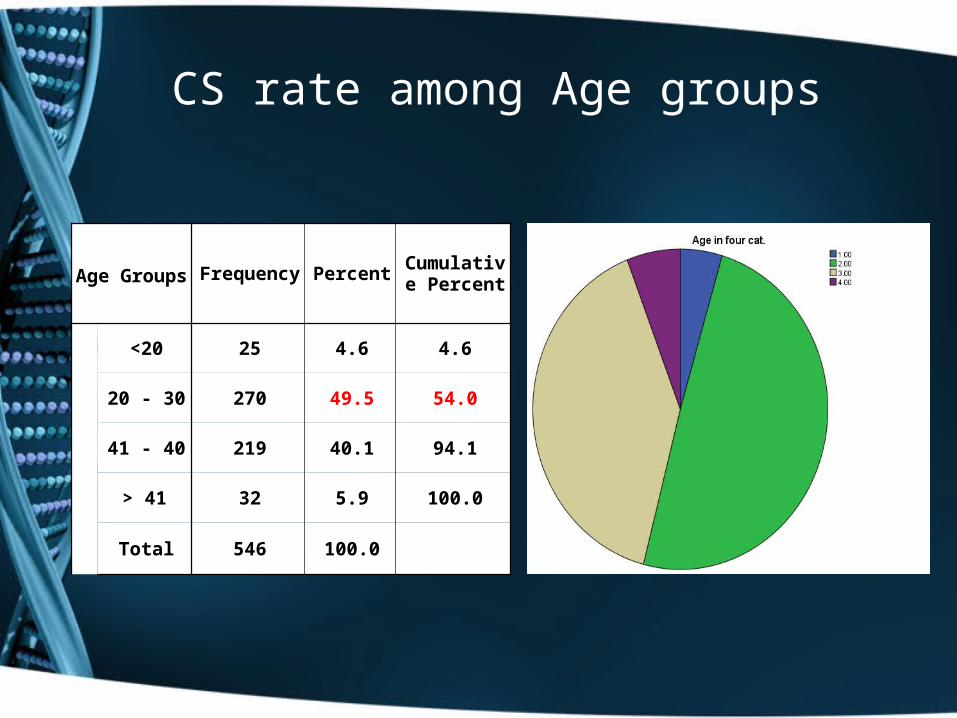
CS rate among Age groups
Age Groups Frequency PercentCumulative
Percent
<20 25 4.6 4.6
20 - 30 270 49.5 54.0
41 - 40 219 40.1 94.1
> 41 32 5.9 100.0
Total 546 100.0
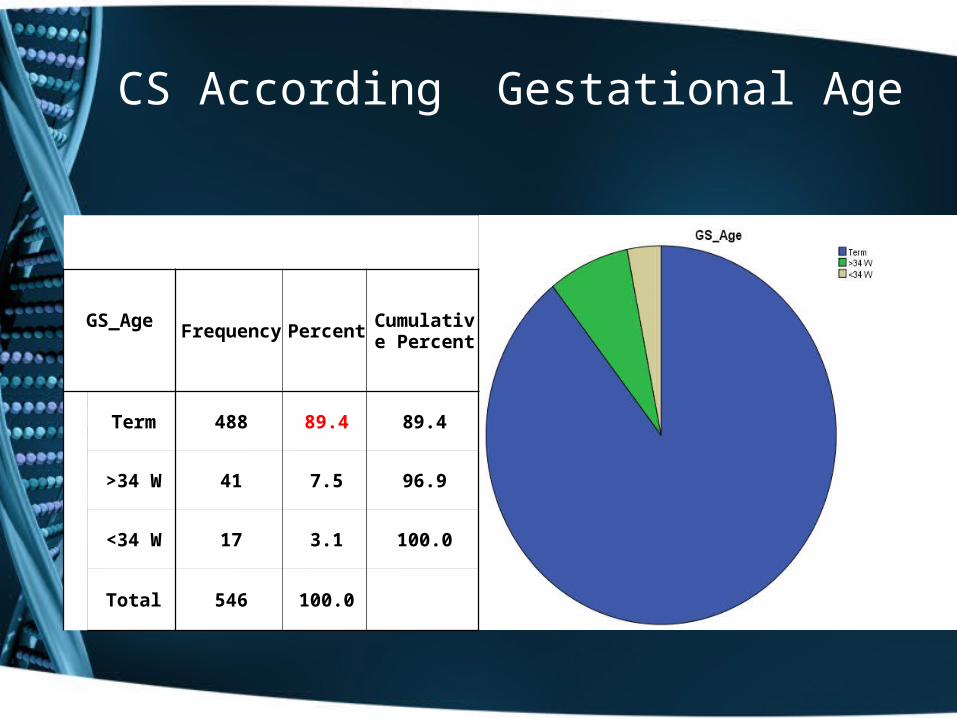
CS According Gestational Age
GS_AgeFrequency Percent
Cumulative Percent
Term 488 89.4 89.4
>34 W 41 7.5 96.9
<34 W 17 3.1 100.0
Total 546 100.0
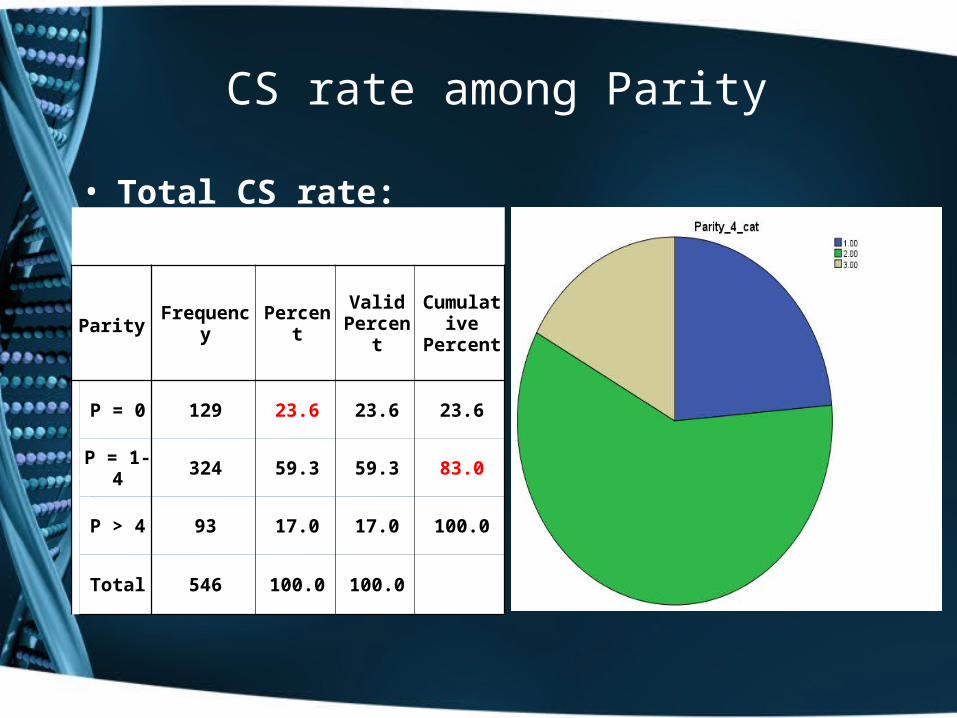
CS rate among Parity
• Total CS rate:
Parity Frequency PercentValid
Percent
Cumulative
Percent
P = 0 129 23.6 23.6 23.6
P = 1-4 324 59.3 59.3 83.0
P > 4 93 17.0 17.0 100.0
Total 546 100.0 100.0
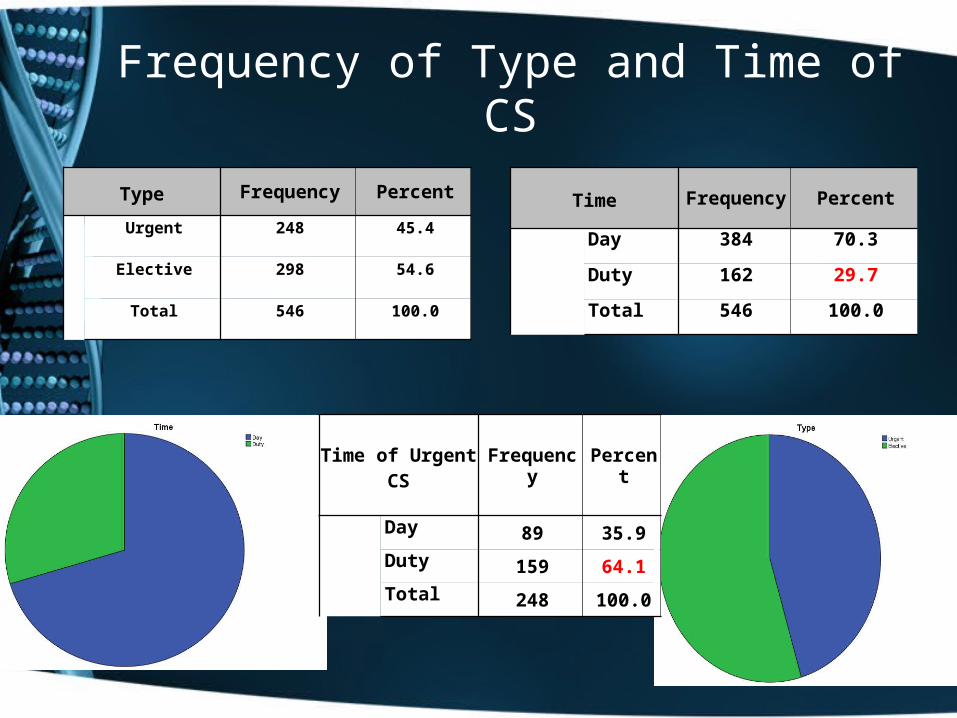
Frequency of Type and Time of CS
Type Frequency Percent
Urgent 248 45.4
Elective 298 54.6
Total 546 100.0
Time Frequency Percent
Day 384 70.3
Duty 162 29.7
Total 546 100.0
Time of Urgent CS Frequency Percent
Day 89 35.9
Duty 159 64.1
Total 248 100.0
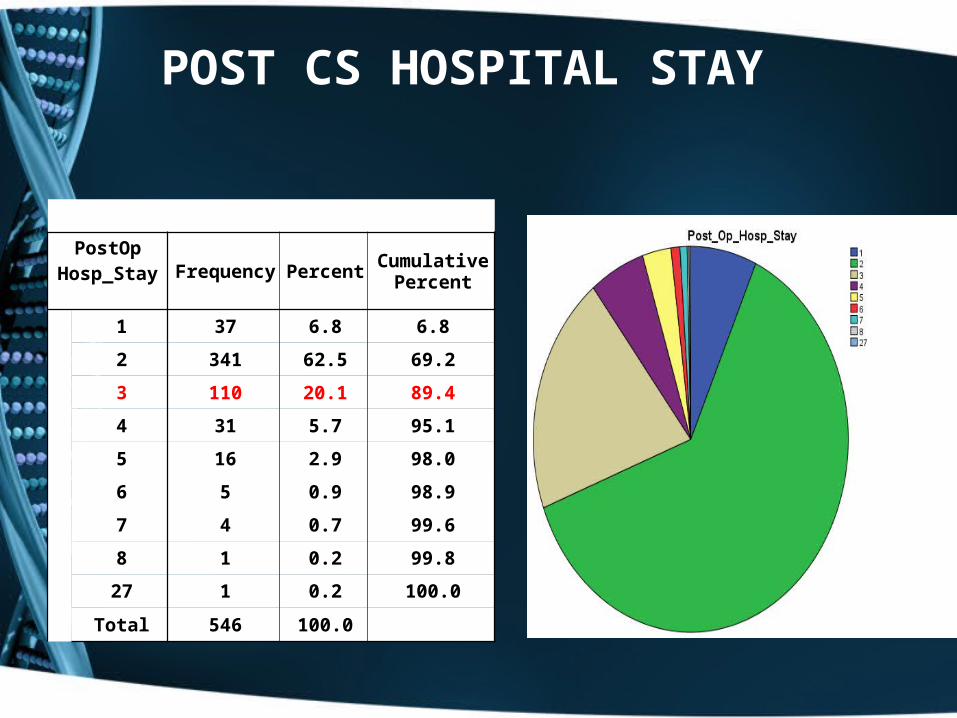
POST CS HOSPITAL STAY
PostOpHosp_Stay Frequency Percent
Cumulative Percent
1 37 6.8 6.8
2 341 62.5 69.2
3 110 20.1 89.4
4 31 5.7 95.1
5 16 2.9 98.0
6 5 0.9 98.9
7 4 0.7 99.6
8 1 0.2 99.8
27 1 0.2 100.0
Total 546 100.0
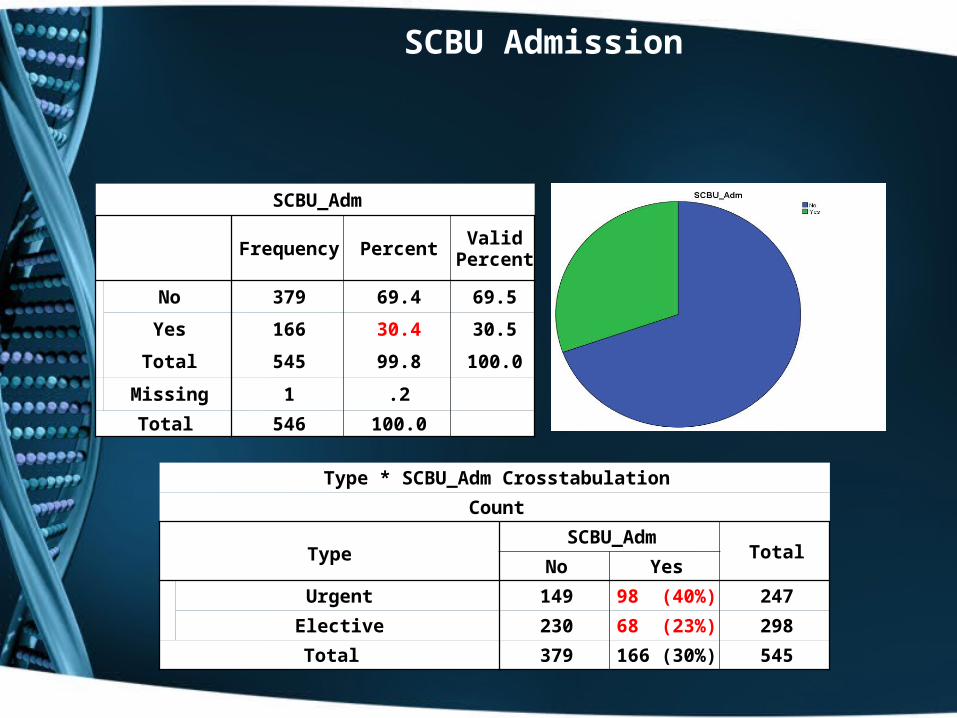
SCBU Admission
SCBU_Adm
Frequency PercentValid
Percent
No 379 69.4 69.5
Yes 166 30.4 30.5
Total 545 99.8 100.0
Missing 1 .2
Total 546 100.0
Type * SCBU_Adm Crosstabulation
Count
TypeSCBU_Adm
TotalNo Yes
Urgent 149 98 (40%) 247
Elective 230 68 (23%) 298
Total 379 166 (30%) 545
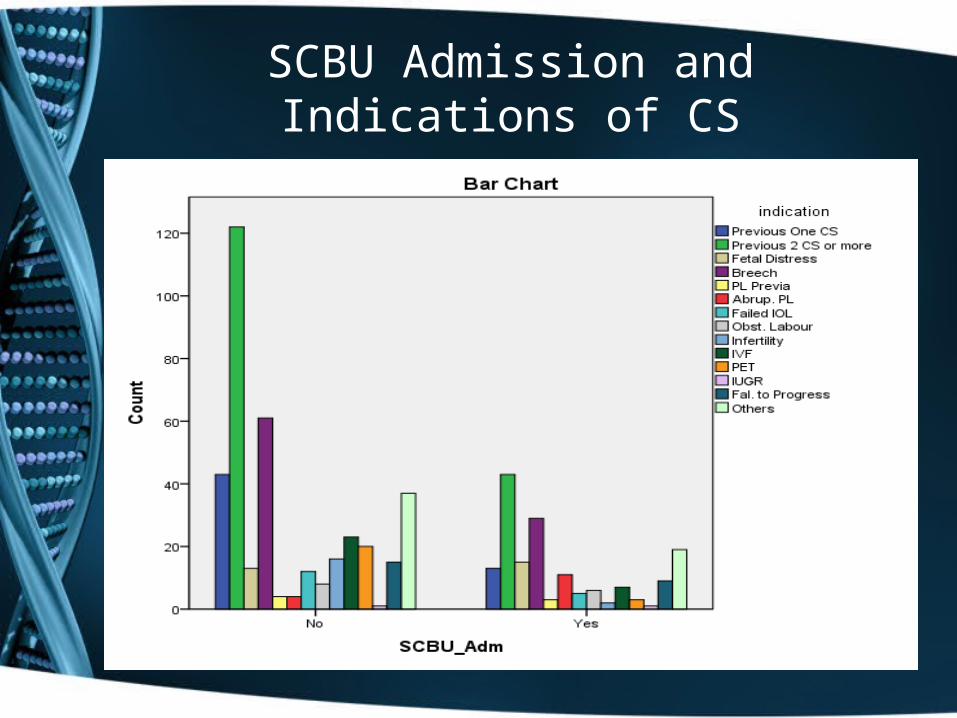
SCBU Admission and Indications of CS
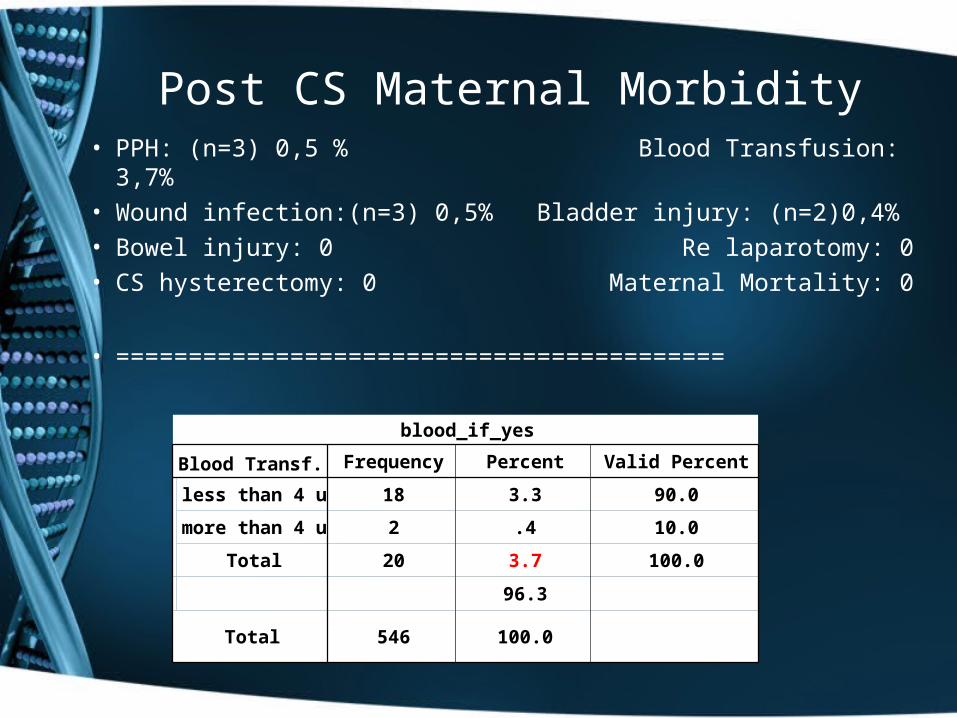
Post CS Maternal Morbidity• PPH: (n=3) 0,5 % Blood Transfusion: 3,7%• Wound infection:(n=3) 0,5% Bladder injury: (n=2)0,4%• Bowel injury: 0 Re laparotomy: 0• CS hysterectomy: 0 Maternal Mortality: 0
• ==========================================blood_if_yes
Blood Transf. Frequency Percent Valid Percent
less than 4 u 18 3.3 90.0
more than 4 u 2 .4 10.0
Total 20 3.7 100.0
96.3
Total 546 100.0
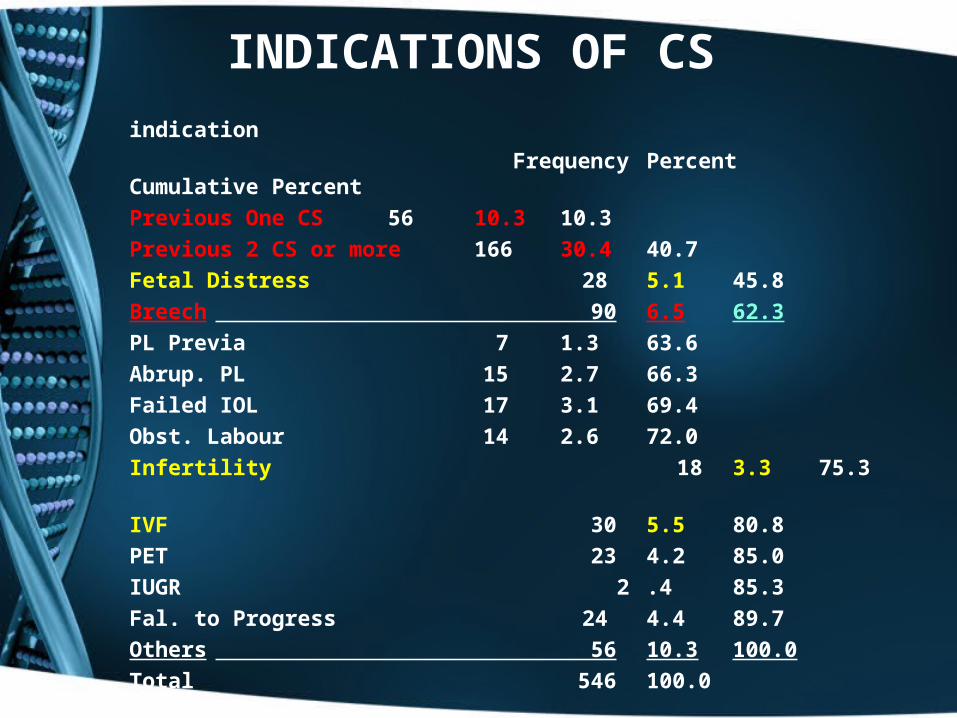
INDICATIONS OF CS
indication
Frequency Percent Cumulative Percent
Previous One CS 56 10.3 10.3
Previous 2 CS or more 166 30.4 40.7
Fetal Distress 28 5.1 45.8
Breech 90 6.5 62.3
PL Previa 7 1.3 63.6
Abrup. PL 15 2.7 66.3
Failed IOL 17 3.1 69.4
Obst. Labour 14 2.6 72.0
Infertility 18 3.3 75.3
IVF 30 5.5 80.8
PET 23 4.2 85.0
IUGR 2 .4 85.3
Fal. to Progress 24 4.4 89.7
Others 56 10.3 100.0
Total 546 100.0
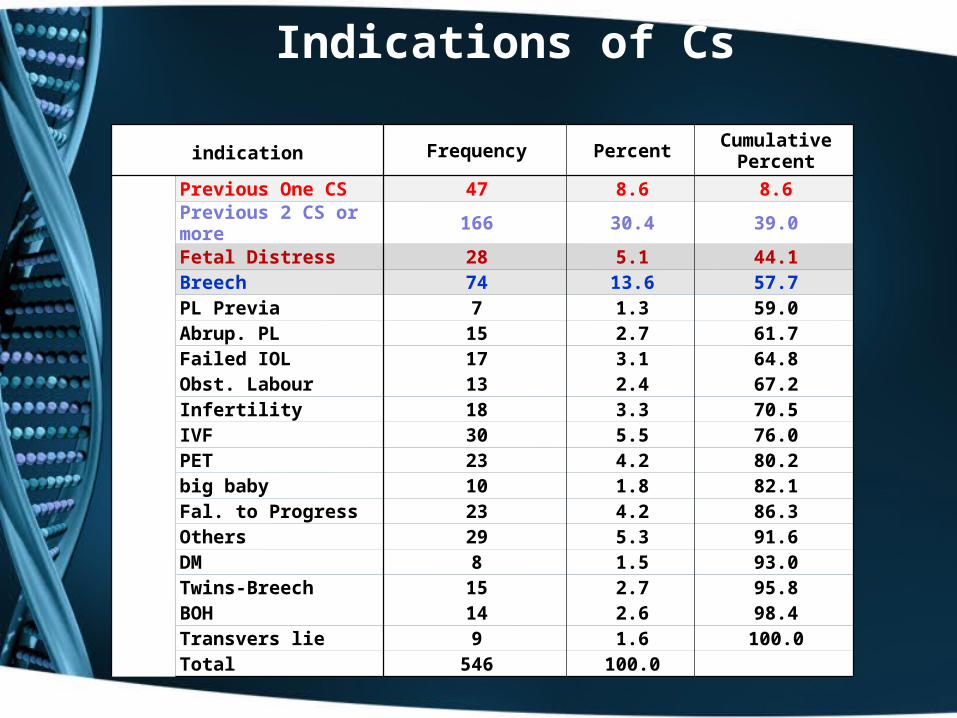
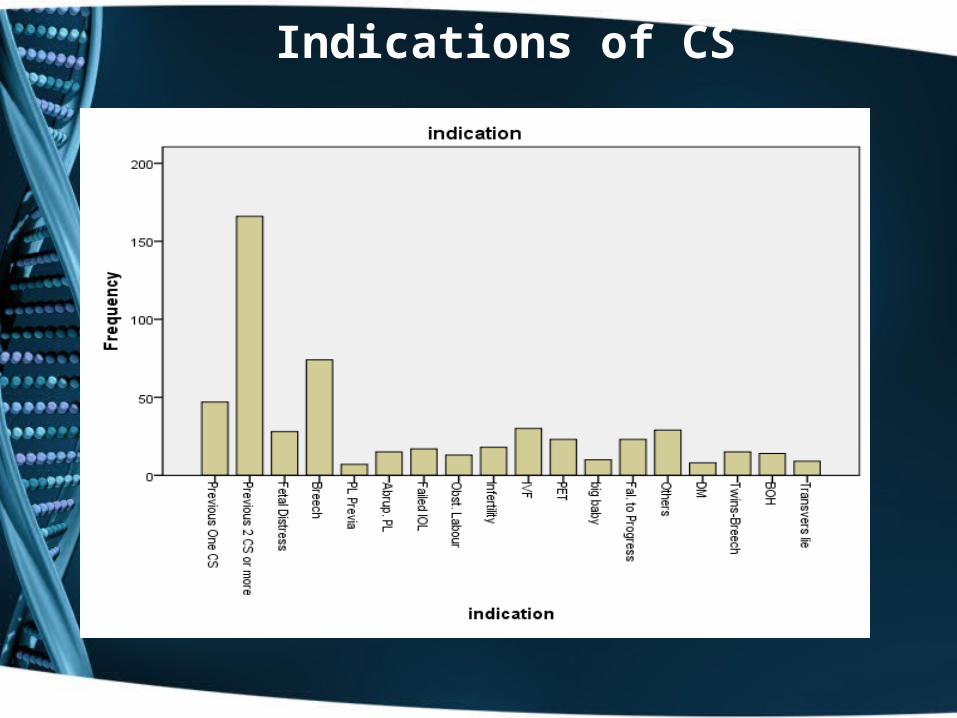
Indications of Cs
indication Frequency PercentCumulative
Percent
Previous One CS 47 8.6 8.6
Previous 2 CS or more 166 30.4 39.0
Fetal Distress 28 5.1 44.1Breech 74 13.6 57.7PL Previa 7 1.3 59.0Abrup. PL 15 2.7 61.7Failed IOL 17 3.1 64.8Obst. Labour 13 2.4 67.2Infertility 18 3.3 70.5IVF 30 5.5 76.0PET 23 4.2 80.2big baby 10 1.8 82.1Fal. to Progress 23 4.2 86.3Others 29 5.3 91.6DM 8 1.5 93.0Twins-Breech 15 2.7 95.8BOH 14 2.6 98.4Transvers lie 9 1.6 100.0Total 546 100.0
Indications of CS
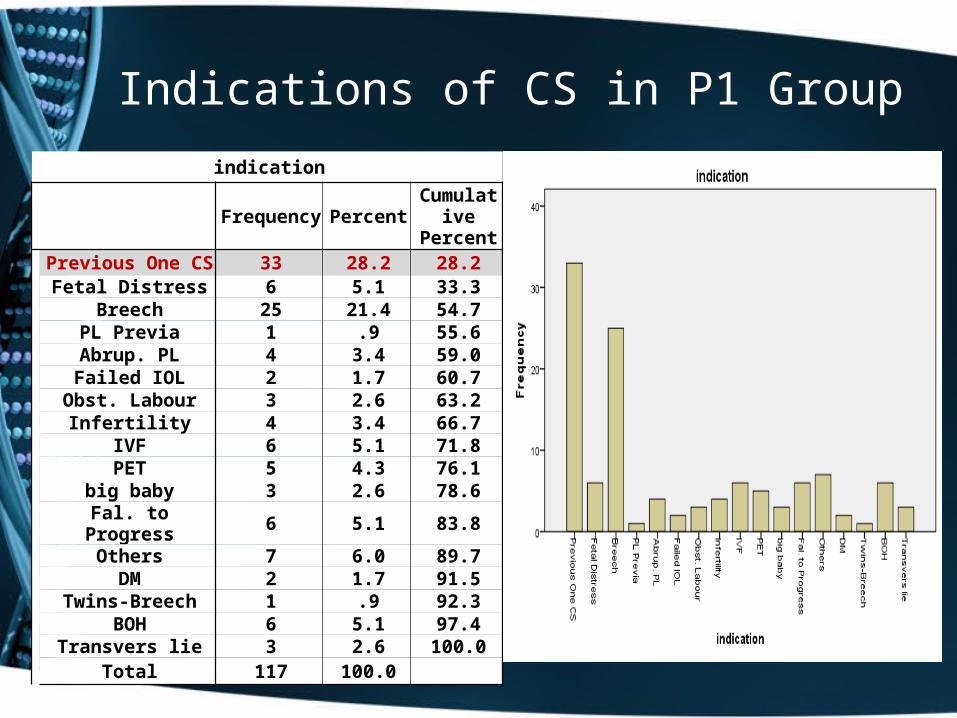
Indications of CS in P1 Group
indication
Frequency PercentCumulati
ve Percent
Previous One CS 33 28.2 28.2Fetal Distress 6 5.1 33.3
Breech 25 21.4 54.7PL Previa 1 .9 55.6Abrup. PL 4 3.4 59.0Failed IOL 2 1.7 60.7
Obst. Labour 3 2.6 63.2Infertility 4 3.4 66.7
IVF 6 5.1 71.8PET 5 4.3 76.1
big baby 3 2.6 78.6Fal. to Progress 6 5.1 83.8
Others 7 6.0 89.7DM 2 1.7 91.5
Twins-Breech 1 .9 92.3BOH 6 5.1 97.4
Transvers lie 3 2.6 100.0Total 117 100.0
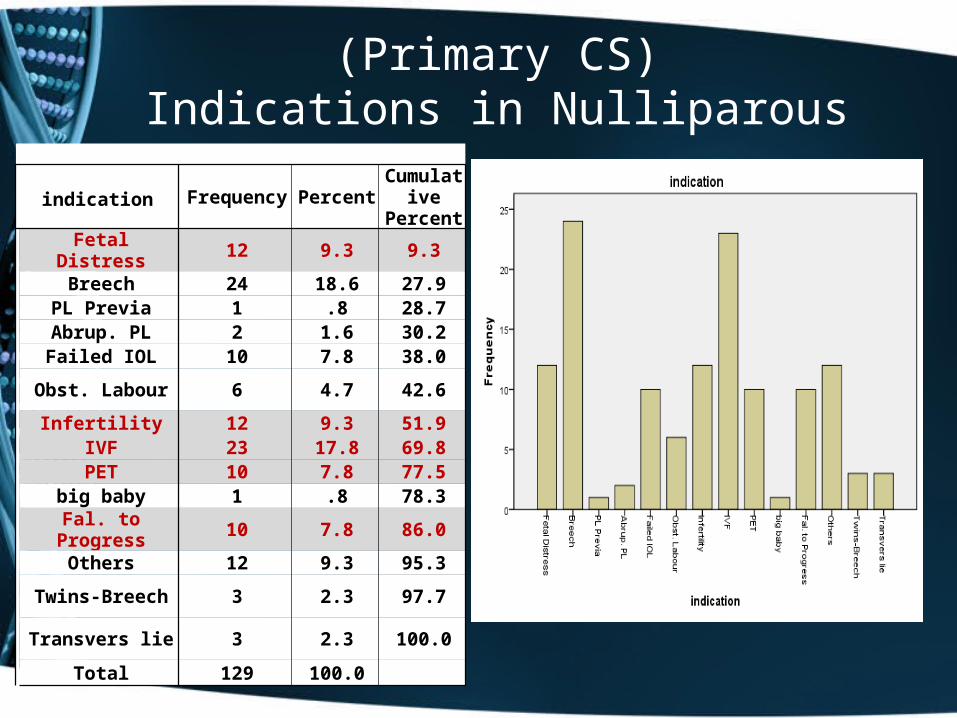
(Primary CS) Indications in Nulliparous
indication Frequency PercentCumulati
ve Percent
Fetal Distress 12 9.3 9.3
Breech 24 18.6 27.9PL Previa 1 .8 28.7Abrup. PL 2 1.6 30.2Failed IOL 10 7.8 38.0
Obst. Labour 6 4.7 42.6
Infertility 12 9.3 51.9IVF 23 17.8 69.8PET 10 7.8 77.5
big baby 1 .8 78.3
Fal. to Progress 10 7.8 86.0
Others 12 9.3 95.3
Twins-Breech 3 2.3 97.7
Transvers lie 3 2.3 100.0
Total 129 100.0
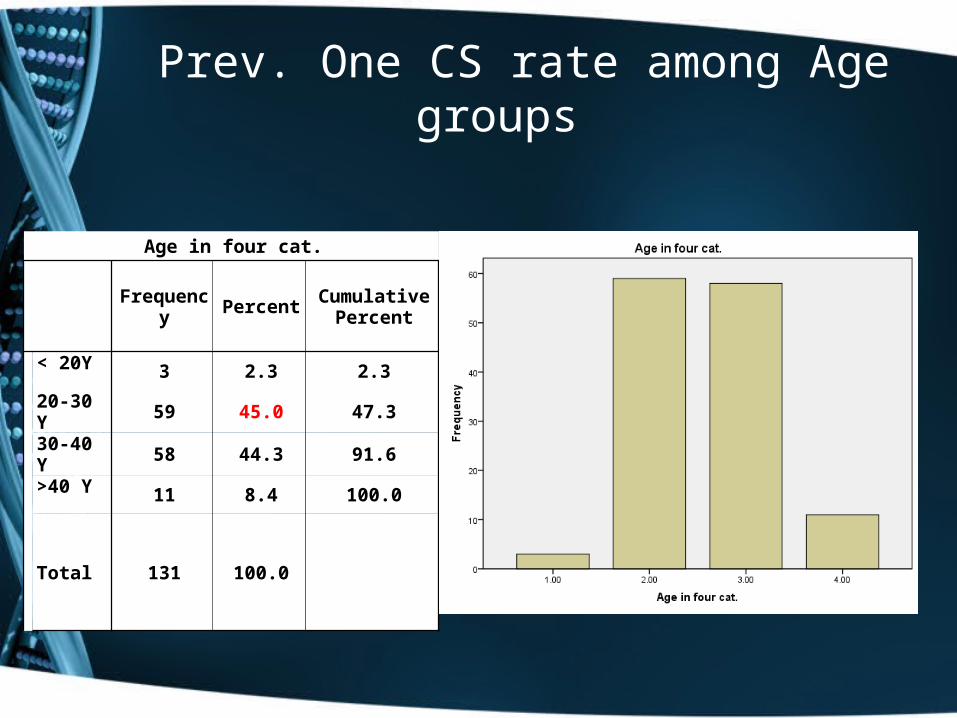
Prev. One CS rate among Age groups
Age in four cat.
Frequency PercentCumulative
Percent
< 20Y 3 2.3 2.3
20-30 Y 59 45.0 47.3
30-40 Y 58 44.3 91.6
>40 Y 11 8.4 100.0
Total 131 100.0
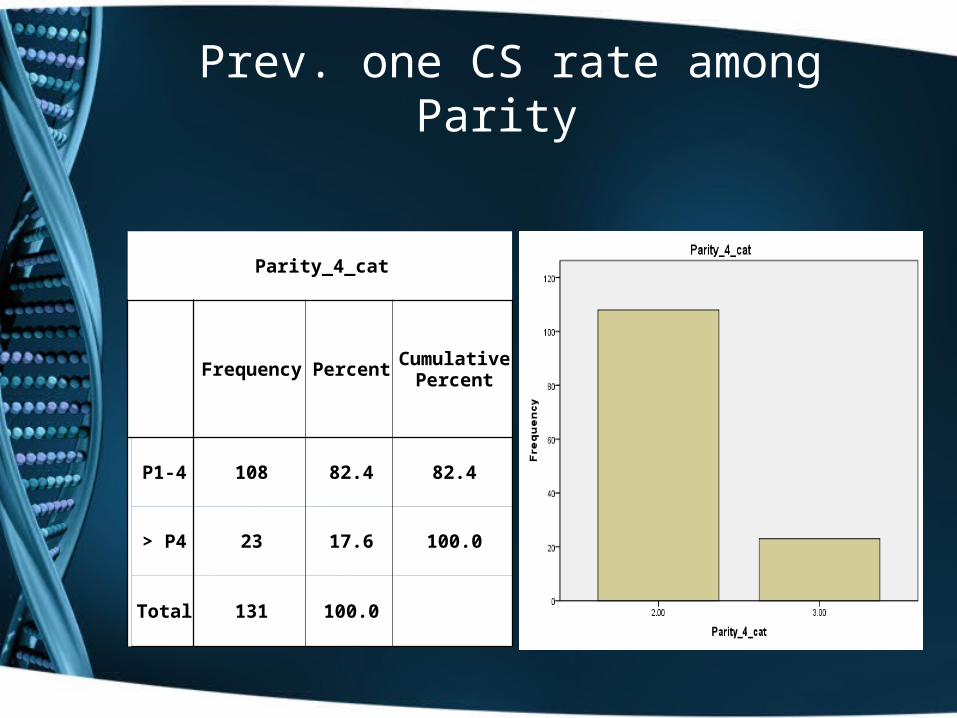
Prev. one CS rate among Parity
Parity_4_cat
Frequency PercentCumulative
Percent
P1-4 108 82.4 82.4
> P4 23 17.6 100.0
Total 131 100.0
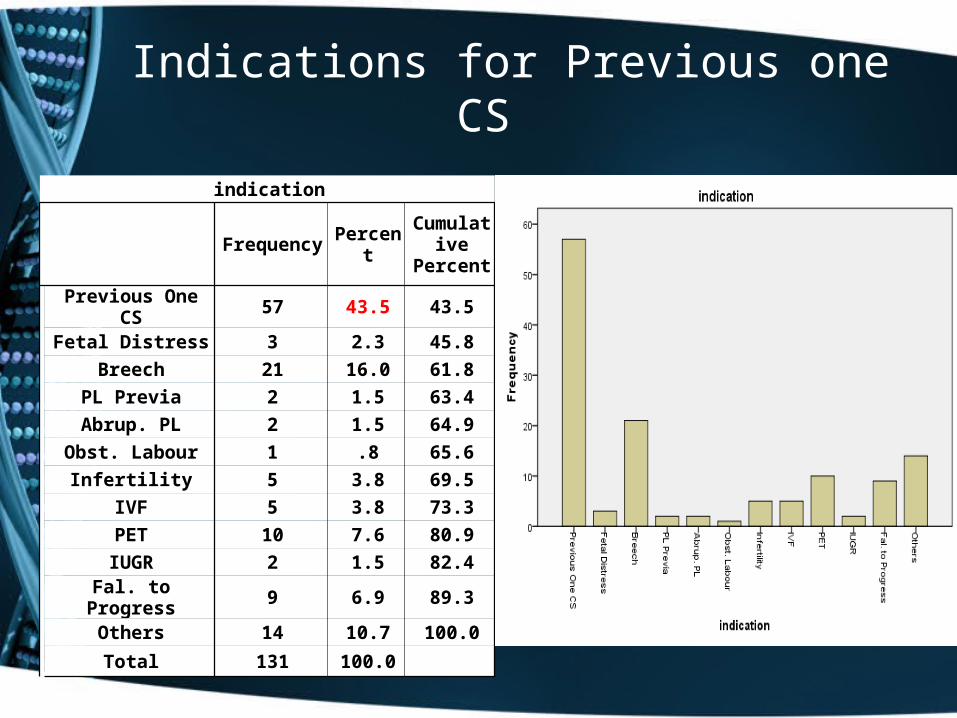
Indications for Previous one CS
indication
Frequency PercentCumulati
ve Percent
Previous One CS 57 43.5 43.5
Fetal Distress 3 2.3 45.8
Breech 21 16.0 61.8
PL Previa 2 1.5 63.4
Abrup. PL 2 1.5 64.9
Obst. Labour 1 .8 65.6
Infertility 5 3.8 69.5
IVF 5 3.8 73.3
PET 10 7.6 80.9
IUGR 2 1.5 82.4
Fal. to Progress 9 6.9 89.3
Others 14 10.7 100.0
Total 131 100.0
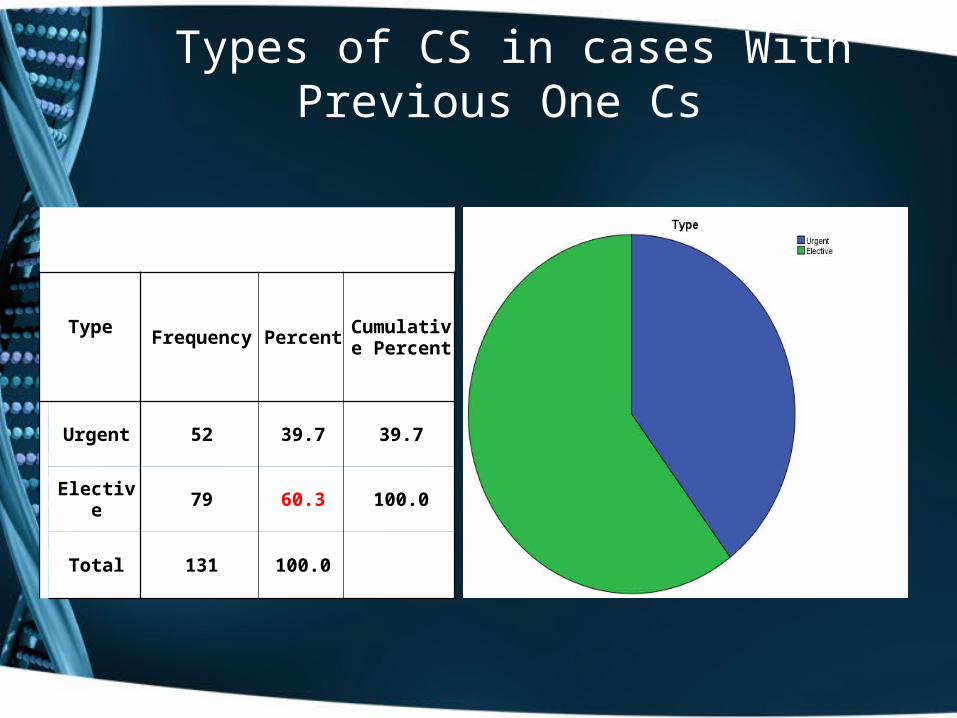
Types of CS in cases With Previous One Cs
TypeFrequency Percent
Cumulative Percent
Urgent 52 39.7 39.7
Elective 79 60.3 100.0
Total 131 100.0
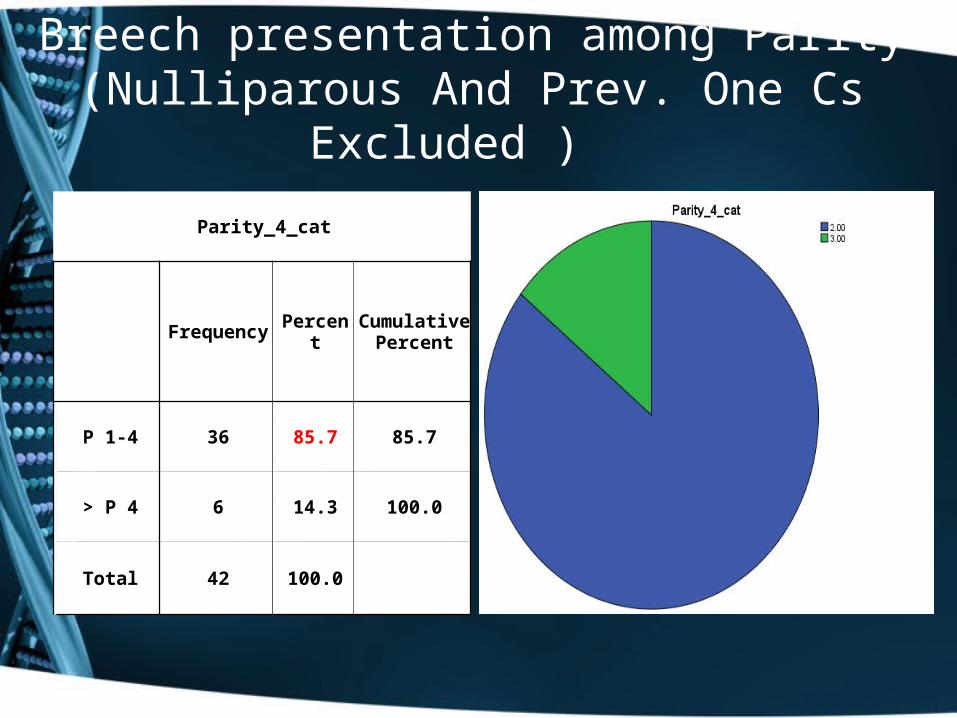
Breech presentation among Parity(Nulliparous And Prev. One Cs Excluded )
Parity_4_cat
Frequency PercentCumulative
Percent
P 1-4 36 85.7 85.7
> P 4 6 14.3 100.0
Total 42 100.0
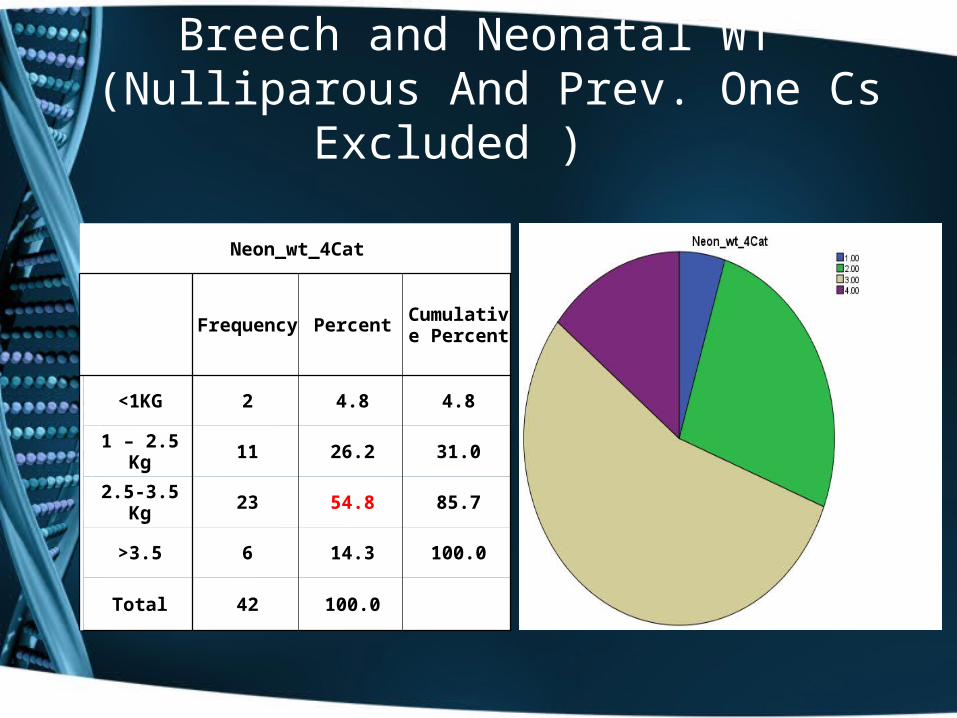
Breech and Neonatal WT (Nulliparous And Prev. One Cs Excluded )
Neon_wt_4Cat
Frequency PercentCumulative
Percent
<1KG 2 4.8 4.8
1 – 2.5 Kg 11 26.2 31.0
2.5-3.5 Kg 23 54.8 85.7
>3.5 6 14.3 100.0
Total 42 100.0
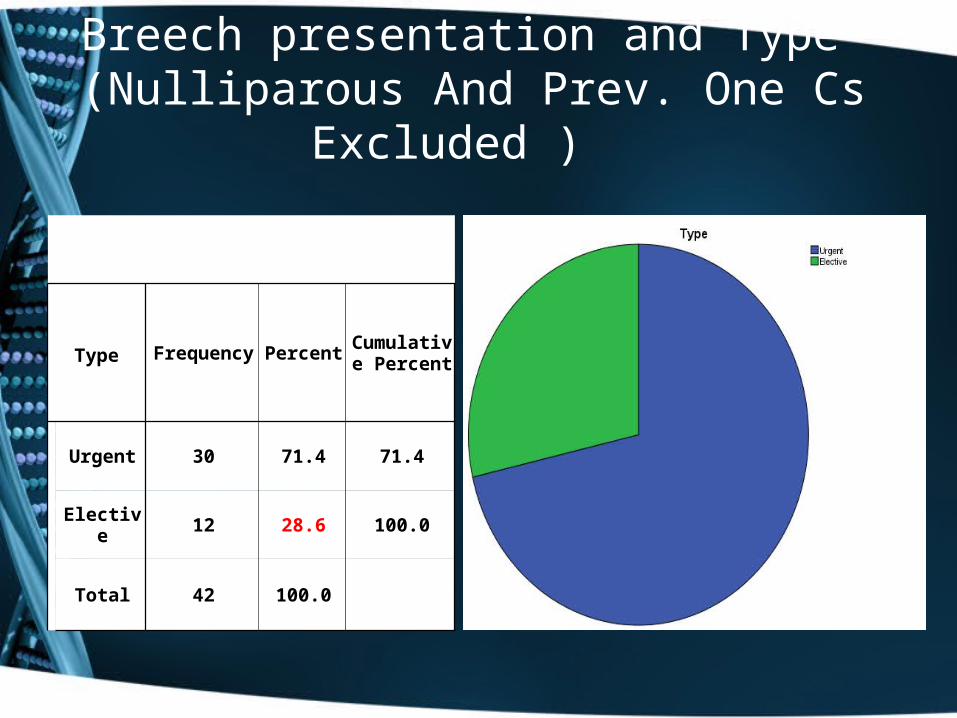
Breech presentation and Type (Nulliparous And Prev. One Cs Excluded )
Type Frequency PercentCumulative
Percent
Urgent 30 71.4 71.4
Elective 12 28.6 100.0
Total 42 100.0
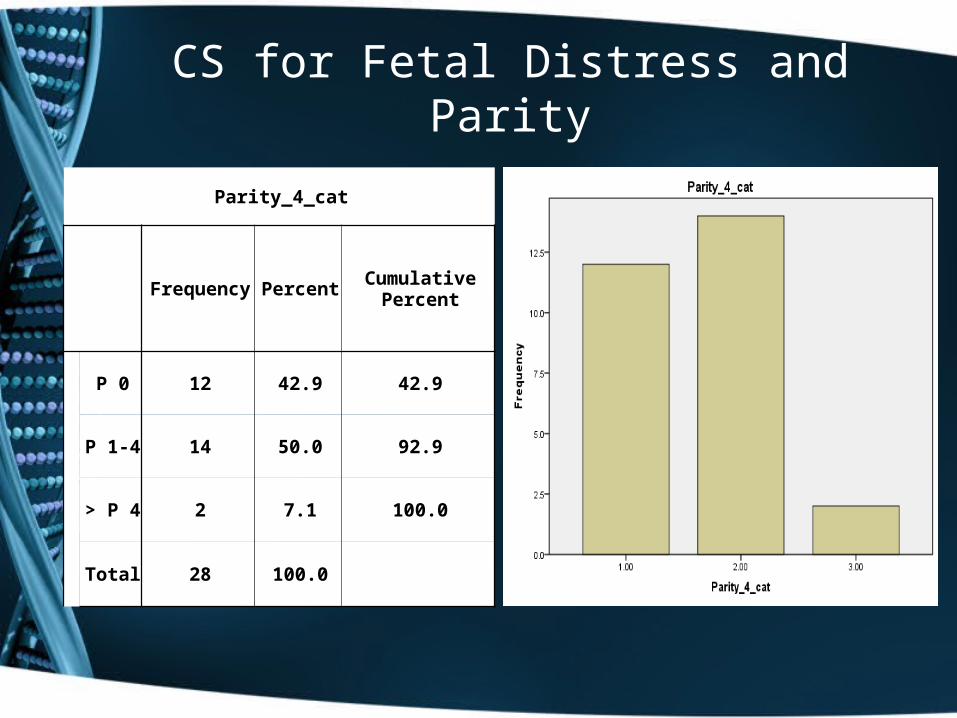
CS for Fetal Distress and Parity
Parity_4_cat
Frequency PercentCumulative
Percent
P 0 12 42.9 42.9
P 1-4 14 50.0 92.9
> P 4 2 7.1 100.0
Total 28 100.0
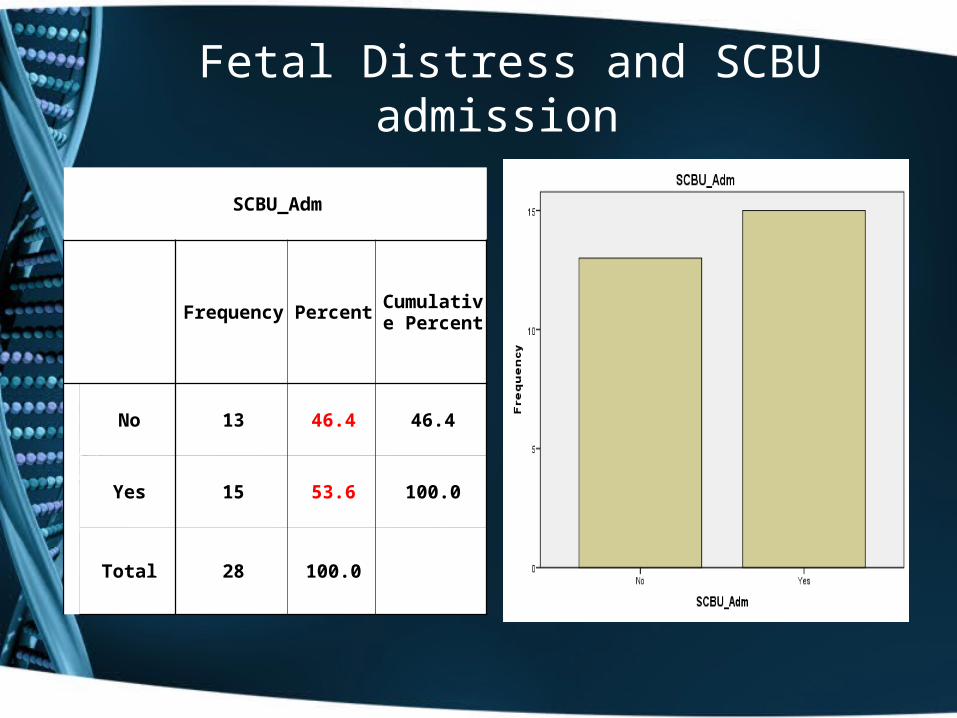
Fetal Distress and SCBU admission
SCBU_Adm
Frequency PercentCumulative
Percent
No 13 46.4 46.4
Yes 15 53.6 100.0
Total 28 100.0
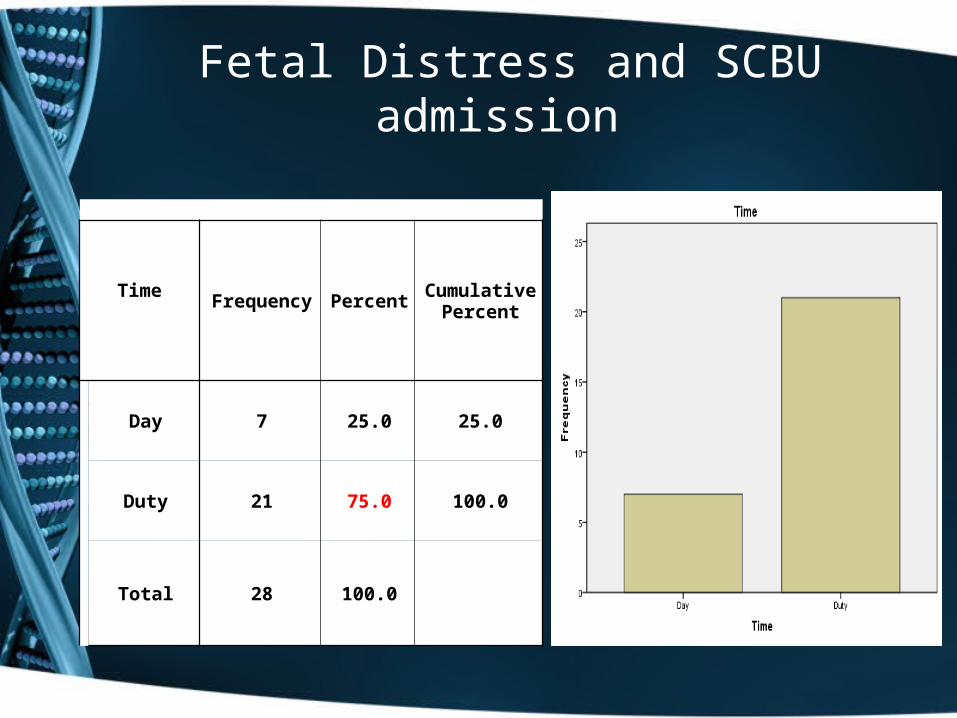
Fetal Distress and SCBU admission
TimeFrequency Percent
Cumulative Percent
Day 7 25.0 25.0
Duty 21 75.0 100.0
Total 28 100.0
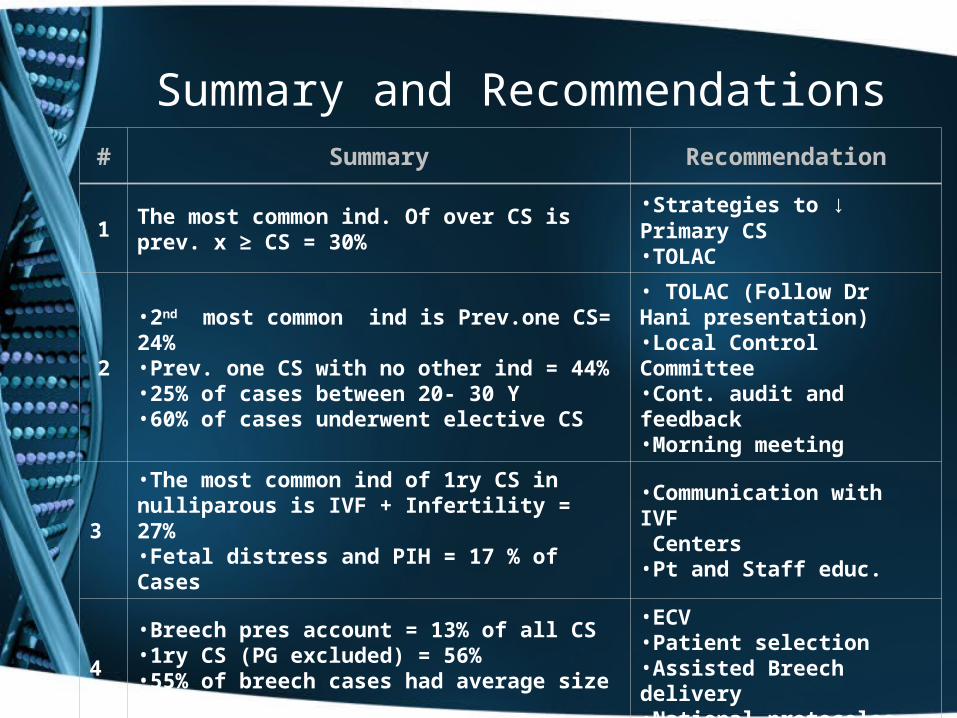
Summary and Recommendations# Summary Recommendation
1The most common ind. Of over CS is prev. x ≥ CS = 30%
•Strategies to ↓ Primary CS•TOLAC
2
•2nd most common ind is Prev.one CS= 24%•Prev. one CS with no other ind = 44%•25% of cases between 20- 30 Y•60% of cases underwent elective CS
• TOLAC (Follow Dr Hani presentation)•Local Control Committee•Cont. audit and feedback•Morning meeting
3•The most common ind of 1ry CS in nulliparous is IVF + Infertility = 27%•Fetal distress and PIH = 17 % of Cases
•Communication with IVF Centers•Pt and Staff educ.
4•Breech pres account = 13% of all CS•1ry CS (PG excluded) = 56%•55% of breech cases had average size baby
•ECV •Patient selection•Assisted Breech delivery•National protocoles
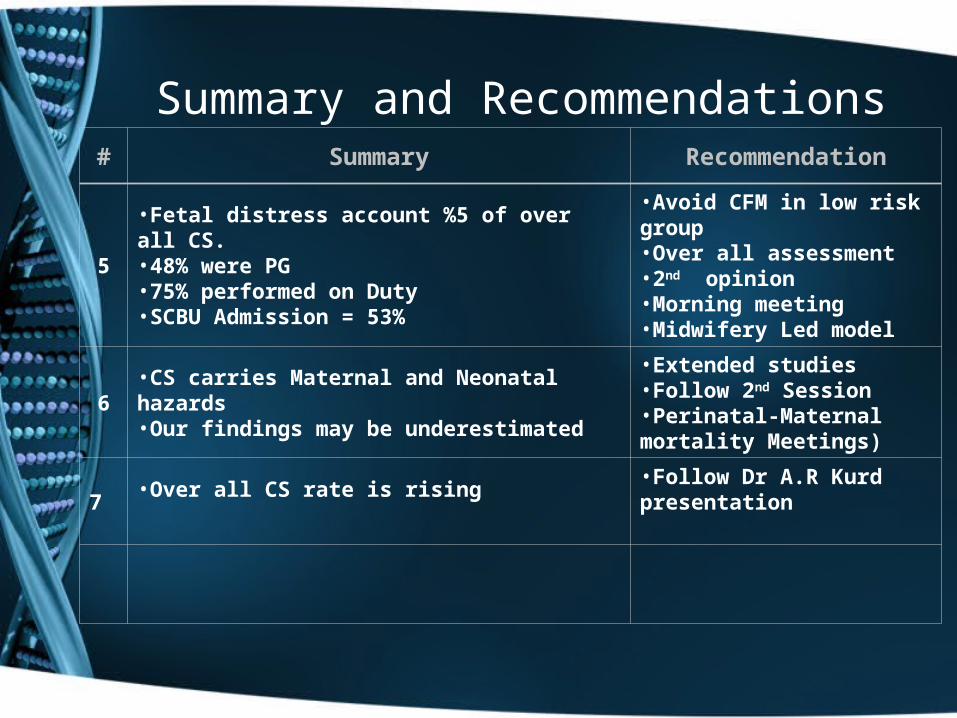
Summary and Recommendations# Summary Recommendation
5
•Fetal distress account %5 of over all CS.•48% were PG•75% performed on Duty•SCBU Admission = 53%
•Avoid CFM in low risk group•Over all assessment•2nd opinion •Morning meeting•Midwifery Led model
6•CS carries Maternal and Neonatal hazards •Our findings may be underestimated
•Extended studies •Follow 2nd Session •Perinatal-Maternal mortality Meetings)
7•Over all CS rate is rising
•Follow Dr A.R Kurd presentation
Cesarean Impacts on Nursing
• Due to the increased risk of mothers return to the hospital after birth…

Thank you


![Naser Oric Appeals Judgement [Acquittal] (Srebrenica & Bratunac)](https://img.pdfslide.us/doc/110x75/577d380b1a28ab3a6b96f4eb/naser-oric-appeals-judgement-acquittal-srebrenica-bratunac.jpg)