Embed Size (px)
Citation preview

Rochester Institute of TechnologyRIT Scholar Works
Theses Thesis/Dissertation Collections
8-1-1994
Crystallization kinetics of Poly (ethylene oxide)Frances Segouin
Follow this and additional works at: http://scholarworks.rit.edu/theses
This Thesis is brought to you for free and open access by the Thesis/Dissertation Collections at RIT Scholar Works. It has been accepted for inclusionin Theses by an authorized administrator of RIT Scholar Works. For more information, please contact [email protected].
Recommended CitationSegouin, Frances, "Crystallization kinetics of Poly (ethylene oxide)" (1994). Thesis. Rochester Institute of Technology. Accessed from

Crystallization Kinetics of Poly (Ethylene Oxide)
Frances H. Segouin
August, 1994
Thesis
Submitted in partial fulfillment of the
requirements for the degree of Master of Science
in Chemistry
Approved:
Andreas Langner
Project Advisor
Gerald A. Takacs
Department Head
Rochester Institute of TechnologyRochester, New York 14623
Department of Chemistry

Crystallization Kinetics of Poly (Ethylene Oxide)
I, Frances H. Segouin, hereby grant permission to the Wallace Memorial Library,of R.I.T., to reproduce my thesis in whole or in part. Any reproduction will not befor commercial use or profit.
Signed

ABSTRACT
The three main goals of this project are to determine the molecular weight
dependence of polyethylene oxide) on the 1) morphology of crystalline material,
as seen with the polarizing light microscope, 2) nucleation of the crystalline
phase, as demonstrated with an annealing study, and 3) parameters of a
mathematical model for crystallization kinetics.
Bulk crystallization kinetics of polyethylene oxide) from the melt have
been studied for a large molecular weight range, 1500 g/mol to 7,000,000 g/mol.
The effects of molecular weight and cooling rate on the width and degree of
supercooling of DSC crystallization exotherms have been studied to determine
the type of nucleation involved and to determine the relationship between the
DSC signals and the morphology of a crystalline sample. As the molecular
weight increases, at a cooling rate of twenty degrees per minute, the width-at-
half-height of the exothermic DSC peak decreases from seven degrees to
approximately three degrees for the low molecular weight samples and increases
from three to seven degrees for the high molecular weight samples. The degree
of supercooling at which the peaks reach a maximum generally increases from
twelve degrees Celsius to above twenty degrees Celsius. The slower the cooling
rate the narrower the width at half height of the crystallization peak and the lower
the degree of supercooling at the maximum point of the crystallization
exotherms. For all of the molecular weight samples, the crystallization peak
temperatures increase in the range of one to ten degrees of supercooling from a
one-degree-per-minute cooling rate to a twenty degrees-per-minute cooling rate.
The average width-at-half-height increases from three to six- degrees Celsius
from the one degree-per-minute cooling rate experiment to the twenty degrees-
per-minute cooling rate experiment.
The morphology of the samples varied from a coarse non-interconnected
lamellae formation below the critical molecular weight to an interconnected
lamellae formation, also known as a spherulite, above the critical molecular
weight. The critical molecular weight for polyethylene oxide) is 3400 g/mol.
Based on the expression for the linear crystal growth rate, reported by
Cheng et al.1, a mathematical model was created to model the DSC
crystallization curves. This model, which incorporates heat transfer effects, can
model the width and shape of the DSC curves, but the degree of supercooling
that the model predicts is generally smaller than the experimental degree of
supercooling. While modeling the DSC crystallization curves, it was found that
the activation energy for reptation motion, U*, has less of an effect on the model
crystallization curves than does the surface energy term, Kg, of the Cheng
growth rate expression.

Table of Contents:
List of Figures jj
List of Tables v
Acknowledgments vi
1
1
1
1
1
1
1
1
0 Introduction 1
1 Nucleation of a Crystal 2
2 Growth Front Creation and Crystal Growth 4
3 Techniques for Characterization of Polymers 7
4 Viewing Crystals with the Polarizing Light Microscope 9
5 Interpreting DSC Crystallization Curves 11
6 Parameters Affecting Morphology 13
7 Literature Background 14
1.7.1 Hoffman - Growth Rates 15
1.7.2 Kovacs et al. - Surface Free Energy 16
1.7.3 Cheng - Growth Rate Expression 17
2.0 Theory 19
2.1 Avrami Type Kinetics 19
2.2 Hoffman and Cheng Growth Rate Expressions 25
3.0 Experimental 29
3.1 Morphology 31
3.2 Nucleation 33
4.0 Results and Discussion 37
4.1 Morphology with the Polarizing Light Microscope 41
4.2 Differential Scanning Calorimetry Study 47
4.3 Nucleation 53
4.4 Annealing of a Sample 63
4.5 Model 66
4.5.1 Modeling Parameters and Their Effects 69
4.5.2 Preliminary Modeling of Crystallization Curves 78
Conclusion 89
References 93

List of Figures
Number Title
Page
Number
Figure 1 . The polymer chains align with the growth front to form
lamellae and crystals.
Figure 2. Photomicrograph of a poly (ethylene oxide) sample.
Figure 3. Gel Permeation Chromatogram of poly(ethylene oxide),
1500 g/mol sample.
Figure 4. Gel Permeation Chromatogram of poly(ethylene oxide),
18,500 g/mol sample.
Figure 5. Gel Permeation Chromatogram of poly(ethylene oxide),
100,000 g/mol sample.
Figure 6. Photomicrographs of poly (ethylene oxide) samples
cooled at a rate of 10 degrees-per-minute with the use
of crossed polarizers.
Figure 7. Photomicrographs of poly (ethylene oxide) samples
cooled at a rate of 3 degrees-per-minute with the use
of crossed polarizers.
Figure 8. Experimental differential scanning calorimetry crystallization
curves for the low molecular weight range of poly(ethylene oxide).
Figure 9. Experimental differential scanning calorimetry crystallization
curves for the low molecular weight range of poly(ethylene oxide).
Figure 10. Experimental differential scanning calorimetry crystallization
curves for the high molecular weight range of polyethylene oxide).
Figure 1 1 .Experimental differential scanning calorimetry crystallization
curves for the high molecular weight range of polyethylene oxide).
Figure 12. Experimental differential scanning calorimetry crystallization
curves for PEG46.
Figure 1 3. Experimental differential scanning calorimetry crystallization
curves for the low molecular weight range of polyethylene oxide).
Figure 14. Experimental differential scanning calorimetrycrystallization
curves for a PEG2/PEG8 sample of polyethylene oxide).
Figure 1 5. Experimental differential scanning calorimetry melting curves
for the low molecular weight range of polyethylene oxide).
10
38
39
40
43
46
48
50
51
52
54
55
58
59

Figure 16. Experimental differential scanning calorimetry melting curves 61
for the high molecular weight range of poly(ethylene oxide).
Figure 1 7 Photomicrographs of poly (ethylene oxide) samples 62cooled at a rate of 3 degrees per minute with the use
of crossed polarizers.
Figure 18. Experimental differential scanning calorimetry crystallization 64curves for PEG8 annealed for 20, 60, and 90 minutes.
Figure 19. Photomicrographs of PEG8 using crossed polarizers 65
to show the effect of annealing time.
Figure 20. Photomicrographs of PEG1 5 using crossed polarizers 67
to show the effect of annealing time.
Figure 21 . Experimental differential scanning calorimetry crystallization 68
curves for PEG1 5 annealed for 5, 30, and 5 minutes.
Figure 22. Effect of the concentration of nucleation sites, N, on the 70
degree of crystallinity, Xc.
Figure 23. Effect of the reptation motion on the degree of supercooling, 71
<del T>, and on the degree of crystallinity, Xc.
Figure 24. Effect of reptation motion on the width-at-half-height, co, 73
and on the degree of crystallinity, Xc.
Figure 25. Correlation between the width-at-half-height, co, and the degree 74
of supercooling, <del T>, while varyingU*
at one degree-per-minute.
Figure 26. Correlation between the width-at-half-height, co, and the degree 76
of supercooling, <del T>, while varyingU*
at twenty degrees-
per-minute.
Figure 27. Correlation between the width-at-half-height, co, and the degree 77
of supercooling, <del T>, while varying Kg.
Figure 28. Comparing the DSC data to the mathematical model 79
for the 4600 g/mol sample.
Figure 29. Comparing the DSC data to the mathematical model which 80
does not incorporate heat transfer for the 2000 g/mol sample.
Figure 30. Comparing the DSC data to the mathematical model which 82
incorporates heat transfer for the 2000 g/mol sample.
Figure 31 . The contributions of the spontaneous and sporadic nucleations 83
into the mathematical model crystallization curve.
Figure 32. Comparing the DSC data to the mathematical model which 84
incorporates heat transfer and spontaneous and sporadic
nucleations for the 1500 g/mol sample.
Ul
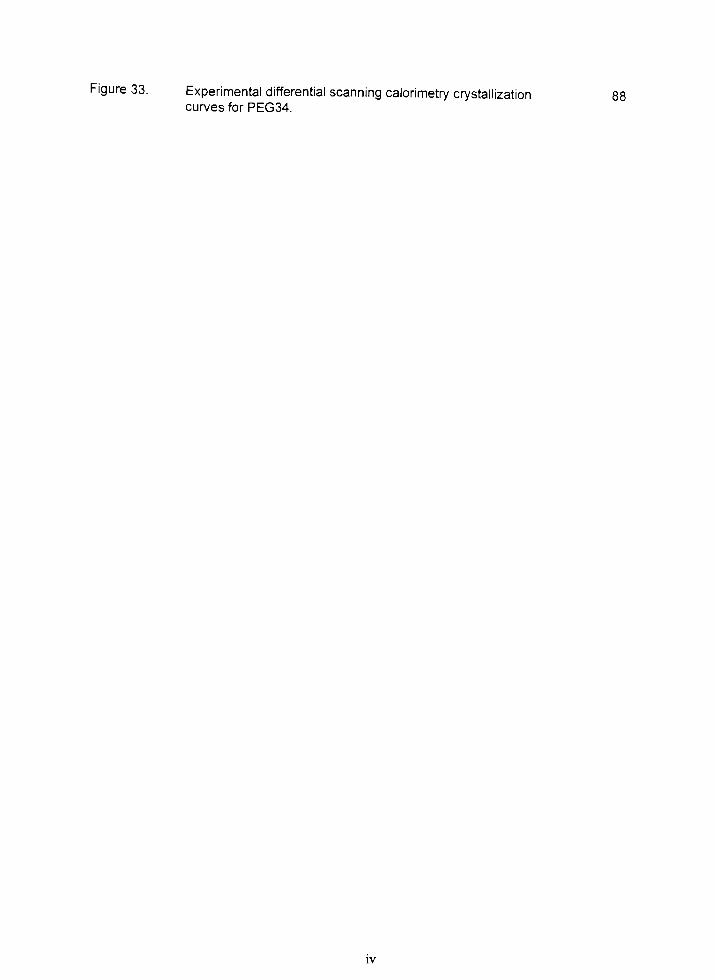
Figure 33. Experimental differential scanning calorimetry crystallization 88curves for PEG34.
IV

List of Tables:
Number Title
Page
Number
Table 1. Parameters to be Used in Avrami Equation for
Spherulites
Table 2. Sample Characteristics of 1 1 MolecularWeight
Samples of Poly(Ethylene Oxide)
Table 3. Annealing of the A-PEG15 and the A-PEG8 Samples
Table 4. Annealing Temperatures and Times
Table 5. The Effect of Cooling Rate and MolecularWeight Usingthe Polarizing Light Microscope
25
30
32
34
36
Table 6. Optimization of Modeling Parameters 86

ACKNOWLEDGMENTS:
I would like to thank my advisor, Dr. Andreas Langner, for all of his help
and long hours to get me through this program and this thesis. I also would like
to thank my graduate committee, Dr. Thomas Gennett, Dr. Surendra Gupta, and
Dr. Wendy Hallows, for all of their help and support. I would like to extend my
thanks to Trevor Brown at Eastman Kodak Company for the GPC results.
I would like to thank my parents and my family for all their love and
support. Many thanks go to my parents for putting me through my first four years
of college. I am also grateful to Jeannine, Jean Marie, my sisters, "Marcy and
Dad"
for keeping me sane while completing this program and also keeping me in
contact with the real world. Thanks to Marcy and Dad for all the trips to Abbott's
and the dinners together.
VI

1.0 Introduction:
During the past 25 years, the crystallization kinetics of low- and
intermediate- molecular weight polyethylene oxide), or polyethylene glycol),
have been extensively studied. The main focus of this work has been the
growth rate of the crystals and the different regimes in which crystal growth
can occur. These topics are of concern in this study. In particular, an
understanding of nucleation rate and the type of nucleation that occurs, the
reptation rate, and the effect of cooling rate and molecular weight on the
degree of supercooling, and the width of the crystallization curves obtained
by differential scanning calorimetry (DSC) are sought.
The nucleation rate and the type of nucleation are important because
both of these parameters affect the melting temperature of the formed
crystal, the width of the crystallization curve, and the crystallization
temperature of the sample. The reptation rate is important because it
describes how fast the polymer adds to the existing growth front. Depending
on the rate of reptation motion, the crystallization temperature will vary along
with the morphology. Cooling rate and molecular weight affect the
crystallization peak positioning, or the crystallization temperature, and the
morphology of thecrystals. The morphology is important in determining what
type of crystals would result if the sample was exposed to a given set of
parameters. All of these parameters have an effect on the peak positioning
of the crystallization curves, the crystallization temperature, and the
morphology.
There are three steps involved in the crystallization of a polymer from
the melt. First, a nucleus of critical sizemust be formed. Second, nucleation

of a growth front on the surface of the nucleus must occur. The third step is
the propagation of the growth front, leading to bulk crystal growth. Each of
these steps will be explained in detail in the following sections of the
introduction.
There are three main goals of this project, to determine the effect of
molecular weight on 1) the morphology produced at different cooling rates
during crystallization; this will be measured using polarizing light microscopy
and DSC, 2) nucleation, measured by varying annealing time, and 3) kinetic
parameters used in the mathematical model. Ultimately, the main goal is to
be able to model a DSC melting curve and predict the sample's true
morphology as seen with the polarizing light microscope. This project will
focus on modeling crystallization exotherms, but will not include the more
difficult problem of modeling the resulting melting endotherms.
1.1 Nucleation of a Crystal:
One of the most important parameters that governs crystal growth is
the nucleation of the crystals. Crystal nucleation can occur at two levels.
First, the three-dimensional crystal must be nucleated by the formation of a
nucleus of critical size. Second, a growth front must be nucleated on the
lateral faces of an already existing crystal; this is a two-dimensional
phenomenon.
The nucleation of polymer crystals can be categorized into
spontaneous and sporadic nucleation. For spontaneous nucleation, it is
assumed that the nuclei of critical size already exist. Crystallization occurs at
once for all of the nuclei; all crystal growth fronts start at the same time. In

sporadic nucleation the critical nuclei must be created before growth fronts
can be established. Since sporadic nucleation requires the completion of this
first step, it generally requires more time to grow crystals by sporadic
nucleation than by spontaneous nucleation.
Spontaneous nucleation occurs when the number of residual nuclei, N,
give rise to crystal growth simultaneously at time, t = 0. Residual nuclei are
"tiny regions of a high degree of order that may persist in a melt for a long
time and will act as predetermined nuclei for recrystallization uponcooling".2
The number and size of residual nuclei left in the melt depends on three
things; the temperature at which the polymer is held in the melt, or the
annealing temperature; the time at which the melt is held at that temperature,
or the annealing time; and third, the temperature of the previous
crystallization.2
When the sample is heated and held at the annealing temperature the
residual nuclei are"cooked"
out of the sample. The tiny regions with a high
degree of order become disordered, leading to a reduction in residual nuclei.
The longer the sample is annealed or the higher the annealing temperature,
the greater the loss of residual nuclei.
When a sample has been annealed for an extended period of time,
then the number of nuclei decreases. Decreasing the number of nuclei
affects the temperature at which the sample will crystallize. For example,
consider a sample which has 10,000 residual nuclei before it has been
annealed. After annealing, this same sample only has 100 residual nuclei.
When the 10,000-nuclei sample is cooled, 10,000 crystals will be growing
simultaneously. Whereas, in the 100-nuclei sample, there will only be 100

crystals growing. The 10,000-nuclei sample will crystallize in a shorter time
and at a higher temperature than the 100-nuclei sample because a chain will
attach to one of the 10,000 crystals more rapidly than it will find one of the
100 crystals. The chains will not have far to diffuse in order to find a growth
front. Since the chains will attach to the front quicker for the 10,000-nuclei
sample, the temperature at which the sample crystallizes will be higher. This
results from the proportionality of the temperature to the time at a constant
cooling rate.
The above example is concerned mainly with residual nuclei and
spontaneous nucleation. Sporadic nucleation occurs when residual nuclei
are few. Critical nuclei form at a rate, denoted by K. This rate is highly
dependent on the crystallization temperature. If the crystallization
temperature is much lower than the melting temperature, or has a high
degree of supercooling, then many critical nuclei will result. If the
crystallization temperature is not far below the melt temperature, or has a low
degree of supercooling, then the number of critical nuclei will be low. One
may control the morphology of the crystallizing sample by making the system
have a high or low degree of supercooling. The degree of supercooling, AT,
is defined as the melting temperature minus the crystallization temperature,
Tm - Tc, thus the lower the crystallization temperature, the higher the degree
of supercooling.
12 Growth Front Creation and Crystal Growth:
Once the critical nuclei have been formed a polymer chain attaches
itself to the nuclei to create a "growth front". The growth front is the place on
the surface of the nuclei or on the crystal at which the polymer chains are
attaching themselves, i.e. where the crystal is growing. The polymer chains
must align themselves with the growth front and then attach to it. When the
chains continually add to the growth front, plates of polymer are formed,
known as lamellae. As can be seen in Figure 13, the lamellae grow
perpendicular to the polymer chains. If the crystal is growing upward, at a
rate G, away from the nucleus, then the polymer chains are "reeledin"
to the
growth front in a back and forth manner to produce the thickness of the
crystal. This "reelingin"
is known as reptation and the rate at which the
polymer is reeled in is known as the reptation rate.
Once many lamellae are formed, they link together to form fibrils.
Lamellae within a fibril interconnected by chains that are anchored in more
than one lamellae. When the fibrils align with each other and start to link
together, crystal aggregates form and take on a characteristic shape.
Depending on the shape and microstructure of the crystal aggregate, it may
be called a hedrite, axialite, or spherulite. Axialites and hedrites are
precursors to full spherulitic development,4 although,"axialite"
is the preferred
term over"hedrite"
to describe these precursor crystal structures.
Axialites result when the lamellae grow to be extended non-
interconnected structures.4 When the lamellae are not joined, an open disk
like structure results, much like the layered appearance of a pastry. This
structure is called an axialite. Interconnections, or bridging between lamellae
occurs when a chain is shared with more than one lamellae. Axialites
generally result if there is a large number of nuclei and a small polymer melt
volume.4 With little volume and many nuclei, the crystals will not have time to

Figure 1 . Polymer chains as they align with the growth front to form lamellae and crystals.
Note that the lamellae grow perpendicular to the growth front. G is the linear growth rate, a0is the width of the stems, b0 is the thickness of a surface layer, L is the length of the
substrate,Ig*
is the width of the lamellae in the chain direction, g is the substrate completion
rate, r is the "reelingin"
rate, and ns is the number of stems per surface layer.

become three dimensional, thus producing an axialite. The layers of an
axialite are separated by amorphous material. This gives a coarse, grainy
appearance to the axialite.
If the lamellae interconnect between different growth fronts, then the
crystal structure will become that of a three-dimensional spherulite. Since the
regions between lamellae in spherulites are small, this structure looks smooth
under the microscope. If there is a non-smooth surface on the crystal, or
ordered and disordered regions in the crystal structure are apparent, then the
crystal is not purely crystalline and contains amorphous material. It is
therefore possible that a spherulite is not made up of purely crystalline
material. A spherulite may interconnect between two growth fronts, but trap
impurities and amorphous material between the fronts. Thus, if there are
many impurities or there is little interconnections between growth fronts, the
spherulites will not appear smooth on an optical micrograph. And, if there are
few impurities in a sample and a large amount of interconnections between
growth fronts, then the opposite is true.
1 .3 Techniques for Characterization of Polymers:
Thermal analysis, microscopy, and chromatography are three of the
many methods used for the characterization of polymers. There are two
specific techniques in thermal analysis that will be used in this study,
thermogravimetric analysis and differential scanning calorimetry.
Thermogravimetic analysis/ differential thermal analysis, TG/DTA, is a
technique that allows one to find the melting temperature and the
decomposition temperature of a sample while the differential scanning
calorimeter, DSC, determines the transition temperatures (i.e. melting,
crystallization, and glass) by measuring a signal proportional to the heat
capacity of a sample. Both techniques provide valuable information for
characterizing polymers.
Light microscopy and electron microscopy are also used for
characterization. Microscopy is used to determine the morphology of a
sample. The morphology is a description of the level of order within a
sample. Light microscopy is used to determine the bulk order on a 10-100um
length scale while electron microscopy is used to determine the surface or
internal microstructure of a sample on a 1 urn and smaller length scale.
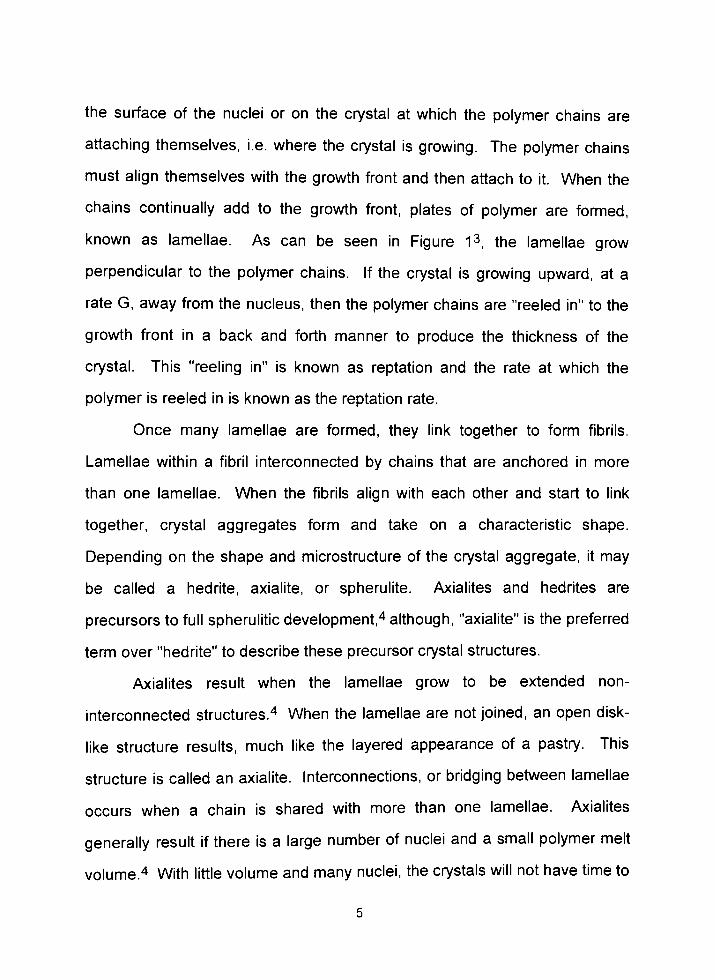
Gel permeation chromatography, GPC, is used to determine the
molecular weight of samples. GPC separates the sample into different
molecular size ranges. It is run with an organic mobile phase. GPC can
determine the number average, the weight average and the z-average
molecular weights as well as the polydispersity ratio. The number average
molecular weight is defined by the followingequation:5
Mn =
2jNiMj (1)
2,Ni
where Nj is the number of molecules havingmolecular weight M,. The weight
average molecular weight is5:
Mw = SimiMi= Z; NjMj2 (2)
Sj mj Zj MjNj

where nrij is the mass of material having the molecular weight of M,, where m
=
Nj Mj. The z average molecular weight is defined by the following
equation5:
Mz =
Zj NjMj3
(3)
Ij NjMj2
A polymer sample's molecular weight distribution is characterized by what is
known as a polydispersity ratio. The polydispersity ratio is a measure of the
width of distribution of the molecular weight for that sample. In order to
determine the polydispersity ratio of a system, the weight average molecular
weight is divided by the number average molecular weight, Mw/Mn. If all
molecules in a sample had the same molecular weight, then Mw/Mn would
equal one. The more this ratio deviates from unity, the more broad the
molecular weight distribution is for the sample.
1 .4 Viewing Crystals with the Polarizing Light Microscope:
When spherulites are viewed under a polarizing light microscope, or
with the use of crossed polarizers, then the image of a spherulite may appear
to be a Maltese cross, Figure 2. A spherulite is birefringent, meaning that
one crystal will show two refractive indices. One of the indices is in the radial
direction, or in the direction of the growth of the crystal outward; while the
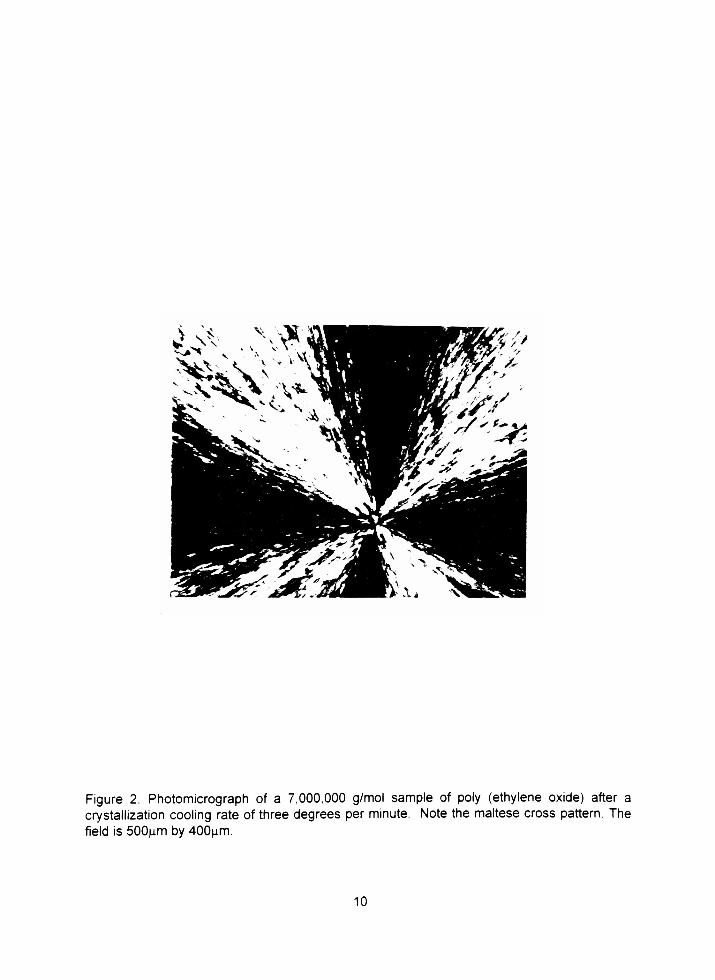
Figure 2. Photomicrograph of a 7,000,000 g/mol sample of poly (ethylene oxide) after a
crystallization cooling rate of three degrees per minute. Note the maltese cross pattern. The
field is 500|am by 400nm.
10

other index is in the tangential direction, perpendicular to the radial direction,
or the direction in which the polymer chains are adding to the growth front.6
When a polarizer is used, regions of the sample are parallel or
perpendicular to the optical axes. If the regions are parallel to the axes then
that part of the sample will transmit light to the analyzer. If the regions of the
crystal are perpendicular to the axes, then the sample will not transmit light to
the analyzer.5 The analyzer is usually a microscope and/or a camera.
1.5 Interpreting DSC Crystallization Curves:
Differential Scanning Calorimetry is a thermal analysis technique that
enables the accurate measurement of transition temperatures and heat
capacities. The DSC signal is proportional to the heat capacity of the sample.
In polymers, there are three phase transitions that are typically measured by
the DSC: 1) the glass transition, 2) the crystallization transition, and 3) the
melt transition.
The glass transition temperature, Tg, is the point at which an
amorphous polymer solidifies in the mechanical sense. Below the glass
transition temperature, the amorphous polymer does not have enough
thermal energy to allow for chain motion.5 The glass transition occurs at
lower temperatures than the melt transition. The glass transition temperature
for polyethylene oxide) is 206K.2
The crystallization transition occurs when the polymer melt solidifies to
form crystals. When the polymer melt cools to crystallize, there are different
types of crystals that are formed. There is not always uniformity throughout
the whole sample. The sample may consist of large and small crystals as
11

well as different types of crystals. A crystallization transition appears on the
DSC as an exothermic peak. When a sample crystallizes from the melt, it
releases energy. This change in energy in the sample is measured directly in
the DSC. Since there is a release of energy, an exothermic peak results
during crystallization.
The melt transition occurs when the polymer in crystalline form melts
and becomes a liquid, also known as a polymer melt. The crystals do not
melt all at the same time. There are different quality crystals that are formed
in the crystallization process and therefore those different types of crystals
melt at different temperatures. The most perfect crystals that are formed will
melt at the highest temperature, while the more disordered crystals will melt
at lower temperatures. When a crystal melts, it consumes energy, therefore
an endothermic peak is observed on the DSC.
The melting temperature of a sample is the temperature at which the
endothermic peak returns to the baseline. If the endothermic peak has tailing
present, the melting temperature is to be found by using the intersection of
the tangent lines of the baseline and of the high temperature slope of the
endothermic peak. The melting temperature of the most perfect crystals
needs to be found, therefore the higher temperature side of the melting peak
is used.
The melt transition and the crystallization transition are more important
for this project than the glass transition. The concentration of the work will be
on the crystallization exotherms and the modeling of these curves. The
melting endotherms will betouched upon for qualitative information.
12

The melt temperature may be calculated for each molecular weight
sample of polyethylene oxide) by using the following equation.1
Tm(MW) =Tm
[ nAhf- oe(1 + aTo)]/ [(nAhf + RTmln n -
aaeTm)] (4)
where the heat of fusion, based on the monomer units, Ahf= 8.67 kJ/mol, the
melt temperature for the infinite molecular weight crystalTm
= 342.2 K, the
reference temperature To = 334.4 K, a = 1.29 x 10"2 K"1, n is the number of
monomer units, and ae= 6.57 kJ/mol. A difficulty in using equation (4) arises
when the melt temperature of a molecular weight distribution is sought.
Should n be calculated using the number average molecular weight, the
weight average molecular weight or the z average molecular weight?
1 .6 Parameters affecting Morphology:
When a sample transmits light to the analyzer, different morphologies
appear depending on the conditions used when crystallizing the sample.
One important parameter to control when crystallizing a sample is the cooling
rate. The crystallization experiment is started above the melt temperature
and a cooling rate is chosen. The faster the cooling rate, the lower the
temperature at which the polymer melt will crystallize. The opposite is true for
slower cooling rates. The reason for this is that if the cooling rate is slower
then the polymer has a longer time to crystallize at a particular temperature.
The longer the polymer melt can sit at a given temperature, the more likely
the chains are to align and attach to the growth front.
13

Another important parameter controlling the morphology is whether the
sample is of a critical molecular weight. The critical molecular weight is the
molecular weight of a polymer at which the chains are able to entangle.7 If
the chains are smaller than this value, then they are not able to entangle with
each other and extended chain crystals result. If the sample is above the
critical molecular weight, folded chain crystals result. Entanglements result
when two chains intertwine with each other. When the chains intertwine,
lamellae are bridged and make a smoother structure. If the sample did not
extensively bridge or interconnect, then the sample would have a coarse and
textured appearance( i.e. light and dark regions are observed on the PLM
micrographs). When the molecular weight of samples is varied from below to
above the critical molecular weight, then a substantial difference in
morphology should be noticed. If all the chains are able to entangle and
become interconnected then the resulting morphology should be that of very
smooth-appearing spherulites. The critical molecular weight for PEO is 3400
g/mol.8
1.7 Literature Background:
In the 1940's, Avrami gave the general expression for the crystalline
content of polymers crystallized from the melt as:7
Xc(t) = 1 -
exp (-ptn) (5)
where t is time, and p and n are parameters that depend on the nucleation
type and growth rate of the crystal.
14

1.7.1 Hoffman - Growth Rates:
In the early 1980's, Hoffman gave a general expression for linear
crystal growth rates in three regimes, I3, II3, III9. Hoffman's expression is as
follows:
Gj = (Cj/n) exp(-QD*/RTc) exp[-Kg(i)/(TcAT)] (6)
where i designates the regime in which the crystal is growing, Cj/n is a pre-
exponential factor for regime i which varies with molecular weight, n is the
number of -CH2- units in the chain, Tc is the crystallization temperature, Kg(i)
represents the surface free energy of the polymer, andQD*
is the activation
energy for reptation motion. The factor (1/n) exp(-QD*/RTc) represents the
rate of reptation in the melt.
In regime one and three, Kg(l) = Kg(lll) =
4b0aaeTm/(Ahf)kb and in
regime two Kg(ll) = 2b0aaeTm/(Ahf)kb whereTm
is the equilibrium melting
temperature for the infinite molecular weight crystal, a is a lateral surface free
energy, ae is a fold surface free energy, b0 is the lattice parameter in the
growth direction (b0= 0.462 nm), Ahf is the heat of fusion, per monomer unit,
and kb is Boltzmann's constant. Note that the Kg values for regimes one and
three are equal and the Kg values for regimes one and three are twice that of
regime two.
The exponential term containing the activation energy for reptation
motion, QD*, can be replaced by (-U*/R(Tc-T00)) whereU*
gives an improved
value for the activation energy for reptation motion and T^ is equal to Tg-30K.
15
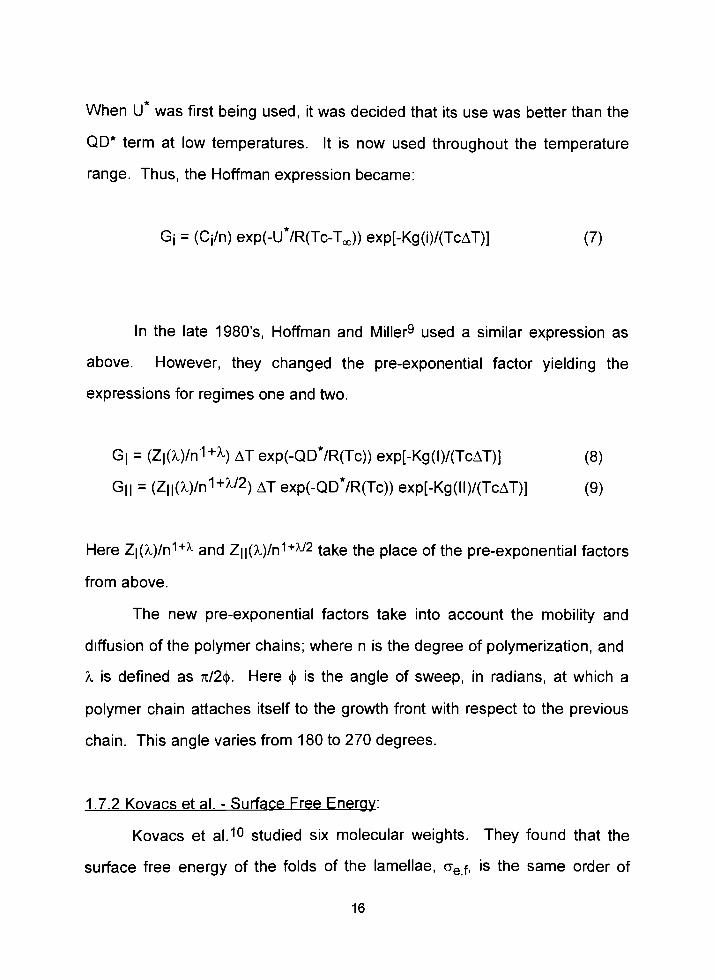
WhenU*
was first being used, it was decided that its use was better than the
QD*
term at low temperatures. It is now used throughout the temperature
range. Thus, the Hoffman expression became:
Gj = (Cj/n) exp(-U*/R(Tc-T00)) exp[-Kg(i)/(TcAT)] (7)
In the late 1980's, Hoffman and Miller9 used a similar expression as
above. However, they changed the pre-exponential factor yielding the
expressions for regimes one and two.
G| = (Z|(^)/n1+^) AT exp(-QD*/R(Tc)) exp[-Kg(l)/(TcAT)] (8)
G|| = (Z||(A.)/n1+^/2) AT exp(-QD*/R(Tc)) exp[-Kg(ll)/(TcAT)] (9)
Here Z\(X)/n^+x and Z||(A.)/n1+W2 take the place of the pre-exponential factors
from above.
The new pre-exponential factors take into account the mobility and
diffusion of the polymer chains; where n is the degree of polymerization, and
X is defined as n/2<j). Here <t> is the angle of sweep, in radians, at which a
polymer chain attaches itself to the growth front with respect to the previous
chain. This angle varies from 180 to 270 degrees.
1.7.2 Kovacs et al. - Surface Free Energy:
Kovacs et al.10 studied six molecular weights. They found that the
surface free energy of the folds of the lamellae, ae f, is the same order of
16

magnitude as the surface free energy of the chain ends, ce e. They found
that the surface energy of the folds = 22.4 erg-cnr2 The average surface
free energy, ae, of crystals involving both chain ends and folds is
ae=
CTe,e+ n(aef) (10)
1 +n
where n is the number of chain folds in the lamellae. The average surface
energy was found not to depend on chain length. Kovacs et al. also found
that aae values vary from 393 - 423 erg2cm*4 for molecular weights ranging
from 2000 to 10 000 g/mol. This difference in aae values is only ten percent.
In order to model differential scanning calorimetry curves, it is realized that
there is a difference in aae values. However, this change of ten percent is
balanced by the change which occurs in the pre-exponential factor. It will be
assumed that the changes to the pre-exponential factor and to the Kg term
will counterbalance each other and will not be taken into consideration in the
proposed model.
1.7.3 Cheng - Growth Rate Expression:
Cheng et al. worked with molecular weight fractions of 23,000 to
105,000 g/mol. They used the same type of equation for the growth rate of
polymer crystals from the melt as did Hoffman and Miller. Cheng et al.
introduced the followingexpression:1
Gc = Go AT exp[-U*/R(Tc-T00)]exp[-Kg/Tc(AT)f] (1 1 )
17
where Kg(l,lll) =
4b0cyrjeTm<7(Ahf)kb and Kg(ll) = 2b0aaeTm/(Ahf)kb, Go is
defined as Z/n1+\ f = 2Tc/(Tm+Tc), Tc is the crystallization temperature,Tm
is the equilibrium melting temperature of the infinite molecular weight crystal,
a is the lateral surface free energy, ae is the fold surface free energy, b0 is
the lattice parameter in the growth direction, and kb is the Boltzmann
constant. For poly (ethylene oxide), the value ofU*
is 29.3 kJ/mol and the
glass transition temperature, Tg, equals 206 K, T^ is defined as Tg -30 K.
From Cheng et al., Kg values were reported for each of the regimes for
each of the molecular weights. The Kg values ranged from 11000 to 22700
K2. A Kg value of 21,800 K2 will be used for the molecular weights in our
proposed model. It is known that there is a difference in the Kg values from
one molecular weight to the next and even from one regime to another.
However, it will again be assumed that this value remains constant, as does
the pre-exponential factor, throughout the modeling to ensure consistency.
One goal of this project is to show the effects of molecular weight and
cooling rate on crystallization and melting thermograms; where the melting
thermograms represent the morphology of the crystals that were formed.
The second goal of this project is to understand the effect of annealing
time on a sample and the differences in morphology, as observed by
polarizing light microscopy, that appear as a result of this variation.
The third goal of this thesis is to present a possible model to analyze
the thermal analysis data. This model must be able to represent
crystallization curves as seen on the differential scanning calorimeter. The
effect of heat transfer will also be considered in formulating the model.
18

2.0 Theory:
There are three stages of crystallization. First, a nucleus of critical size
must be formed. Second, nucleation of growth fronts on the surfaces of the
critical nucleus must occur. Third, bulk crystal growth occurs by propagation
of the growth front. Spontaneous nucleation results when residual nuclei
already have formed and only need to go through the second and third steps.
During sporadic nucleation the initial step of creating nuclei of critical size
must occur. During a constant cooling rate experiment, the DSC peak for
sporadic nucleation will always occur at a lower temperature than for
spontaneous nucleation. This is a consequence of the higher concentration
of crystal nuclei available for growth during spontaneous nucleation than
during sporadic nucleation.
2.1 Avrami type kinetics:
This section is intended to show the development of the mathematical
model using Avrami-type kinetics. Avrami developed an expression for the
crystalline fraction based on a Poisson distribution. First, Avrami gives a
general expression for the crystalline fraction, Xc, of a sample during
isothermal crystallization. That expression is asfollows7'
Xc= 1 -
exp(-p t") (12)
where p and n are parameters that rely on the nucleation type and growth
rate of the crystal. For spherulites, n ranges from a value of two to four.
19

To develop an expression for Xc for variable temperature
crystallization, one needs to understand the kinetics of crystal growth. In our
treatment, a polymer sample which is in the liquid phase, also known as a
polymer melt, is assumed to crystallize at a rate equal to:
=dIEJ= k[P|] (13)
dt
where [P|] is the concentration of the polymer melt in moles per liter of
uncrystallized chains and k is a rate constant. In other words, the polymer
crystallizes at the same rate as the polymer melt disappears. Therefore, the
polymer has to exist in one of two states; it either has to be in the melt or it
has to be in crystalline form. Therefore, the rate expression can be rewritten
as:
-d[P|J= dIPcl (14)
dt dt
where [Pc] is the concentration of the polymer in the crystalline form in moles
per liter.
If the overall polymer volume remains constant, then the following
expression is true:
dVc= kV, (15)
dt
where Vc and V| are the crystalline volume and liquid volume respectively.
The difference in concentration between the initial liquid polymer and the
crystallized polymer is simply the concentration of chains in the melt. The
change in crystalline volume of polymer over time is then expressed as
follows:
20

dVc = kV, = k(V|0 Vc) (16)dt
where Vc is the crystalline polymer volume, V| is the liquid polymer volume,
and the subscript"o"
represents the initial volume of polymer melt at t=0,
before crystallization begins.
If this whole expression is divided by the initial volume of the polymer
melt, then the crystalline volume fraction of the polymer is expressed by:
dXc = k(1-Xc) (17)dt
Note, that if Xc is viewed as a mole fraction and not a volume fraction, then
no constant volume assumption is required. This is an inhomogeneous
differential equation which can be solved by the generalform:12
Xce'kdt = Ike'kdt dt + C (18)
This equation then needs to be solved for Xc. Let u = Ikdt and du = kdt.
Then the expression becomes:
Xceu = jeudu + C (19)
Xc= 1 + C e-" (2)
Xc=1+Ce-'kdt (21)
The crystalline fraction, Xc, equals zero initially, t = 0. Thus, the above
expression becomes:
0 = Xc= 1 + C
therefore,
C =-1
21

Using, C =-1, equation (21) becomes:
Xc = 1 - e-'kdt (22)
This is the expression that is used for the crystalline fraction in the developed
mathematical model.11
The time-dependence of the crystalline fraction is also important as it
models the differential scanning calorimetry curves. For equation (22), let u =
jkdt and du = kdt. Equation (22) becomes:
Xc=1-e-u (23)
dXc = e-u du
dt
(24)
dXc = e-^dt k
dt
(25)
dXc= k e-'kdt (26)
dt
The expression given by equation (26) will be used to model the differential
scanning calorimeter curves.11
Hence, equations (22) and (26) will be used as the working
mathematical model. Here dXc/dt is proportional to the differential scanning
calorimeter signal, k= 4/37iGc3Kt3 for sporadic nucleation, k = 47iN Gc3t2 for
spontaneous (residual) nucleation, N is the number of nuclei per unit volume,
Gc is the linear crystal growth rate, and K is the rate of nucleation per unit
volume. Thus, for spontaneous nucleation, equation (22) becomes
Xc=1 exp (-J4ttN Gc3t2dt) (27)
Solving the integral,
Xc = 1 -
exp (-4/37tN Gc3t3) (28)
22

Equation (22) for sporadic nucleation becomes
Xc= 1 -
exp ( -Ti/SKG^t4) (29)
where K is the rate of nucleation for sporadic nucleation which is defined by
the following
K = A exp (-Gn*) (30)
where
Gn*= 32Naa2aeTm4
(31)
RTc(AHm)2Tc2(AT)2
where Na is Avogadro's number, a is the lateral surface free energy, ae is the
fold surface free energy, Tm is the melting temperature, R is the gas
constant, Tc is the crystallization temperature, AHm is the heat of fusion, and
AT is the degree of supercooling.
When heat transfer is added to the model, the above derivation needs
to be amended. Equation (17) gives an expression of the crystalline volume
fraction where k is actually temperature dependent. Thus equation (17) with
heat transfer becomes.
dXc= (k0 + dkAt)(1-Xc) (32)
dt dt
23
where k0 is the rate constant of the reaction at time t. This is an
inhomogeneous differential equation which is solved for Xc at time t + At.
Xc(t+At) =1 (1 - Xc(t)) exp ( -k0At- dk At2) (33)dt 2
For the variable temperature case, the rate constant, k, changes greatly.
To solve the non-linear finite difference problem, substitute dk/dt =
dk/dT'dT/dt, where
dk = k0(2 +_3_ d2Gc dT) (34)
dT t GcdT2 dt
and
dl=_J_ dHxt-l(T-Tf) (35)
dt mCn dt t
where Gc is the crystal growth rate, Hxt is the heat of crystallization, mCp is
the heat capacity, t is the time constant for heat transfer, Tf is the furnace
temperature, T -
Tf is the temperature lag between the sample and the
furnace temperature and
1 dHxt = ridXc (36)
mCp dt dt
In the heat transfer model, equation (30) will be used to model the
DSC crystallizationcurves.11
As has been previously mentioned, Avrami gavean expression for the
crystalline fraction of a polymer, equation (12). The Avrami parameters for
24

spherulites grown by spontaneous and sporadic nucleation are given by
Table 1 .
Table 1: Parameters to be used for spherulites.
Residual Nucleation Sporadic Nucjeatjon
n=3 n=4
P = 4ttGc3N p=jGc3k
3 3
where Gc is the linear crystal growth rate, N is the number of nuclei per unit
volume, and K is the rate of nucleation per unit volume.1
For residual nucleation,
Xc = 1 -
exp(-4/37iGc3Nt3) (37)
For sporadic nucleation,
Xc = 1 -
exp(-7i/3Gc3Kt4) (38)
Comparing Avrami, as just shown, to our kinetic model demonstrates
that they are the same. Since the resulting equations are the same for the
model and for the Avrami type kinetics, there is confidence in the results
given by the model.
2.2 Hoffman and Cheng growth rate expressions:
In the early 1980's, Hoffman derived an expression for the linear
crystal growth rate for polymers, in particular polyethylene. This expression
is9:
25

Gc = (Cj/n) exp (-QD*/RTC) exp ( -Kg/TCAT ) (39)
where Gc is the crystal growth rate, Cj/n is a pre-exponential factor, n is the
degree of polymerization,QD*
is the activation energy for reptation motion,
Kg is the surface energy term= 4b0arjeTm/Ahfkb,
Tmis the equilibrium melt
temperature for the infinite molecular weight crystal, Ahf is the heat of fusion
per mole of monomer units, kb is the Boltzmann constant, R is the gas
constant, Tc is the crystallization temperature, AT is the degree of
supercooling=Tm
Tc, a is the lateral surface free energy and ae is the fold
surface free energy, b0= 0.462 nm, is the lattice parameter in the crystal
growth direction.
The above version of the crystal growth rate has gone through various
revisions until in 1990, Cheng et al. introduced the following expression1:
Gc = G0 (AT) exp(- U*/R(TC- T*,)) exp ( -Kg/TcATf) (40)
where Gc is the crystal growth rate, G0 is the pre-exponential factor = Z/n1+l
which takes into account mobility, diffusion and the degree of polymerization.
Here Z is a constant, X =7i/2<j), where <(> is the angle of sweep, in radians, at
which a chain attaches itself to the growth front with respect to the previous
chain. This angle varies between 180 and 270 degrees.U*
is the activation
energy for reptation motion which replaces theQD*
term, an improvement at
low temperatures. It is used throughout the temperature range, T^ Tg-30K,
(Tg= 206 K is the glass transition temperature) and f = 2 Tc/(Tm + Tc)
26
For both the Hoffman and Cheng expressions, the exponential factor
that contains the activation energy for reptation motion,QD*
or U*, is
representative of how long it takes to get a chain to the growth front once one
chain is already attached. This factor also measures the percentage of
molecules that have sufficient energy to overcome the reptation barrier.U*
is
the energy required to bridge the barrier and R (T^T^,) is the thermal energy
available to do this. As the temperature is increased, it becomes easier to
overcome the barrier and there are more chain segments that can overcome
this barrier. IfU*
is increased, then the opposite is true.
The factor containing Kg represents the nucleation rate for creating a
sustainable growth front. The parameter Kg represents a surface energy
barrier which must be overcome to create a growth front. The larger the fold
surface free energy, ae, the larger the Kg term. The surface Gibb's free
energy is controlled by the temperature and is dependent of the critical nuclei
size. The effect of surface energy diminishes as the degree of supercooling
is increased. As the degree of supercooling increases, the crystallization
temperature decreases, and both the surface Gibb's free energy and critical
nuclei size become smaller.
The sharpness or broadness of the melting endotherms depends on
the morphology of the crystal structures that were formed during the previous
cooling step. There is a range of bond strengths that hold the crystal
together. The smaller this range, the sharper the endotherm; the larger this
range, the broader the endotherm. The low molecular weight crystals have a
narrow range of bond strengths and thus should exhibit sharp endotherms.
27

The larger the surface to volume ratio, the smaller the crystals and the
broader the endotherms will be. If the cooling rate during crystallization is
fast, then the broad endotherm result. If the crystal has a large volume to
surface ratio, large crystal, then the endotherm will be sharp. The endotherm
will be sharp if there is a slow cooling rate during crystallization.
28

3.0 Experimental:
The focus of the experimental section is on three major topics;
morphology, nucleation, and the model. Each of the experiments described
will pertain to one or more of these three areas. Eleven samples of poly
(ethylene oxide) were studied. Seven samples were obtained from Aldrich
and the other four from Polysciences, Inc..
All eleven samples were characterized at Eastman Kodak Company
using gel permeation chromatography, GPC. GPC standards fell in the range
from a low molecular weight of 645 daltons to a high molecular weight of
1,390,000 daltons. Two samples were submitted that had a higher molecular
weight than the highest standard and therefore could not be characterized.
Also, the 900,000 g/mol sample that was submitted for testing produced a
very rough GPC curve, therefore the results received from this sample were
assumed not to be quantitative.
Table 2 is a representation of the nominal molecular weights, the
physical characteristics of the samples, the sample designations, the GPC
average <Mw>, and the GPC average polydispersity ratio (<Mw/Mn>). The
nominal molecular weight is the molecular weight that the sample had on its
label from the manufacturer. The physical characteristics are the appearance
of the samples as seen when taken from their container. The"A"
in the
sample designation column means that the sample was purchased from
Aldrich Chemical Company and a"P"
means the sample was purchased from
Polysciences Inc. The second half of the designation is how the sample will
be referred to throughout this thesis. The GPC average <Mw> column
represents the average of two GPC trials for the weight average molecular
29

Table 2. Sample Characteristics of 1 1 molecular weight samples of PEO.
Nominal Molecular Physical
Weight (g/mon Description
Sample
Designation
GPC <Mw>
(g/mol")
GPC
<Mw/Mn>
1500 Hard Wax A-PEG15 1505 1.070
2000 Small Sheets A-PEG2 2155 1.095
3400 Fine Powder A-PEG34 3535 1.080
4600 Long Needles A-PEG46 5585 1.050
8000 Needles A-PEG8 9975 1.055
18 500 Sheets P-PEG185 64 000 4.600^
100 000 Coarse Powder A- PEG 100 133 000 4.405^
400 000 Coarse Powder A-PEG400 758 500 3.9609
900 000 Coarse Powder P-PEG900 NA NA
2 000 000 Coarse Powder P-PEG2000 NA NA
7 000 000 Medium Powder P-PEG7 NA NA
C,, two peaks in spectrum; ,, one very broad peak; S, non-smooth spectrum Mw/Mn = 3.26 and 4.66
weight. The GPC <Mw/Mn> column is the sample's average (from two GPC
trials) polydispersity ratio. The polydispersity ratio is the weight average
molecular weight divided by the number average molecular weight. This ratio
tells how broad the weight distribution is for a sample.
Thermogravimetric analysis, TGA, was performed on all samples using
a Seiko Instruments Inc. TG/DTA 220 Module. The mass range of the
samples was 4 milligrams to 12 milligrams. The samples were heated at a
rate of 30 degrees-per-minute with a stream of nitrogen gas flowing at a rate
of 200 milliliters-per-minute. When the temperature reached 500 degrees
30

Celsius, then the gas was switched from Nitrogen to air at 200 milliliters per
minute. From the TGA, the melting points and the decomposition
temperatures were found and used to determine the highest temperature at
which the differential scanning calorimeter, DSC, could be run. The
maximum temperature that the DSC could be run was established to be in
the range of 220 C to 350 C, varying with molecular weight. All DSC
experiments were run well under 200 C. The effect of decomposition on a
sample was assumed to not be an issue. A Seiko Instruments Inc. DSC
220C Module was used.
3.1 Morphology:
Two different molecular weight samples were studied to find the
effects of annealing time on the morphology of the polymer. The PEG15
sample and the PEG8 sample were studied using the DSC and the polarizing
light microscope. The DSC samples had previously been melted and
crystallized and were not in powder form. It was this pretreated sample that
was used in the annealing experiment.
A Metier FP-5 heating controller was used along with a Metier FP-52
hot stage. The hot stage was cooled with a nitrogen gas stream. The
nitrogen gas line ran from a tank to a copper coil that was immersed in a
Dewar filled with liquid nitrogen. From the copper coil, or the heat exchanger,
the line ran into the back of the hot stage.
The PEG15 and the PEG8 samples were annealed using both the
DSC and the PLM. For the DSC, the PEG15 sample was heated at ten
degrees per minute to a temperature of 96.9C and annealed at that
31

temperature for five minutes. The sample was cooled at five degrees-per-
minute to zero degrees Celsius and held at zero degrees for five minutes.
The sample was then reheated at a rate of 10 degrees-per-minute until the
temperature reached 96.9 C. The process was continued with successive
annealing times of 30 and 5 minutes. This same type of process was used
for the PEG8 sample except the annealing times, temperatures, and the
cooling rate differ, as per Table 3.
Table 3. Annealing of the A-PEG15 and the A-PEG8 samples
Sample Successive Annealing Heating Rate, Cool ng Rate,
Designation Technique Annealing time, Temperature, degrees/min degrees/min
min degrees C
A-PEG15 DSC 5, 30, 5 96.9 10 5
PLM 5, 10,30,25,5 96.9 NA 3
A-PEG8 DSC 20, 60, 90 150 10 10
PLM 5, 10,30,25 111.6 NA 3
The PLM samples were made by placing powder between two glass
slides. The powder was heated until it was melted and then the slides were
pressed together to ensure a thin film. Once the polymer was pressed thin,
the sample was annealed at the given temperature for five minutes. After five
minutes, the sample was cooled at three degrees per minute to
approximately 20 C. The sample was held for five minutes and then reheated
to the same annealing temperature. The annealing times varied according to
Table 3. The conditions of the rest of the cycle remained constant.
32

to the same annealing temperature. The annealing times varied according to
Table 3. The conditions of the rest of the cycle remained constant.
After using the differential scanning calorimeter for several samples, it
was decided that using the same sample for all trials did not give the
reproducibility that was sought. To increase the reproducibility, it was thought
that for each DSC trial that was to be run on any molecular weight, a new
sample must be made from powder. For the following experiments, new DSC
samples were made from the powder form for each trial unless otherwise
stated. The mass range for the DSC experiments was one to five milligrams.
Polarizing light microscopy was used to find the time in which it took a
sample to melt at its melting temperature plus 50 degrees. The PLM hot
stage was heated to Tm + 50 and each molecular weight sample was placed
between the two glass slides. The time it took for the sample to melt was
recorded and five minutes was added to each annealing time. This
information was then used for the annealing time in the DSC experiments as
seen in Table 4.
3.2 Nucleation:
The powder form for each of the samples was placed in a DSC pan.
An upside down coverwas placed on the top of the sample. Each sample
was heated to its annealing temperature at a rate of 20 degrees-per-minute,
annealed for the time given in Table 4, cooled to zero degrees Celsius at a
rate between one and 20 degrees-per-minute, and then reheated to the
annealing temperature at five degrees-per-minute. These samples were
33

studied for the effect of cooling rate and molecular weight on the morphology
and nucleation of the sample.
Table 4. Annealing Temperatures and Times
Sample Annealing Annealing
Designation Temperature. C Time, min
A-PEG15 96.9 5
A-PEG2 102.9 5
A-PEG34 109.4 5
A-PEG46 108.7 5
A-PEG8 111.6 5
P-PEG185 111.6 5
A-PEG100 113.4 5
A-PEG400 116.4 5
P-PEG900 122.090a
P-PEG2000 115.11505
1 P-PEG7 115.0180E
a, this sample melted before 90 minutes; 5, this sample meltedbetween 90 and 150
minutes; e, this sample melted between 120 and 180 minutes.
Complementary to the DSC cooling studies, similar experiments were
performed with the PLM. Table 5 shows the experiments that were run with
the PLM.
For each molecular weight, a sample was placed on the hot stage at
the annealingtemperature. The sample was held at that temperature for the
given time. Once the annealing had taken place, the sample was crystallized
at the given cooling rate. Upon completion of crystallization,
photomicrographs were taken.
34
As can be seen from Table 5, there are four samples that were used in
a one degree-per-minute study. These samples exhibited a double peak in
the differential scanning calorimetry curves so the samples were looked at
using the PLM for morphology differences. The samples were placed
between two glass slides, annealed at Tm + 50, the annealing temperature,
for five minutes, and cooled at a rate of one degree-per-minute. Upon
completion of crystal growth, photomicrographs were taken and the samples
were analyzed for morphology differences.
35

Table 5. The effect of cooling rate and molecular weight using the polarizing light microscope.
Sample Annealing Annealing Cooling Rate,
Designation Temperature. C Time, min degrees/min
A-PEG15 55 5 10
96.9 5 3
96.9 5 1
A-PEG2 102.9 5 3
A-PEG34 71.1 5 10
109.4 5 3
109.4 5 1
A-PEG46 108.7 5 3
108.7 5 1
A-PEG8 71.1 5 10
111.6 5 3
111.6 5 1
P-PEG185 71.5 5 10
111.6 5 3
A-PEG100 72.8 5 10
113.4 10 3
A-PEG400 75.0 5 10
116.4 10 3
P-PEG900 122.0 75 3
P-PEG2000 73.2 5 10
115.1 150 3
P-PEG7 71.0 5 10
115.0 180 3
36
4.0 Results and Discussion:
The molecular weight distributions of the polyethylene oxide) samples
of this study were measured by gel permeation chromatography at Eastman
Kodak Company. The lower molecular weight samples, PEG15 through
PEG8, showed a narrow distribution of molecular weight. This can be seen
by the sharpness of the gel permeation chromatogram as seen in Figure 3.
Figure 3 is for the PEG15 sample and is representative of all the samples
with molecular weights up to 8000 g/mol. For all of these lower molecular
weight samples, the polydispersity ratio, Mw/Mn, for the molecular weight
distribution, is close to one. This is depicted in Table 1. Again, this means
that the samples have a narrow distribution of molecular weight. If the
polydispersity ratio was equal to one, then the sample would be made up of
only one molecular weight.
The PEG185 sample is unique in that it showed a two peak, or
bimodal, distribution, Figure 4. Since there are two substantial peaks, the
value of Mw/Mn is much larger than one. In fact, the polydispersity ratio is
greater than four. The molecular weight distribution covers over four times
the range as that of lower molecular weight samples.
The PEG100 sample shows a very broad distribution of molecular
weight, Figure 5. This distribution is also representative of the 400,000 g/mol
sample. Again, note that the polydispersity ratio of this sample is above four.
The PEG900, PEG2000, and PEG7 samples possessed molecular
weights above the range of the standards used by Eastman Kodak Company.
Therefore, there are no results from the GPC experiments for these samples.
37

18rW
3
1mo Ol
Li_
o
o
CO
o
.o
OJ
C3 Q.
CD
LU CU
O
.o
CD
O
.o
inCD
O
im
IX
3E
O
.o
s5. 2 2 2
o
o
o
o
ro
o
o
OJ
o
o
o
.o
o
o
0+0Wx (l/M 6o|)M
Figure 3. Gel Permeation Chromatogram of polyethylene
oxide), 1500 g/mol sample. (Mn = 1410, Mw = 1510, Mz -
1610, Mw/Mn = 1.07)
38

<o
in
QJ
:>
-a:
C_3
ZD
O
oin
CO
CD
oLUQ.
-a:
ZSL Qi i
co
LU
I
CD
O
0+0 ix(l/M Bo|) M
Figure 4. eel PermeationChromatogram> of poly (ethylene
oxide), 18500 g/mol sample. (Mn - 13900, nw
= 356000, Mw/Mn = 4.65)
39

LO
QJ
ZD O
CD. Q.
CD
LU CC
3:
z
CO
o
1-0 1<X (|/M 6o|) M
Figure 5. Gel Permeation
oxide),100,000 g/mol sample
Mz = 389000, Mw/Mn = 4.37)
Chromatogram of poly(ethylene
(Mn = 30900, Mw = 135000,
40

These samples will therefore be discussed qualitatively rather than
quantitatively.
Since the polydispersity ratios for the molecular weights of 18,500
g/mol and over are well above one, the question arises, which molecular
weight average should be used, Mn, Mw, or Mz, for calculating the various
parameters, Tm, G0, AT? Depending on the molecular weight that is used,
some samples have a Tm that changes by three degrees and a G0 value that
changes by two orders of magnitude. Changing the Tm for a sample by three
degrees can change a sample's degree of supercooling, AT, thus changing
the assignment of the peak position.
4.1 Morphology with the Polarizing Light Microscope:
The polarizing light microscope was a useful tool in determining the
morphology of crystalline samples. One of the first experiments that was
completed was a 10 degree-per-minute cooling of the samples. As an aside,
at the time it was noted, and later raised some concern, that the microscope
did not keep up with a ten degree per minute cool even with the heat
exchanger present. The next cooling rate setting on the heating controller is
a three degree-per-minute cool. This cooling rate is readily controlled by the
heating controller and the hot stage. It was assumed that the photo
micrographs of the ten degree-per-minute samples were taken at a cooling
rate well above three degrees per minute, but the exact cooling rate is not
known. Therefore, this set experiments will be referred to as the ten-
degrees-per-minute experiment.
41

Photomicrographs for this experiment recorded using crossed
polarizers, are given on Figure 6 for four low molecular weight polymer
samples. Figure 6a represents the PEG 15 sample. Small crystals are
surrounded by amorphous material and are shown as small granules in the
photomicrograph. It is believed that this sample did not exhibit
interconnected lamellae; consequently no spherulites were observed. The
PEG15 sample has a molecular weight below the critical molecular weight of
polyethylene oxide), 3400 g/mol. Below the critical molecular weight, the
chains do not entangle. This is evident in the granular morphology as seen in
Figure 6a.
Figure 6b depicts the photomicrograph of the PEG34 sample; it
appears to have a feather-like texture. The critical molecular weight for
poly(ethylene oxide) is 3400 g/mol. Since this sample is at the critical
molecular weight, it was predicted to display a much different morphology
than the PEG15 sample. Since the lamellae start to interconnect at this
molecular weight, spherulites should begin to form. However, the feather-like
texture of this sample, can be interpreted as arising from a few local
interconnections of lamellae rather than a fully interconnected network. The
ordered and disordered regions in this sample are apparent by the distinct
light and dark regions on the photomicrograph. If the sample was very
interconnected, then these regions would not be apparent. If the sample had
a higher molecular weight, as will be seen, the micrograph would appear
smoother because of the many more interconnecting lamellae within the
sample.
Figure 6c represents a spherulite of the PEG8 sample. As can be
42

Figure 6V Photomicrographs of poly(ethylene oxide)
samples cooled at 10 degrees per minute with the use of
crossed polarizers. Molecular weights of a) 1500, b)3400,
c)8000, d) 18500 g/mol.
43

seen here, the spherulite is big relative to the spherulites seen in 6d. Also,
notice how the morphology of the PEG8 sample is smoother than the PEG34
sample. At the critical molecular weight, the lamellae interconnect to produce
a smoother texture and to produce spherulites. As the molecular weight
increases, many more interconnections occur, thus producing a smoother
appearing morphology. The smoother morphology is very evident in this
sample when compared to the PEG34 sample.
The photomicrograph of the PEG185 sample is represented in Figure
6d. The distinguishing feature in this sample is that there are many
spherulites in the same volume for which only one spherulite was observed in
the PEG8 sample. This can be related to a larger nucleation site density in
this sample. This raises more concerns about the measured Tm of this
sample. Normally when a sample has many nuclei, the temperature at which
it crystallizes is close to the melt temperature. Also, when the sample is
melted, the large number of nuclei lowers the melting temperature. The
melting temperature is lowered because there is a large surface to volume
ratio. If there are many nuclei (i.e. crystals) in the sample, the surface to
volume ratio is very large; thus less energy needs to be put into the system to
melt the crystals. In smaller crystals there is more surface bonding and less
bulk bonds in the crystals. When the sample is melting, the surface bonds
are much weaker than the bulk bonds of the crystal, and the easier it is to
break them and the lower the melt temperature of a sample will be.
The intention of displaying the above photomicrographs was to
demonstrate how the morphology changes over the various molecular
weights for a given cooling rate. From Figure 6, it can be seen that the
44

morphology changes considerably as the molecular weight is increased
through the critical molecular weight; below the critical molecular weight the
morphology consists of mostly non-interconnected lamellae while above the
critical molecular weight smooth-looking spherulites occur.
The lower molecular weight samples that were used in the above
experiment were also analyzed with a three degree-per-minute cooling rate.
As seen in Figure 7a, the PEG15 sample exhibited lamellae that are bridged
by chains to make an axialite formation. The regions between fused lamellae
appear dark, indicating the presence of amorphous material. Under slow
cooling conditions the chains of the PEG15 sample had time to align to the
growth front and entangle with each other, but not extensively. From the
photomicrograph, it can be seen that there is not much thickness to the
crystals. They almost appear to be two dimensional.
Figure 7b shows the crystalline morphology of the PEG34 sample
cooled at three degrees-per-minute to be much smoother and to contain
more crystalline regions than the same polymer cooled at ten degrees-per-
minute. This is a consequence of the polymer having had more time to
interconnect, thus producing a smoother morphology. Figure 7c represents
the morphology of a PEG8 sample. Compared to the morphology resulting
from a larger cooling rate, this sample appears to display a smaller core of
the spherulite, however, the overall appearance is the same. Figure 7d
indicates that the morphology of the PEG185 sample did not change much
with cooling rate. The spherulites appear to be about the samesize and the
number of nuclei in a given region appear to be approximately the same. The
45

^ V 'y
8111^...
lHI
^JjH^^l
"I' ik~
<
^ 1
Ficrure 7. Photomicrographs of poly(ethylene oxide)
samples cooled at 3 degrees per minute with the use of
crossed polarizers. Molecular weights of a) 1500,
b)3400, c)8000. d)18500 g/mol.
46

major change in the morphology in this experiment occurred for the PEG15
sample; here the ten degree-per-minute cooling rate sample exhibited a
needle-like formation while the three degree-per-minute cooling rate sample
exhibited axialites.
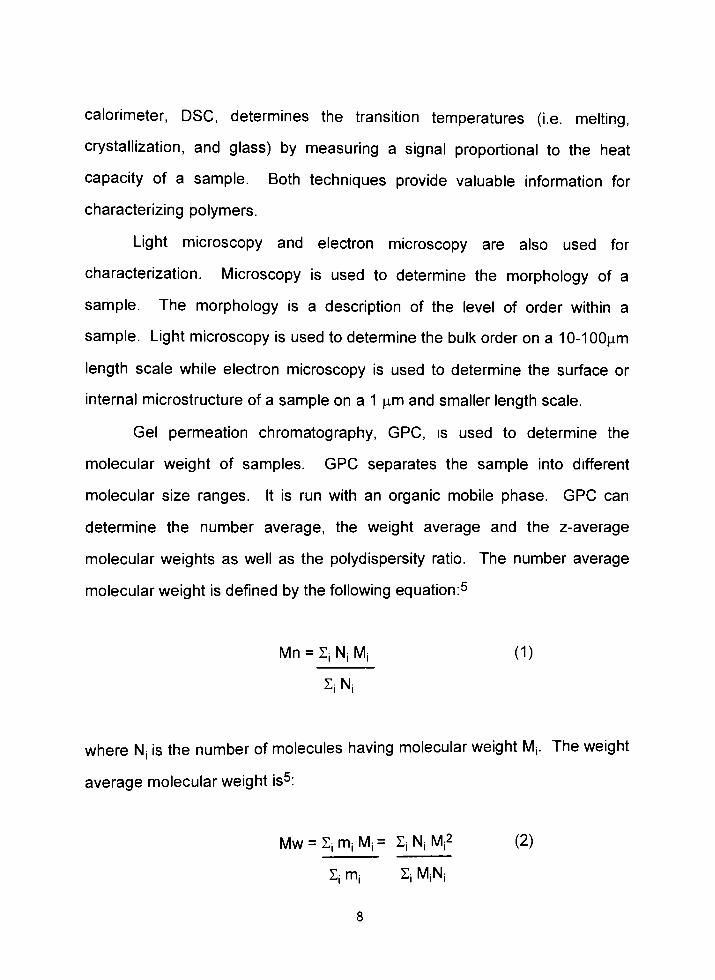
4.2 Differential Scanning Calorimetry Study:
In conjunction with the polarizing light microscope, the differential
scanning calorimeter was used to study the effect of molecular weight on the
crystallization kinetics of poly(ethylene oxide) for a given cooling rate. A
representation of the DSC exotherms is given in Figure 8. The trend depicted
in Figure 8 is a general trend observed for all of the cooling rates for the low
molecular weight samples. For a cooling rate of 5 degrees-per-minute, it can
be seen that as the molecular weight increases, the crystallization peak
temperature decreases or the peak degree of supercooling increases. This
agrees with what is to be expected, the longer the chains, the longer it will
take to get the chains to diffuse to the growth front, the larger the difference
between the melt and crystallization temperatures. The experimental data
agrees with theory up to a molecular weight of PEG8. It is thought that the
reason a shift in behavior occurs between the PEG8 sample and the PEG185
sample is that the melting temperature used to calculate the degree of
supercooling for PEG 185 is not the sample's"true"
Tm. As stated earlier,
the number of nuclei leading to crystal growth in a sample has an effect on
the observed melting temperature. Also, the PEG185 sample exhibits a
47

DSC Crystallization Curves
1500
2000
3400
4600
8000
18500
15.00 20.00 25.00 30.00
Degree of Supercooling (C)
Figure 8. Differential scanning calorimetry crystallization exotherms with a
cooling rate of 5 degrees-per-minute, low molecular weight range of
poly(ethylene oxide). Samples annealed for five minutes at TGA Tm + 50 C.
Supercooling based on the calculated melting temperature. All weights for
samples were normalized.
00
48
bimodal molecular weight distribution. It is not known, which molecular
weight average controls the Tm; Mn, Mw, or Mz?
In Figure 8, AT = Tm-Tc is determined from a value of Tm calculated
from equation (4). Figure 9 is the same as Figure 8 except, instead of using
the calculated value of Tm, Figure 9 is based on the experimental Tm found
by DSC. The melting temperature from the DSC was found by finding the
temperature at the peak of the melting endotherm after crystallization of the
sample. Although the difference in the value of Tm for the two methods is
just a few degrees, it can be seen that this has a great effect on the
positioning of the peaks with respect to each other.
The high molecular weight samples display the same trend as do the
low molecular weight samples. As the molecular weight increases, the
crystallization temperature is reduced, or the peak occurs at a higher degree
of supercooling. Figure 10 is a representation of this trend for the high
molecular weight samples using the calculated melting temperature for each
sample. Comparing Figure 10 to Figure 11, Tm measured by DSC, shows
the change in the DSC crystallization peak positioning with the definition of
AT. The calculated value of Tm is based on the nominal molecular weight as
given on the sample bottle. Again the question of using Mn, Mw, or Mz
arises. The gel permeation chromatography data was not available for the
PEG900, the PEG2000 or the PEG7 samples. It is unclear whether the
controlling molecular weight lies above or below the nominal molecular
weight given on the bottle? These are all questions that must be considered
in deciphering the trends seen in differential scanning calorimetry data.
49

DSC Crystallization Curves
1500
2000
3400
4600
8000
18500
5.00 10.00 15.00 20.00
Degree of Supercooling (C)
25.00 30.00
Figure 9. Differential scanning calorimetry crystallization exotherms with a
cooling rate of 5 degrees-per-minute, low molecular weight range of
poly(ethylene oxide). Samples annealed for five minutes at TGA Tm + 50 C.
Supercooling based on an experimental melting temperature. Weights for all
samples were normalized.
50

QOOO-
DSC Crystallization Curves
<L
7nnn- < \\b
"z e;nnn-\i/l \\ \
X OUVJU
l| : \ \ \ \2 ouuu
1 nnn-
j in! \ M\\
1 uuu
1 r\f\r\-i UUU
5. 00 15.00 25.00 35.00
100,000
b
400,000
900,000
_CL_
2,000,000
e.....
7,000,000
10.00 20.00 30.00 40.00
Degree of Supercooling
Figure 10. Differential scanning calorimetry crystallization exotherms with a
cooling rate of 5 degrees-per-minute, high molecular weight range of
poly(ethylene oxide). Samples annealed for five minutes at TGA Tm + 50 C.
Supercooling based on an experimental melting temperature. All weights for
samples were normalized.
51

9000
7000
x 5000
7.
3000
1000
DSC Crystallization Curves
-1000
100,000
400,000
_J^
900,000
.._.d...
2,000,000
fe_
7,000,000
10.00 20.00 30.00 40.00
15.00 25.00 35.00 45.00
Degree of Supercooling
Figure 11. Differential scanning calorimetry crystallization exotherms with a
cooling rate of 5 degrees-per-minute, high molecular weight range of
poly(ethylene oxide). Samples annealed for five minutes at TGA, Tm + 50 C.
The degree of supercooling is based on a calculated melting temperature.
Weights for all samples were normalized.
52

4.3 Nucleation:
Figure 12 depicts the effect of cooling rate on the DSC crystallization
exotherms of sample PEG46. As can be seen, the sharpest peak and the
lowest degree of supercooling occur for the one degree-per-minute cooling
rate. As the cooling rate increases, the curves get broader and the degree of
supercooling increases. With a slow cooling rate, reptation motion is fast
relative to the cooling rate, therefore chains get to the growth front at a higher
temperature, or lower degree of supercooling. As the cooling rate increases,
the time to get the chains to the growth front maybe the same; however, the
temperature at which bulk crystallization occurs is considerably lower, thus a
higher degree of supercooling is observed. This trend is repeated by all the
different molecular weight samples.
A feature exhibited by the low molecular weight samples is that of a
double peak in the one degree-per-minute exotherm. This can be seen in
Figure 13. It is assumed that the low molecular weight samples show a
double peak because two populations of crystals are growing. One
explanation is that spontaneous nucleation occurs together with sporadic
nucleation; where sporadic nucleation occurs at a lower temperature than
does spontaneous nucleation. Sporadic nucleation occurs at a lower
temperature because of the necessity of creating critical nuclei as discussed
in the introduction. In sporadic nucleation, all three steps of crystal growth
must be completed whereas in spontaneous nucleation the nuclei are already
formed. Crystal growth by sporadic nucleation will take longer to complete,
thus the crystallization occurs at a lower temperature.
53

DSC Crystallization Curves
10.00
I
1 deg/min
I
5 deg/min
1 0 deg/min
1 5 deg/min
20 deg/min
30.00
20.00 40.00
Degree of Supercooling (C)
Figure 12. Experimental differential scanning calorimetry crystallization
exotherms for PEG46. All samples were annealed at TGA, Tm + 50 C. The
degree of supercooling is based upon a calculated melting temperature. All
sample weights were normalized.
54

DSC Crystallization Curves
1 degree-per-minute
6000
7.
4000
2000
6.00 10.00 14.00 18.00 22.00
8.00 12.00 16.00 20.00 24.00
Degree of Supercooling (C)
Figure 13. Experimental differential scanning calorimetry crystallization
exotherms for low molecular weight poly (ethylene oxide) at a cooling rate of
one degree-per-minute. The degree of supercooling is based on a calculated
melting temperature. All sample weights were normalized.
55

The PEG185 sample is different altogether. The reason that this
sample exhibits only one peak is believed to be due to the large number of
residual nuclei that it possesses. The large number of residual nuclei ensure
that crystallization occurs by a spontaneous, not a sporadic nucleation
pathway. Since there are so many residual nuclei, it is possible that the
sample fully crystallizes before sporadic nucleation begins.
PEG185 was annealed in the DSC to see if the number of nuclei would
decrease and the double peak would become evident. The sample was
annealed for 180 minutes at 111.6C and was cooled at a rate of one degree-
per-minute. There was only one peak present and no evidence of a double
peak forming. It is possible that the residual nuclei in this sample are
impurities and not due to the native polymer.
From the gel permeation chromatography results for the PEG185
sample, it would seem that this sample is more apt to exhibit a double peak
due to its wide bimodal distribution of molecular weights. Perhaps the reason
that the double peak was not evident is due to the high number of residual
nuclei; however, one could expect that the wide distribution in molecular
weight would manifest itself as multiple peaks. An experiment was
conducted to see if more than one peak would result on a DSC thermogram if
two molecular weights were present in one sample. A PEG8 sample and a
PEG2 sample were placed together in a DSC pan, both of which have a
polydispersity ratio of approximately one. The sample was successively
annealed for 5, 30, and 120 minutes. After each annealing time the sample
was crystallized at 1 degree-per-minute. Each of the crystallization peaks
showed the same phenomenon, two distinct peaks. This is represented in
56

Figure 14. The conclusion to be drawn from this experiment is that if there
were two different molecular weights in a sample, it should give rise to two
peaks in the DSC crystallization curves. Since the PEG185 sample does not
show this double peak phenomenon, it is believed that it contains an
excessively large number of residual nuclei. The large number of nuclei
outweigh the effect of the broad molecular weight distribution.
A polarizing light microscope study was conducted in order to see if
there was a difference in the morphology of the samples in a one degree-per-
minute study. It seemed that the samples, PEG15, PEG34, and PEG46, did
not show a difference in morphology throughout the samples.
The DSC melting endotherms should give information on the
morphology of the samples. In Figure 15, the degree of supercooling, at the
peak, is shown to decrease with an increase in molecular weight up to 3400
g/mol. Beyond 3400 g/mol, the degree of supercooling increases steadily
with increasing molecular weight. Since 3400 g/mol is the critical molecular
weight of poly(ethylene oxide), it is assumed that the type and quality of the
crystals that are formed will change below and beyond this molecular weight.
Extended chain crystals can form below this molecular weight.
Entanglements prevent extended chain crystals from forming above the
critical molecular weight. Consequently, chain folded crystals will be formed
for samples with a molecular weight greater than the critical molecular weight.
As the molecular weight increases, the peaks also become sharper.
The sharpness of the peaks is an indication of the quality of the crystals. The
most perfect crystals will melt at a lower degree of supercooling, or a higher
temperature while the worst, more disordered, crystals will melt at a higher
57
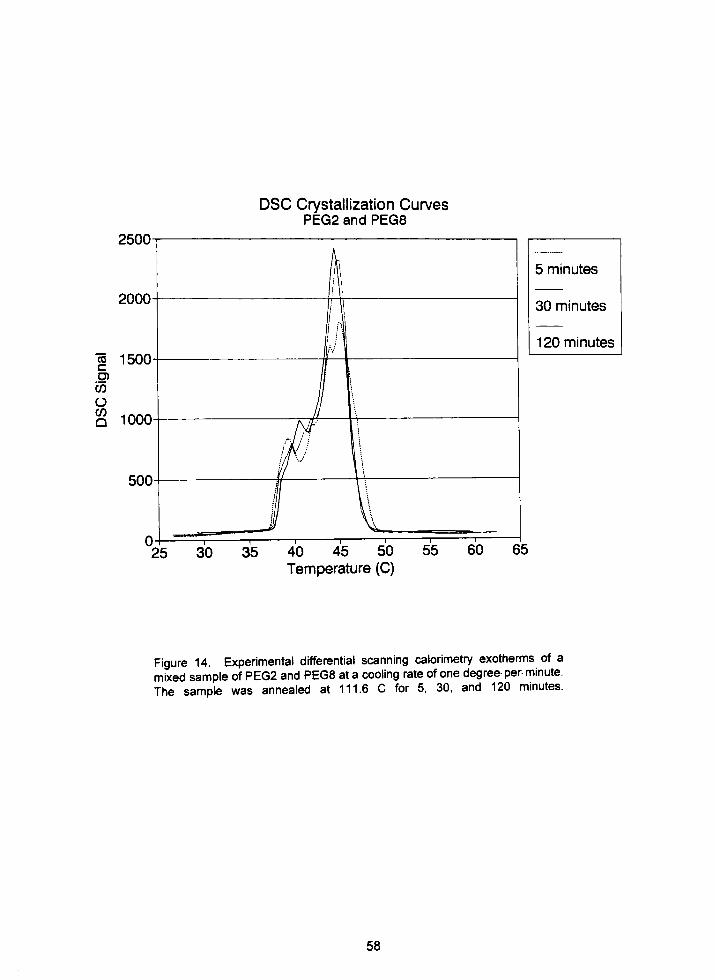
DSC Crystallization Curves
PEG2 and PEG8
2500
5 minutes
30 minutes
1 20 minutes
25 30 35 40 45 50 55
Temperature (C)
60 65
Figure 14. Experimental differential scanning calorimetry exotherms of a
mixed sample of PEG2 and PEG8 at a cooling rate of onedegree-per-minute.
The sample was annealed at 111.6 C for 5, 30, and 120 minutes.
58
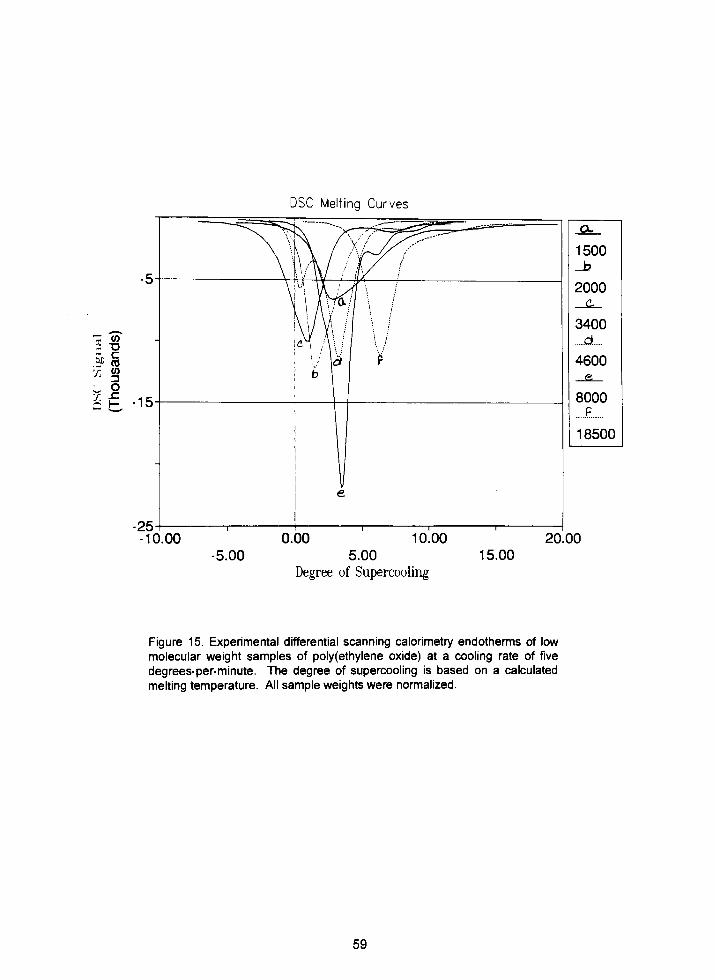
DSC Melting Curves
x 42
.?co
x co
- P-
0.00 10.00
-5.00 5.00
Degree of Supercooling
20.00
15.00
Figure 15. Experimental differential scanning calorimetry endotherms of low
molecular weight samples of poly(ethylene oxide) at a cooling rate of five
degrees-per-minute. The degree of supercooling is based on a calculated
melting temperature. All sample weights were normalized.
59

degree of supercooling or a lower temperature. Since the 1500 g/mol sample
displays a broad exotherm, there is a wide range of crystal quality in the
sample. On the other hand, the 8000 g/mol sample exhibits the sharpest
peak and therefore possess the most consistent crystal structure. The
sharpening of the melt transition with increasing molecular weight has also
been reported for polyethylene.4
The morphology of the high molecular weight samples can also be
inferred from their DSC endotherms. Figure 16 shows that the morphology of
the high molecular weight samples appears to be consistent as indicated by
the sharpness of the peaks of the melting endotherms. The main peak of
the endotherm is from the large crystals present in the sample. Note the long
tail that appears at the higher degree of supercooling. This tailing results
from two factors, 1) small, high surface area crystals within the sample and 2)
the disordered crystalline structures created during the diffusion controlled
regime at the end of bulk crystallization. The small crystals will produce the
tailing effect because of the smaller energies required to melt these crystals.
The small crystals have a large surface to volume ratio, and therefore have a
higher percentage of weak crystalline bonds. Since there are many small
crystals, the crystallization will be diffusion controlled early in the
crystallization. These crystals will compete for chains adding to the growth
front, earlier than if there were fewer larger crystals.
The PLM provides proof that there are two different-sized crystals in
the samples. This can be seen in Figure 17. Toward the end of
crystallization, diffusion of chains to multiple growth fronts becomes a
60

DSC Melting Curves
-2000
7
x-4000
-6000
-8000
-10.00 10.00 30.00 50.00
0.00 20.00 40.00 60.00
Degree of Supercooling
Figure 16. Experimental differential scanning calorimetry endotherms of high
molecular weight samples of polyethylene oxide) at a cooling rate of five
degrees-per-minute. The degree of supercooling is based on a calculated
melting temperature. All sample weights were normalized.
61

:% ^
r ^5r Jl I kw*
"its? ?*tVWS
Figure IT. Photomicrographs of poly (ethylene oxide)samples cooled at 3 degrees per minute with the use of
crossed polarizers. The samples were annealed for 10
minutes, 75 minutes, and 150 minutes at Tm+50 - 113.4,
122.1, 115.1 C respectively. Molecular weights of a)
100,000, b) 900,000, c) 2,000,000 g/mol .
62

controlling factor. Two spherulites that are growing toward each other
compete for the last chains available in the melt. Early in the crystallization
process, a crystal will grow linearly with respect to time. During the later
stages of crystallization, the crystallization rate becomes proportional to t 5.
This later stage of crystallization results in spherulites that are interconnected
by disordered crystalline material. This material has a low melting point.
4.4 Annealing of a Sample:
One important topic that needs addressing is the effect of annealing
time on the morphology of a crystallized sample. Theory predicts that the
longer a sample is annealed, the less residual nuclei it possess, and thus the
lower the crystallization temperature will be. Figure 18 shows three DSC
crystallization curves for the annealing of the PEG8 sample. As the
annealing times were increased, the degree of supercooling increased, or the
crystallization temperature decreased. Therefore, the experimental behavior
supports the theory.
Careful analysis of the curves in Figure 18 reveals a shoulder peak on
the 90 minute annealing curve between a supercooling of 35 and 40 degrees.
This is thought to be due to the fact that after such a long annealing time, the
sample possessed few residual nuclei. This enabled sporadic nucleation to
become a viable nucleation pathway. This resulted in the shoulder peak on
the 90-minute annealing curve.
Annealing for the PEG8 sample was also studied on the PLM. Figure
19 shows the sample after it had been annealed successively from 5 to 30
63

DSC Crystallization Curves
20 25 30 35 40 45
Degree of Supercooling (C)
20 minutes
60 minutes
90 minutes
50
Figure 18. Experimental differential scanning calorimetry exotherms of an
8000 g/mol sample of polyethylene oxide) annealed at TGA, Tm+ 50 for 20,
60, and 90 minutes. The degree of supercooling is based on a calculated
melting temperature.
64

Figure 19. Photomicrographs of an 8000 g/mol sample of
poly (ethylene oxide) samples cooled at 3 degrees per
minute with the use of crossed polarizers. Successive
annealing times of a) 5 minutes, b) 10 minutes, c) 30
minutes, d) 25 minutes at a temperature of Tm+50, 111.6C.
(Tm from TGA.)
65

minutes. As the sample was successively annealed, more nuclei were
annealed out the sample. As the number of residual nuclei decreased, the
sample was forced to create larger crystals and consequently the crystal
structure became more coarse.
When the PEG15 sample was annealed and observed using the
polarizing light microscope, it was found that there was no great dependence
of morphology on annealing time. Figure 20 is a representative picture of
what the sample's morphology looked like under all annealing conditions.
The morphology did not change because it was thought that the nuclei were
annealed out after just five minutes. Thus the same morphology would result
for all annealing times greater than five minutes.
The effect of annealing of the PEG15 sample was also studied using
the DSC. It is believed that after a 5 minute annealing time, all the residual
nuclei are annealed out of the sample. After 30 minutes of annealing, the
onset of sporadic nucleation can be observed at a large degree of
supercooling. When the sample is melted again, all nuclei become residual
nuclei no matter if they were residual or sporadic nuclei in the previous
crystallization. When the sample is melted and soon after recrystallized,
spontaneous nucleation again becomes the dominant pathway for crystal
growth. The results of this DSC experiment is represented in Figure 21.
4.5 Model:
The last topic that needs to be discussed is that of the development of
a mathematical model for crystallization kinetics. The development of this
66
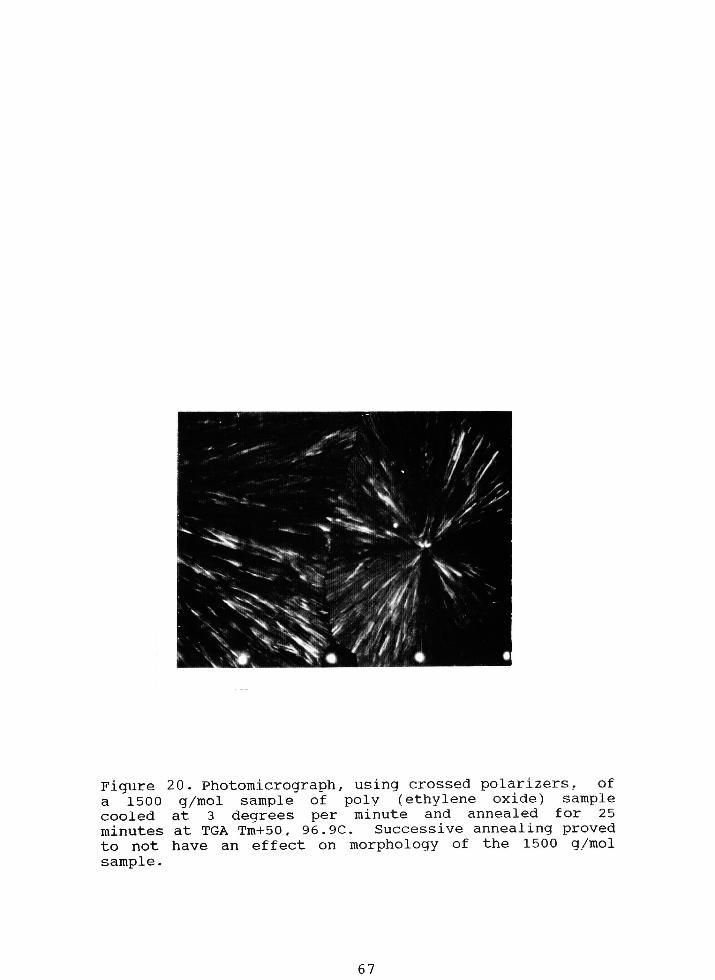
Figure 20. Photomicrograph, using crossed polarizers, of
a 1500 g/mol sample of poly (ethylene oxide) sample
cooled at 3 degrees per minute and annealed for 25
minutes at TGA Tm+50, 96. 9C. Successive annealing proved
to not have an effect on morphology of the 1500 g/mol
sample.
67

CO
c
TO
oCO
Q
TJc(0(/)
3
o
DSC Crystallization Curves
5 minutes
30 minutes
5 minutes
10 15 20 25 30
Degree of Supercooling (C)
35 40
Figure 21. Experimental differential scanning calorimetry exotherms for a
1500 g/mol sample of polyethylene oxide) successively annealed at TGA,
Tm + 50 C for 5, 30, and 5 minutes. The degree of supercooling is based on
a calculated melting temperature.
68

model can be found in the"Theory"
section. One of the main goals in using
this preliminary model was to optimize the parameters to give the best fit to
the DSC crystallization exotherms.
4.5.1 Modeling Parameters and Their Effects:
From DSC data, the degree of supercooling, AT, the peak width at half
height, co, and the crystalline fraction Xc, of a sample can be found. From
experimental measures ( ie. AT, co, Xc), the number of nuclei, N, the energy
barrier for reptation motion, IT, and the surface energy barrier for nucleating
a growth front, Kg, were desired to include in the preliminary model.
Keeping the cooling rate at one degree per minute, Go = 1E5, Kg =
21,800 K2, Tm = 342.19 K, T^ = 176 K, n.= 1, and x = 30, Figure 22 shows
how the crystalline content changes with N for five different values for U*. It
is evident that for each U*, the value of N covers about two orders of
magnitude from a crystalline content of zero to a crystalline content of one. If
one thinks about the physical dependence of N on U*, this is stating that as
the energy required to get the chains to the growth front increases, the
number of nuclei must increase in order to have the same crystalline content
in the sample. If there are more potential growth fronts in a sample, then it is
more likely that the sample will crystallize no matter what the energy barrier
for reptation motion is.
The effect of
U*
on the degree of supercooling of the peak of the
crystallization curve is given in Figure 23. As shown in the figure, at a low
crystalline content, the curves exhibit a threedegree difference in the degree
69

&
w.
,.r. .
, .,, ,.
.,, ... i Mini i mini i i min i iiiml
1E+00 1E+02 1E+04 1E+06 1E+08 1E+10 1E+12 1E+14
1E+01 1E+03 1E+05 1E+07 1E+09 1E+11 1E+13
N
Figure 22. Effect of the concentration of nucleation sites, N, on the degree of
crystallinity, Xc. The rate equals one degree-per-minute, Kg = 21800, G0 =
1E5, Tm = 342.19K, t = 30.
70

3D Spontaneous
16 18 20 22
<delT>
r
26
U=24300
U=26800
U=29300
U=31800
U=34300
28
Figure 23. Effect of reptation rate on the degree of supercooling, <del T>,
and on the degree of crystallinity, Xc. The modeling parameters are G0 =
1E5, Kg = 21800, Tm = 342.19, t = 30 and the rate is one degree-per-minute.
71

of supercooling, <del T> When the crystalline content is closer to one, then
the degree of supercooling becomes approximately the same for all the
samples. In the middle, Xc = 0.5, it is obvious that asU*
increases, the
degree of supercooling decreases or the temperature increases. As the
energy needed to get the chains to the growth front increases, the
temperature must increase in order to provide more energy to overcome the
barrier.
Those same parameters were used to determine the effect ofU*
on
the width-at-half-height, co, of the crystallization peaks. As shown in Figure
24, as the energy to get the chains to the growth front, U*, increases, the
maximum width of the crystallization peak, co, decreases. The largerU*
is the
greater the supercooling required to achieve an appreciable growth rate.
Therefore the closer to the temperature of maximum growth rate the
crystallization occurs and the smaller the temperature interval over which
crystallization occurs. Also, all the curves, no matter what the value of U*,
level off at an co approximately equal to six. Therefore crystallization
exotherms with co greater than six indicate that the crystallization process did
not go to completion regardless of the value of U*.
Figures 23 and 24 were used to see whetherU*
could be determined
from a measure of the width and the degree of supercooling of the peak of a
crystallization curve. As can be seen in Figure 25, a plot of <del T> versus co
is independent ofU*
at small and large values of <del T>. At intermediate
values of <del T> and co the curves diverge slightly for differentU*
However,
the relationship between <del T> and co is not sensitive enough to changes in
U*
to be of utility for establishing it. On the other hand, an averageU*
can be
72

3D Spontaneous
U=24300
U=26800
U= 29300
U=31800
U=34300
Figure 24. Effect of reptation barrier on the width-at-half-height, co, and the
degree of supercooling, <del T>, and on the degree of crystallinity, Xc. The
modeling parameters are G0= 1E5, Kg = 21800, Tm = 342.19, x = 30 and the
rate is one degree-per-minute.
73

3D Spontaneous
CO
Figure 25. Correlation between the width-at-half-height, co, and thedegree of
supercooling, <del T>, while varying U*. The modeling parameters are G0 =
1E5, Kg = 21800, Tm = 342.19, t = 30 and the rate is one degree-per-minute.
74

used to model the DSC crystallization curves without having a big effect on
the width or supercooling of the curves provided the approximate value of N
is chosen.
The same parameters were used for a 20 degrees-per-minute study of
the effect ofU*
on <del T> and co. Figure 26 shows that the curves still end in
the same place at the higher degree of supercooling, but the curves do not
start at the same place, at small co, and the curves cover a larger range of
supercooling and width than the one degree-per-minute curves depicted in
Figure 25. However, the dependence of co and <del T> onU*
is still not very
strong for this case.
In light of these results, the choice of,
U*
should not have much of an
effect on the modeling of the DSC crystallization curves. The relationship
between the width and the degree of supercooling for the curves is almost
the same for each of theU*
values. The cooling rate does have an effect,
tending to split the curves a bit wider at low co, but this difference is not very
significant. The reptation rate has the largest effect on the concentration of
residual nuclei necessary to attain a sample with a high degree of
crystallinity. An experiment needs to be devised in order to determineU*
independently from the number of nuclei.
The effect of Kg on the width and supercooling of the crystallization
curves was also studied. Figure 27 shows the effect that Kg has on the
relationship between <del T> and co. When compared to the same plot for
varying U*, Figure 25, it can be seen that Kg has a much greater effect on the
crystallization curves than does U*. This is evident from the fact that the
curves for different Kg do not start or end at the same points. There is a
75

3D Spontaneous20 degrees/minute
U=24300
U=26800
U=29300
U =31 800
x
U=34300
Figure 26. Correlation between the width-at-half-height, co, and the degree of
supercooling, <del T>, while varying U*. The modeling parameters are G0 =
1E5, Kg = 21800, Tm = 342.19, x = 30 and the rate is twentydegrees-per-
minute.
76

3D Spontaneous1 degree/minute
Kg= 16800
Kg= 19300
Kg=21 800
Kg=24300
Kg=26800
Figure 27. Correlation between the width-at-half-height, co, and the degree of
supercooling, <del T>, while varying Kg. The modeling parameters are G0 =
1E5, Kg = 21800, Tm = 342.19, x = 30 and the rate is one degree-per-minute.
77
three degree spread in the degree of supercooling between the highest and
lowest value of Kg for each value of co. Also, at a supercooling of 20
degrees, co increases by one degree Celsius for each successive value of Kg.
It can be seen that Kg has a much greater effect on the relationship between
<del T> and co. The difficulty in obtaining Kg from experimental data is that it
varies with respect to AT at the peak of the crystallization curve. Since there
is no readily defined Tm, the absolute values of AT can not be readily
determined. Since AT is not known, one can only get two of the three
parameters of Kg, U*, and N. Kg is always found in a term that has AT within
it.
4.5.2 Preliminary Modeling of Crystallization Curves:
The mathematical model has its limitations in reproducing the features
of experimental DSC curves. If the width of the curve is desired, then
sometimes the degree of supercooling of the peak is off by a few degrees, or
if the degree of supercooling is correct, the shape and skew of the
crystallization curve is not right. Figure 28 shows an experimental
crystallization curve along with a mathematical model curve. It can be seen
that the shape and width of the two curves are similar, but the degree of
supercooling at which the model peaks does not correspond to the
experimental value.
Two models were developed, one which incorporated heat transfer
and one which did not. The model without heat transfer was used first to see
if a good fit to the experimental data was possible. Figure 29 shows the fit of
78

Model versus DSC Data
PEG 4600
0.025
0.02
0.015
0.01
0.005
0 10
5 15 25 35 45
Degree of Supercooling
8.48042E-26
Figure 28. Crystallization exotherms of a 4600 g/mol sample of poly(ethylene
oxide), with a cooling rate of five degrees per minute. The DSC data is
represented by"expt"
and the mathematical model is represented by "Model".
The parameters used in the model were: N = 10, x = 50,U*
= 29300/R, Kg =
21800, Tm = 336.7 K.
79

LU
Q
O
T3
PEG 2,000
DATA and MODEL0.025
0.02
0.015
0.01
0.005-
5.34733E-28
DSC Data
Model
10 20 30 40 50 60 70
Degree of Supercooling
Figure 29. Crystallization exotherms of a 2000 g/mol poly(ethylene oxide)
sample cooled at a rate of ten degrees-per-minute. The DSC signal is
represented by "DSCdata"
and the mathematical model is represented bythe "Model". The model curve without heat transfer was made using the
parameters; Kg = 23000,U*
= 29300/R, Gn = 1 00, A = 1 E+60.
80

a 2000 g/mol sample. The model without heat transfer gives a good
correlation at the high degree of supercooling side of the curve, but tends to
be too wide at low degrees of supercooling. The data for the same sample
was then qualitatively fit with the inclusion of heat transfer effects. Figure 30
shows the improved fit to the DSC curve. As can be seen, the model shows
good correlation at high degrees of supercooling as well as at low degrees of
supercooling. The inclusion of heat transfer resulted in a narrowing of the
crystallization curves, not a broadening as was previously supposed. The
reason that the heat transfer model predicts a narrower curve is because
when the sample starts to crystallize, it gives off heat, thus raising the
temperature and lowering the cooling rate. Therefore, since the cooling rate
is slower, the temperature does not decrease as fast and the sample
crystallizes in a smaller temperature range therefore producing a narrower
crystallization peak.
The double peak phenomenon that was seen in the one degree-per-
minute DSC crystallization curves needed to be explained by the model. The
model prediction for crystallization by both spontaneous and sporadic
nucleation is given in Figure 31. In this figure, the contributions of both
spontaneous and sporadic nucleation can be seen in the overall modeled
curve. Figure 32 shows a comparison between the mathematical model (with
heat transfer) and an experimental DSC curve for PEG15 recorded at a
cooling rate of one degree-per-minute. As can be seen from both curves, a
double peak is present. The model is capable of reproducing the bimodal
crystallization peak, but again the supercooling is off. In addition the DSC
81

COc
CO
25004O
g2000-
PEG 2000Experimental vs. Model
10 15 20 25 30 35
Degree of Supercooling
T3
hO.003 ~o
Figure 30. Crystallization curves of a 2000 g/mol sample of poly (ethylene
oxide) for a cooling rate of one degree-per-minute. The DSC signal is
represented by"Expt'l"
and the mathematical model is represented by
"Model". The curve with heat transfer was modeled by N = 100, Kg = 31000,U*
= 29300/R, Tm = 328.3K, x = 30.
82

0.018
CO
c
o
'
o3
CO3
g>
C
PEG 1 500
Combination Nucleation
0.0014
5 9 13 17 21 25 29
7 11 15 19 23 27
Degree of Supercooling
Combination
Spontaneous
Sporadic
Figure 31 . Crystallization curves constructed using the heat transfer model at
one degree-per-minute. Note the contributions of the spontaneous and
sporadic nucleation into the overall curve, "combination". The parameters
that were usedU*
= 29300/R, Kg = 31000, Tm = 322.7 K, x = 50, Gn = 98,
A=1E40.
83

60
50
40
1 fl
% sCO LO
o Sto .c
Q I-
30-
20-
10-
Model and DSC Crystallization Curves
AA
-U.UU14
-0.0012
-0.001
-0.0008 _
CDoo
-0.0006
2
-0.0004
0.0002
n
Model
DSC
f'\ /\|I i /
I I /
/ \/\ /
i i i i i i
5 10 14 18
8 12 16 2(
Degree of Supercoolir
I I I I I VJ
22 26
3 24
ig
Figure 32. Crystallization curves of a 1500 g/mol sample of poly(ethylene
oxide) with a cooling rate of one-degree-per-minute. Note the double peak
for both curves and the difference in the degree of supercooling. The used
the following parameters,U*
= 29300/R, Kg = 31000, Tm = 322.7K, x = 50,
Gn = 98, A=1E40.
84

curve exhibits a distinct low-temperature tail that is not reproduced by the
model.
The mathematical model, as just shown, can model the width and
shape of a crystallization exotherm, but the predicted degree of supercooling
tends to be too small. Table 6 gives a list of the molecular weights, their
cooling rates, and the various parameters that were used to model the width
and shape of the DSC curves. Also listed are the degrees of supercooling at
which the curves peak for both the experimental and model exotherms.
It is important to note that as the molecular weight increases, the
number of nuclei, N, also increase. Also, in order to model the PEG 185
sample, the number of nuclei increases by several orders of magnitude
compared to the other low-molecular-weight samples. This agrees with the
results of the polarizing light microscopy experiments reported earlier.
In Figure 33, all the DSC crystallization curves have features (ie.
shoulder peaks). These shoulder peaks are not apparent in the higher
cooling rates for the other molecular weight samples. From these DSC
exotherms, it is assumed that the PEG34 sample has a complex morphology.
The number of nuclei that were needed to fit this sample with the DSC
crystallization curve fluctuated because the sample has such a complex
morphology.
It is important to remember when comparing the experimental and the
model crystallization exotherms that the identity of the sample's appropriate
value of Tm is an unanswered question. The inability to identify Tm will
inhibit the modeling of the degree of supercooling as seen in DSC
crystallization exotherms.
85

Table 6. Optimization of Modeling Parameters
Molecular Cooling Rates,Weight, degrees/minute
g/mol 1 5 10 15
500
20
1000 N1500 10 100 200
30 30 30 30 30 X
13.3 15.9 18.0 18.6 18.6 AT-Model,C
13.1 15.4 17.4 18.7 20.0 AT-Expt.,C
2000 100 100 100 100 100 N
30 30 30 30 30 T
10.4 13.4 15.8 17.7 19.2 AT-Model,C
16.0 18.0 19.0 21.0 21.0 AT-Expt.,C
3400 100 1E4 2E4 7.5E4 1E3
50 50 50 50 50
15.6 14.7 16.2 12.3 19.8
18.5 20.0 24.8 25.7 29.0
N
x
AT-Model,C
AT-Expt.,C
4600 10 10 50 50 50 N
50 50 50 50 50 X
11.4 15.5 16.2 18.2 20.0 AT-Model,C
17.2 22.0 25.0 28.5 27.7 AT-Expt.,C
8000 10 100 100 100 500 N
30 30 30 30 30 X
12.6 14.6 17.4 19.6 18.0 AT-Model,C
18.3 23.4 26.7 25.4 26.9 AT-Expt.,C
18 500 1E4 5E4 5E4 1E5 5E6 N
50 50 50 50 50 X
11.6 13.9 16.4 17.2 13.5 AT-Model,C
14.8 17.0 18.1 18.9 15.2 AT-Expt.,C
86

Molecular Cooling Rates,Weight, degrees/minute
g/mol 1 5 10 15 20
100 000 1E6 1E6 2.5E7 5E7 5E8 N
50 50 50 50 50 x
13.0 19.0 16.8 17.6 15.6 AT-Model,C
18.9 23.4 25.5 26.0 27.6 AT-Expt.,C
400 000 1E8 1E9 3E9 5E9 5E9
50 50 50 50 50
13.2 15.6 16.8 17.9 19.6
20.5 24.1 25.5 25.7 27.1
N
x
AT-Model,C
AT-Expt.,C
900 000 1E09 5E10 1E11 1E11 1E13 N
50 50 50 50 50 X
14.6 15.5 17.4 19.7 17.1 AT-Model,C
22.5 25.7 26.6 29.0 29.9 AT-Expt.,C
2 000 000 5E11 5E12 5E12 5E12 5E12 N
50 50 50 50 50 X
12.2 14.5 17.2 19.3 21.2 AT-Model,C
21.0 23.0 25.0 27.0 28.0 AT-Expt.,C
7 000 000 1E14 3E14 1E15 7E15 1E16 N
50 50 50 50 50 X
13.0 16.9 18.3 17.1 18.0 AT-Model,C
23.0 25.9 29.3 33.2 30.6 AT-Expt.,C
Table 6: A comparison of the degree of supercooling from the model to the
experimental DSC data. N being the number of nuclei and x being the
relaxation time.
87

DSC Crystallization Curve!
J 1 deg/min
l
j 5 deg/min
1 0 deg/min
1 5 deg/min
20 deg/min
10.00 30.00 50.00
20.00 40.00 60.00
Degree of Supercooling (C)
Figure 33. Experimental differential scanning calorimetry crystallization
exotherms for PEG34. All samples were annealed at TGA, Tm + 50 C. The
degree of supercooling is based upon a calculated melting temperature. All
sample weights were normalized.
88

5.0 CONCLUSION
The three major goals in this project were to determine the molecular
weight dependence of polyethylene oxide) on 1) the morphology of the
crystalline state, 2) the nucleation of the crystalline phase of the sample, and
3) to make a preliminary assessment of the range of parameters of a model
for crystallization kinetics.
The molecular weight had a strong influence on the morphology of a
sample, particularly in the range of the critical molecular weight of poly
(ethylene oxide), 3400 g/mol. Below the critical molecular weight, lamellae
did not interconnect thus leaving small crystals evident in polarizing light
microscope photographs. Above the critical molecular weight, the lamellae
did interconnect to produce a smoother crystalline morphology in the form of
spherulites.
The molecular weight was also shown to have an effect on crystal
nucleation. The lower the molecular weight, the more rapid residual nuclei
could be annealed out of the melt. The PEG15 sample was annealed for five
minutes and appeared to have all nuclei annealed out of the sample. The
longer the sample was annealed, the less effect the annealing had on the
morphology of the sample, as observed by the PLM. If the sample had a
molecular weight below the critical molecular weight, the main morphological
structure of the sample after annealing appeared to be axialites. The PEG8
sample exhibited a morphology that changed as the annealing time was
changed. The longer the sample was annealed, the more the residual nuclei
were eliminated. Consequently, a coarser morphology resulted. This was
89

evident in the polarizing light microscope study. The DSC study for the
PEG15 and PEG8 samples showed that as the annealing time increased and
the residual nuclei became fewer, sporadic nucleation became a viable
pathway for initiating crystallization in these samples. As the molecular
weight was increased, the melting of residual nuclei became an ever more
difficult task. There was no evidence for sporadic nucleation in the PEG185
sample.
The molecular weight was shown to affect the kinetic parameters in
the kinetic model. Based on the molecular weight of the sample, the various
parameters changed to incorporate the molecular weight. The molecular
weight had a great effect on the pre-exponential term, G0 which varied by
several orders of magnitude. The molecular weight also had an effect on the
melting temperature so that it varied by two or three degrees. Changing
these parameters resulted in being able to qualitatively fit the widths of the
DSC crystallization curves; however, the degree of supercooling was not
readily produced.
Although progress was made at addressing the goals of the thesis,
there are several limitations which were discovered in the preliminary
application of the model. The preliminary fit of the width and shape of the
DSC crystallization exotherms were acceptable. However, the degree of
supercooling predicted from this preliminary fit was at a lower temperature
than the experimental degree of supercooling as seen on the DSC
crystallization curves.
The model does not take into account multiple spontaneous
nucleations which would lead to the different morphologies observed in many
90

of the samples. It is obvious that the high molecular weight samples have
two different spherulites sizes within one sample. This needs to be
incorporated into a future version of the model.
Another difficulty arose in the definition of the melting temperature,
Tm. The melting temperatures for all the molecular weights were calculated
based on the melting temperature of the infinite molecular weight crystal.
Cheng etal.1
used a melting temperature for the infinite molecular weight
crystal which was 15 degrees below the melting temperatures which have
been reported by otherresearchers.4
The infinite molecular weight melting
temperature cannot be obtained experimentally.
When calculating the melting temperature, there is also a dependence
on the molecular weight distribution of the sample. As seen by the gel
permeation chromatography results, the PEG185 sample was bimodal and
the average molecular weights, Mn, Mw, and Mz varied by orders of
magnitude. When the melting temperatures for the samples were calculated,
the difference in the molecular weights was not taken into account. If the
melting temperatures were recalculated and the degree of supercooling was
recalculated, the PEG185 DSC crystallization curve would change peak
position and appear at a higher degree of supercooling. This would be in line
with the trend established by the other samples. It is possible to make
samples with a known distribution of molecular weight; however, to establish
Tm for the model distribution the problem knowing the number of residual
nuclei in the sample must be solved.
The exponential factor which contains Kg also has AT in it.
Consequently, any change in the definition of AT will require a redefinition of
91

Kg. It is necessary to find an experimental way to separate the two variables.
The same is true for the activation energy for reptation motion and the
number of nuclei. If there are more nuclei in a sample then the activation
energy to get a stem to that growth front will be less than if there were less
nuclei in the sample. The number of nuclei cannot be definitely determined
by the polarizing light microscope. The theory predicts that each nuclei gives
rise to a growing lamellae. Individual lamellae cannot be observed with the
PLM. An experiment needs to be devised so as to findU*
and N
independently from each other.
92

REFERENCES:
1) Cheng, S.Z.D., Chen, J., and Janimak, J. Polymer, 1990, 31, 1018-1024
2) Van Krevelen, D.W. Properties Of Polymers:Their Correlation With Chemical
Structure:Their Numerical Estimation And Prediction From Additive GroupContribution. 3rd Edition; Elsevier Scientific Publishing Company, New York,
1990; Ch. 19
3) Hoffman, J.D. Polymer, 1982, 23, 656-670
4) Vaughan, A.S., Bassett, D.C. Comprehensive Polymer Science: The
Synthesis. Characterization. Reactions And Applications Of Polymers:
Crystallization And Morphology, Pergamon Press, Oxford, 1989, 2, Ch. 12
5) Heimenz, P.C. Polymer Chemistry:The Basic Concepts. Marcel Dekker, Inc.,
New York, 1984, Ch. 1
6) Marentette, J.M. and Brown, G.R. Journal Of Chemical Education, 1993, 70,
435-439
7) Avrami, M. Journal Of Chemical Physics, 1939, 7, 1103; 1940 8, 212; 1941,
9, 177
8) Van Krevelen, D.W. Properties Of PolymersTheir Correlation With Chemical
Structure:Their Numerical Estimation And Prediction From Additive Group
Contribution. 3rd Edition; Elsevier Scientific Publishing Company, New York,
1990; Ch. 15
9) Hoffman, J.D. and Miller, R.L. Macromolecules, 1988, 21, 3038-3051
10) Kovacs, A.J., Straupe, C, and Gonthier, A. Journal OfPolymer Science:
Polymer Symposium, 1977, 59, 31-54
11) Langner, A., Unpublished Results
12) Spiegel, M.R. Schaum's Outline Series: Mathematical Handbook of
Formulas and Tables. McGraw Hill Book Company, New York, 1981, pp.104
93