Embed Size (px)
Citation preview
CRYSTALLIZATION AND PRECIPITATION ENGINEERING
Alan Jones, Rudi Zauner and Stelios Rigopoulos
Department of Chemical Engineering
University College London, UK
www.chemeng.ucl.ac.uk
Acknowledgements to: Mohsen Al-Rashed, Andreas Schreiner and Terry Kougoulos; EPSRC, EU and GSK
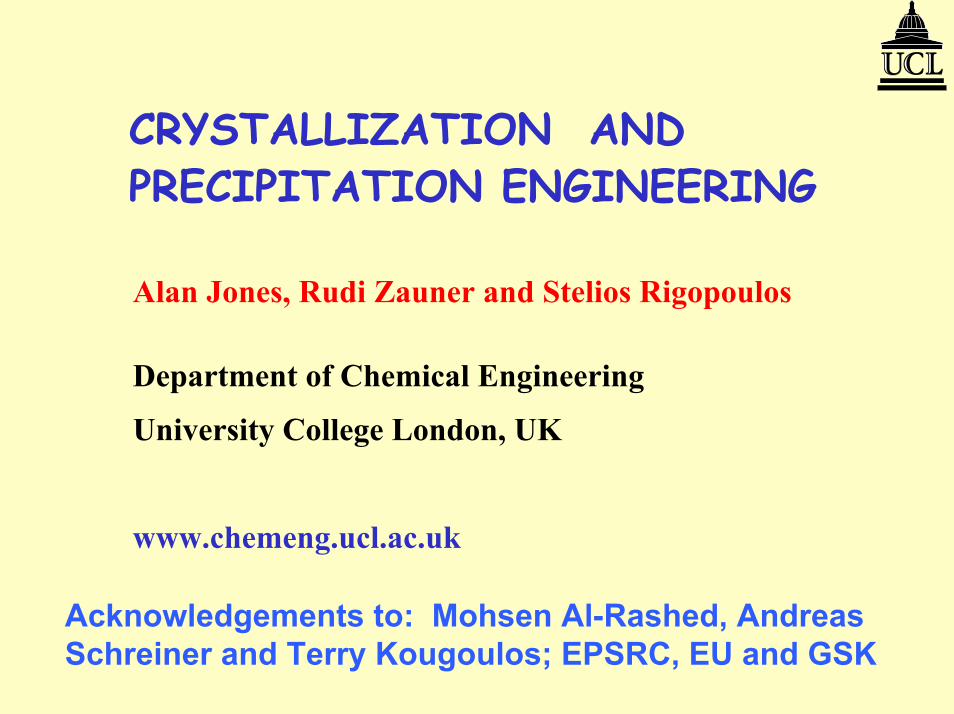
Outline of talk
! Introduction to crystals and crystallization! The ideal well-mixed crystallizer! Prediction of Crystal Size Distribution! Mixing effects in real crystallizers ! Precipitation processes! Crystallization processes! Scale up! Scale out! Conclusions

Crystallization Processes! Crystallization is a core technology of
many sectors in the chemical processand allied industries
! Involves a variety of business sectors, e.g.
� Agrochemicals, catalysts, dyes/pigments, electronics, food/confectionery, health products, nano-materials,nuclear fuel, personal products & pharmaceuticals
! Processes can involve complex process chemistry together with non-ideal reactor hydrodynamics
� Hence can be difficult to understand and scale-up from laboratoryto production scale operation
! Crystallization also forms part of a wider process system

Crystallization Process Systems
Convey
Feed
RecycleLiquor to recycle
Liquor to recycle
Hot air
Water
�Clean� air
Liquor to recycle
PRODUCT CRYSTALS
Mix, convey, etc.
Slurry
Mill oversize
Screen
Jones, A.G. Crystallization Process Systems, Butterworth-Heinemann, 2002

CRYSTAL CHARACTERISTICS
Crystals appear in many: ! sizes, ! shapes and ! forms,
Which affect both: !performance during processing, and !quality in application

Phase Equilibria
Understanding phase equilibria is crucial to crystallizer operation
! Undersaturated - crystals will dissolve
! Metastable - crystals will grow
! Labile - solution will nucleate spontaneously
Solubility-supersolubility diagram

Supersaturation
!Thermodynamically, solute in excess of solubility
RTationSupersatur µ∆
=
where µ = chemical potential
!For practical use
*ccc −=∆ */ ccS =or
where c = concentration of solution c* = saturation concentration
Supersaturation, ∆c, is sometimes called the concentration driving force

Crystallization Kinetics
!Nucleation rate - rate of formation of new crystals
where b = 'order� of nucleationB = nucleation rate �rate of increase of crystal number
!Crystal growth � rate of increase of crystal dimension
where g = 'order� of growth G = growth rate rate � rate of increase in crystal size
nuclei/s m3
m/s
bn ckB
dtdN
∆==
gg ckG
dtdL
∆==
Corresponding expressions exist for crystal agglomeration and breakage.
Thus particle formation processes all depend upon supersaturation

The Well-mixed Crystallizer
IN OUT Precipitation reactions! Reactants flow into vessel
and form a reaction zone! Particles form from reacting
species via crystallisation! Process kinetics can be
dominated by mixing process! Can get undesired
product forms, e.g. solvates from solvent drown out
Note: For batch operation:� Outflow of product is zero � Hydrodynamic ratio (W/D) varies as function of fill during reaction � Reactant mixing & hence precipitation kinetics require optimisation

Designing for Crystal Size Distribution (CSD)
! Key goal: Characterise inter-relationship between � reactor residence time� process kinetics � product CSD
! Understand relationship as function of reactor scale size
! Design reactors and process operating conditions to yield� desired CSD
Kinetics
Residence Time
CSD
The Crystallization Triangle

Conservation EquationsMass balance! ∆concentration (inlet - outlet) → Mass Yield! Only gives crystal yield � not how mass distributed
in crystal size � the CSD! Need �crystal number� balance � population balance
Population balance! Accounts for number of crystals formed & their size! Hence CSD & mean particle size can be predicted! Incorporates terms for crystal nucleation, growth,
agglomeration & breakage
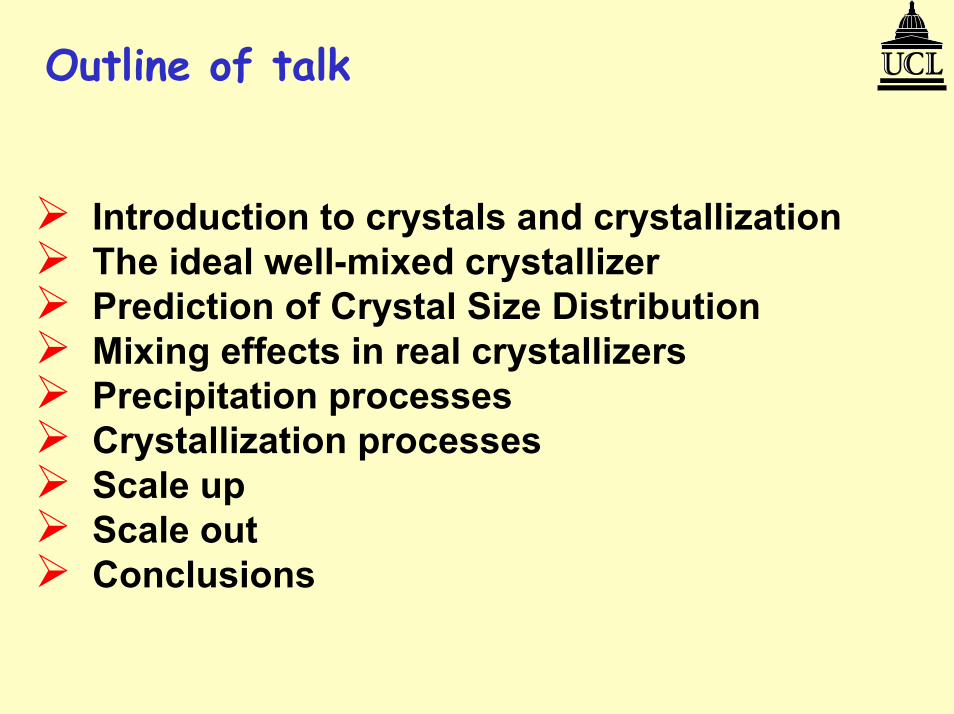
Population Balance Model (PBM)! PBM (Randolph & Larson 1962) provides population of crystals as
described by number density function n(L,t)
� L - crystal size and t - time
� Represents probability to have crystals with size L at moment t! Numerical solution of PBE produces Crystal Size Distribution (CSD)
0ddaao BDBDBnn
L)nG(
tn
+−+−=−
++τ∂
∂∂∂
! G - growth rate! B & D - �Birth� & �Death� functions for agglomeration & breakage! B0 - nucleation rate! τ - residence time (for continuous crystallisation)! Indices a, d & 0 relate to agglomeration, breakage & nucleation
A partial integro-differential equation solved by numerical methods eg finite element. For non well-mixed systems need to include velocity derivatives in addition to crystal growth rate.

Problems with Reactive Precipitation
! Spatial variation in reactant concentration & crystallizerperformance thus sensitive to� mixing conditions � processing scale size
! For fast supersaturation rises and large vessel sizesthis gives variability in particle formation rates
! Scale-dependant fluid mechanics also effect processkinetics through its impact on secondary nucleation
! Mixing effects tends to be particularly pronouncedfor fast precipitation systems (Danckwerts, 1958)
Danckwerts, P. V., 1958. The effect of incomplete mixing on homogeneous reactions. Chemical Engineering Science., 8, 93-99.

Computational Fluid Dynamics
Why use CFD?
! To investigate localised mixing effects and fluid hydrodynamics1. Local velocities2. Local energy dissipation (εloc)3. Solid volume fraction*
4. Heat transfer and temperature profile*
! For the development of crystallizer compartmental modelling framework
! To facilitate modelling, scale-up and design
* Kougoulos et al., Scale-Up of Organic Crystallization Processes. In AIChE National Meeting, Recent Developments. In Crystallization and Evaporation. San Francisco, CA, USA, 16-21 November 2003, (New York: AIChE), Paper 310B

Agitated Vessel Mixing
! Real agitated vessels are not well-mixed except at small volumes and/or high power inputs, which may cause particle disruption
! Uniformity of mixing decreases as vessel size increases
!Numerical solution of the Navier-Stokes Equations

Some CFD and Precipitation Studies
!Seckler et al. 1993 Precipitation of calcium phosphate in a 2-D CFD jet mixer
!Van Leeuwen et al. 1996 Zonal CFD model of BaSO4
precipitation!Wei and Garside 1997 Precipitation of BaSO4 in stirred
tanks!Al-Rashed & Jones 1999 CFD modelling of gas-liquid
precipitation!Bezzo et al. 2000 Integration of CFD and process
simulation!Baldyga and Orciuch, 2001 PDF CFD methods!Zauner and Jones 2002 CFD-Segregated Feed Model !Rigopoulos & Jones 2003 CFD-Reaction engineering model

Mixing Effects in Gas-liquid Precipitation
0.0E+0
2.0E-9
4.0E-9
6.0E-9
8.0E-9
1.0E-8
1.2E-8
1.4E-8
0 1 2 3 4 5 6
Time / (s)
Cry
stal
Mea
n Si
ze /
(m)
CFD
Penetration
Film
CFD + PBM simulations in qualitative agreement with experiment but v. slow ⇒compartmentalisation
Al-Rashed, M.H. and A.G. Jones. "CFD modelling of gas-liquid reactive precipitation". Chem Engng Sci., 54 (1999), 4779-4784

Precipitated Calcium Carbonate Crystals
Note presence of agglomerates and fines � attrition?

Mixing Effects: Segregated Feed Model
!Villermaux�s (1989) Segregated Feed Model (SFM) based on physically meaningful mixing parameters involving� diffusive micro-mixing time � convective meso-mixing time
!SFM particularly suitable for modelling mixing effects, as it combines advantages of both � compartmental model � physical model
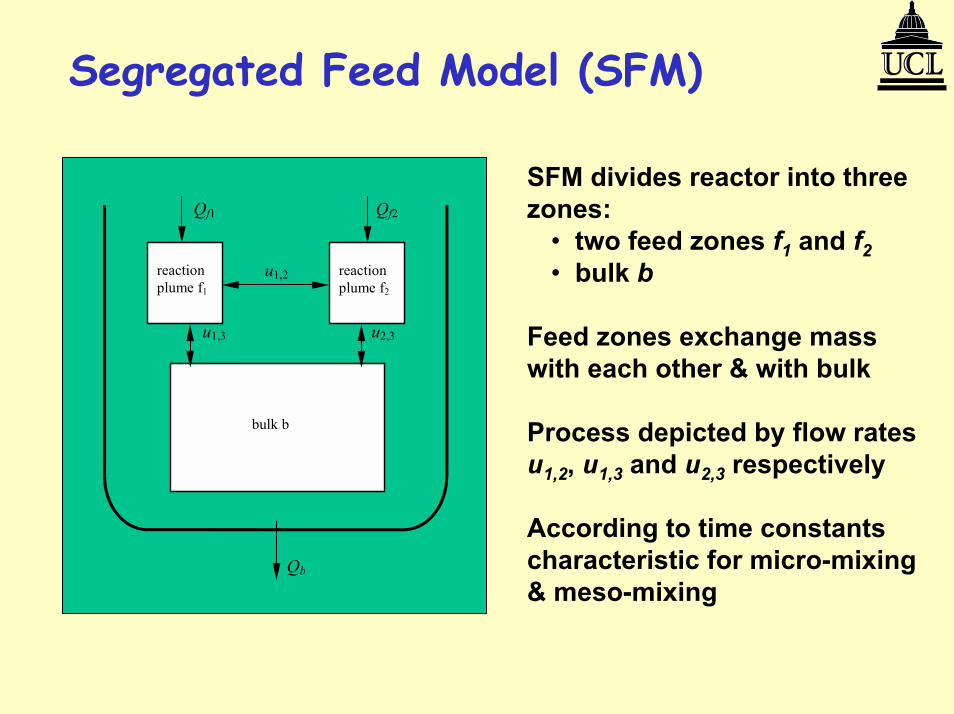
Segregated Feed Model (SFM)
Qf1 Qf2
u1,2
u1,3 u2,3
Qb
reaction plume f1
reaction plume f2
bulk b
SFM divides reactor into three zones:
� two feed zones f1 and f2� bulk b
Feed zones exchange mass with each other & with bulk
Process depicted by flow rates u1,2, u1,3 and u2,3 respectively
According to time constants characteristic for micro-mixing & meso-mixing

Characteristic Mixing Times
Meso-mixing � bulk blendingMicro-mixing � molecular diffusionBased on time constants (Baldega et al 1995)
Time constants tmicro & tmeso can be regarded as inverse coefficients for mass transfer by diffusion & convention, respectivelyEnergy dissipation rate (ε) predictable from CFD
2/1
3.17
×=
locmicrot
εν
sloc
avgmeso
dN
QAt34
31
εε
=
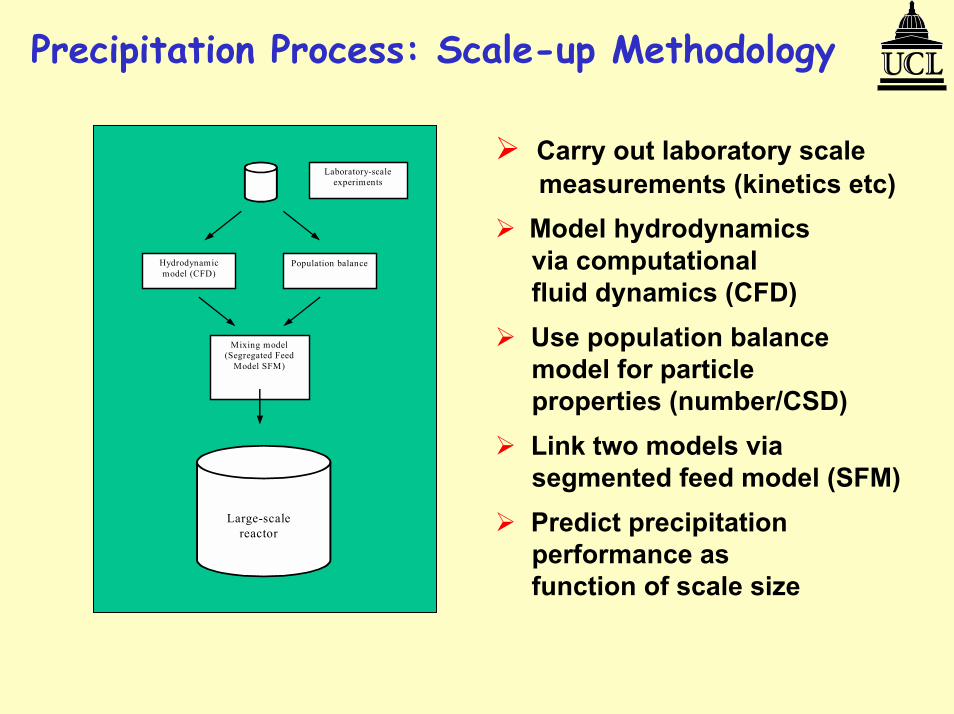
Precipitation Process: Scale-up Methodology
Hydrodynamic model (CFD)
Population balance
Mixing model (Segregated Feed
Model SFM)
Laboratory-scale experiments
Large-scale reactor
! Carry out laboratory scale measurements (kinetics etc)
! Model hydrodynamics via computational fluid dynamics (CFD)
! Use population balance model for particle properties (number/CSD)
! Link two models via segmented feed model (SFM)
! Predict precipitation performance as function of scale size

Process Scale-up: Semi-batch Precipitation
!In contrast at high values of energy input breakage acts as size-reducing process!This leads to smaller particles1E-3 0.01 0.1 1 10
5
10
15
20
25
30
1 l reactor, exp. 5 l reactor, exp. 25 l reactor, exp. 1 l reactor, model 5 l reactor, model 25 l reactor, model
L 43 [µ
m]
Specific power input ε [W/kg]
! Note small particle sizes at low energy inputs! Results from local zones with high levels of supersaturation & nucleation
Calcium Oxalate Precipitation: Particle Size vs Power Input
Zauner, Rudolf and Alan G. Jones. "Scale-up of continuous and semi-batch precipitation processes." Ind Engng Chem Res, 39, (2000). 2392-2403.

Precipitation in Bubble Columns
!The formation of a solid product via a gas-liquid reaction
!Common applications: inorganic salts (e.g. CaCO3, CaSO4), fine chemicals
!Apart from yield, the Particle Size Distribution (PSD) of the product is very important
Conventional Approaches to Bubble Column Modelling and Scale-up
! Experimental approach - use of empirical correlations� Limited validity of correlations, often lead to
contradictory conclusions
! Hydrodynamic approach - entirely based on CFD� Not yet possible to couple with the non-linear
dynamics of fast reactions and crystallisation mechanisms that occur at the gas-liquid interface

A Trade-off: Hybrid CFD - Dynamic Reaction Engineering Model
Hydrodynamic scale
(mesoscopic)C
x
Interfacial scale
(microscopic)
Bulk scale (macroscopic)
Model Assumptions
! Isothermal operation
! Only primary processes of particle formation (i.e. no secondary processes that involve particle-particle interactions such as agglomeration)
! Dilute suspension, i.e. negligible influence of solids presence on hydrodynamics
! Homogeneous bubbly flow, i.e. no bubble coalescence

CFD Modelling of Gas-liquid Flow in a Bubble Column
! Captures the gross hydrodynamic effects that determine the overall long-time-average gas hold-up and liquid circulation
! Eulerian-Eulerian two-dimensional dynamic model considered adequate for that purpose
! Use of CFX flow solver
0
2
4
6
8
10
0 2 4 6 8 10
gas flowrate, m3/s (x10-4)ga
s ho
ld-u
p in
ris
er, %
riser, model
riser, experiment
downcomer, model
downcomer, experiment
CFD and experimental gas hold-up
Rigopoulos, Stelios and Alan G. Jones. "A hybrid CFD - reaction engineering framework for multiphase reactor modelling: Basic concept and application to bubble column reactors". Chem. Eng. Sci., 58, (2003), 3077-3089.

Case Study: CaCO3 Precipitation via CO2 Absorption in Ca(OH)2 Solution
Equilibrium concentrations
00.20.40.60.8
1
3 5 7 9 11 13pH
mol
frac
tion CO3
HCO3
CO2
CO2 (g) → CO2(aq) absorptionCO2(aq) + OH-↔ HCO3
- sub-reaction iHCO3
- + OH- ↔ CO3= + H2O sub-reaction ii
Ca++ + CO3= → CaCO3(s) crystal formation

Time Course of Concentration Profiles
7
8
9
10
11
12
13
0 20 40 60
time (min)
pH
0
5
10
15
20
25
30
0 20 40 60
time (min)
conc
entr
atio
n (m
ol/m
3 )
CO2CO3HCO3

Evolution of Supersaturation
0
0.5
11.5
2
2.5
33.5
4
4.5
0 2 4 6 8 10
time (min)
conc
entra
tion
(gm
ol/m
3 )CO3= gmol/m3
Ca++ gmol/m3
Supersaturation

Evolution of Nucleation Rate
10
1000
100000
1E+07
1E+09
1E+11
1E+13
1E+15
0 2 4 6 8 10
time (min)
log
nucl
eatio
n ra
te (n
ucle
i/sec
)

Experimental Results and Model Predictions
Agglomerate
6
7
8
9
10
11
12
13
0 2 4 6 8 10
time (min)
pH
0.0E+00
2.0E-07
4.0E-07
6.0E-07
8.0E-07
1.0E-06
1.2E-06
1.4E-06
Par
ticle
siz
e (m
)
pH (model) pH (exper.)
Size (model) Size (exper.)
Reasonable agreement up to the onset of agglomeration

SEM Micrographs of Calcium Carbonate Crystal Agglomerates:

Effect of Crystal Agglomeration
21 litres Ca(OH)2 = 3 mol/m3; 0.00001 : 0.0001 m3/s CO2: N2
Current Work
!Compartmental model of batch cooling crystallization at high solids content����

Batch Cooling Crystallization
Pre-processing
!CFX-Promixus
!Multiple Frames of Reference
Simulations
!Multi-Fluid Model (MFM)
!Modified Drag coefficient (Brucato, 1998)
!Monodisperse particle sizes
!Standard k-ε turbulence model
!Heat transfer (estimated liquid side heat transfer coefficient)

Computational Fluid Dynamics at High(er) Solids Content
CFD clips of [1] velocity profile development and [2] particle concentration
[1] Shows flow dampening [2] Shows solids segregation
Illustration based on 5L batch cooling crystallizer operating at 300 rpm 200 µm 5 v/v% (7 % w/w)

Compartmental Model � Flow (Rushton turbine)
[2]
3
6
7
21
45
8
9
[1]
[1] Shows overall flow pattern on different horizontal planes
[2] Overall flow pattern on vertical scale 45o angle to baffles

Compartmental Model �Heat (Rushton turbine)
1. Heat transfer coefficient
2. Simulate linear cooling profile(353K to 293K at -1oC min-1)
3. �Cooling zones� evident4. Cooling profile influences
temperature gradients
cba PrReCkhdNu µ==
Coo
ling
Zon
e
Coo
ling
Zon
e
Uniform Bulk Temperature
Temperature profile after 360s simulation

Compartmental Model � Slurry (Rushton turbine)
1 2 3
456
78
9
Q1,2 Q2,3
Q3,4
Q3,7
Q3,9
Q7,8
Q8,9
Q9,1
Q4,5Q5,6
Q4,2Q6,1
Q9,2
Q5,1Q5,2
Network of ZonesNetwork of Zones
Green: Bulk Zone
Orange: Cooling Zone
Blue: Impeller Zone
Red: High Solids Content Zone
Based on CFD modelling at different crystallizer scales using a Rushton impeller
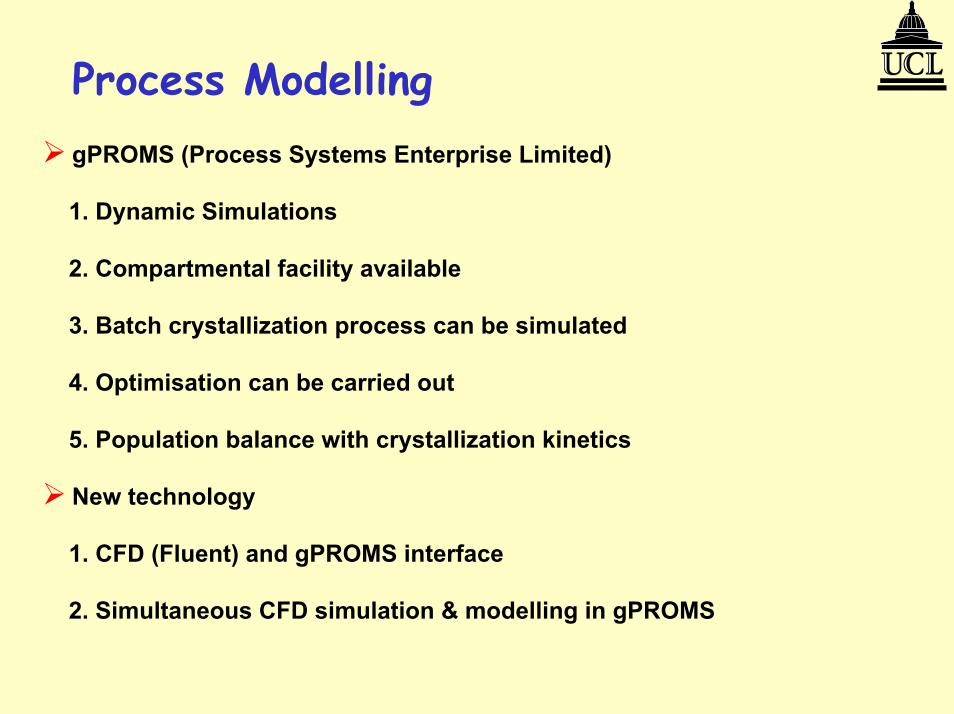
Process Modelling! gPROMS (Process Systems Enterprise Limited)
1. Dynamic Simulations
2. Compartmental facility available
3. Batch crystallization process can be simulated
4. Optimisation can be carried out
5. Population balance with crystallization kinetics
! New technology
1. CFD (Fluent) and gPROMS interface
2. Simultaneous CFD simulation & modelling in gPROMS
Simulations
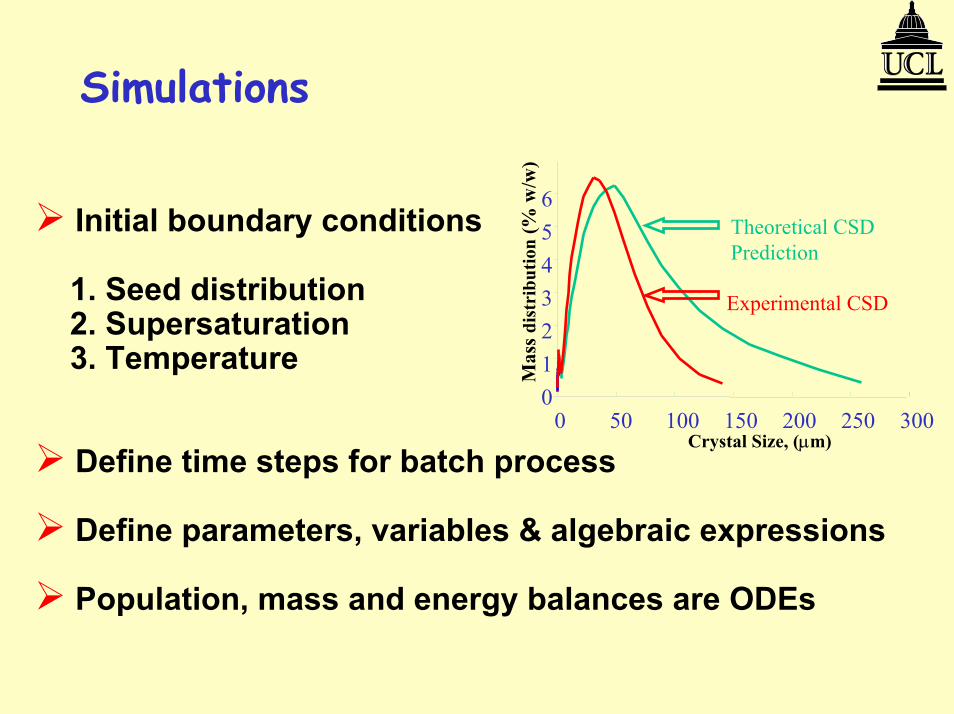
! Initial boundary conditions
1. Seed distribution 2. Supersaturation 3. Temperature
! Define time steps for batch process
! Define parameters, variables & algebraic expressions
! Population, mass and energy balances are ODEs
Experimental CSD
Theoretical CSD Prediction
0123456
0 50 100 150 200 250 300Crystal Size, (µm)
Mas
s dis
trib
utio
n(%
w/w
)

A better way�..?
Scale out, rather than up

Segmented Flow Tubular Reactor (SFTR). After Lemaître et al.
Reagents are mixed and formed into well-mixed mini crystallizer droplets within a segmenting fluid, which are subsequently separated
Donnet, M., P. Bowen, N.Jongen, J. Lemaître, H. Hofmann, A. Schreiner, A.G. Jones, R. Schenk, C. Hofmann and S. De Carlo. �Successful scale-up from millilitre batch optimisation to a small scale continuous production using the Segmented Flow Tubular Reactor. Example of calcium carbonate precipitation�. In Industrial Crystallization, 15-18 September 2002, Sorrento, Italy. Chemical Engineering Transactions, 3, (2002), 1353-1358.

Interdigital Micro Mixer. (After Schenck et al. )
Schenk, R., M. Donnet, V. Hessel, H. Hofmann, N. Jongen and H.Löwe, 2001. Suitability of various types of micromixers for the forced precipitation of calcium carbonate, In 5th International Conference on Microreaction Technology (IMRET 5), Strasbourg, France 27-30 May 2001.
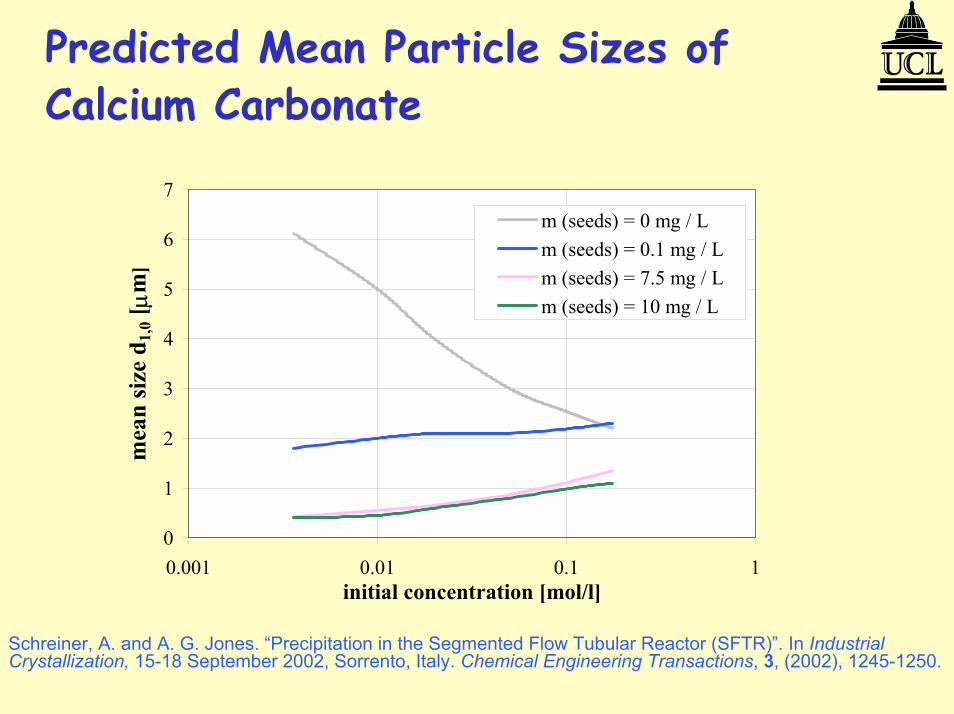
Predicted Mean Particle Sizes of Calcium Carbonate
0
1
2
3
4
5
6
7
0.001 0.01 0.1 1initial concentration [mol/l]
mea
n si
ze d
1,0 [µm
]
m (seeds) = 0 mg / Lm (seeds) = 0.1 mg / Lm (seeds) = 7.5 mg / Lm (seeds) = 10 mg / L
Schreiner, A. and A. G. Jones. �Precipitation in the Segmented Flow Tubular Reactor (SFTR)�. In Industrial Crystallization, 15-18 September 2002, Sorrento, Italy. Chemical Engineering Transactions, 3, (2002), 1245-1250.

Crystals From the SFTR
a). Vaterite b). Y-Ba oxalate.
(Courtesy www.bubbletube.com)

Conclusions! New computational techniques for the analysis and design of
systems for the manufacture of particulate crystals have become available
! The more complex precipitation processes whereby crystallization follows fast chemical reactions have also been analysed more deeply
! This progress has been aided by the growing power of the population balance and kinetic models, CFD and mixing theory, respectively
! Further progress may reasonably be expected in the development of computer models, software and hardware
! Alternative techniques are under development to avoid mixing problems and obtain efficient processes and high quality products