Embed Size (px)
Citation preview
Crystallite Width Determines Monolayer Hydration across a WideSpectrum of Celluloses Isolated from PlantsCarlos Driemeier* and Juliano Bragatto†
Laboratorio Nacional de Ciencia e Tecnologia do Bioetanol − CTBE/CNPEM Caixa Postal 6170, 13083-970, Campinas, Sao Paulo,Brazil
*S Supporting Information
ABSTRACT: Relating cellulose structure to its water uptake is aclassical problem with many investigations done through measure-ments of cellulose “crystallinity”. However, there is presently a growingconsensus that crystallinity measurements are appreciably uncertain,leading to ambiguous interpretations of underlying celluloseorganization. In this scenario, this article revisits the relations betweencellulose structure and water uptake, moving the emphasis away fromdegree of crystallinity and directing it toward crystallite width, which isinferred with less ambiguity from the broadening of 200 X-raydiffraction peaks. With this approach, analysis of a wide spectrum of celluloses isolated from plants (preserving cellulose I phaseand having variable contents of residual hemicelluloses) reveals a simple linear relation (R2 = 0.98) between reciprocal crystallitewidth and monolayer hydration (determined from vapor sorption). The primary role of crystallite width supports that mostwater-accessible polysaccharides are laterally associated with the crystallites, with a minor fraction in disordered domains alongthe fibrils. Furthermore, the secondary role left to hemicellulosic contents indicates cellulose being partly decrystallized tocomplement the disordered amount required to interface the crystallites. Finally, a substantial part of hydration is attributed topolysaccharides in voids left by the imperfect packing of aggregated crystallites.
1. INTRODUCTION
Water is ubiquitous, and cellulose is the most abundantbiopolymer on Earth. These two components interact in scalesthat span water hydrogen bonding to cellulose (molecularscale), water filling of cellulose pores (capillarity), andmacroscopic cellulose volume gains (swelling). This briefpresentation highlights that cellulose−water interactions havemajor fundamental as well as technological importance. Againstthis panorama, the present study is focused on the cellulose firsthydration layer, the so-called monolayer (ML), which estimatesthe amount of water in direct molecular contact with the solidmatrix. Furthermore, for reasons that will be explained, thescope of the article is limited to processed plant celluloses thatretain the native crystal phase (cellulose I), which is stabilized1,2
in the structure of cellulose Iβ.3
In plant cell walls, hydration takes place between cellulosemicrofibrils, spacing them apart from one another. This is themicroscopic phenomenon behind the directional (perpendicu-lar to microfibrils) hygroexpansion of woods4 and movementsof plant organs induced by changes in relative humidity (RH).5
In systems with paralleled and regularly packed microfibrils,center-to-center microfibril distances (3−5 nm) have beenestimated by small-angle X-ray or neutron scattering. Increasingmicrofibril distances due to hydration were observed for sprucewood6 and celery collenchyma.7 In these materials, cellulosemicrofibrils may be primarily spaced by matrix components(hemicelluloses, lignin, pectins), and the observed interfibrillarhydration may be specific to these interfibrillar matrixes. For
cellulose isolated from celery collenchyma, however, appreci-able microfibril spacing upon hydration was not observed.7
With a different approach that employed inelastic neutronscattering, a common dynamic signature was observed fordisordered, water-accessible regions of several native cellu-loses.8
In other purer forms of cellulose, early attempts tounderstand water uptake assumed water sorption primarily onthe “amorphous” fraction of cellulose. On the basis of thisassumption, Hailwood and Horrobin9 analyzed vapor sorption(VS) isotherms with their polymer hydration model, and usedthe results to infer the degree of crystallinity of cotton cellulose.Following a similar line of thought, Hermans and Wei-dinger10,11 applied their X-ray diffraction (XRD) method forestimation of the cellulose degree of crystallinity and relatedthis property with water gains (in 65% RH) in raw and acid-hydrolyzed ramie cellulose. These early works, however,explored little of cellulose structural variability.More recently, water sorption in cellulose was investigated
across a wider structural spectrum, including microcrystallineand decrystallized (by milling) celluloses isolated from plants aswell as celluloses from algae.12,13 For plant celluloses, areasavailable for water sorption (∼100 m2/g) were 2 orders ofmagnitude higher than areas available for nitrogen sorption (∼1
Received: October 8, 2012Revised: December 10, 2012Published: December 20, 2012
Article
pubs.acs.org/JPCB
© 2012 American Chemical Society 415 dx.doi.org/10.1021/jp309948h | J. Phys. Chem. B 2013, 117, 415−421
m2/g, measured in dry samples). This was explained byinterfibrillar penetration of water but not of nitrogen. InStrømme et al.,14 fractal dimensions were included in sorptionanalysis. In Mihranyan et al.,12 ML hydration was shown toinversely depend on cellulose crystallinity index, as measured bythe peak-high Segal method.15
A major limitation of the studies presented in the last twoparagraphs is that they rely on measurements of cellulose“crystallinity”. These measurements are highly uncertain andelusive, with results strongly dependent on the measurementmethod.16 Concerning analysis by XRD, our research group hasrecently shown17 the critical corrections for preferentialorientation, incoherent scattering, and moisture content,necessary if degree of crystallinity as mass-fraction crystalcontent is to be obtained. The importance of peak profilefunctions used in XRD modeling has also been recognized,17,18
as previously noted by Hindeleh and Johnson.19 Furthermore,the “amorphous” components associated with cellulose arepreferentially aligned to the crystallites20,21 and do notcorrespond to the ideal isotropic amorphous lacking long-range atomic order. Hence, the “amorphous” contribution todiffraction patterns should be judged with care. Other commonanalysis of cellulose crystallinity is done in the C4 spectralregion of 13C solid-state nuclear magnetic resonance (NMR).In this technique, part of the “amorphous” signal is due tocellulose chains at crystallite surfaces,22 which, from an XRDperspective, likely take part of the crystals. Indeed, by exploitingNMR relaxation times, the ratio between NMR signals ofcrystal cores and surfaces was shown to be well correlated withthe width of crystallites measured by XRD.23
Mean crystallite width can be inferred from broadeninganalysis of equatorial X-ray diffraction peaks. Crystallite widthdepends on source and processing of plant cellulose. Width is≈3 nm in raw lignocellulose, increases upon pulping and acidhydrolysis, and is even wider (up to ≈9 nm) in raw and treatedcotton cellulose.18,24,25 In plant cell walls, cellulose is thought tobe synthesized by individualized rosettes, forming individu-alized microfibrils.26 Crystallites ≈3 nm wide are broadlyconsistent with 24−36 cellulose chains synthesized within arosette.6 Nevertheless, the wider crystallites found in cotton,bast fibers, tension wood, and celluloses isolated fromlignocellulose are not consistent with this picture. Concerningcrystallite widening in wood pulping, Ioelovitch24 argued thatcellulose microfibrils lose their individuality. Reduction ofcrystallite specific surface area is likely a thermodynamic driverfor crystallite widening, but mechanisms of widening remainunclear. Lower amounts of noncellulosic components (in theraw cell wall or after processing) is usually a condition foundassociated to wider cellulose crystallites.18,24,27
The present article compares monolayer hydration deter-mined by vapor sorption to degree of crystallinity and crystallitewidth determined by X-ray diffraction. Uncertainties in degreeof crystallinity are explicitly recognized. Hence, differing fromprevious studies, relations between cellulose structure andwater uptake are focused on crystallite width, which isestimated with less ambiguity. With this approach, analysis ofa wide spectrum of celluloses isolated from plants presents asimple linear relation (R2 = 0.98) between ML hydration andreciprocal crystallite width. Aided by estimates of degree ofcrystallinity, implications of this finding are discussed.
2. MATERIALS AND METHODS
2.1. Cellulose Samples. Celluloses were acquired fromcommercial suppliers, kindly provided by collaborators, orprocessed in our laboratory. From Sigma-Aldrich (catalog codein parentheses), we acquired Fluka cellulose (22183), Sigmacelltype 20 (S3504), Sigmacell type 50 (S5504), Avicel PH-101(11365), Sigmacell type 101 (S6790), and α-cellulose (C8002).In addition, we acquired Celufloc 200 (from Celuflok),Whatman #1 filter paper, and two bleached Eucalyptus kraftpulps (from Brazilian mills). A bleached Eucalyptus pulpproduced in subcritical ethanol−water−CO2 mixture28 waskindly provided by Dra. M. T. B. Pimenta. Peracetic pulps fromsugar cane bagasse were produced in a 1:1 mixture of 8.74 Mglacial acetic acid and 21.6 M hydrogen peroxide at 60 °C for15, 24, or 48 h. These 14 materials were named Fluka, S20, S50,Avicel, S101, Alpha, Floc, FP, Ekp1, Ekp2, Esc, Bpa15, Bpa24,and Bpa48, respectively. All samples were handled in laboratoryatmosphere, becoming air-dried before XRD and VS analysis.The samples form a heterogeneous set that is appropriate toexplore relations valid across a wide spectrum of materials.
2.2. Compositional Analysis. Material composition wasmeasured by a standard protocol29 in which the solid sampleswere submitted to two-step analytical acid hydrolysis. Sugarconcentrations in the hydrolysates (cellobiose, glucose, xylose,arabinose, galactose, and mannose) were measured by liquidchromatography and converted to dry-basis (g/g) cellulose andhemicellulose contents in the solids. The standard protocol29
was modified to replace the corrective sugar recovery standardsby measured concentrations of glucuronic, formic, and aceticacids, furfural and hydroxymethylfurfural.
2.3. X-ray Diffraction. XRD was performed as in previousstudies.17,18 Air-dried samples were conditioned in capillarytubes and analyzed in fiber geometry using a Rigaku ultraX-18HF rotating anode generator with Cu Kα radiation (λ =1.5418 Å), VariMax HR monochromating optics, and mar345image plate (positioned 120 mm behind samples). The two-dimensional diffraction patterns were analyzed by the Rietveldmethod30 using the MAUD program.31 The degree ofcrystallinity, defined as crystal mass per sample dry mass, wasestimated following previous developments,17 which includedcorrections for incoherent scattering, sample moisture content,crystal texture, blank intensity, and X-ray absorption.In the employed Rietveld procedure, line-broadening analysis
accounted for instrumental as well as specimen contributions.Instrumental line broadening was calibrated with α-alumina.Specimen line broadening for the major equatorial peaks (110,110, and 200) was modeled by Lorentzian profiles, followingthe Delft line-broadening model.32 Mean crystallite width in the[200] direction (L200) was derived from the Rietveld analysis,which had been verified to employ the Scherrer equation
λθ
=LK
B cos200200 (1)
where B200 is the full width at half-maximum of the specimencontribution to the 200 peak width and the shape factor is K =1.1.
2.4. Vapor Sorption. VS analysis was performed in aQ5000 SA (from TA Instruments) instrument, as detailedelsewhere.33 Samples of about 5 mg held in a metalized quartzpan were initially equilibrated at 50 °C, 0.95 RH. Then, the RHwas stepped down for water desorption and, after completesample drying, RH was stepped up for water sorption. Sample
The Journal of Physical Chemistry B Article
dx.doi.org/10.1021/jp309948h | J. Phys. Chem. B 2013, 117, 415−421416

mass was monitored continuously. Each RH step took 60 min,except at RH = 0, which was kept for 180 min to improve thedefinition of sample dry mass. Desorption and sorptionisotherms were built from water contents (per unit of drymass) at the end of each RH step.Desorption and sorption isotherms were analyzed by the
Brunauer−Emmett−Teller (BET)34 and the Hailwood−Horrobin (HH)9 models. The BET model analyzes isothermsthrough two coefficients: ML mass and ML interactionconstant. To generate satisfactory fits, application of the BETmodel was restricted to RH ≤ 0.4. The HH model analyzesisotherms through three coefficients: ML mass, ML interactionconstant, and an additional interaction constant for the so-called dissolved water (beyond ML water). Hence, the HHmodel, with its additional coefficient, provided a more completedescription of hydration. The HH model was applied to RH ≤0.8. Application of the HH model to sorption analysis ofcelluloses was further detailed elsewhere.33 For a review ofhydration models, see the book by Skaar.4
3. RESULTSFigure 1 compares diffractograms and water sorption isothermsfrom selected samples. The diffractograms are presented in the
region of 110, 110, and 200 equatorial reflections, from wherecrystallite widths can be derived by application of the Scherrerequation. The 200 peak is the best to estimate crystallite widthbecause this peak is more intense and peak overlapping is notcritical as it is for 110 and 110. Moreover, diffractograms ofFigure 1 evidence that width changes in 200 peaks areconcomitant to width changes in 110 and 110 peaks (theSupporting Information compares inferred crystallite widths).Crystallite width L200 is, therefore, representative of crystallite
lateral dimensions. Since 110 and 110 widths are harder toquantify because of overlapping, L200 is the only widthemployed henceforth. Figure 1 also evidences that less wateris sorbed in samples presenting sharper 200 diffraction peaks(due to wider crystallites). However, differences in watercontents among samples are modest compared to differences in200 peak width.The investigated sample set nearly covers the full range of
crystallite width observed in cellulose isolated from plants, withmeasured L200 between 3.2 and 9.1 nm (see Table 1). In oneextreme (L200 < 4.0 nm), crystallites from S101 and Bpa15,Bpa24, and Bpa48 are only slightly wider than in rawlignocellulose. In the other extreme (L200 > 6.0 nm), FP,Avicel, and Fluka are made from cotton linters (as informed bymanufacturers) and, because of structural and compositionalsimilarities (see Table 1), S20 and S50 are presumed to be fromcotton linters as well. Regarding composition, for all samples,the major component is cellulose (0.68−0.99 g/g), comple-mented by hemicelluloses (0.02−0.29 g/g), with xylan beingthe major hemicellulose of all samples. Contents of total lignin,insoluble (acid insoluble residue subtracted out of ash content)plus soluble (measured by ultraviolet absorbance), arenegligible (<0.01 g/g). Part of the data from Table 1 waspublished previously in different contexts.33,35 (Note: adifferent method of compositional analysis was employed inref 35.)Figure 2 compares three estimates of water ML, shown as a
function of reciprocal crystallite width (later the reason for thishorizontal axis will become clear). The first estimate is waterML determined from sorption isotherms with the HH model,and the second, with the BET model. It is noteworthy that theBET model has been criticized13,36 because its assumption ofmultilayer sorption is unrealistic at solid−solid interfaces. Thethird estimate is direct reading of sorption isotherms at 0.3 RH.This RH was chosen because, at low RH, water content isdominated by ML, while, at higher RH, capillarity (pore water)is increasingly important.13,33 Precisions (1σ) in these measure-ments of water content are better than 0.0006 g/g, as inferredfrom replicate analyses.The three measurements of water content (Figure 2) present
the same basic trend: a linear relation with positive interceptand slope and high coefficient of determination (R2 ≥ 0.95).Indeed, analysis of desorption (instead of sorption) isothermsshows a similar linear trend, but coefficients of determinationare lower (R2 = 0.91 for the HH model, based on the data ofTable 1). This is attributed to the influence (in desorptionanalysis) of water pockets inherited from water-swollen states.33
Considering the general agreement of the different water MLestimates, the discussion follows based on the observed ML ×1/L200 linear trend with positive intercept and slope. Moreover,henceforth we discuss only water ML determined by the HHmodel (more complete and appropriate model) applied tosorption isotherms (less influenced by water in pores). Thisestimate of water ML has the best linearity with 1/L200 (R
2 =0.98, see Figure 2).One important consideration is that crystallite width derived
by XRD accounted for instrumental broadening (see Materialsand Methods), but polymers have an additional contribution todiffraction peak broadening due to defects of the second kind(paracrystallinity).37 Paracrystallinity is here understood asfluctuations of interplanar spacing within a crystallite, not thedisordered regions at a cellulose crystallite surface, which aresometimes termed “paracrystalline”.38 Following the ideal
Figure 1. X-ray diffractograms and vapor sorption isotherms forselected samples. To ease visual comparison, presented diffractograms(top) are those with closest similarity to isotropic reconstructions ofexperimentally anisotropic (due to cellulose preferential orientation)area-detector diffraction patterns; in addition, presented diffractogramsare subtracted out of Rietveld-resolved backgrounds and arenormalized to equal peak areas. Sorption isotherms (bottom) showexperimental data (symbols) and fits with the Hailwood−Horrobinmodel (lines).
The Journal of Physical Chemistry B Article
dx.doi.org/10.1021/jp309948h | J. Phys. Chem. B 2013, 117, 415−421417

paracrystal model,39 paracrystalline broadening is proportionalto g2/d, where g is the paracrystalline distortion parameter andd is the interplanar spacing. However, g also follows a scalinglaw (named the α* relation),39 g2 = α*2d/L, where α* is aconstant and L is the mean crystallite size. Therefore,paracrystalline broadening is also proportional to 1/L, as sizebroadening is, and, for a given hkl reflection, paracrystallinebroadening makes an approximate constant fraction of peakwidth. That is, the primary effect of paracrystallinity is toincrease K in eq 1, and correcting L200 for paracrystallinitywould change the ML × 1/L200 slope but would preserve itsintercept (see Figure 2).
An implication of the remarkable ML × 1/L200 linear trend isthe secondary role left to hemicellulose content as a variableexplanatory of water uptake. This may contradict expectations,because hemicelluloses are presumably “amorphous” andhydrated. The secondary role of composition is furtherevidenced in two ways. First, there is a minor deviation fromthe ML × 1/L200 linear trend upon crossing the vertical greenline of Figure 2, which marks a step change in hemicellulosecontent. (The line divides celluloses from cotton and fromlignocellulose.) Second, a linear fit to water ML × hemi-cellulose content (Figure 3) brings a comparatively modest
coefficient of determination (R2 = 0.75). It is worth recallingthat a low amount of noncellulosic components is a conditiontypically found associated to wider cellulose crystallites.18,24,27
Hence, the existing correlation between water ML andhemicellulose content (Figure 3) is likely a consequence ofthis association between composition and crystallite width.Finally, there is substantial variation in water ML that appearsuncorrelated to hemicellulose contents between 0.15 and 0.20g/g (see Figure 3). Quantitative discrimination between theprimary role of crystallite width and the secondary role ofhemicellulose content may be achievable assuming a multi-variate model for hydration, which is beyond the scope of thepresent study.Measurements of the degree of crystallinity can provide
further insight about the pattern of water sorption in celluloses.
Table 1. Complete Data Set Discussed in the Article, with Parameters from X-ray Diffraction (Crystallite Width L200 and Degreeof Crystallinity xcr), Vapor Sorption (Hailwood−Horrobin Monolayer (HH ML), Brunauer−Emmett−Teller Monolayer (BETML), Water Content at 0.3 Relative Humidity (RH), and Hailwood−Horrobin Monolayer from Desorption (HH MLd)), andComposition (Cellulose and Hemicellulose Contents)
X-ray diffraction vapor sorption composition
sample L200 (nm) xcr (g/g) HH ML (g/g) BET ML (g/g) @0.3 RH (g/g) HH MLd (g/g) cellulose (g/g) hemi (g/g)
S101 3.20 0.49 0.0530 0.0397 0.0415 0.0650 0.764 0.194Bpa15 3.28 0.61 0.0507 0.0381 0.0395 0.0617 0.679 0.285Bpa24 3.56 0.68 0.0494 0.0367 0.0378 0.0583 0.761 0.251Bpa48 3.75 0.65 0.0489 0.0369 0.0389 0.0562 0.803 0.196Alpha 4.50 0.56 0.0440 0.0327 0.0346 0.0509 0.810 0.199Floc 5.42 0.72 0.0423 0.0316 0.0339 0.0481 0.857 0.146Ekp1 5.43 0.76 0.0422 0.0326 0.0339 0.0489 0.827 0.168Ekp2 5.61 0.84 0.0416 0.0324 0.0344 0.0476 0.830 0.148Esc 5.29 0.69 0.0411 0.0315 0.0336 0.0463 0.941 0.054S20 6.15 0.78 0.0391 0.0292 0.0315 0.0429 0.955 0.025S50 6.22 0.85 0.0387 0.0289 0.0312 0.0424 0.941 0.036Fluka 6.15 0.81 0.0386 0.0288 0.0314 0.0418 0.972 0.023Avicel 6.10 0.80 0.0383 0.0290 0.0314 0.0430 0.985 0.024FP 9.12 0.76 0.0344 0.0268 0.0279 0.0441 0.940 0.025
Figure 2. Water content versus reciprocal crystallite width 1/L200.Water contents are presented in units of water mass per sample drymass (g/g) as well in units of water molecules per anhydroglucose unit(H2O/C6H10O5), as converted by formula masses. Water contents aremonolayers derived from sorption isotherms by employing theHailwood−Horrobin (HH) model (top) or the Brunauer−Emmett−Teller (BET) model (middle), or simply water contents measured in0.3 relative humidity (RH) (bottom). The vertical green line marks astep change in hemicellulose contents. Red lines are linear fits whosecoefficients of determination (R2) are indicated.
Figure 3. Monolayer water versus hemicellulose content. Monolayerwater was derived by analyzing sorption isotherms with theHailwood−Horrobin (HH) model. The red line is a linear fit whosecoefficient of determination (R2) is indicated.
The Journal of Physical Chemistry B Article
dx.doi.org/10.1021/jp309948h | J. Phys. Chem. B 2013, 117, 415−421418
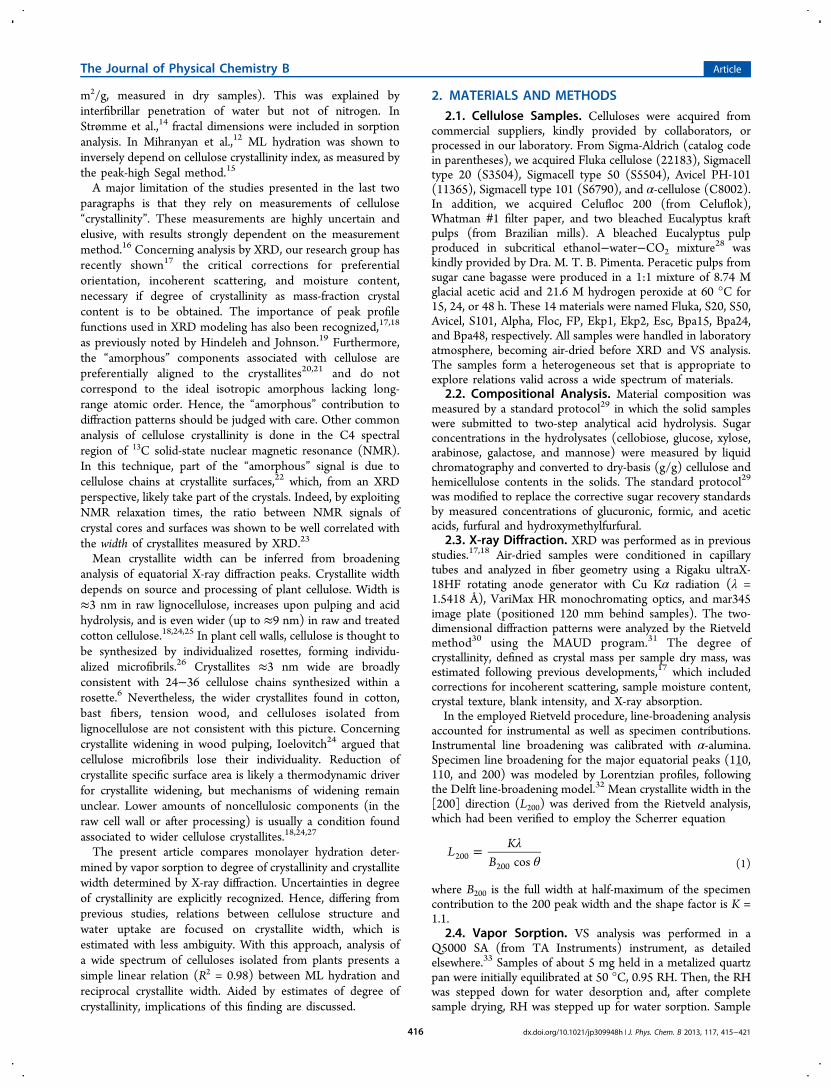
Figure 4 presents degree of crystallinity versus 1/L200. The y-axis scale is inverted so amorphous (noncrystalline) contents in
Figure 4 can be visually compared to water contents in Figure2. Before discussing measured degrees of crystallinity, one mustrecognize that their uncertainties are much larger than for waterML and L200. In Figure 4, error bars for 1/L200 (horizontal) anddegree of crystallinity (vertical) are 1σ precisions inferred fromrepeated measurements with the constant analytical procedure.The error bars do not account for uncertainty in peak profilefunctions, recognized17−19 to be significant for cellulosecrystallinity measurements. The horizontal error bars typicallyincrease with 1/L200 because broader XRD peaks are poorlydefined. Furthermore, 1/L200 precision is poorer when inferredfrom more isotropic two-dimensional XRD patterns (lesscrystallite texture). This is the case of the S101 sample thatpresents the larger 1/L200 error bars (topmost data point ofFigure 4).Three features related to degree of crystallinity are worth
noting. First, degrees of crystallinity are equal or lower thancellulose contents (inset of Figure 4), indicating the presence ofamorphous cellulose in addition to noncellulosic amorphous.Therefore, amorphous (and presumably hydrated) polysac-charides include amorphous cellulose, which explains thesecondary role that hemicellulose content per se has on wateruptake. Second, there is no substantial change in degree ofcrystallinity upon crossing the vertical green line of Figure 4,which marks a step change in hemicellulose content. Thissuggests that amorphous cellulose is complementing amor-phous hemicellulose, possibly to yield a required amount oftotal amorphous. Third, data points in Figure 4 present apositive slope consonant with the positive slope observed inFigure 2. This slope indicates amorphous polysaccharidesassociated with crystallite surfaces. Dispersion of data pointsaround the fitted line and the associated modest coefficient ofdetermination (R2 = 0.64) may primarily result fromuncertainties in degree of crystallinity measurements.
4. DISCUSSION
4.1. Implications of the Primary Role of CrystalliteWidth. Figure 2 evidences that ML hydration is primarilydetermined by crystallite width, which is a lateral dimension ofthe crystallites. The role of crystallite width on cellulosehydration was earlier proposed by Kocherbitov et al.;13 theyhowever did not include in the model the positive interceptspresented in Figure 2. The primary role of crystallite width is anotable evidence that hydration is majorly associated to thesides of the crystallites, with minor fraction in disordereddomains along the fibrils. In numerical terms, R2 = 0.98indicates that approximately 98% of the variance in MLhydration is explained by crystallite width alone, with 2% left toother uncorrelated sources of variance (including finiteexperimental precision). Hence, hydration in sites unassociatedto crystallite sides would be limited to about a few percent ofthe total hydration. Our result is in agreement with thequantitative investigation40 of disordered regions along ramiemicrofibrils, which evidenced that disordered domains arelimited to a few percent of microfibril lengths. Our findingextends the evidence to a much broader spectrum of celluloses.Associated with the issue of disordered domains along fibrils,
there is controversy about the typical length of cellulosecrystallites. XRD line broadening analysis reports crystallites20−40 nm long,25 but these lengths may be criticallyunderestimated because other contributions to broadening(microstrain, paracrystallinity, crystallite twist) are of magni-tudes comparable to size broadening. Alternatively, judgingfrom the lengths of isolated nanoparticles41−43 and from theperiodicity of disordered regions along ramie microfibrils,40
crystallite lengths are estimated to be of the order of hundrednanometers. Our results are better consistent with such longercrystallites.For ML hydration, hemicellulose content has a role
secondary to crystallite width, which may be surprising becausehemicelluloses are thought to be “amorphous” and hydrated.Our results do not contradict that hemicelluloses areamorphous and hydrated. They rather reveal that celluloseitself may be as amorphous and hydrated as hemicelluloses are.We understand that “amorphousness” is a structural require-ment associated with interfaces between crystallites. Whereverrequired, cellulose is partly decrystallized to complementhemicelluloses, forming the total amount of disorderedpolysaccharide required to interface neighbor crystallitesaggregated into bundles.
4.2. Specificities of Celluloses Isolated from Plants.The scope of the present work is limited to celluloses isolatedfrom plants, having cellulose I crystal phase and negligiblelignin. In addition to the high aspect ratio (length/width) of thecrystallites, there are other key specificities to explain theobserved relation between crystallite width and ML hydration.(i) Since celluloses were processed, compounds in highlyreactive configurations were likely removed, leaving the lessreactive configurations, which tend to be those condensed inthe solid state. (ii) Since lignin content is negligible, materialsare majorly made of structural polysaccharides (cellulose andhemicelluloses). Their molecular features critical for watersorption (e.g., per-mass sites for hydrogen bonding) are quitesimilar, with the dominant difference relating to their packing(or not) into crystallites. (iii) Crystallite aggregation intobundles (also termed aggregates or macrofibrils)44−47 seems tobe intrinsic to plant cellulose (but not necessarily to other
Figure 4. Degree of crystallinity versus reciprocal crystallite width1/L200. The y-axis scale is inverted, so amorphous content increases tothe top. The vertical green line marks a step change in hemicellulosecontent. The red line is a linear fit whose coefficient of determination(R2) is indicated. Error bars are 1σ precisions, as inferred fromreplicated analysis. The inset presents the degree of crystallinity versuscellulose content (y-axis scale not inverted), with data points at orbelow the y = x line.
The Journal of Physical Chemistry B Article
dx.doi.org/10.1021/jp309948h | J. Phys. Chem. B 2013, 117, 415−421419
cellulose sources). Furthermore, crystallite aggregation isenhanced44 in the experiments because sorption isothermsstart from dried celluloses.4.3. Geometric Model of Crystallite Bundles. The
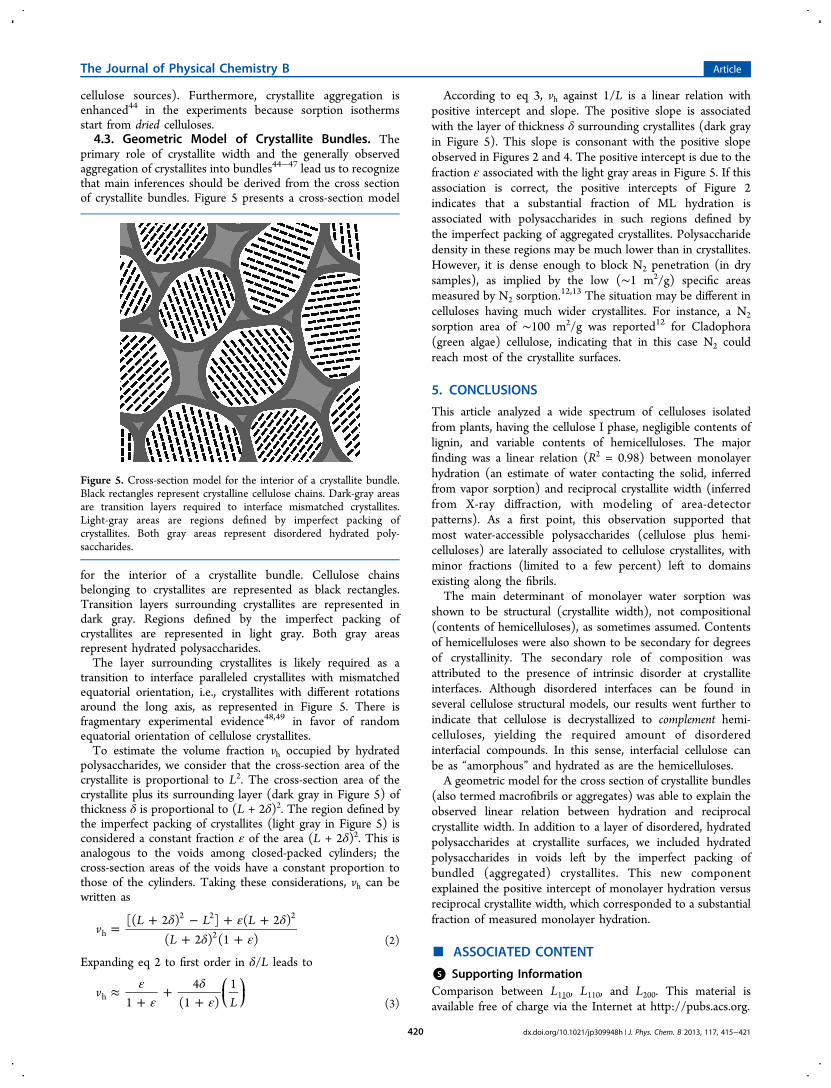
primary role of crystallite width and the generally observedaggregation of crystallites into bundles44−47 lead us to recognizethat main inferences should be derived from the cross sectionof crystallite bundles. Figure 5 presents a cross-section model
for the interior of a crystallite bundle. Cellulose chainsbelonging to crystallites are represented as black rectangles.Transition layers surrounding crystallites are represented indark gray. Regions defined by the imperfect packing ofcrystallites are represented in light gray. Both gray areasrepresent hydrated polysaccharides.The layer surrounding crystallites is likely required as a
transition to interface paralleled crystallites with mismatchedequatorial orientation, i.e., crystallites with different rotationsaround the long axis, as represented in Figure 5. There isfragmentary experimental evidence48,49 in favor of randomequatorial orientation of cellulose crystallites.To estimate the volume fraction vh occupied by hydrated
polysaccharides, we consider that the cross-section area of thecrystallite is proportional to L2. The cross-section area of thecrystallite plus its surrounding layer (dark gray in Figure 5) ofthickness δ is proportional to (L + 2δ)2. The region defined bythe imperfect packing of crystallites (light gray in Figure 5) isconsidered a constant fraction ε of the area (L + 2δ)2. This isanalogous to the voids among closed-packed cylinders; thecross-section areas of the voids have a constant proportion tothose of the cylinders. Taking these considerations, vh can bewritten as
δ ε δδ ε
= + − + ++ +
vL L L
L[( 2 ) ] ( 2 )
( 2 ) (1 )h
2 2 2
2 (2)
Expanding eq 2 to first order in δ/L leads to
εε
δε
≈+
++
⎜ ⎟⎛⎝
⎞⎠v
L14
(1 )1
h(3)
According to eq 3, vh against 1/L is a linear relation withpositive intercept and slope. The positive slope is associatedwith the layer of thickness δ surrounding crystallites (dark grayin Figure 5). This slope is consonant with the positive slopeobserved in Figures 2 and 4. The positive intercept is due to thefraction ε associated with the light gray areas in Figure 5. If thisassociation is correct, the positive intercepts of Figure 2indicates that a substantial fraction of ML hydration isassociated with polysaccharides in such regions defined bythe imperfect packing of aggregated crystallites. Polysaccharidedensity in these regions may be much lower than in crystallites.However, it is dense enough to block N2 penetration (in drysamples), as implied by the low (∼1 m2/g) specific areasmeasured by N2 sorption.
12,13 The situation may be different incelluloses having much wider crystallites. For instance, a N2
sorption area of ∼100 m2/g was reported12 for Cladophora(green algae) cellulose, indicating that in this case N2 couldreach most of the crystallite surfaces.
5. CONCLUSIONS
This article analyzed a wide spectrum of celluloses isolatedfrom plants, having the cellulose I phase, negligible contents oflignin, and variable contents of hemicelluloses. The majorfinding was a linear relation (R2 = 0.98) between monolayerhydration (an estimate of water contacting the solid, inferredfrom vapor sorption) and reciprocal crystallite width (inferredfrom X-ray diffraction, with modeling of area-detectorpatterns). As a first point, this observation supported thatmost water-accessible polysaccharides (cellulose plus hemi-celluloses) are laterally associated to cellulose crystallites, withminor fractions (limited to a few percent) left to domainsexisting along the fibrils.The main determinant of monolayer water sorption was
shown to be structural (crystallite width), not compositional(contents of hemicelluloses), as sometimes assumed. Contentsof hemicelluloses were also shown to be secondary for degreesof crystallinity. The secondary role of composition wasattributed to the presence of intrinsic disorder at crystalliteinterfaces. Although disordered interfaces can be found inseveral cellulose structural models, our results went further toindicate that cellulose is decrystallized to complement hemi-celluloses, yielding the required amount of disorderedinterfacial compounds. In this sense, interfacial cellulose canbe as “amorphous” and hydrated as are the hemicelluloses.A geometric model for the cross section of crystallite bundles
(also termed macrofibrils or aggregates) was able to explain theobserved linear relation between hydration and reciprocalcrystallite width. In addition to a layer of disordered, hydratedpolysaccharides at crystallite surfaces, we included hydratedpolysaccharides in voids left by the imperfect packing ofbundled (aggregated) crystallites. This new componentexplained the positive intercept of monolayer hydration versusreciprocal crystallite width, which corresponded to a substantialfraction of measured monolayer hydration.
■ ASSOCIATED CONTENT
*S Supporting InformationComparison between L110, L110, and L200. This material isavailable free of charge via the Internet at http://pubs.acs.org.
Figure 5. Cross-section model for the interior of a crystallite bundle.Black rectangles represent crystalline cellulose chains. Dark-gray areasare transition layers required to interface mismatched crystallites.Light-gray areas are regions defined by imperfect packing ofcrystallites. Both gray areas represent disordered hydrated poly-saccharides.
The Journal of Physical Chemistry B Article
dx.doi.org/10.1021/jp309948h | J. Phys. Chem. B 2013, 117, 415−421420
■ AUTHOR INFORMATIONCorresponding Author*E-mail: [email protected]. Phone: +55 193518 3180. Fax: +55 19 3518 3164.Present Address†VTT Brasil − Centro de Pesquisas Tecnicas 06455-000,Barueri, Sao Paulo, Brazil.NotesThe authors declare no competing financial interest.
■ ACKNOWLEDGMENTSResearch supported by LNLS − Brazilian Synchrotron LightLaboratory and LNBio − Brazilian Biosciences NationalLaboratory (project GAR-6293), FAPESP (project 2010/05523-3), and CNPq/PNPD (project 560489/2010-2). Theauthors thank M. T. B. Pimenta for providing cellulose samplesand Danilo B. Mello for artwork.
■ REFERENCES(1) Debzi, E. M.; Chanzy, H.; Sugiyama, J.; Tekely, P.; Excoffier, G.Macromolecules 1991, 24, 6816−6822.(2) Horii, F.; Yamamoto, H.; Kitamaru, R.; Tanahashi, K.; Higuchi,T. Macromolecules 1987, 20, 2946−2949.(3) Nishiyama, Y.; Langan, P.; Chanzy, H. J. Am. Chem. Soc. 2002,124, 9074−9082.(4) Skaar, C. Wood-water relations; Springer-Verlag: Berlin, 1988.(5) Elbaum, R.; Zaltzman, L.; Burgert, I.; Fratzl, P. Science 2007, 316,884−886.(6) Fernandes, A. N.; Thomas, L. H.; Altaner, C. M.; Callow, P.;Forsyth, V. T.; Apperley, D. C.; Kennedy, C. J.; Jarvis, M. C. Proc. Natl.Acad. Sci. U.S.A. 2011, 108, E1195−1203.(7) Kennedy, C. J.; Sturcova, A.; Jarvis, M. C.; Wess, T. J. Cellulose2007, 14, 401−408.(8) Muller, M.; Czihak, C.; Schober, H.; Nishiyama, Y.; Vogl, G.Macromolecules 2000, 33, 1834−1840.(9) Hailwood, A. J.; Horrobin, S. Trans. Faraday Soc. 1946, 42,B084−B092.(10) Hermans, P. H.; Weidinger, A. J. Appl. Phys. 1948, 19, 491−506.(11) Hermans, P. H.; Weidinger, A. J. Polym. Sci. 1949, 4, 317−322.(12) Mihranyan, A.; Llagostera, A. P.; Karmhag, R.; Strømme, M.; Ek,R. Int. J. Pharm. 2004, 269, 433−442.(13) Kocherbitov, V.; Ulvenlund, S.; Kober, M.; Jarring, K.;Arnebrant, T. J. Phys. Chem. B 2008, 112, 3728−3734.(14) Strømme, M.; Mihranyan, A.; Ek, R.; Niklasson, G. A. J. Phys.Chem. B 2003, 107, 14378−14382.(15) Segal, L.; Creely, J. J.; Martin, A. E., Jr.; Conrad, C. M. Text. Res.J. 1959, 29, 786−794.(16) Park, S.; Baker, J. O.; Himmel, M. E.; Parilla, P. A.; Johnson, D.K. Biotechnol. Biofuels 2010, 3, 10.(17) Driemeier, C.; Calligaris, G. A. J. Appl. Crystallogr. 2011, 44,184−192.(18) Driemeier, C.; Pimenta, M. T. B.; Rocha, G. J. M.; Oliveira, M.M.; Mello, D. B.; Maziero, P.; Goncalves, A. R. Cellulose 2011, 18,1509−1519.(19) Hindeleh, A. M.; Johnson, D. J. Polymer 1972, 13, 423−430.(20) Olsson, A.-M.; Bjurhager, I.; Gerber, L.; Sundberg, B.; Salmen,L. Planta 2011, 233, 1277−1286.(21) Simonovic, J.; Stevanic, J.; Djikanovic, D.; Salmen, L.; Radotic,K. Cellulose 2011, 18, 1433−1440.(22) Wickholm, K.; Larsson, P. T.; Iversen, T. Carbohydr. Res. 1998,312, 123−129.(23) Newman, R. H. Solid State Nucl. Magn. Resonan. 1999, 15, 21−9.(24) Ioelovitch, M. Acta Polym. 1992, 43, 110−113.(25) Leppanen, K.; Andersson, S.; Torkkeli, M.; Knaapila, M.;Kotelnikova, N.; Serimaa, R. Cellulose 2009, 16, 999−1015.(26) Cosgrove, D. J. Nat. Rev. Mol. Cell Biol. 2005, 6, 850−861.
(27) Muller, M.; Burghammer, M.; Sugiyama, J. Holzforschung 2006,60, 474−479.(28) Pimenta, M. T. B. Utilizaca o de fluidos nos estados sub/supercriticona polpaca o de Eucalyptus grandis e Pinus taeda; Universidade de SaoPaulo: Sao Carlos, Brazil, 2005.(29) Sluiter, A.; Hames, B.; Ruiz, R.; Scarlata, C.; Sluiter, J.;Templeton, D.; Crocker, D. Determination of structural carbohydratesand lignin in biomass; Technical Report NREL/TP-510-42618, 2008.(30) Rietveld, H. M. J. Appl. Crystallogr. 1969, 2, 65−71.(31) Ferrari, M.; Lutterotti, L. J. Appl. Phys. 1994, 76, 7246−7255.(32) Delhez, R.; de Keijser, T. H.; Langford, J. I.; Louer, D.;Mittemeijer, E. J.; Sonneveld, E. J. In The Rietveld Method; Young, R.A., Ed.; Oxford University Press: New York, 1993; pp 132−166.(33) Driemeier, C.; Mendes, F. M.; Oliveira, M. M. Cellulose 2012,19, 1051−1063.(34) Brunauer, S.; Emmett, P. H.; Teller, E. J. Am. Chem. Soc. 1938,60, 309−319.(35) Bragatto, J.; Segato, F.; Cota, J.; Mello, D. B.; Oliveira, M. M.;Buckeridge, M. S.; Squina, F. M.; Driemeier, C. J. Phys. Chem. B 2012,116, 6128−6136.(36) Kocherbitov, V.; Arnebrant, T. Langmuir 2009, 26, 3918−3922.(37) Roe, R.-J. Methods of X-ray and Neutron Scattering in PolymerScience; Oxford University: New York, 2000.(38) Ioelovich, M.; Leykin, A.; Figovsky, O. BioResources 2010, 5,1393−1407.(39) Hosemann, R.; Hindeleh, A. M. J. Macromol. Sci., Part B: Phys.1995, B34, 327−356.(40) Nishiyama, Y.; Kim, U.-J.; Kim, D.-Y.; Katsumata, K. S.; May, R.P.; Langan, P. Biomacromolecules 2003, 4, 1013−1017.(41) Samir, M. A. S. A.; Alloin, F.; Dufresne, A. Biomacromolecules2005, 6, 612−626.(42) Elazzouzi-Hafraoui, S.; Nishiyama, Y.; Putaux, J.-L.; Heux, L.;Dubreuil, F.; Rochas, C. Biomacromolecules 2008, 9, 57−65.(43) Teixeira, E. M.; Bondancia, T. J.; Teodoro, K. B. R.; Correa, A.C.; Marconcini, J. M.; Mattoso, L. H. C. Ind. Crops Prod. 2011, 33,63−66.(44) Hult, E.-L.; Larsson, P. T.; Iversen, T. Polymer 2001, 42, 3309−3314.(45) Fahlen, J.; Salmen, L. Biomacromolecules 2005, 6, 433−438.(46) Zhao, H.; Kwak, J. H.; Zhang, Z. C.; Brown, H. M.; Arey, B. W.;Holladay, J. E. Carbohydr. Polym. 2007, 68, 235−241.(47) Donaldson, L. Wood Sci. Technol. 2007, 41, 443−460.(48) Revol, J.-F.; Gancet, C.; Goring, D. A. I. Wood Sci. 1982, 14,120−126.(49) Naslund, P.; Vuong, R.; Chanzy, H.; Jesior, J. C. Text. Res. J.1988, 58, 414−417.
The Journal of Physical Chemistry B Article
dx.doi.org/10.1021/jp309948h | J. Phys. Chem. B 2013, 117, 415−421421