Embed Size (px)
DESCRIPTION
Public results
Citation preview
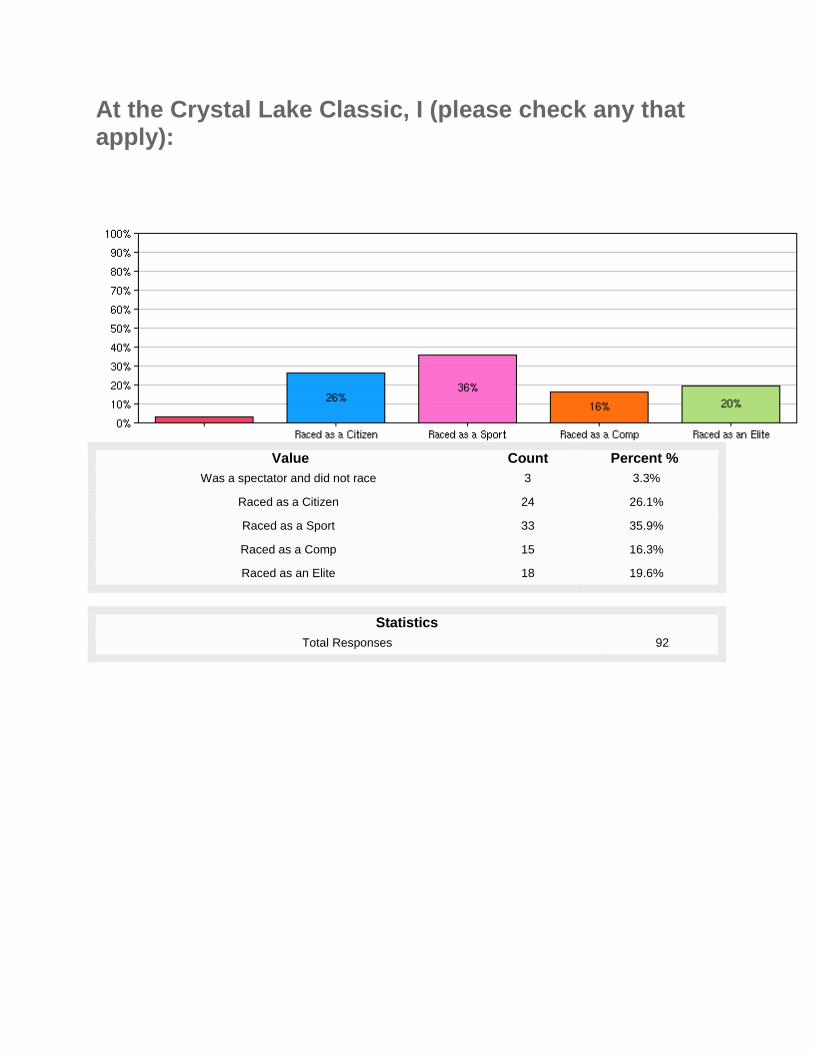
At the Crystal Lake Classic, I (please check any that apply):
Value Count Percent % Was a spectator and did not race 3 3.3%
Raced as a Citizen 24 26.1%
Raced as a Sport 33 35.9%
Raced as a Comp 15 16.3%
Raced as an Elite 18 19.6%
Statistics Total Responses 92
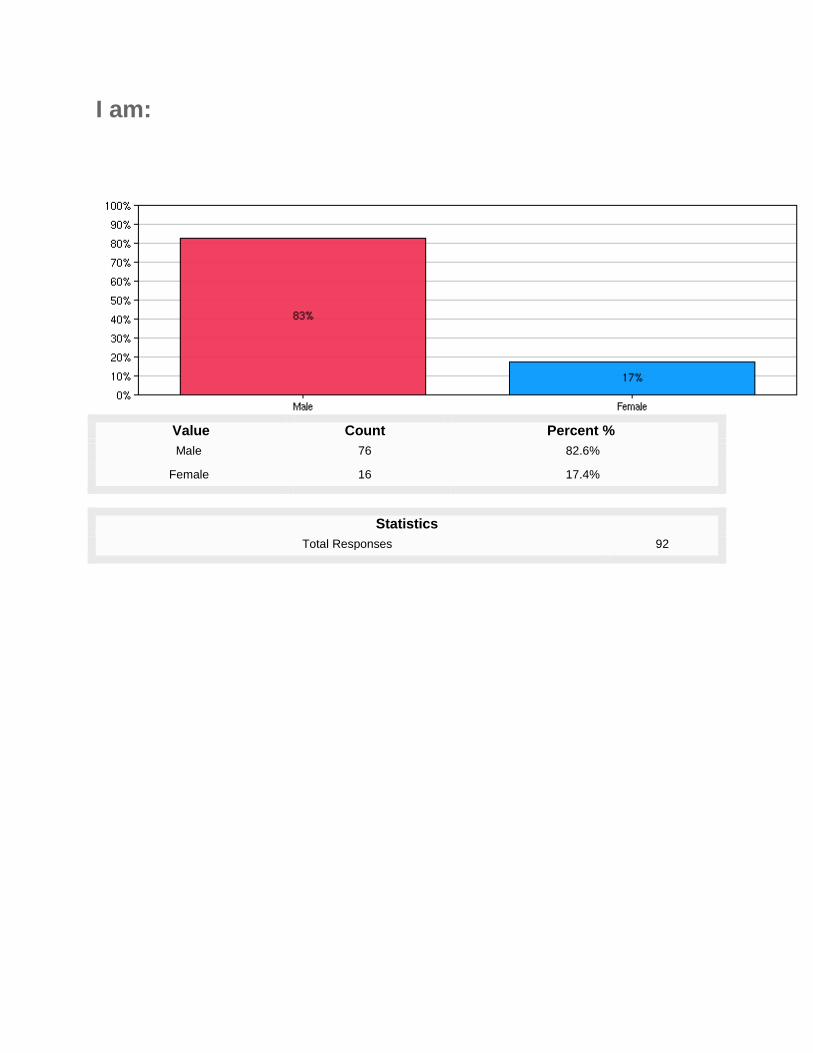
I am:
Value Count Percent % Male 76 82.6%
Female 16 17.4%
Statistics Total Responses 92
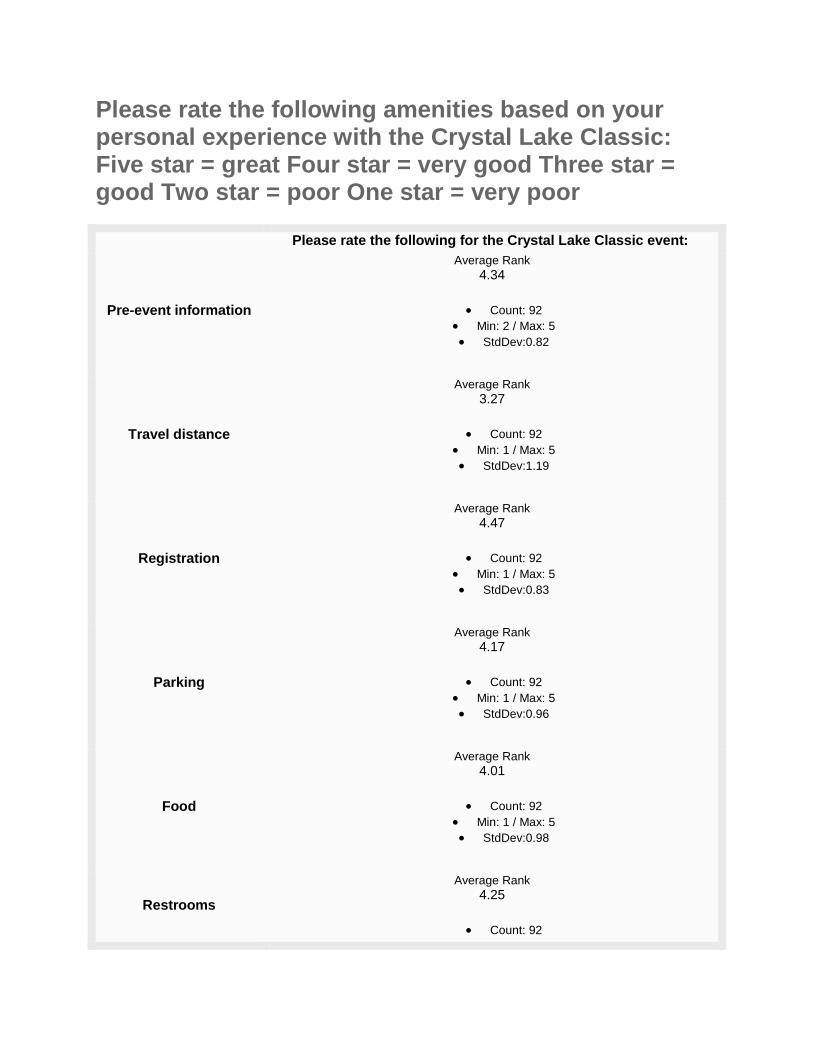
Please rate the following amenities based on your personal experience with the Crystal Lake Classic: Five star = great Four star = very good Three star = good Two star = poor One star = very poor
Please rate the following for the Crystal Lake Classic event:
Pre-event information
Average Rank 4.34
• Count: 92 • Min: 2 / Max: 5 • StdDev:0.82
Travel distance
Average Rank 3.27
• Count: 92 • Min: 1 / Max: 5 • StdDev:1.19
Registration
Average Rank 4.47
• Count: 92 • Min: 1 / Max: 5 • StdDev:0.83
Parking
Average Rank 4.17
• Count: 92 • Min: 1 / Max: 5 • StdDev:0.96
Food
Average Rank 4.01
• Count: 92 • Min: 1 / Max: 5 • StdDev:0.98
Restrooms
Average Rank 4.25
• Count: 92
• Min: 1 / Max: 5 • StdDev:0.98
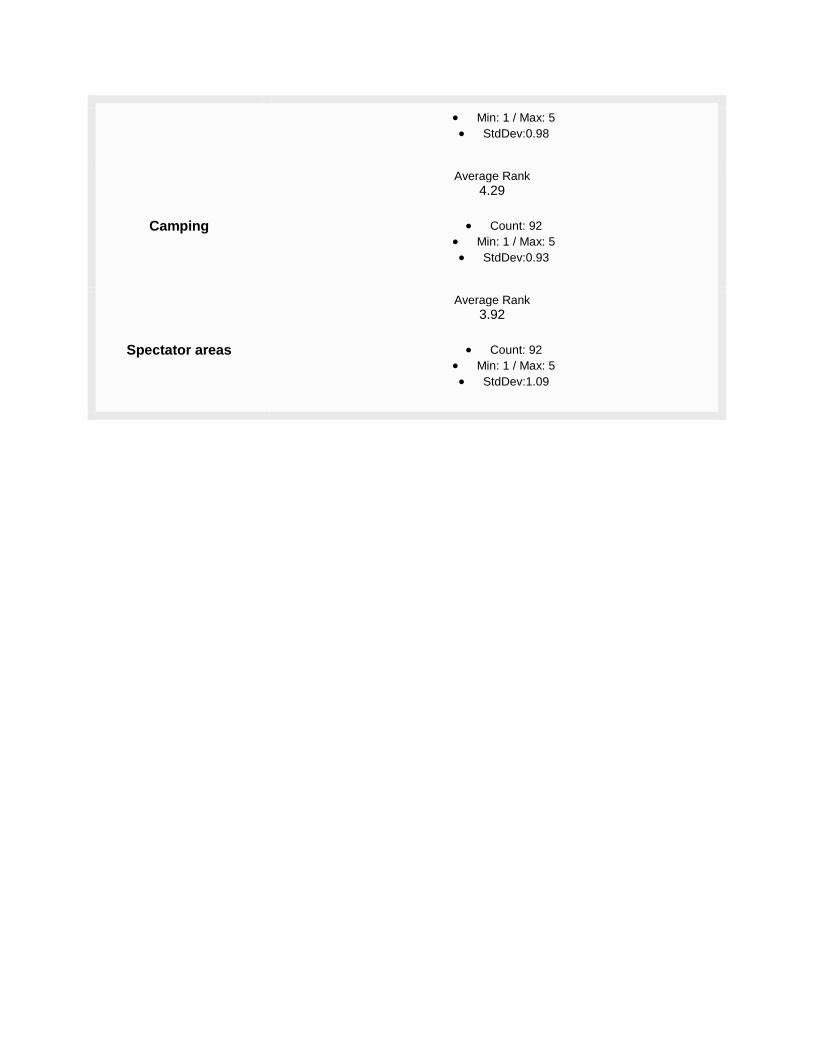
Camping
Average Rank 4.29
• Count: 92 • Min: 1 / Max: 5 • StdDev:0.93
Spectator areas
Average Rank 3.92
• Count: 92 • Min: 1 / Max: 5 • StdDev:1.09
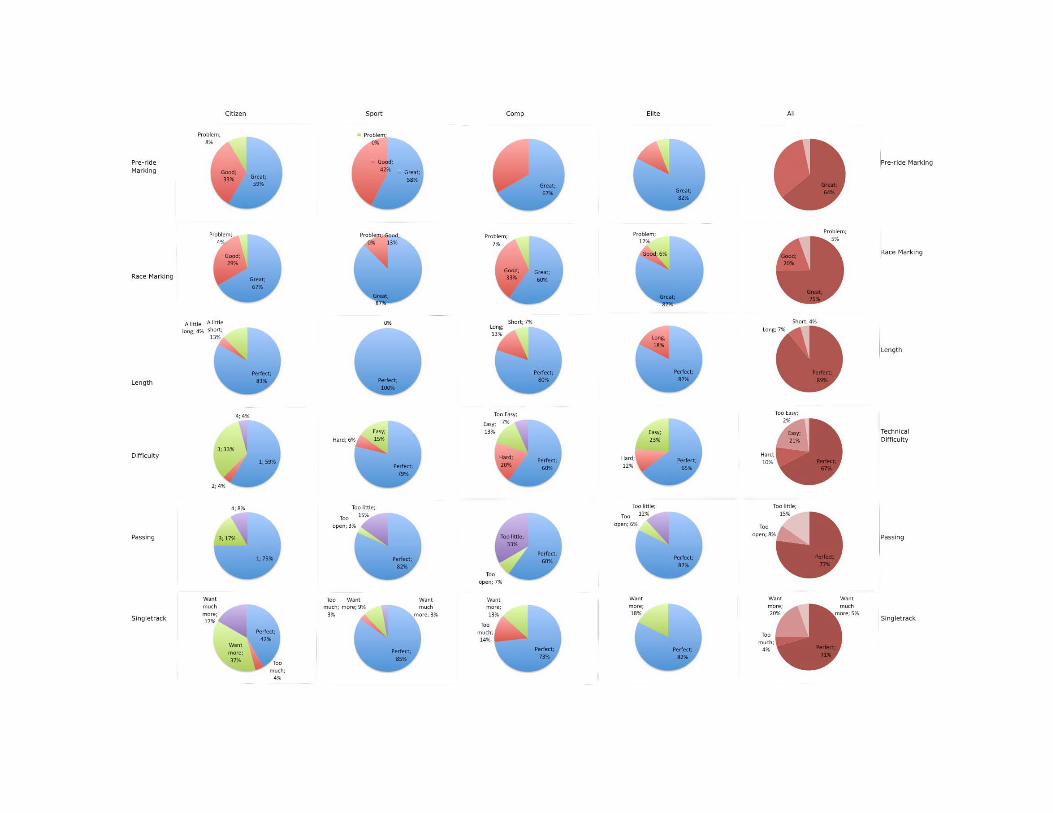
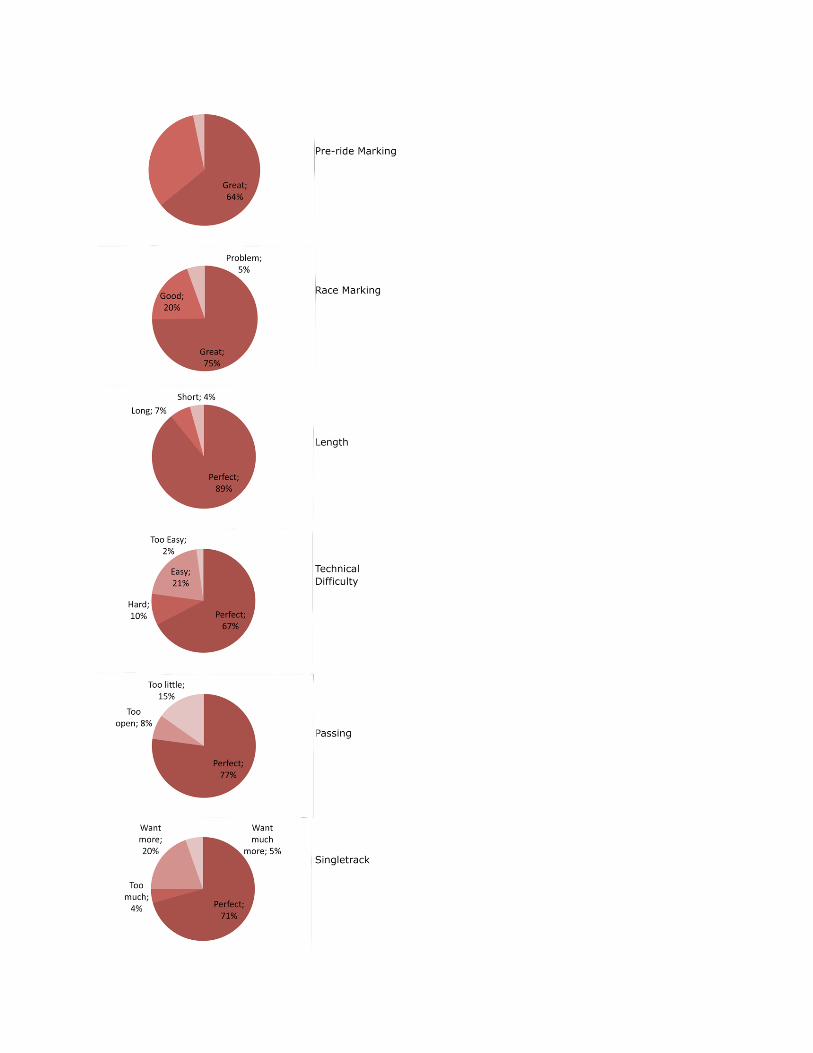
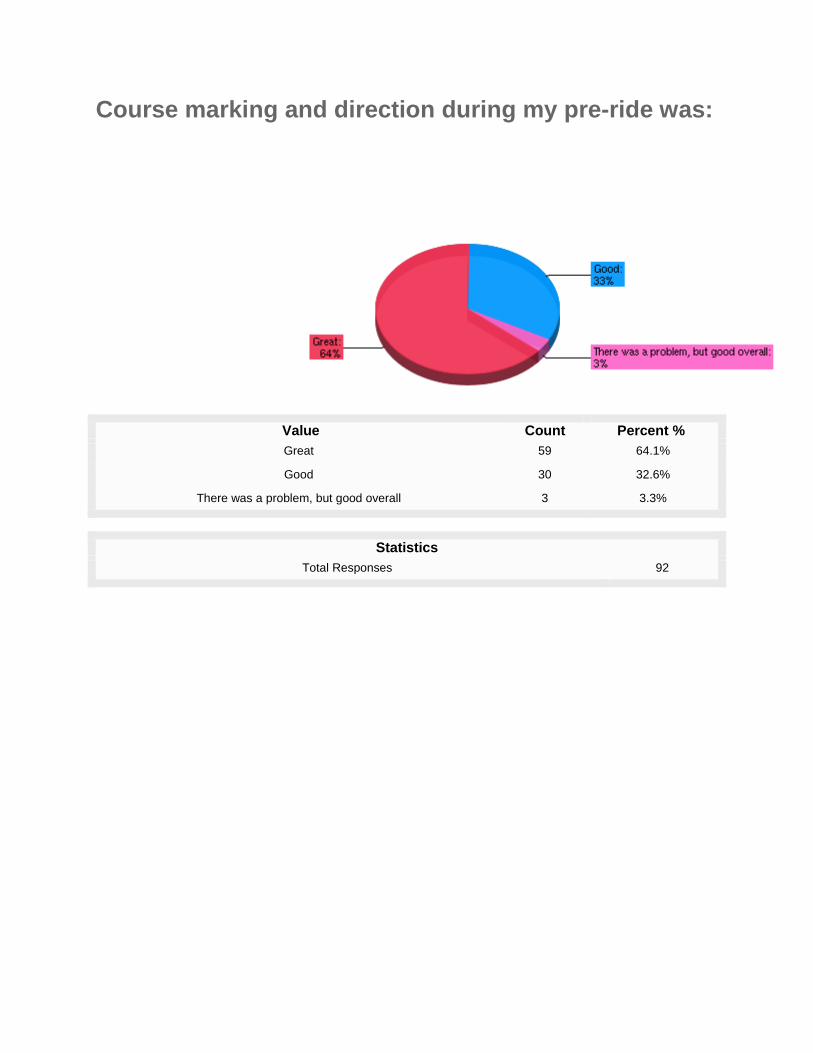
Course marking and direction during my pre-ride was:
Value Count Percent % Great 59 64.1%
Good 30 32.6%
There was a problem, but good overall 3 3.3%
Statistics Total Responses 92
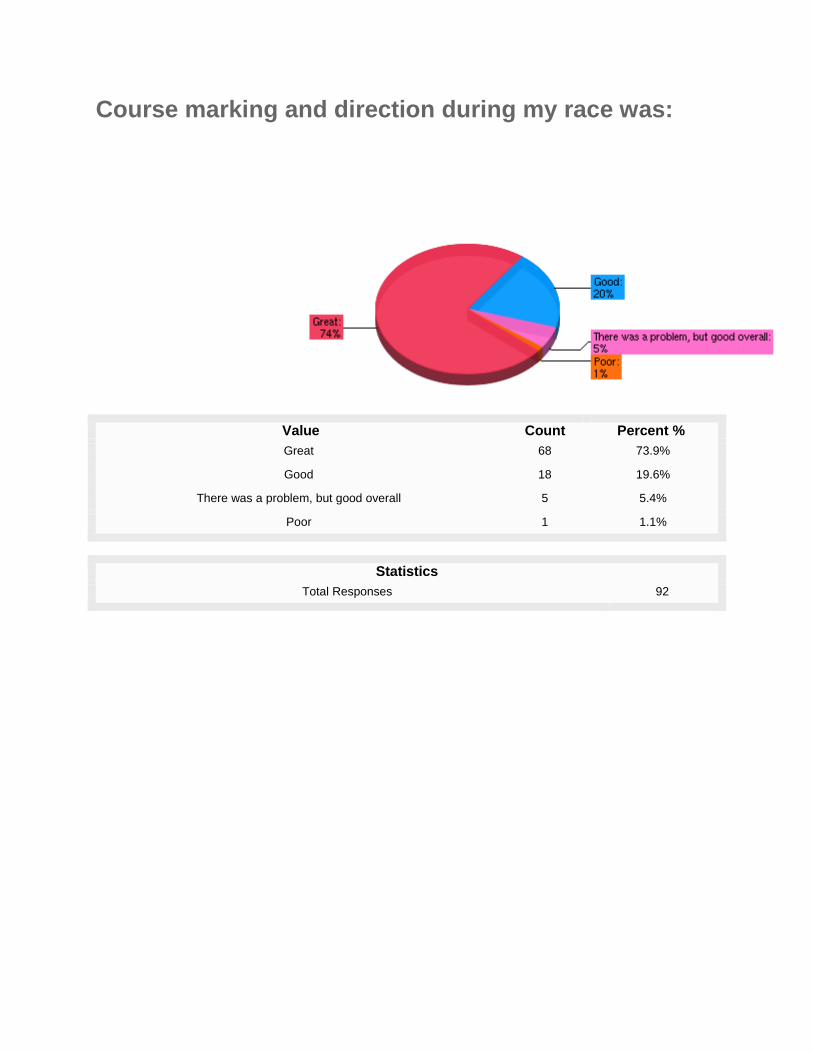
Course marking and direction during my race was:
Value Count Percent % Great 68 73.9%
Good 18 19.6%
There was a problem, but good overall 5 5.4%
Poor 1 1.1%
Statistics Total Responses 92
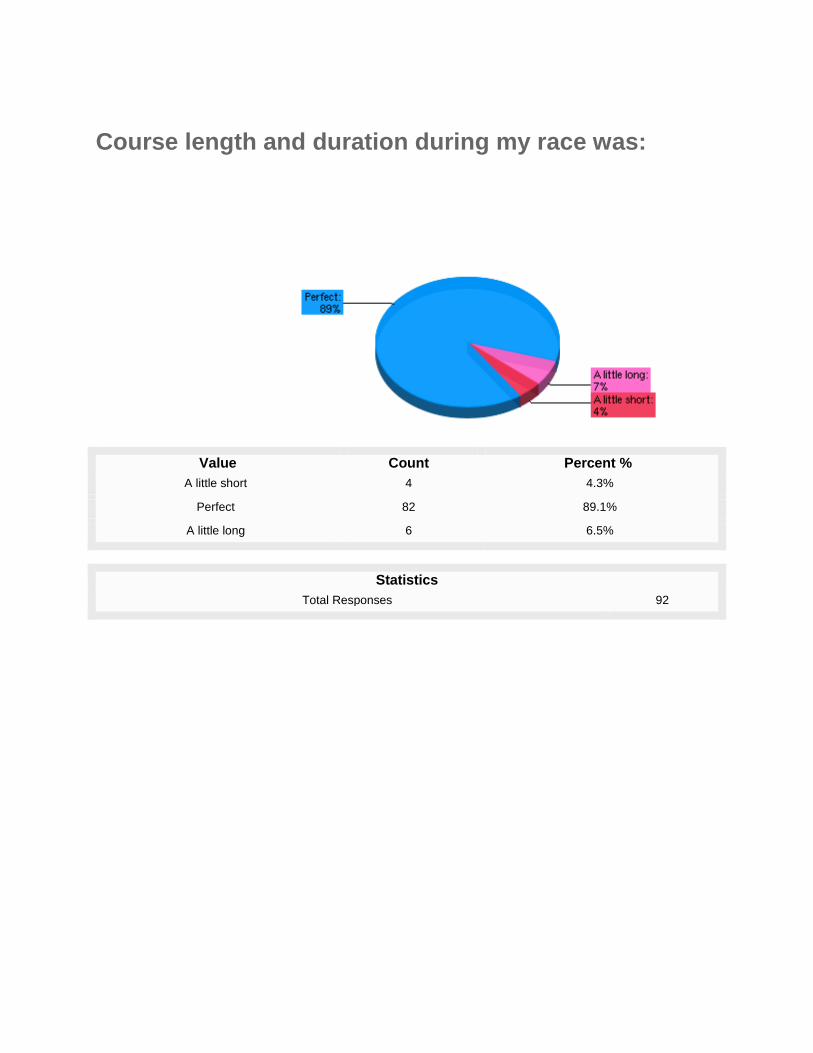
Course length and duration during my race was:
Value Count Percent % A little short 4 4.3%
Perfect 82 89.1%
A little long 6 6.5%
Statistics Total Responses 92
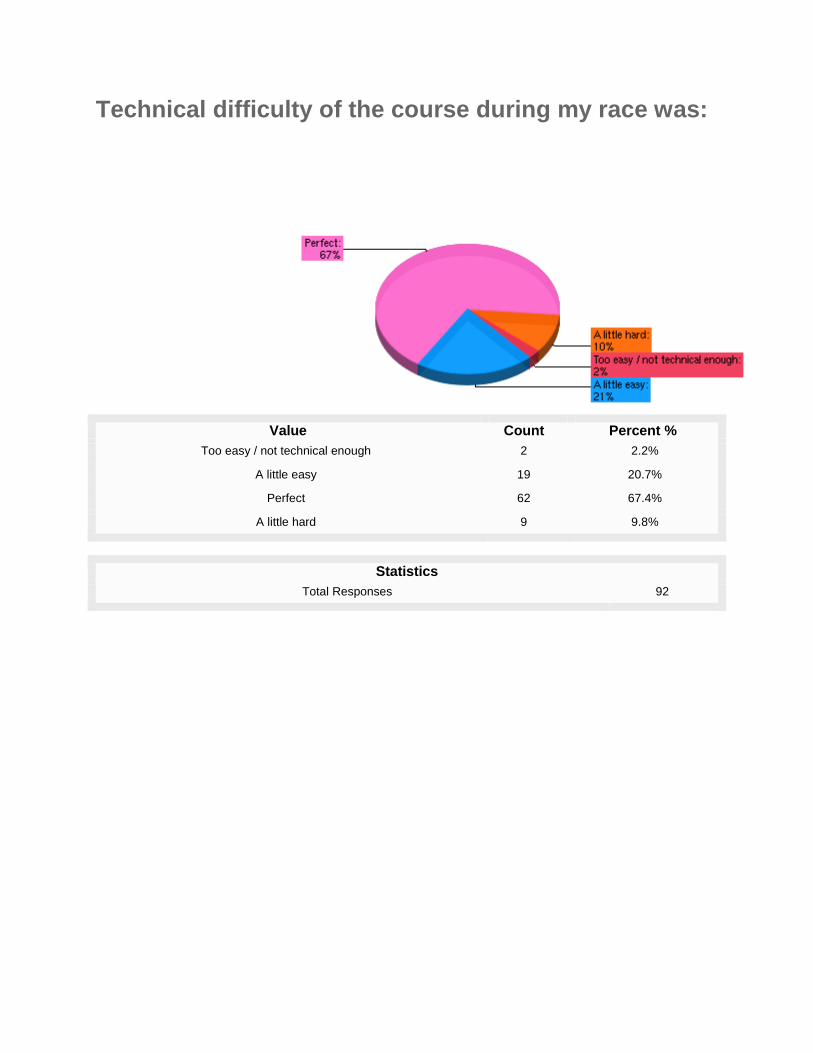
Technical difficulty of the course during my race was:
Value Count Percent % Too easy / not technical enough 2 2.2%
A little easy 19 20.7%
Perfect 62 67.4%
A little hard 9 9.8%
Statistics Total Responses 92
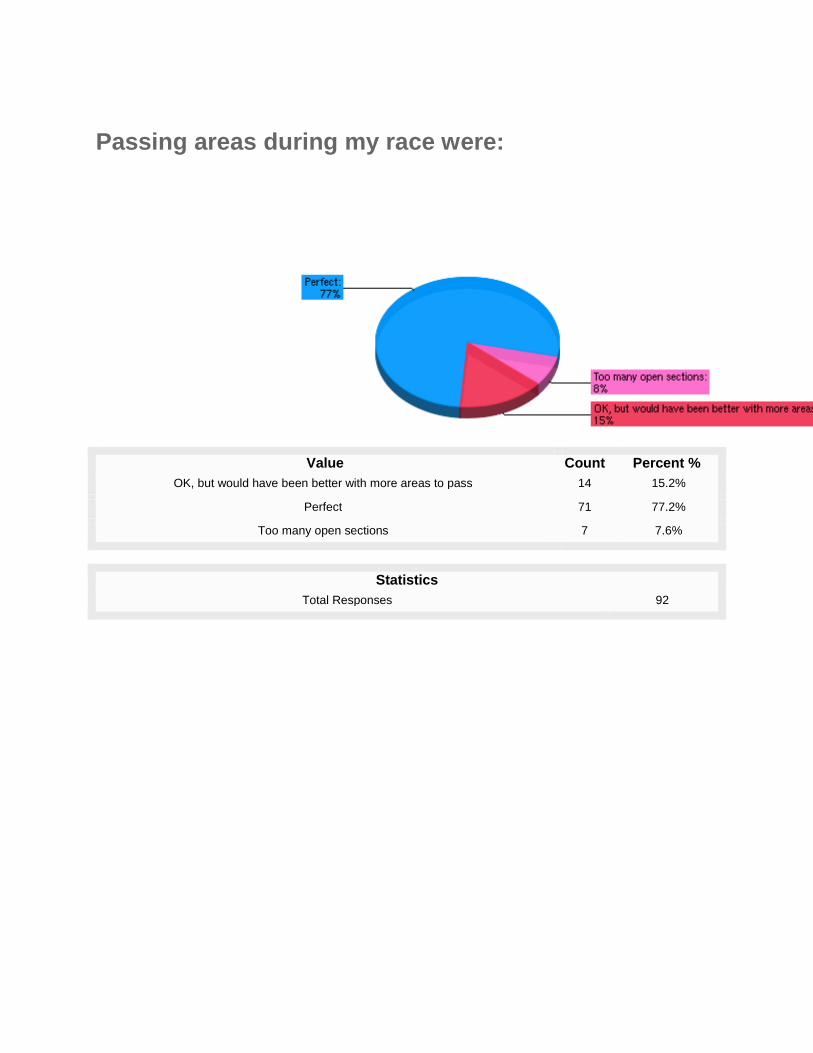
Passing areas during my race were:
Value Count Percent % OK, but would have been better with more areas to pass 14 15.2%
Perfect 71 77.2%
Too many open sections 7 7.6%
Statistics Total Responses 92
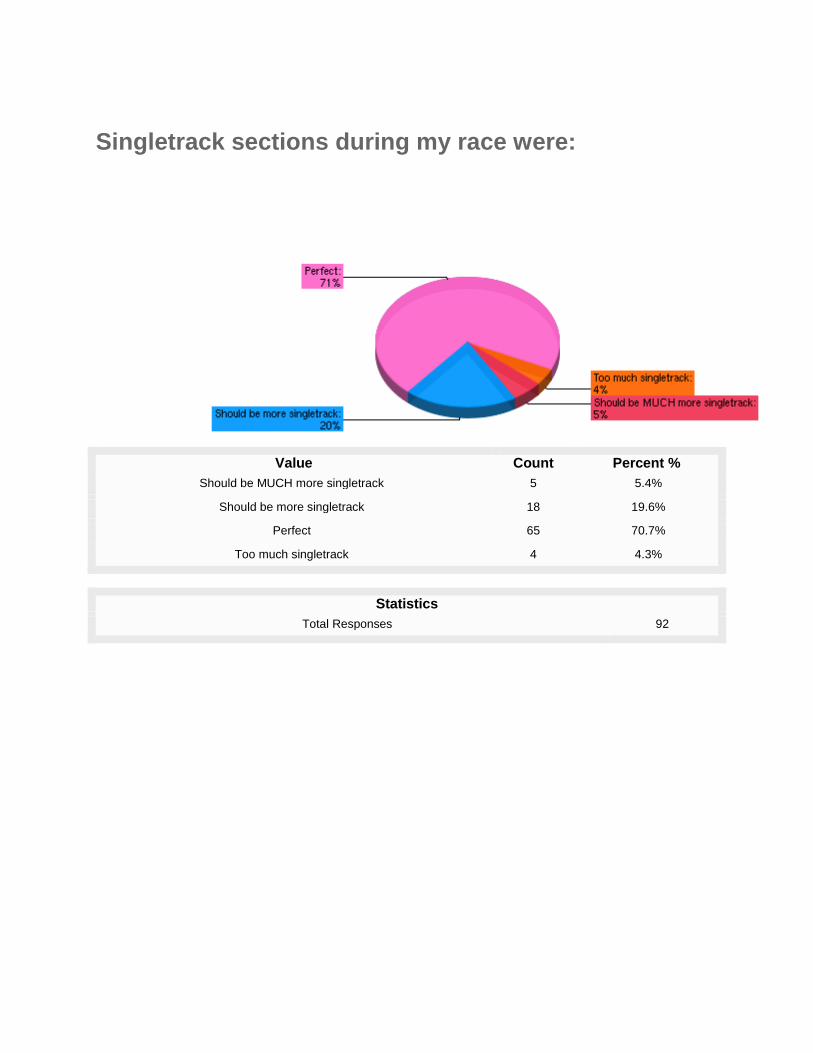
Singletrack sections during my race were:
Value Count Percent % Should be MUCH more singletrack 5 5.4%
Should be more singletrack 18 19.6%
Perfect 65 70.7%
Too much singletrack 4 4.3%
Statistics Total Responses 92