Embed Size (px)
Citation preview
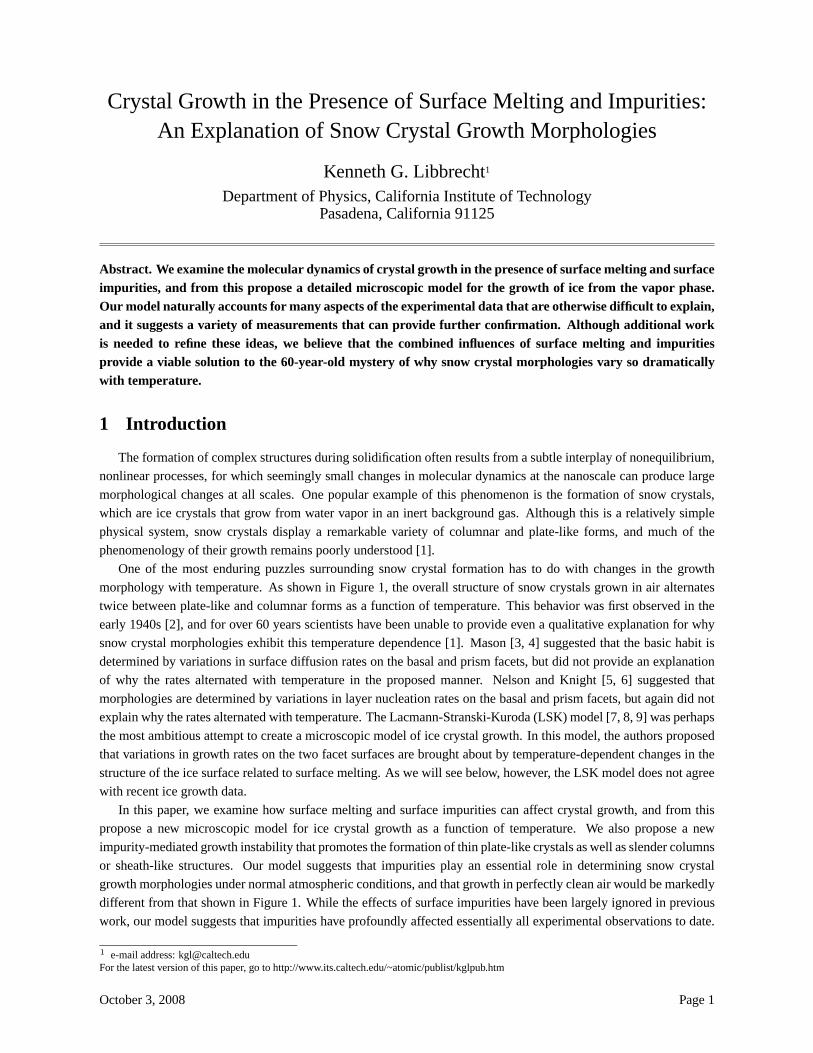
Crystal Growth in the Presence of Surface Melting and Impurities:An Explanation of Snow Crystal Growth Morphologies
Kenneth G. Libbrecht1
Department of Physics, California Institute of TechnologyPasadena, California 91125
Abstract. We examine the molecular dynamics of crystal growth in the presence of surface melting and surfaceimpurities, and from this propose a detailed microscopic model for the growth of ice from the vapor phase.Our model naturally accounts for many aspects of the experimental data that are otherwise difficult to explain,and it suggests a variety of measurements that can provide further confirmation. Although additional workis needed to refine these ideas, we believe that the combined influences of surface melting and impuritiesprovide a viable solution to the 60-year-old mystery of why snow crystal morphologies vary so dramaticallywith temperature.
1 Introduction
The formation of complex structures during solidification often results from a subtle interplay of nonequilibrium,nonlinear processes, for which seemingly small changes in molecular dynamics at the nanoscale can produce largemorphological changes at all scales. One popular example of this phenomenon is the formation of snow crystals,which are ice crystals that grow from water vapor in an inert background gas. Although this is a relatively simplephysical system, snow crystals display a remarkable variety of columnar and plate-like forms, and much of thephenomenology of their growth remains poorly understood [1].
One of the most enduring puzzles surrounding snow crystal formation has to do with changes in the growthmorphology with temperature. As shown in Figure 1, the overall structure of snow crystals grown in air alternatestwice between plate-like and columnar forms as a function of temperature. This behavior was first observed in theearly 1940s [2], and for over 60 years scientists have been unable to provide even a qualitative explanation for whysnow crystal morphologies exhibit this temperature dependence [1]. Mason [3, 4] suggested that the basic habit isdetermined by variations in surface diffusion rates on the basal and prism facets, but did not provide an explanationof why the rates alternated with temperature in the proposed manner. Nelson and Knight [5, 6] suggested thatmorphologies are determined by variations in layer nucleation rates on the basal and prism facets, but again did notexplain why the rates alternated with temperature. The Lacmann-Stranski-Kuroda (LSK) model [7, 8, 9] was perhapsthe most ambitious attempt to create a microscopic model of ice crystal growth. In this model, the authors proposedthat variations in growth rates on the two facet surfaces are brought about by temperature-dependent changes in thestructure of the ice surface related to surface melting. As we will see below, however, the LSK model does not agreewith recent ice growth data.
In this paper, we examine how surface melting and surface impurities can affect crystal growth, and from thispropose a new microscopic model for ice crystal growth as a function of temperature. We also propose a newimpurity-mediated growth instability that promotes the formation of thin plate-like crystals as well as slender columnsor sheath-like structures. Our model suggests that impurities play an essential role in determining snow crystalgrowth morphologies under normal atmospheric conditions, and that growth in perfectly clean air would be markedlydifferent from that shown in Figure 1. While the effects of surface impurities have been largely ignored in previouswork, our model suggests that impurities have profoundly affected essentially all experimental observations to date.
1 e-mail address: [email protected] the latest version of this paper, go to http://www.its.caltech.edu/~atomic/publist/kglpub.htm
October 3, 2008 Page 1
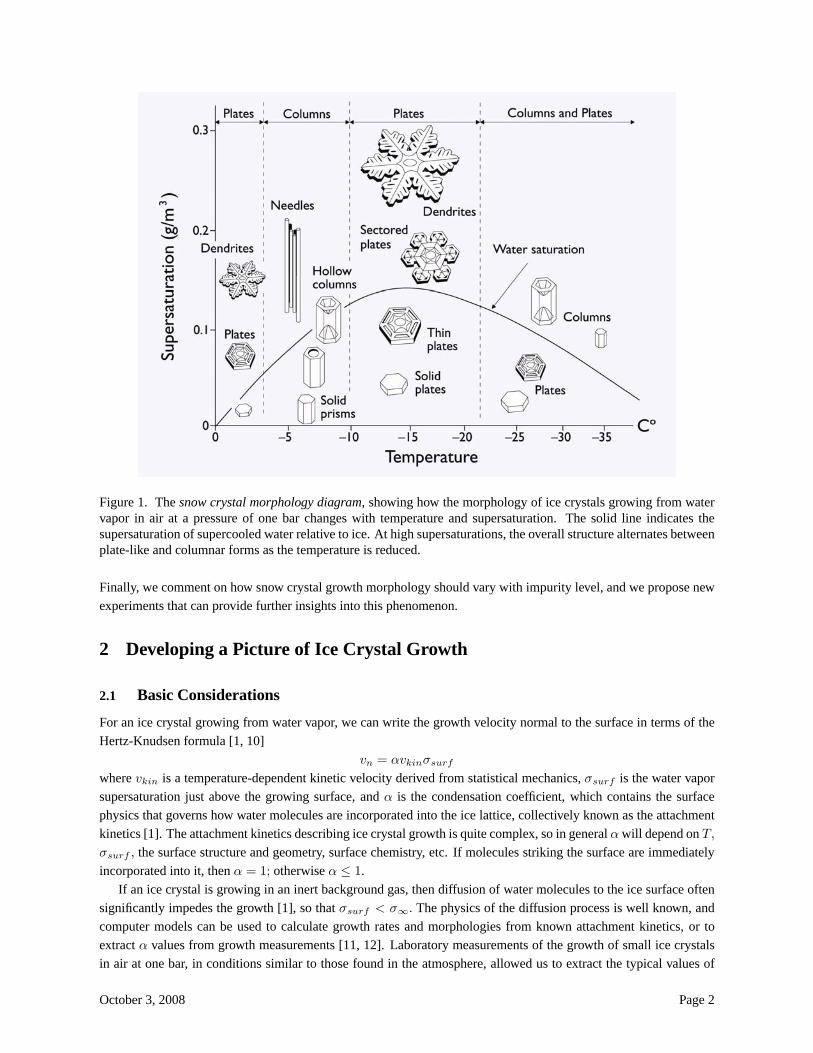
Figure 1. The snow crystal morphology diagram, showing how the morphology of ice crystals growing from watervapor in air at a pressure of one bar changes with temperature and supersaturation. The solid line indicates thesupersaturation of supercooled water relative to ice. At high supersaturations, the overall structure alternates betweenplate-like and columnar forms as the temperature is reduced.
Finally, we comment on how snow crystal growth morphology should vary with impurity level, and we propose newexperiments that can provide further insights into this phenomenon.
2 Developing a Picture of Ice Crystal Growth
2.1 Basic Considerations
For an ice crystal growing from water vapor, we can write the growth velocity normal to the surface in terms of theHertz-Knudsen formula [1, 10]
vn = αvkinσsurfwhere vkin is a temperature-dependent kinetic velocity derived from statistical mechanics, σsurf is the water vaporsupersaturation just above the growing surface, and α is the condensation coefficient, which contains the surfacephysics that governs how water molecules are incorporated into the ice lattice, collectively known as the attachmentkinetics [1]. The attachment kinetics describing ice crystal growth is quite complex, so in general αwill depend on T,σsurf , the surface structure and geometry, surface chemistry, etc. If molecules striking the surface are immediatelyincorporated into it, then α = 1; otherwise α ≤ 1.
If an ice crystal is growing in an inert background gas, then diffusion of water molecules to the ice surface oftensignificantly impedes the growth [1], so that σsurf < σ∞. The physics of the diffusion process is well known, andcomputer models can be used to calculate growth rates and morphologies from known attachment kinetics, or toextract α values from growth measurements [11, 12]. Laboratory measurements of the growth of small ice crystalsin air at one bar, in conditions similar to those found in the atmosphere, allowed us to extract the typical values of
October 3, 2008 Page 2
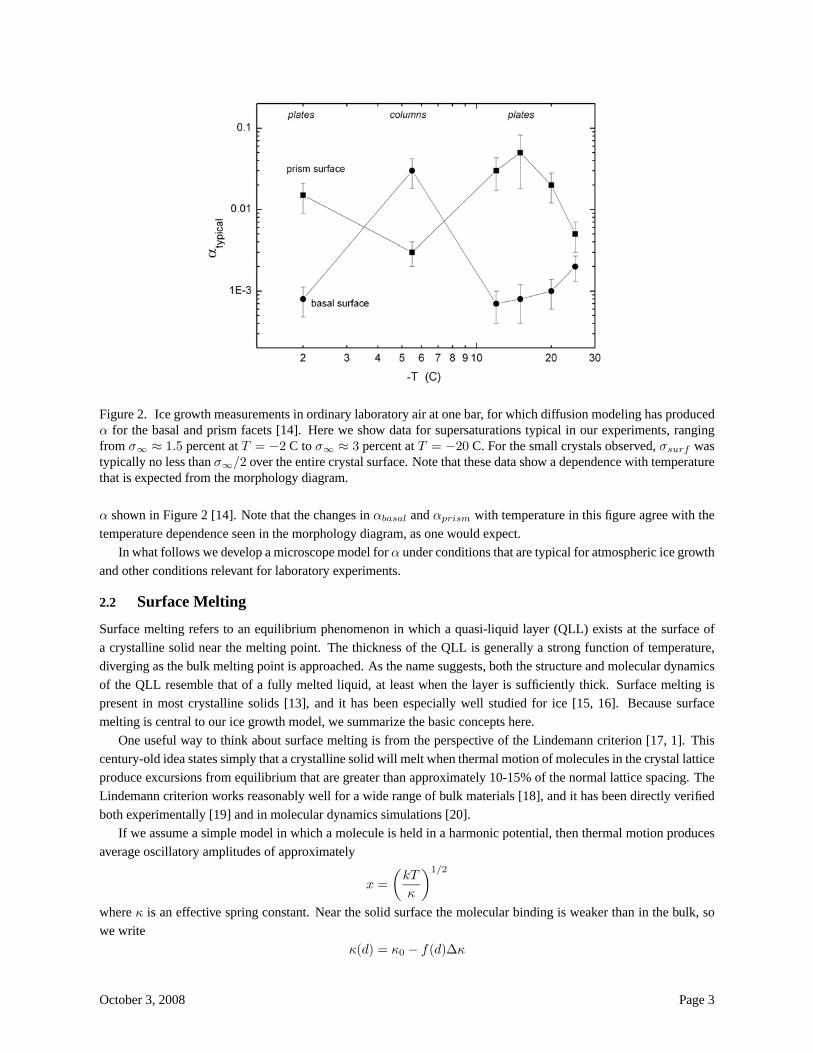
Figure 2. Ice growth measurements in ordinary laboratory air at one bar, for which diffusion modeling has producedα for the basal and prism facets [14]. Here we show data for supersaturations typical in our experiments, rangingfrom σ∞ ≈ 1.5 percent at T = −2 C to σ∞ ≈ 3 percent at T = −20 C. For the small crystals observed, σsurf wastypically no less than σ∞/2 over the entire crystal surface. Note that these data show a dependence with temperaturethat is expected from the morphology diagram.
α shown in Figure 2 [14]. Note that the changes in αbasal and αprism with temperature in this figure agree with thetemperature dependence seen in the morphology diagram, as one would expect.
In what follows we develop a microscope model for α under conditions that are typical for atmospheric ice growthand other conditions relevant for laboratory experiments.
2.2 Surface Melting
Surface melting refers to an equilibrium phenomenon in which a quasi-liquid layer (QLL) exists at the surface ofa crystalline solid near the melting point. The thickness of the QLL is generally a strong function of temperature,diverging as the bulk melting point is approached. As the name suggests, both the structure and molecular dynamicsof the QLL resemble that of a fully melted liquid, at least when the layer is sufficiently thick. Surface melting ispresent in most crystalline solids [13], and it has been especially well studied for ice [15, 16]. Because surfacemelting is central to our ice growth model, we summarize the basic concepts here.
One useful way to think about surface melting is from the perspective of the Lindemann criterion [17, 1]. Thiscentury-old idea states simply that a crystalline solid will melt when thermal motion of molecules in the crystal latticeproduce excursions from equilibrium that are greater than approximately 10-15% of the normal lattice spacing. TheLindemann criterion works reasonably well for a wide range of bulk materials [18], and it has been directly verifiedboth experimentally [19] and in molecular dynamics simulations [20].
If we assume a simple model in which a molecule is held in a harmonic potential, then thermal motion producesaverage oscillatory amplitudes of approximately
x =
µkT
κ
¶1/2where κ is an effective spring constant. Near the solid surface the molecular binding is weaker than in the bulk, sowe write
κ(d) = κ0 − f(d)∆κ
October 3, 2008 Page 3
where d is the distance from the surface, 0 < ∆κ < κ0 is a constant, and f(d) is a function with f(0) = 1
and f(∞) = 0. For the simplest model in which half the restoring force is absent at the surface, we might expect∆κ ≈ κ0/2.
The Lindemann criterion states that the bulk will melt when x reaches some value x0 = (kTm/κ0)1/2, where
Tm is the bulk melting temperature. Extending this, we expect that surface melting will occur down to a depth d atwhich
x(d) =
µkT
κ0 − f(d)∆κ
¶1/2= x0.
Expanding for small∆κ/κ0 and for small t = (Tm − T )/Tm, this reduces to simply
t = f(d)∆κ/κ0.
For the case of ice we assume f(d) = exp(−d/λ), where λ is a scaling length for the intermolecular interactions[13], and with this the thickness of the quasi-liquid layer becomes
d(T ) ≈ λ log
µ∆κ
tκ0
¶which is valid for small t.
There have been numerous measurements of surface melting in ice [15], and there is general consensus that theQLL thickness d(T ) at least roughly follows the logarithmic relation described above. There is, however, greatdisparity between the different measurements, probably because most experiments do not measure d(T ) directly, butrather measure some quantity related to d(T ) in an uncertain way (see [21, 22] and references therein for a reviewof recent measurements). Molecular dynamics simulations are making progress toward understanding the surfacestructure of ice, including surface melting [23, 24, 25], although reliable quantitative results are elusive. As a resultof both experimental and theoretical uncertainties, we do not yet fully understand the equilibrium structure of the icesurface in detail, or how this structure varies with temperature. Further, we do not know if surface melting is differenton different crystal facets, or in general how the QLL varies with the surface orientation relative to the underlying icelattice.
In spite of these problems, theory and experiment do give us a relatively simple qualitative picture of the de-velopment of surface melting in ice as a function of temperature. At very low temperatures, surface melting islargely absent, so there is relatively little disorder or time-dependent restructuring at the surface. As the temperatureincreases, surface melting begins turning on gradually, causing some disordered motion in the top few molecularlayers, and this motion increases in extent with increasing temperature. Eventually this disordered motion starts tolook like a fully developed QLL that sits atop the bulk crystal, and a somewhat distinct boundary appears betweenthe two. Very close to the melting point, the QLL is thick enough that it becomes an essentially distinct layer withlargely liquid-like properties. Finally, the layer thickness diverges as the melting temperature is approached.
As was pointed out in connection with the LSK model [7, 8, 9], it appears likely that surface melting plays animportant role in ice crystal growth dynamics. The available data indicate that surface melting shows considerablevariation over the temperature range −20 C < T < 0 C, coincident with the most pronounced variations in snowcrystal morphology, and it is plausible that surface melting is substantially different on the two principal facetsover this range. Unfortunately, we have little theoretical or experimental guidance as to how the structural changesassociated with surface melting affect crystal growth dynamics [26].
2.3 The Role of Surface Impurities
It has long been known that high levels of gaseous impurities in air at one bar can dramatically affect snow crystalgrowth and morphologies ([1] and references therein). A wide range of chemical impurities, such as vapors frommany alcohols, acids, hydrocarbons, etc., affect both ice crystal morphologies and growth rates. However, observa-tions over many decades have shown that the morphology diagram is a robust feature of snow crystal growth in air,provided the air is fairly clean. Our own “rule of thumb” in the lab has been that growth morphologies are largelyunaffected as long as one cannot smell anything in the air. Since impurity effects seen at high concentrations are not
October 3, 2008 Page 4
seen in cleaner air, researchers were led to believe that the modest levels of residual impurities in ordinary laboratoryair or in the atmosphere were probably not playing a significant role in ice growth dynamics.
These observations may be deceptive, however, because even a seemingly low concentration of surface-activeimpurities may not be negligible. Consider growth in air which contains a fraction f of some impurity that immedi-ately attaches to the ice surface upon contact. Diffusion limits the transport of impurity molecules to the surface, andthe time needed to form a single monolayer on a spherical crystal is
τmono ≈R
Da2fnair(1)
where R is the crystal radius, D is the diffusion constant (D = 2 × 10⁻⁵ m2/ sec in air at one bar), nair is thenumber density of the air (nair = 2.5 × 1025 /m3 at one atmosphere), and a is the effective size of an impuritymolecule (which we assume to be a ≈ 1 nm). Equation 1 holds for times longer than the characteristic diffusion timeτdiff = R2/D. Note that D ∼ P−1 and nair ∼ P, where P is the air pressure, so τmono is independent of P tolowest order. This expression becomes
τmono ≈ 2µ
R
1 μm
¶µ1 ppmf
¶msec (2)
which is much shorter than typical snow crystal growth times. The growth velocities of micron-scale ice crystals inair are typically no higher than a few microns per second, so impurities may be playing a role even for very small icecrystals.
For times much longer than τmono we expect that the impurity density on the ice surface will reach some equilib-rium value, assuming that thermal excitations are sufficient to remove adsorbed molecules from the surface at somerate. Gaseous impurities striking the surface will increase the surface density as dρsurf/dt ∼ fnair, while lossesgive dρsurf/dt = ρsurf/τ loss, where τ loss is the characteristic time for impurities to leave the surface. These ratesare equal in equilibrium, giving ρsurf ∼ fnairτ loss. Thus while τmono is independent of P , we see that reducingthe pressure will reduce the equilibrium impurity surface density as ρsurf ∼ P (assuming τ loss is independent ofP ).
Experience with other condensed matter systems also suggests that impurity effects may be important. Creatingatomically clean semiconductor surfaces often requires extensive baking, sputtering, or other types of surface clean-ing, all of which must be done under ultrahigh vacuum conditions. The high vapor pressure of ice near the meltingpoint precludes the use of ultrahigh vacuum techniques, and nearly all experiments with ice have not involved carefulsurface preparation to remove adsorbed impurities.
Figure 3 shows the typical composition of clean dry air. We expect that laboratory air, particularly inside closedchambers used for ice crystal growth experiments, would contain a long list of solvent vapors, volatile organiccompounds and other chemical impurities near or above the ppm level.
With these simple considerations, we are led to suspect that even low levels of impurities in relatively clean aircould strongly affect ice crystal growth. The remainder of this paper examines issues of impurity residence time,mobility, how these change in the presence of surface melting, and generally how impurities affect ice crystal growthrates and morphologies.
2.4 Growth of a Clean Ice Surface
Crystal growth involves complex dynamical processes at the molecular level, and the task of modeling this phenom-enon is certainly made more difficult with the addition of surface melting and surface impurities. Our relatively poortheoretical understanding of crystal growth in these circumstances makes it difficult to develop an accurate a priorimodel, so we use experimental observations as much as possible to guide our thinking. For our baseline model of thegrowth of a clean ice surface, we rely mainly on growth measurements taken at low background pressure [28, 29].Not only is ρsurf expected to be lower for low-pressure measurements, as described above, but we also believe get-tering from the ice reservoir in our growth chamber reduces the impurity fraction f as well, which in turn reducesρsurf . As we discuss further in the next section, we believe these two factors greatly decrease the impurity effects on
October 3, 2008 Page 5
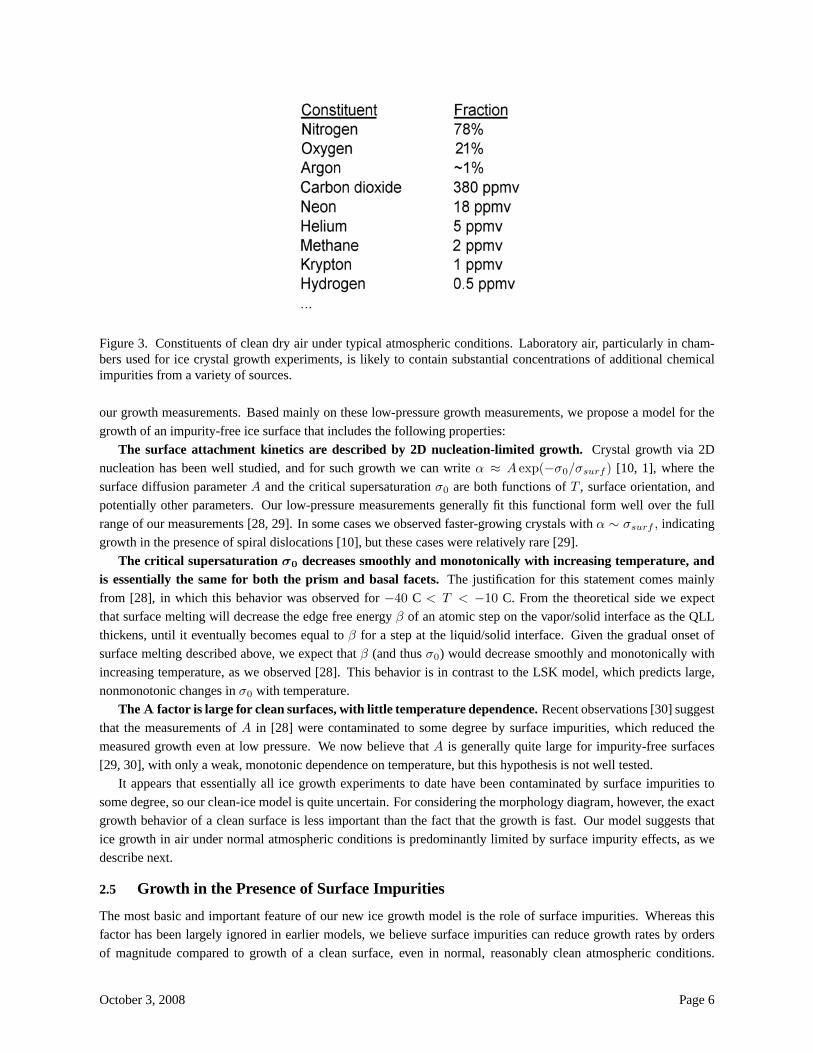
Figure 3. Constituents of clean dry air under typical atmospheric conditions. Laboratory air, particularly in cham-bers used for ice crystal growth experiments, is likely to contain substantial concentrations of additional chemicalimpurities from a variety of sources.
our growth measurements. Based mainly on these low-pressure growth measurements, we propose a model for thegrowth of an impurity-free ice surface that includes the following properties:
The surface attachment kinetics are described by 2D nucleation-limited growth. Crystal growth via 2Dnucleation has been well studied, and for such growth we can write α ≈ A exp(−σ0/σsurf ) [10, 1], where thesurface diffusion parameter A and the critical supersaturation σ0 are both functions of T , surface orientation, andpotentially other parameters. Our low-pressure measurements generally fit this functional form well over the fullrange of our measurements [28, 29]. In some cases we observed faster-growing crystals with α ∼ σsurf , indicatinggrowth in the presence of spiral dislocations [10], but these cases were relatively rare [29].
The critical supersaturation σ0 decreases smoothly and monotonically with increasing temperature, andis essentially the same for both the prism and basal facets. The justification for this statement comes mainlyfrom [28], in which this behavior was observed for −40 C < T < −10 C. From the theoretical side we expectthat surface melting will decrease the edge free energy β of an atomic step on the vapor/solid interface as the QLLthickens, until it eventually becomes equal to β for a step at the liquid/solid interface. Given the gradual onset ofsurface melting described above, we expect that β (and thus σ0) would decrease smoothly and monotonically withincreasing temperature, as we observed [28]. This behavior is in contrast to the LSK model, which predicts large,nonmonotonic changes in σ0 with temperature.
TheA factor is large for clean surfaces, with little temperature dependence. Recent observations [30] suggestthat the measurements of A in [28] were contaminated to some degree by surface impurities, which reduced themeasured growth even at low pressure. We now believe that A is generally quite large for impurity-free surfaces[29, 30], with only a weak, monotonic dependence on temperature, but this hypothesis is not well tested.
It appears that essentially all ice growth experiments to date have been contaminated by surface impurities tosome degree, so our clean-ice model is quite uncertain. For considering the morphology diagram, however, the exactgrowth behavior of a clean surface is less important than the fact that the growth is fast. Our model suggests thatice growth in air under normal atmospheric conditions is predominantly limited by surface impurity effects, as wedescribe next.
2.5 Growth in the Presence of Surface Impurities
The most basic and important feature of our new ice growth model is the role of surface impurities. Whereas thisfactor has been largely ignored in earlier models, we believe surface impurities can reduce growth rates by ordersof magnitude compared to growth of a clean surface, even in normal, reasonably clean atmospheric conditions.
October 3, 2008 Page 6
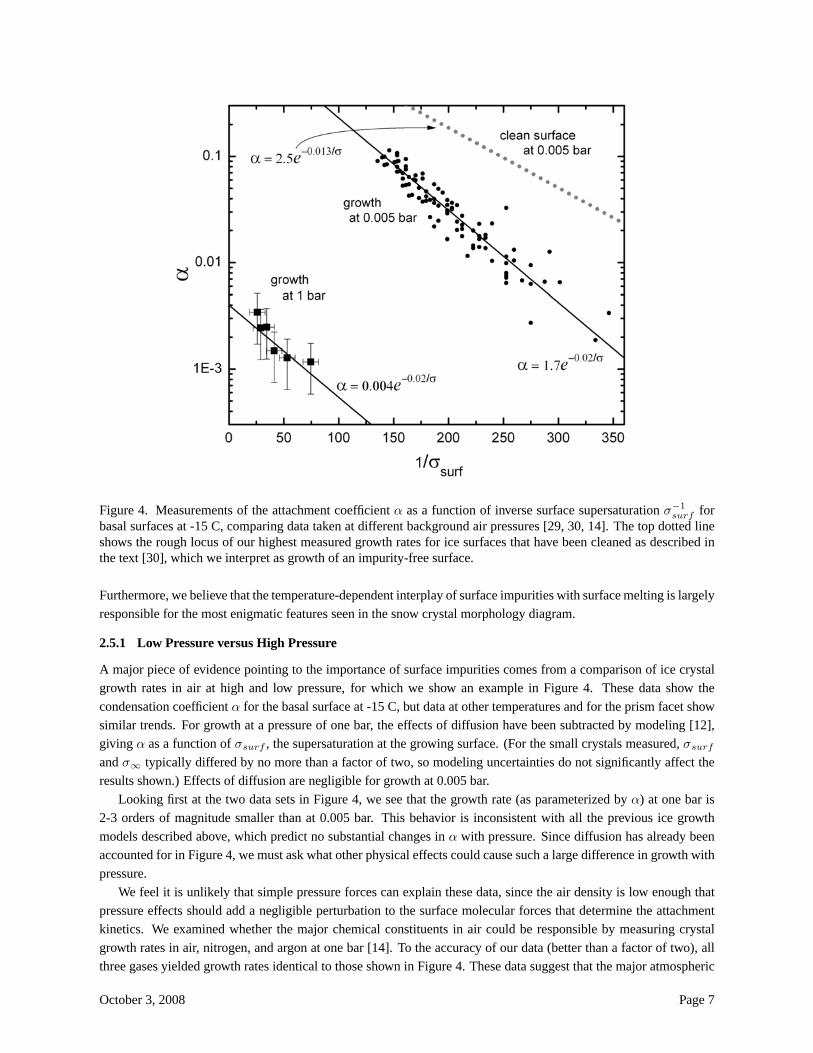
Figure 4. Measurements of the attachment coefficient α as a function of inverse surface supersaturation σ−1surf forbasal surfaces at -15 C, comparing data taken at different background air pressures [29, 30, 14]. The top dotted lineshows the rough locus of our highest measured growth rates for ice surfaces that have been cleaned as described inthe text [30], which we interpret as growth of an impurity-free surface.
Furthermore, we believe that the temperature-dependent interplay of surface impurities with surface melting is largelyresponsible for the most enigmatic features seen in the snow crystal morphology diagram.
2.5.1 Low Pressure versus High Pressure
A major piece of evidence pointing to the importance of surface impurities comes from a comparison of ice crystalgrowth rates in air at high and low pressure, for which we show an example in Figure 4. These data show thecondensation coefficient α for the basal surface at -15 C, but data at other temperatures and for the prism facet showsimilar trends. For growth at a pressure of one bar, the effects of diffusion have been subtracted by modeling [12],giving α as a function of σsurf , the supersaturation at the growing surface. (For the small crystals measured, σsurfand σ∞ typically differed by no more than a factor of two, so modeling uncertainties do not significantly affect theresults shown.) Effects of diffusion are negligible for growth at 0.005 bar.
Looking first at the two data sets in Figure 4, we see that the growth rate (as parameterized by α) at one bar is2-3 orders of magnitude smaller than at 0.005 bar. This behavior is inconsistent with all the previous ice growthmodels described above, which predict no substantial changes in α with pressure. Since diffusion has already beenaccounted for in Figure 4, we must ask what other physical effects could cause such a large difference in growth withpressure.
We feel it is unlikely that simple pressure forces can explain these data, since the air density is low enough thatpressure effects should add a negligible perturbation to the surface molecular forces that determine the attachmentkinetics. We examined whether the major chemical constituents in air could be responsible by measuring crystalgrowth rates in air, nitrogen, and argon at one bar [14]. To the accuracy of our data (better than a factor of two), allthree gases yielded growth rates identical to those shown in Figure 4. These data suggest that the major atmospheric
October 3, 2008 Page 7
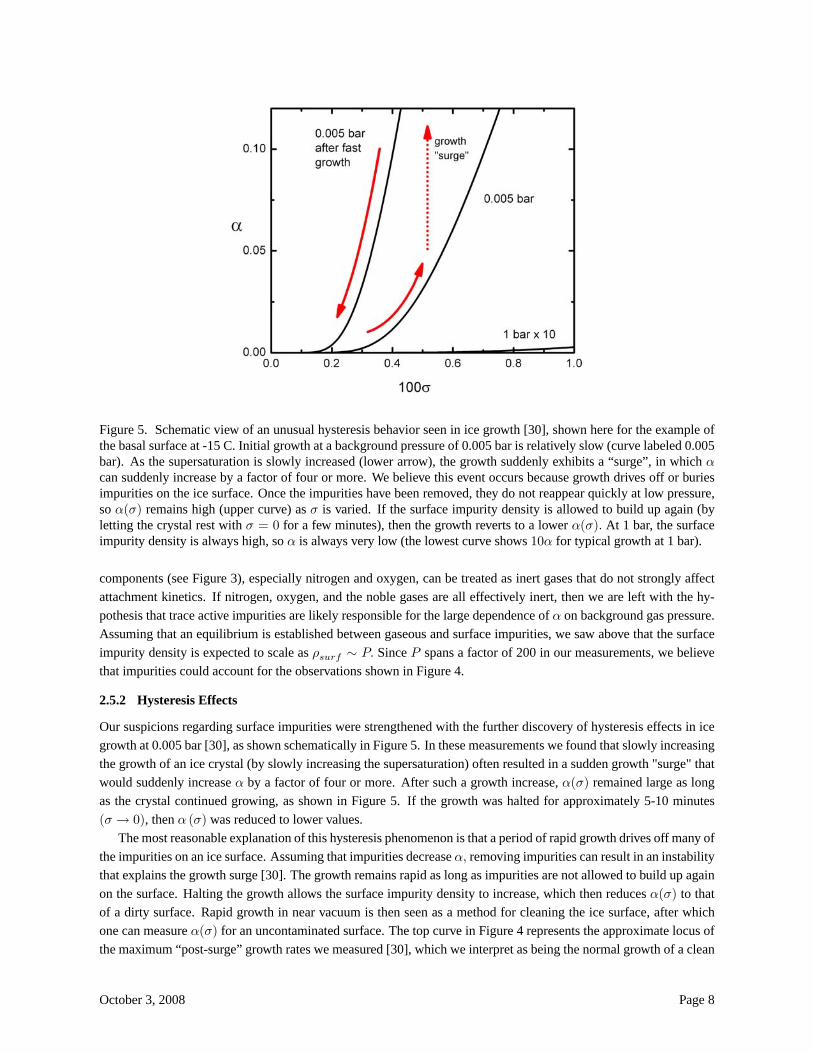
Figure 5. Schematic view of an unusual hysteresis behavior seen in ice growth [30], shown here for the example ofthe basal surface at -15 C. Initial growth at a background pressure of 0.005 bar is relatively slow (curve labeled 0.005bar). As the supersaturation is slowly increased (lower arrow), the growth suddenly exhibits a “surge”, in which αcan suddenly increase by a factor of four or more. We believe this event occurs because growth drives off or buriesimpurities on the ice surface. Once the impurities have been removed, they do not reappear quickly at low pressure,so α(σ) remains high (upper curve) as σ is varied. If the surface impurity density is allowed to build up again (byletting the crystal rest with σ = 0 for a few minutes), then the growth reverts to a lower α(σ). At 1 bar, the surfaceimpurity density is always high, so α is always very low (the lowest curve shows 10α for typical growth at 1 bar).
components (see Figure 3), especially nitrogen and oxygen, can be treated as inert gases that do not strongly affectattachment kinetics. If nitrogen, oxygen, and the noble gases are all effectively inert, then we are left with the hy-pothesis that trace active impurities are likely responsible for the large dependence of α on background gas pressure.Assuming that an equilibrium is established between gaseous and surface impurities, we saw above that the surfaceimpurity density is expected to scale as ρsurf ∼ P. Since P spans a factor of 200 in our measurements, we believethat impurities could account for the observations shown in Figure 4.
2.5.2 Hysteresis Effects
Our suspicions regarding surface impurities were strengthened with the further discovery of hysteresis effects in icegrowth at 0.005 bar [30], as shown schematically in Figure 5. In these measurements we found that slowly increasingthe growth of an ice crystal (by slowly increasing the supersaturation) often resulted in a sudden growth "surge" thatwould suddenly increase α by a factor of four or more. After such a growth increase, α(σ) remained large as longas the crystal continued growing, as shown in Figure 5. If the growth was halted for approximately 5-10 minutes(σ → 0), then α (σ) was reduced to lower values.
The most reasonable explanation of this hysteresis phenomenon is that a period of rapid growth drives off many ofthe impurities on an ice surface. Assuming that impurities decrease α, removing impurities can result in an instabilitythat explains the growth surge [30]. The growth remains rapid as long as impurities are not allowed to build up againon the surface. Halting the growth allows the surface impurity density to increase, which then reduces α(σ) to thatof a dirty surface. Rapid growth in near vacuum is then seen as a method for cleaning the ice surface, after whichone can measure α(σ) for an uncontaminated surface. The top curve in Figure 4 represents the approximate locus ofthe maximum “post-surge” growth rates we measured [30], which we interpret as being the normal growth of a clean
October 3, 2008 Page 8
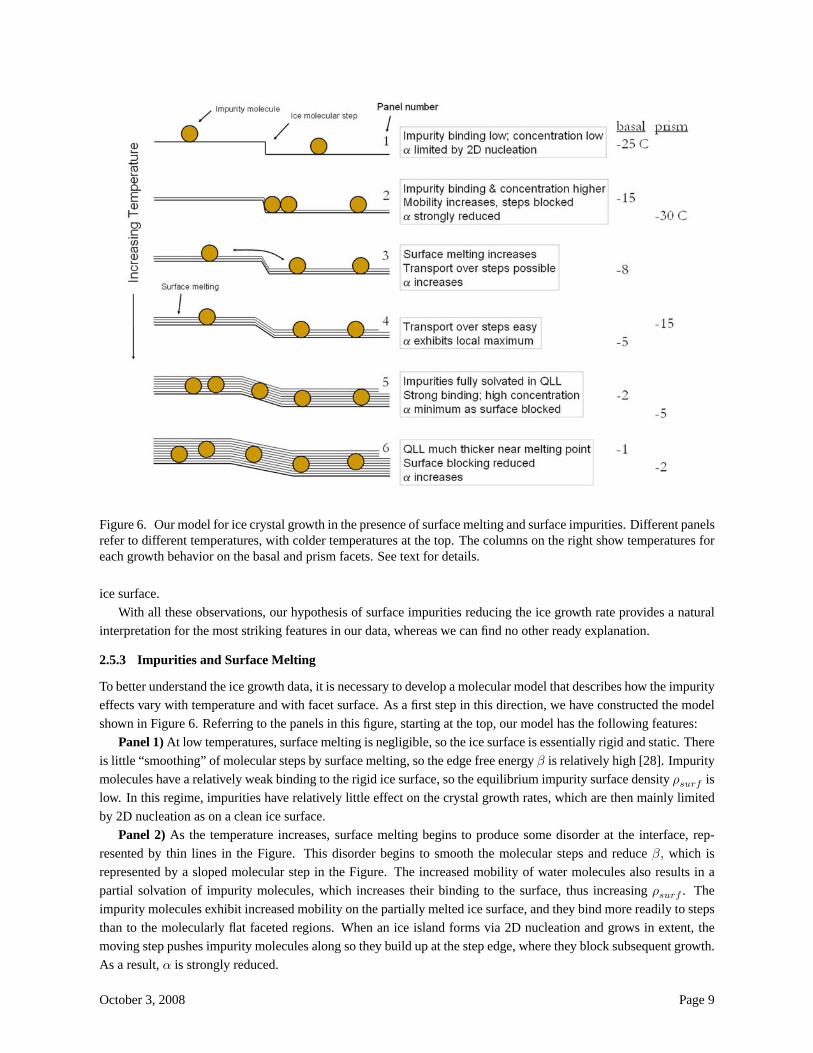
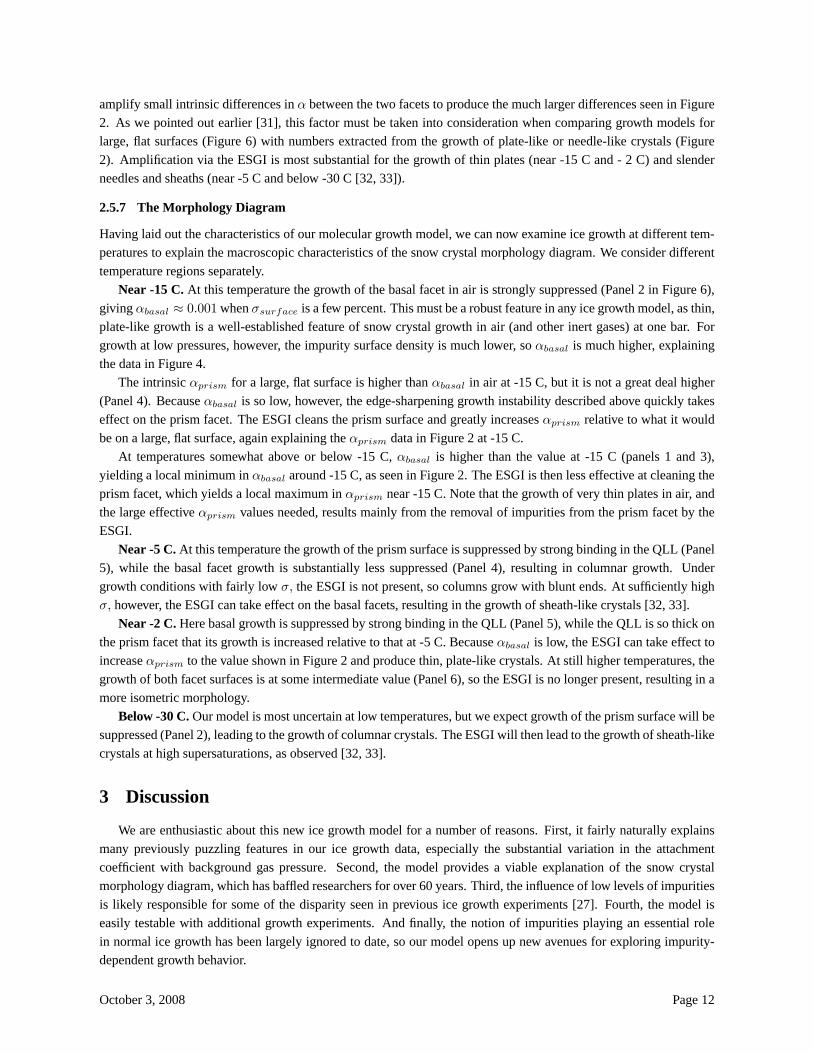
Figure 6. Our model for ice crystal growth in the presence of surface melting and surface impurities. Different panelsrefer to different temperatures, with colder temperatures at the top. The columns on the right show temperatures foreach growth behavior on the basal and prism facets. See text for details.
ice surface.With all these observations, our hypothesis of surface impurities reducing the ice growth rate provides a natural
interpretation for the most striking features in our data, whereas we can find no other ready explanation.
2.5.3 Impurities and Surface Melting
To better understand the ice growth data, it is necessary to develop a molecular model that describes how the impurityeffects vary with temperature and with facet surface. As a first step in this direction, we have constructed the modelshown in Figure 6. Referring to the panels in this figure, starting at the top, our model has the following features:
Panel 1) At low temperatures, surface melting is negligible, so the ice surface is essentially rigid and static. Thereis little “smoothing” of molecular steps by surface melting, so the edge free energy β is relatively high [28]. Impuritymolecules have a relatively weak binding to the rigid ice surface, so the equilibrium impurity surface density ρsurf islow. In this regime, impurities have relatively little effect on the crystal growth rates, which are then mainly limitedby 2D nucleation as on a clean ice surface.
Panel 2) As the temperature increases, surface melting begins to produce some disorder at the interface, rep-resented by thin lines in the Figure. This disorder begins to smooth the molecular steps and reduce β, which isrepresented by a sloped molecular step in the Figure. The increased mobility of water molecules also results in apartial solvation of impurity molecules, which increases their binding to the surface, thus increasing ρsurf . Theimpurity molecules exhibit increased mobility on the partially melted ice surface, and they bind more readily to stepsthan to the molecularly flat faceted regions. When an ice island forms via 2D nucleation and grows in extent, themoving step pushes impurity molecules along so they build up at the step edge, where they block subsequent growth.As a result, α is strongly reduced.
October 3, 2008 Page 9
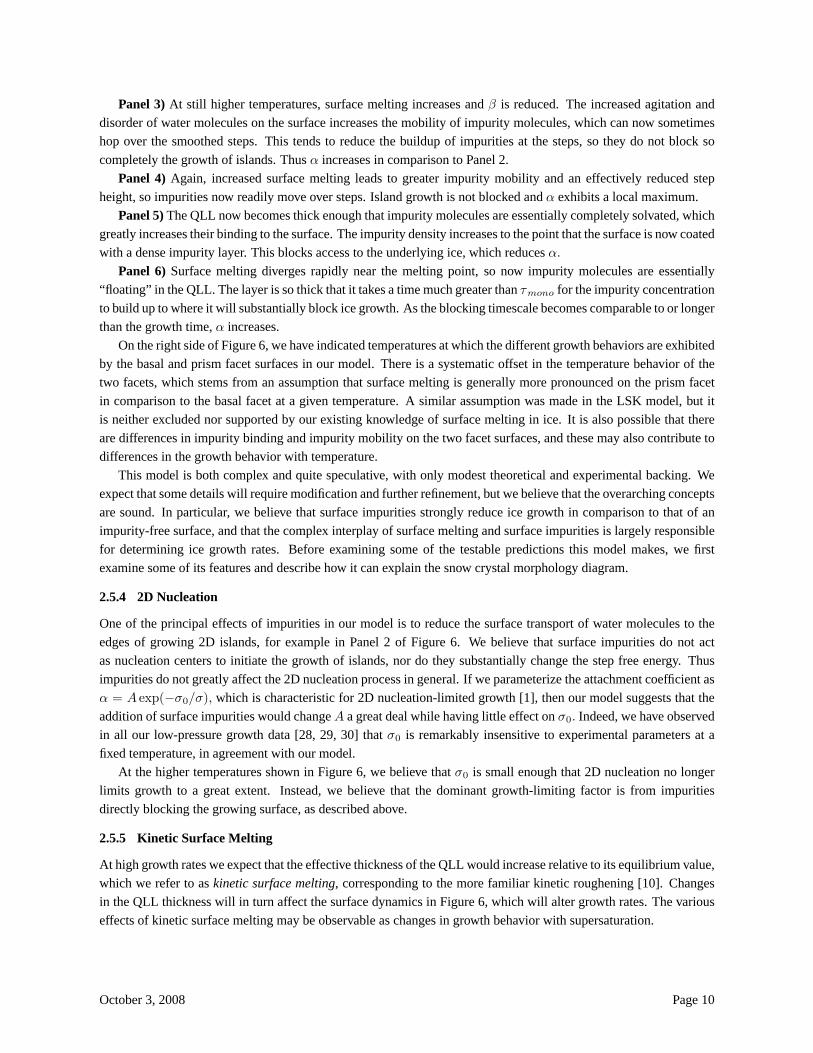
Panel 3) At still higher temperatures, surface melting increases and β is reduced. The increased agitation anddisorder of water molecules on the surface increases the mobility of impurity molecules, which can now sometimeshop over the smoothed steps. This tends to reduce the buildup of impurities at the steps, so they do not block socompletely the growth of islands. Thus α increases in comparison to Panel 2.
Panel 4) Again, increased surface melting leads to greater impurity mobility and an effectively reduced stepheight, so impurities now readily move over steps. Island growth is not blocked and α exhibits a local maximum.
Panel 5) The QLL now becomes thick enough that impurity molecules are essentially completely solvated, whichgreatly increases their binding to the surface. The impurity density increases to the point that the surface is now coatedwith a dense impurity layer. This blocks access to the underlying ice, which reduces α.
Panel 6) Surface melting diverges rapidly near the melting point, so now impurity molecules are essentially“floating” in the QLL. The layer is so thick that it takes a time much greater than τmono for the impurity concentrationto build up to where it will substantially block ice growth. As the blocking timescale becomes comparable to or longerthan the growth time, α increases.
On the right side of Figure 6, we have indicated temperatures at which the different growth behaviors are exhibitedby the basal and prism facet surfaces in our model. There is a systematic offset in the temperature behavior of thetwo facets, which stems from an assumption that surface melting is generally more pronounced on the prism facetin comparison to the basal facet at a given temperature. A similar assumption was made in the LSK model, but itis neither excluded nor supported by our existing knowledge of surface melting in ice. It is also possible that thereare differences in impurity binding and impurity mobility on the two facet surfaces, and these may also contribute todifferences in the growth behavior with temperature.
This model is both complex and quite speculative, with only modest theoretical and experimental backing. Weexpect that some details will require modification and further refinement, but we believe that the overarching conceptsare sound. In particular, we believe that surface impurities strongly reduce ice growth in comparison to that of animpurity-free surface, and that the complex interplay of surface melting and surface impurities is largely responsiblefor determining ice growth rates. Before examining some of the testable predictions this model makes, we firstexamine some of its features and describe how it can explain the snow crystal morphology diagram.
2.5.4 2D Nucleation
One of the principal effects of impurities in our model is to reduce the surface transport of water molecules to theedges of growing 2D islands, for example in Panel 2 of Figure 6. We believe that surface impurities do not actas nucleation centers to initiate the growth of islands, nor do they substantially change the step free energy. Thusimpurities do not greatly affect the 2D nucleation process in general. If we parameterize the attachment coefficient asα = A exp(−σ0/σ), which is characteristic for 2D nucleation-limited growth [1], then our model suggests that theaddition of surface impurities would change A a great deal while having little effect on σ0. Indeed, we have observedin all our low-pressure growth data [28, 29, 30] that σ0 is remarkably insensitive to experimental parameters at afixed temperature, in agreement with our model.
At the higher temperatures shown in Figure 6, we believe that σ0 is small enough that 2D nucleation no longerlimits growth to a great extent. Instead, we believe that the dominant growth-limiting factor is from impuritiesdirectly blocking the growing surface, as described above.
2.5.5 Kinetic Surface Melting
At high growth rates we expect that the effective thickness of the QLL would increase relative to its equilibrium value,which we refer to as kinetic surface melting, corresponding to the more familiar kinetic roughening [10]. Changesin the QLL thickness will in turn affect the surface dynamics in Figure 6, which will alter growth rates. The variouseffects of kinetic surface melting may be observable as changes in growth behavior with supersaturation.
October 3, 2008 Page 10
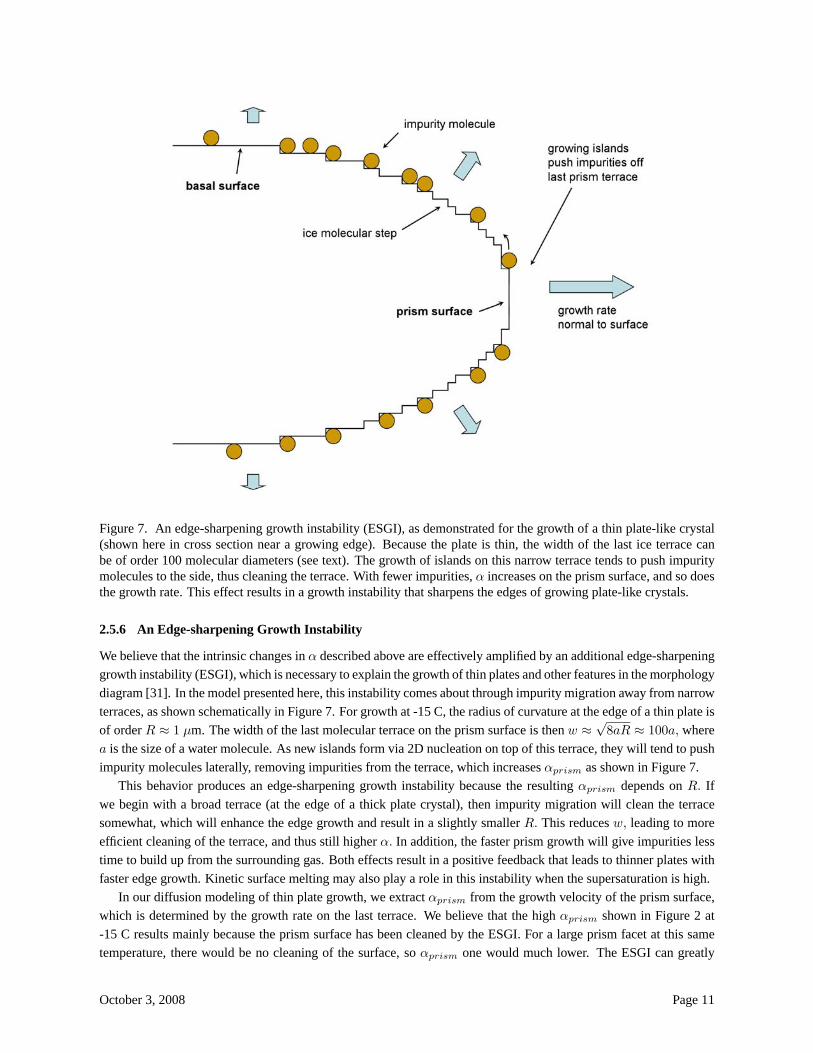
Figure 7. An edge-sharpening growth instability (ESGI), as demonstrated for the growth of a thin plate-like crystal(shown here in cross section near a growing edge). Because the plate is thin, the width of the last ice terrace canbe of order 100 molecular diameters (see text). The growth of islands on this narrow terrace tends to push impuritymolecules to the side, thus cleaning the terrace. With fewer impurities, α increases on the prism surface, and so doesthe growth rate. This effect results in a growth instability that sharpens the edges of growing plate-like crystals.
2.5.6 An Edge-sharpening Growth Instability
We believe that the intrinsic changes in α described above are effectively amplified by an additional edge-sharpeninggrowth instability (ESGI), which is necessary to explain the growth of thin plates and other features in the morphologydiagram [31]. In the model presented here, this instability comes about through impurity migration away from narrowterraces, as shown schematically in Figure 7. For growth at -15 C, the radius of curvature at the edge of a thin plate isof order R ≈ 1 μm. The width of the last molecular terrace on the prism surface is then w ≈
√8aR ≈ 100a, where
a is the size of a water molecule. As new islands form via 2D nucleation on top of this terrace, they will tend to pushimpurity molecules laterally, removing impurities from the terrace, which increases αprism as shown in Figure 7.
This behavior produces an edge-sharpening growth instability because the resulting αprism depends on R. Ifwe begin with a broad terrace (at the edge of a thick plate crystal), then impurity migration will clean the terracesomewhat, which will enhance the edge growth and result in a slightly smaller R. This reduces w, leading to moreefficient cleaning of the terrace, and thus still higher α. In addition, the faster prism growth will give impurities lesstime to build up from the surrounding gas. Both effects result in a positive feedback that leads to thinner plates withfaster edge growth. Kinetic surface melting may also play a role in this instability when the supersaturation is high.
In our diffusion modeling of thin plate growth, we extract αprism from the growth velocity of the prism surface,which is determined by the growth rate on the last terrace. We believe that the high αprism shown in Figure 2 at-15 C results mainly because the prism surface has been cleaned by the ESGI. For a large prism facet at this sametemperature, there would be no cleaning of the surface, so αprism one would much lower. The ESGI can greatly
October 3, 2008 Page 11
amplify small intrinsic differences in α between the two facets to produce the much larger differences seen in Figure2. As we pointed out earlier [31], this factor must be taken into consideration when comparing growth models forlarge, flat surfaces (Figure 6) with numbers extracted from the growth of plate-like or needle-like crystals (Figure2). Amplification via the ESGI is most substantial for the growth of thin plates (near -15 C and - 2 C) and slenderneedles and sheaths (near -5 C and below -30 C [32, 33]).
2.5.7 The Morphology Diagram
Having laid out the characteristics of our molecular growth model, we can now examine ice growth at different tem-peratures to explain the macroscopic characteristics of the snow crystal morphology diagram. We consider differenttemperature regions separately.
Near -15 C. At this temperature the growth of the basal facet in air is strongly suppressed (Panel 2 in Figure 6),giving αbasal ≈ 0.001when σsurface is a few percent. This must be a robust feature in any ice growth model, as thin,plate-like growth is a well-established feature of snow crystal growth in air (and other inert gases) at one bar. Forgrowth at low pressures, however, the impurity surface density is much lower, so αbasal is much higher, explainingthe data in Figure 4.
The intrinsic αprism for a large, flat surface is higher than αbasal in air at -15 C, but it is not a great deal higher(Panel 4). Because αbasal is so low, however, the edge-sharpening growth instability described above quickly takeseffect on the prism facet. The ESGI cleans the prism surface and greatly increases αprism relative to what it wouldbe on a large, flat surface, again explaining the αprism data in Figure 2 at -15 C.
At temperatures somewhat above or below -15 C, αbasal is higher than the value at -15 C (panels 1 and 3),yielding a local minimum in αbasal around -15 C, as seen in Figure 2. The ESGI is then less effective at cleaning theprism facet, which yields a local maximum in αprism near -15 C. Note that the growth of very thin plates in air, andthe large effective αprism values needed, results mainly from the removal of impurities from the prism facet by theESGI.
Near -5 C. At this temperature the growth of the prism surface is suppressed by strong binding in the QLL (Panel5), while the basal facet growth is substantially less suppressed (Panel 4), resulting in columnar growth. Undergrowth conditions with fairly low σ, the ESGI is not present, so columns grow with blunt ends. At sufficiently highσ, however, the ESGI can take effect on the basal facets, resulting in the growth of sheath-like crystals [32, 33].
Near -2 C. Here basal growth is suppressed by strong binding in the QLL (Panel 5), while the QLL is so thick onthe prism facet that its growth is increased relative to that at -5 C. Because αbasal is low, the ESGI can take effect toincrease αprism to the value shown in Figure 2 and produce thin, plate-like crystals. At still higher temperatures, thegrowth of both facet surfaces is at some intermediate value (Panel 6), so the ESGI is no longer present, resulting in amore isometric morphology.
Below -30 C. Our model is most uncertain at low temperatures, but we expect growth of the prism surface will besuppressed (Panel 2), leading to the growth of columnar crystals. The ESGI will then lead to the growth of sheath-likecrystals at high supersaturations, as observed [32, 33].
3 Discussion
We are enthusiastic about this new ice growth model for a number of reasons. First, it fairly naturally explainsmany previously puzzling features in our ice growth data, especially the substantial variation in the attachmentcoefficient with background gas pressure. Second, the model provides a viable explanation of the snow crystalmorphology diagram, which has baffled researchers for over 60 years. Third, the influence of low levels of impuritiesis likely responsible for some of the disparity seen in previous ice growth experiments [27]. Fourth, the model iseasily testable with additional growth experiments. And finally, the notion of impurities playing an essential rolein normal ice growth has been largely ignored to date, so our model opens up new avenues for exploring impurity-dependent growth behavior.
October 3, 2008 Page 12
Verifying all the microscope details outlined in Figure 6 will be an extremely difficult task, involving precisemeasurements of the characteristics of ice surface melting, impurity attachment kinetics, as well as impurity bindingand mobility, all as a function of temperature. In addition, we would need to understand how these surface char-acteristics affect the molecular dynamics of crystal growth if we wish to determine growth rates and morphologies.Direct molecular-scale imaging of the ice surface, such as with scanning probe microscopy, is of limited use becausethe molecular motions are extremely rapid and the equilibrium vapor pressure is high, making the ice surface too un-stable for most molecular-scale imaging techniques. Molecular dynamics simulations are also challenging for suchcomplex surfaces.
Fortunately, one can use crystal growth itself as a diagnostic tool for exploring the molecular dynamics of the icesurface. By making additional, relatively straightforward measurements of crystal growth rates and morphologies asa function of temperature, supersaturation, background gas pressure, gas constituents, and surface orientation relativeto the lattice, one should be able examine a great many characteristics of our model in considerable detail. Althoughour model is quite speculative at present, it provides a useful guide for additional experiments that will no doubt leadto modifications and additional refinements.
Some potentially interesting directions include:1) In extremely clean air (or other inert gases) at one bar, the growth rates should be very high because the ice
surface would be free from impurities. The ESGI would not be present, and the morphology diagram would lookvery different from Figure 1. This would provide a dramatic “smoking gun” verification of the most important featurein our model, namely that even low levels of impurities substantially reduce ice growth rates. Unfortunately, creatingan impurity-free gas is an experimental impossibility, and we cannot accurately estimate at present what impuritylevels are necessary to produce growth rates that approach that of a clean ice surface. It appears likely, however, thateven modest cleaning efforts will yield some measurable changes.
2) Even if one can only increase impurity levels relative to those found in ordinary laboratory air, measuringgrowth rates as a function of impurity density should provide many valuable insights into our model. High impu-rity levels would change many of the details in Figure 6 and would significantly alter the behavior of the ESGI.Experiments of this nature have not yet been done, but many should be quite straightforward.
3) We have little knowledge at present about which impurities have the greatest effect on ice growth, and whichare most important under normal atmospheric conditions. Exploring the chemistry of impurity-mediated ice crystalgrowth should shed considerable light on the microscopic mechanisms involved.
Although snow crystal growth is a seemingly simple process, a closer look reveals that the underlying physicsand chemistry are remarkably subtle and interesting. The observed morphological diversity of snow crystals resultsfrom a complex interplay of molecular dynamical processes occurring at the ice surface. There is much yet to belearned by investigating this fascinating phenomenon.
4 References
[1] K. G. Libbrecht, "The physics of snow crystals," Rep. Prog. Phys. 68, 855-895 (2005).[2] U. Nakaya, “Snow crystals: natural and artificial,” (Cambridge: Harvard University Press) (1954), and refer-
ences therein.[3] B. J. Mason, Adv. Phys. 7, 235 (1958).[4] B. J. Mason, “Snow crystals, natural and man made,” Contemp. Phys. 33, 227-243 (1992).[5] J. Nelson and C. Knight, “Snow crystal habit changes explained by layer nucleation,” J. Atmos. Sci. 55, 1452-
1465 (1998).[6] J. Nelson, “Growth mechanisms to explain the primary and secondary habits of snow crystals,” Phil. Mag. A
81, 2337-2373 (2001).[7] R. Lacmann and I. N. Stranski, “The growth of snow crystals,” J. Cryst. Growth 13/14, 236–40 (1972).[8] T. Kuroda and R. Lacmann, “Growth kinetics of ice from the vapour phase and its growth forms,” J. Cryst.
October 3, 2008 Page 13
Growth 56, 189–205 (1982).[9] T. Kobayashi and T. Kuroda, “Snow crystals Morphology of Crystals–Part B,” (ed: I Sunagawa) (Tokyo: Terra
Scientific), pp 645–743 (1987).[10] Y. Saito, “Statistical physics of crystal growth,” (Singapore: World Scientific) (1996).[11] J. Gravner and D. Griffeath, “Modeling snow crystal growth II: A mesoscopic lattice map with plausible dy-
namics,” Physica D 237, 385-404 (2008).[12] K. G. Libbrecht, “Physically derived rules for simulating faceted crystal growth using cellular automata,” paper
0807.2616v1 in the arXiv.org e-Print archive (2008).[13] J. G. Dash, “Surface melting,” Contemp. Phys. 30, 89-100 (1989).[14] K. G. Libbrecht, H. C. Morrison, and B. Faber, in preparation (2008).[15] V. F. Petrenko and R. W. Whitworth, “Physics of Ice,” (Oxford University Press) (1999).[16] J. G. Dash, H. Fu, and J. S. Wettlaufer, “The premelting of ice and its environmental consequences,” Rep. Prog.
Phys. 58, 115–67 (1995).[17] F. A. Lindemann, Z. Phys. 11, 609 (1910).[18] G. Grimvall and S. Sjodin, “Correlation of properties of materials to Debye and melting temperatures,” Phys.
Scr. 10, 340–52 (1974).[19] C. J. Martin and D. A. O’Connor, “An experimental test of Lindemann’s melting law,” J. Phys. C: Solid State
Phys. 10, 3521–6 (1977).[20] M. Schmidt et al, “Experimental determination of the melting point and heat capacity for a free cluster of 139
sodium atoms,” Phys. Rev. Lett. 79, 99–102 (1997).[21] H. Dosch, A. Lied, and J. H. Bilgram, “Glancing-angle x-ray scattering studies of the premelting of ice sur-
faces,” Surf. Sci. 327, 145–64 (1995).[22] X. Wei X et al, “Sum-frequency spectroscopic studies of ice interfaces,” Phys. Rev. B 66, 085401 (2002).[23] K. Bolton and J. B. C. Pettersson, “A molecular dynamics study of the long-time ice Ih surface dynamics,” J.
Phys. Chem. B, 104 1590–5 (2000).[24] Y. Furukawa and H. Nada, “Anisotropic surface melting of an ice crystal and its relationship to growth forms,”
J. Phys. Chem. B, 101 6167–70 (1997).[25] G.-J. Kroes, “Surface melting of the (0001) face of tip4p ice,” Surf. Sci. 275, 365–82 (1992).[26] M. Bienfait, “Roughening and surface melting transitions: consequences on crystal growth,” Surf. Sci. 272, 1-9
(1992).[27] K. G. Libbrecht, “A critical look at ice crystal growth data,” paper cond-mat/0411662 in the arXiv.org e-Print
archive (2004).[28] K. G. Libbrecht, “Growth rates of the principal facets of ice between -10C and -40C,” J. Cryst. Growth 247,
530 (2003).[29] K. G. Libbrecht, “Precision measurements of ice crystal growth rates,” paper cond-mat/0608694 in the arXiv.org
e-Print archive (2006).[30] K. G. Libbrecht, “Observations of an impurity-driven hysteresis behavior in ice crystal growth at low pressure,”
paper cond-mat/0809.486v1 in the arXiv.org e-Print archive (2008).[31] K. G. Libbrecht, “Explaining the formation of thin ice-crystal plates with structure-dependent attachment ki-
netics,” J. Cryst. Growth 258, 168 (2003).[32] K. G. Libbrecht, “Ken Libbrecht’s Field Guide to Snowflakes,” (St. Paul: Voyageur Press) (2006).[33] M. Bailey and J. Hallett, “Growth rates and habits of ice crystals between -20 C and -70 C,” J. Atmos. Sci. 61,
514-544 (2004).
October 3, 2008 Page 14